

Have you ever been to a music concert where an opening band that you’ve never heard of before totally blew you away?
You came away thinking this group is infinitesimally better than the “main act” you paid decent money to go see as the headliner.
That happened to me on more than one occasion when I used to go to concerts during my university days.
Part of the appeal was that the newly discovered band was of course great but equally important was the process of finding something underrated.
These days, I spend an inordinate amount of time trying to discover “diamonds in the rough” in the ETF marketplace where vanilla funds rule the roost.
It’s fascinating to unearth an ETF that provides a unique strategy that is not being offered by the Goliath ETF providers such as the Vanguards and iShares.
More often than not, I’ve found the most creative ETFs are being offered by boutique firms who have put serious consideration into launching products that don’t currently exist in the marketplace.
It takes considerable effort as a DIY investor or curious advisor to educate yourself on a myriad of different investing topics to even get to the point where you have the awareness and wherewithal to seek them out.
I’ve typically found these “hidden gems” have a few distinct characteristics in general.

What Makes Certain ETFs Underrated Compared To Others?
- Tend to be from boutique firms or smaller providers than the Vanguards and iShares of the world.
- Often involve strategies that extend well beyond market-cap weighted equities and aggregate bonds meaning they appeal to a more sophisticated and self-educated crowd.
- They’re often newer releases or have gone under the radar for several years because of the strategy spending time in the “shade” as opposed to the spotlight.

For instance, some of my favourite new ETFs that I feel are most underrated have just been released this year.
Others have been toiling for several years, offering a fantastic research supported strategy that works great in the long-run, but have had a challenging sequence of returns that hasn’t allowed the strategy to “yet thrive” or have its moment in the sun.
As investors we’ll accept a “lost decade” for a mainstream strategy such as the S&P 500 in the 2000s but we’re quick to bail from more esoteric ones such as managed futures when they had a challenging 2010s.
As investors we can take advantage of the “general impatience” of the herd by being aware that every single investing strategy goes through periods of underperformance.
At the end of the day we’re promised a “strategy” and not returns; that requires patience, time and discipline.
With all of this in mind let’s examine 10 underrated ETFs that I think are great potential additions to portfolios for savvy investors and in-the-know advisors.
About the Author & Disclosure
Picture Perfect Portfolios is the quantitative research arm of Samuel Jeffery, co-founder of the Samuel & Audrey Media Network. With over 15 years of global business experience and two World Travel Awards (Europe’s Leading Marketing Campaign 2017 & 2018), Samuel brings a unique global macro perspective to asset allocation.
Note: This content is strictly for educational purposes and reflects personal opinions, not professional financial advice. All strategies discussed involve risk; please consult a qualified advisor before investing.

These asset allocation ideas and model portfolios presented herein are purely for entertainment purposes only. This is NOT investment advice. These models are hypothetical and are intended to provide general information about potential ways to organize a portfolio based on theoretical scenarios and assumptions. They do not take into account the investment objectives, financial situation/goals, risk tolerance and/or specific needs of any particular individual.
Top 10 Underrated ETFs: Under The Radar Funds For Investors That Are Totally Awesome!
The criteria for inclusion for these 10 underrated ETFs is that they must be under 100 Million assets under management.
You won’t find any scoops of vanilla here as I’m specifically trying to highlight unique strategies that extend well beyond market cap weighted equities and aggregate bonds.
Furthermore, I’ll attempt to select a diverse enough group of ETFs that could potentially offer a total portfolio solution.
Without further ado let’s check out the top 10 ETFs under 100 Million AUM in no particular order!

Cambria Global Asset Allocation ETF GAA
When it comes to 100% canvas static asset allocation funds I can’t think of too many that can compete with Meb Faber’s GAA ETF.
As a super fund of funds, Cambria Global Asset Allocation ETF brings so much to the table in terms of diversification and thoughtful asset allocation.
It differentiates itself from the pack of other asset allocation funds by OFFERING investors global multi-factor equity exposure, diversified bonds and alternatives while AVOIDING home country bias and expensive high P/E market cap weighted stocks.
GAA ETF Investment Methodology

You’ll notice that the fund is truly “global in nature” with a balance between US Equity and Non-US Equity, diversified bonds and a “significant alternative sleeve” to round things out.
GAA ETF Stock Style and Asset Allocation

GAA ETF separates itself from the pack of insipid asset allocation funds by providing a “sweet mid-cap bullseye” with significant exposure to small-cap unlike typical large-cap centric funds.
GAA ETF Factor Exposure
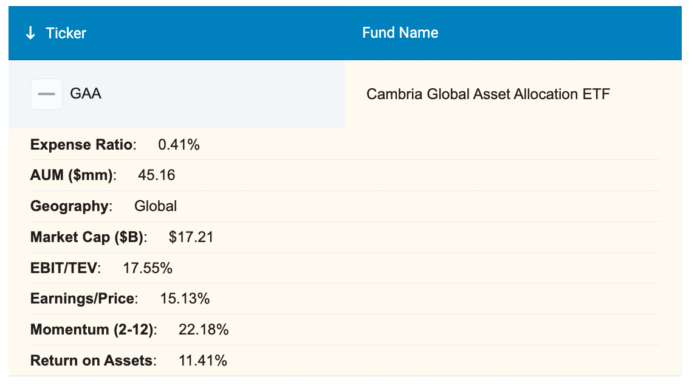
Finally, we’ll consult with the indispensable Alpha Architect fund screener where we discover across the board impressive factor exposure for Cambria Global Asset Allocation ETF.
EBIT/TEV: 17.55%
Earnings/Price: 15.13%
Momentum (2-12): 22.18%
Return on Assets: 11.41%
When I did a comprehensive review of Cambria Global Asset Allocation ETF GAA I identified seven distinct strengths:
- Globally diversified portfolio that clearly avoids “home country bias” with slightly more exposure to International Developed and Emerging Markets than US Markets
- 29 in 1 fund without any management fee and only the underlying costs of the funds coming in at a very reasonable 0.41 Expense Ratio
- Deep Multi-Factor exposure to research supported factors including value, yield, momentum, size (small) and quality
- An alternative sleeve consisting of REITs, diversified commodities, long-short equities and gold that are often lacking in all-in-one funds
- Sector exposure tilting away from typically high P/E Information Technology and Healthcare and more towards low P/E Basic Materials and Energy
- Single digit P/E of 6.26 versus the category average of 14.56 offers value versus blend/growth exposure
- Fixed income sleeve committed to diversifying globally to US, International Developed and Emerging markets bonds with government, corporate and high yield exposure
Ticker: GAA
AUM: 41,658,923
As a potential “one-click” and done total portfolio solution GAA ETF is criminally underrated with only 41.6 Million AUM.
If you’re a buy and hold investor seeking a globally diversified portfolio that avoids market-cap weighted equities it definitely should be on your radar.

Simplify Macro Strategy ETF FIG
The most exciting fund debut of 2022 belongs to Simplify Macro Strategy ETF FIG.
No other asset allocation fund brings a stronger multi-strategy approach combined with tremendous capital efficiency in a manner that can compete with FIG ETF.
It’s simply a masterpiece in terms of diversification where the science and art of portfolio construction combine to create a super fund of funds.
I did a thorough review of Simplify Macro Strategy ETF FIG that unpacks every nitty gritty detail.
We’ll kick things off by highlighting how FIG ETF utilizes efficient capital to gain exposure to US equities, treasuries and gold.
With merely 25% of the funds resources it is getting approximate exposure to the following:
- 60% US equities exposure via an in-the-money call option on SPY = 12% allocation
- 27% Intermediate US Treasury via Simplify Risk Parity ETF TYA = 8.89% allocation
- 4.72% Gold via iShares Gold Trust = 4.72% allocation
- Put option as form of portfolio insurance = 1-2% allocation
This in and of itself could be a fund that rivals other asset allocation funds.
FIG ETF Portfolio Holdings

In total I’m counting no less than 10 distinct strategies under the hood of FIG ETF.
FIG ETF Multi-Strategy Exposure
- US equity exposure via in-the-money call options via FIG ETF directly
- Intermediate Treasury exposure via TYA ETF
- Gold exposure via IAU ETF
- Managed Futures multi-strategy (price trend, mean reversion, carry, and risk-off) long/short commodities and rates via CTA ETF
- US High Yield Corporate Bonds via HYG ETF via CDX ETF
- Long-Short Equity Quality minus Junk (custom Simplify indexes) via CDX ETF
- Selling volatility inverse VIX at -0.2X to -0.3X via SVOL ETF
- (OTC) Interest Rate Options via PFIX ETF
- S&P Put Options via FIG ETF directly and CDX ETF
- UVXY Call Option via SVOL
FIG Pros: Simplify Macro Strategy ETF
- 10+ strategies in 1 asset allocation that sets itself MILES apart from other vanilla all-in-one funds
- Capital efficient usage of leverage to expand the canvas of the portfolio to offer a number of different strategies without shaving down exposure to typical equity/bond allocations
- Non-traditional defensive strategies of managed futures and put that are often gaping holes in most retail investors portfolios
- Exposure to “diversified diversifiers” such as selling volatility, call options and OTC rates that are typically only available to high net worth individuals and institutions
- Equity factor exposure to quality minus junk to capture both sides of premium
- High yield corporate bond exposure that is often missing in most fixed income sleeves
- Exposure to Gold which in many regards is the original gangster alternative
- Absolute bargain all in encompassing management fee of 0.75 given that most fund of funds strategies are way over 100 basis points
- Attractive monthly yield of 3.33% for investors seeking income
- Chance to support one of the most creative boutique ETF providers in the business
Ticker: FIG
AUM: 22,568,188
No other fund that I’m aware of brings more to the picnic from a multi-strategy point of view than FIG ETF.
And since it’s only a few months old it has 22.5 Million AUM affording you the opportunity to be an early supporter of what I believe is one of the best asset allocation funds ever created.

Ultra Risk Parity ETF UPAR
No fund that makes the top 10 underrated ETFs list has been punched harder in the face this year than Ultra Risk Parity ETF UPAR.
Yet, I believe it’s one of the most sophisticated capital efficient long-only asset allocations funds in the marketplace.
Let’s address the elephant in the room.
Why has UPAR struggled so mightily this year?
It’s been an historically challenging year for long-only equity, bond and gold investors with all of the aforementioned asset classes being down at the same time.
Over the past 50 years how often has this occurred where all three have been down at the same time?
Only this year.
2022.
Its greatest feature to drive excess long-term returns when markets aren’t in turmoil is leverage but that creates a double-edged sword when things aren’t conspiring in its favour.
Patient investors realize that portfolios constructed using the Risk Parity Portfolio, the Harry Browne Permanent Portfolio and the Ray Dalio All Weather Portfolio have a far more impressive and palatable sequence of returns compared to the 60/40.
This may be the worst case scenario UPAR ETF ever encounters and if you’re adding positions right now you’ve already sidestepped the carnage.

UPAR ETF moves beyond the paradigm of merely stocks and bonds by instead allocating based on historical levels of risk (standard deviation).
TIPS and Treasuries receive 49% allocations each based on the fact they’re not as volatile as stocks.
Whereas Global Equities along with Commodity Producing Equities and Gold take up 35% slots each.
Overall, this creates a 168% expanded canvas portfolio offering global diversification and an alternative sleeve.

Its simulated backtest highlights that UPAR absolutely crushes global equities with 13.0% returns since inception versus 6.6%.
Moreover, it does so with less volatility (featuring 14.0% versus 15.5%) while also offering a smoother sequence of returns ride.

UPAR PROS: Expanded Canvas Asset Allocation Fund
- An all-weather portfolio risk parity solution that offers inflationary protection for stagflationary environments
- Portfolio that is broken down equally by risk (standard deviation) so higher allocations to bonds/tips and lower to stocks/commodities
- Diversification into asset classes that break the shackles of merely stocks plus bonds
- Tax efficient and cost efficient potential total portfolio solution that involves no rebalancing as a DIY investor
- Exposure to alternative asset classes that aren’t typically part of portfolios (TIPS + GOLD + COMMODITIES)
- Enough leverage 1.68% that even with a conservative allocation to equities (39%) = chance to outperform 100% stock funds
- Opportunity to combine this strategy of risk-parity with other strategies in your portfolio (60/40) or trend following creating a multi-strategy solution
Ticker: UPAR
AUM: $42,340,000
UPAR ETF was launched earlier this year and despite its challenges has managed to accumulate 42 Million AUM.
For capital efficient expanded canvas investors seeking a long-only asset allocation building block, UPAR seems like a no-brainer addition to your portfolio.

iMGP DBi Hedge Strategy ETF DBEH
It’s crazy to think how popular DBMF ETF has become in contrast to its sibling fund DBEH ETF.
Both funds offer unique strategies in the ETF marketplace but one has had relative otherworldly results in 2022 and the other remains super underrated:
DBEH seeks to replicate the pre-fee returns of forty leading equity long/short hedge funds to deliver equity-like returns over time with less risk.

I wanted to first highlight the annual returns of DBMF ETF and DBEH ETF as individual line items to showcase that it hasn’t been iMGP DBi Managed Futures Strategy pulling all of the weight.
If you rewind back to 2020 it was DBEH that picked up the tab with a return of 23.42%.
Let’s look at the bigger picture.

If returns meets risk management is your primary investing goal, the results of a DBEH 60% / DBMF 40% portfolio since 2020 are most impressive with a CAGR of 11.10% and RISK of 8.83%.
Poor ‘ole 60/40 hobbles across the finish line below water with a CAGR of -0.67% and RISK of 13.34%.
That’s a lot of volatility for one to endure for such awful results.
Noteworthy is that the combined DBEH 60% / DBMF 40% has double digit returns with only single digit standard deviation.
Ticker: DBEH
AUM: $16,222,402
Equity hedge fund strategies often provide higher risk adjusted rates of returns while offering a higher SHARPE/SORTINO.
This particular strategy endured a rough 2010s but crushed market cap weighted indexes in the 90s and 2000s.
If you are of the belief that the pendulum swings back and forth in and out of favour it’s a prime time to add this to your portfolio.

Alpha Architect Value Momentum Trend ETF VMOT
I’m a big fan of the research supported quantitative value and momentum strategies Alpha Architect has assembled for both US and International Developed markets.
For investors seeking to combine them all together as a dynamic ensemble with the additional benefit of offering “trend” based hedges it’s worth considering Value Momentum Trend ETF VMOT.

Here you’ll notice that VMOT ETF is a fund of funds bringing you US and International Developed Value (QVAL + IVAL) and Momentum (QMOM + IMOM) strategies with a trend strategy that’ll short US and International Developed markets.

With a quantitative rules based approach hedges are triggered only when trend following “time series” and/or “moving average” signals indicate a partial or full hedge.
Otherwise, there is no hedge and the fund is 100% long exposure.
Given the turbulent market conditions of 2022, VMOT with its ability to adaptively “hedge” has thrived versus long market cap weighted only strategies.

One of the most underrated investing skills is being able to celebrate “losing less” when strategies you’re pursuing triumph over vanilla products.
Given that the 2010s favoured US large-cap equities, growth and meme-style technology investing, I’m convinced a new economic regime has emerged where funds that pursue value, momentum and trend strategies will thrive this decade.
Ticker: VMOT
AUM: $43,440,000
I firmly believe a strategy like VMOT can enhance a portfolio by providing research supported allocations to value and momentum while hedging downside risk with its trend component.
Furthermore, by having the capacity to go both long/short ensures it’ll provide an overall portfolio diversification benefit with less correlation to market beta.

Cambria Emerging Shareholder Yield ETF EYLD
Emerging Markets are often ignored and shunned whenever they’ve trailed US and/or International Developed equities for an extended period of time.
This of course presents a tremendous opportunity to hop on board before the pendulum inevitably swings back in their favour.
When it comes to selecting an Emerging Markets fund that provides hard-lever multi-factor exposure to low P/E securities, you’ll likely find Cambria Emerging Shareholder Yield ETF EYLD makes your shortlist.
EYLD ETF keys in on stocks with high cash distribution characteristics, dividend payments and net stock buybacks with further screens for value and quality.
When I’ve compared Cambria Emerging Shareholder Yield versus other Emerging Markets ETFs I’ve found it offers more robust multi-factor concentration, small and mid-cap exposure and geographical and sector diversification versus market cap weighted EM indexes.

Cambria Emerging Markets Shareholder Yield ETF has a significant value tilt and covers all of the bases with large, medium and small cap exposure.
It’s rare to find EM ETFs that offer anywhere this level of a mid-cap and small-cap exposure.
It truly sets the fund apart from the crowd.

The hard-lever pulls for factor exposure to value, yield, momentum, quality and size make EYLD ETF a true multi-factor fund.
Often you compromise one exposure for another but considering how underrated Emerging Markets are these days you’re able to compose a fund that covers all of the bases.

I remember the days when having a P/E under 10 constituted a value fund but these days you can find EM ETFs with single digit P/E of 4.61, P/B of 0.99, P/S of 0.47 and a dividend yield of 12.76!!!
No, you didn’t misread that.
EYLD offers a current divided yield of 12.76.

Cambria Emerging Markets Shareholder Yield offers outsized exposure to countries such as Turkey, South Africa and Taiwan.
Emerging Markets encompass a plethora of countries versus other regional indexes, so having outsized exposure to certain countries muted by market cap weighted indexes is a plus in my opinion.

In terms of sector exposure EYLD ETF provides boosted coverage to Energy, Industrials and Basic Materials.
Ticker: EYLD
AUM: $95,162,378
When I think of funds that could absolutely rip over the coming decade few offer greater potential than EYLD ETF.
It just seems primed to blow-up (in a good way) and for investors patient enough to have endured relative underperformance by going global I think are about to be rewarded handsomely.

Simplify Risk Parity Treasury ETF TYA
Let’s shine the spotlight upon the most capital efficient ETF included in this list of underrated funds.
Simplify Risk Parity Treasury ETF TYA currently offers 3X+ exposure to the 10-Year Treasury via efficient futures contracts.
It’s easy to punch down on fixed income after a lacklustre 2021 and abysmal 2022.
However, when strategies become this out of favour good results likely follow in subsequent years.
The fund attempts to target the duration of the ICE 20+ Year US Treasury Index keying in specifically on the intermediate portion of the curve.

The primary reason to hold a fund such as TYA ETF is to create additional space in your expanded canvas portfolio.
If you allocate 10% to the strategy you’re gaining notional exposure to 30% of the 10-Year Treasury.
Hence, you may (or may not) be done with your fixed income sleeve with 90% space available to pursue other strategies.
This in and of itself makes this ETF worthy of consideration.
source: simplify asset management on youtube
Ticker: TYA
AUM: $38,185,794
If you’re not a huge fan of bonds (like me) a fund like TYA gets your fixed income allocation over and done with rather quickly.

WisdomTree Efficient Gold Plus Equity Strategy ETF GDE
You’ll be hard pressed to find a more efficient dynamic duo than leveraged US Large Cap equities and Gold throughout the decades.
While doing research for an article entitled “The Magic Of Combining Leveraged Stocks And Gold In Your Portfolio” I was blown away by the results for a 90/90 expanded canvas of US Large Cap Equities and Gold.
No lost decades.
In fact, no decades with anything less than double digit CAGR.
Here are the results:
CAGR: 90/90 vs US Large Cap
70s: 43.16% vs 4.55%
80s: 12.35% vs 17.05%
90s: 13.95% vs 18.07%
2000s: 11.65% vs -1.03%
2010s: 15.19% vs 13.40%
2020s: 15.28% vs 11.60% *(results up until July 2022)
If you pay particular attention to the 70s and 2000s you’ll notice Gold saved what otherwise would have been totally lost decades for US Large Cap equities.
On the other hand, the 90/90 combination was a bit of a drag in the 80s and 90s when Gold struggled mightily.
However, the 90/90 duo has outperformed across the board US Large Cap Equity only allocations.
Fortunately, for savvy investors there is now a product where you can obtain access to the 90/90 combo.
WisdomTree Efficient Gold Plus Equity Strategy Fund (GDE ETF).
The fund gains its capital efficiency by getting exposure to Gold utilizing futures contracts while allocating its remaining resources to US Equities.

Above are the results of the 90/90 Gold/SPX combination vs the S&P 500 vs Gold from November 1999 until March 2022.
Combining uncorrelated asset classes and strategies is truly magic!
GDE PROS FOR INVESTORS
- Impressive double digit CAGR throughout every decade I back-tested. In fact, no lost decades and particularly good performance in 70s and 2000s when US equities struggled
- 90/90 exposure is definitely an alpha strategy that should add overall returns to the portfolio in a significant manner
- Tax Efficient and Low Cost
- Brings an alternative asset class (gold) into 60/40 portfolios that are lacking alternatives
- Is a great diversifier for expanded canvas portfolios that are already heavy in bonds
Ticker: GDE
AUM: $2,918,120
GDE is woefully underrated with only 2.9 Million AUM committed to the strategy.
I’m hopeful more investors eventually wake-up to the long-term potential of a 90/90 Gold/US Equities combination for the fund to get the resources it needs to stabilize.

Leatherback Long/Short Alternative Yield ETF LBAY
Few alternative ETFs have had a more impressive debut from an out-of-the-gate performance perspective than The Leatherback Long/Short Alternative Yield ETF LBAY.
With a quantitative strategy designed to capture both “long” and “short” sides of the coin, it selects securities with favourable shareholder yield characteristics to go long while shorting stocks that are unattractive and could potentially decline in price.
Additionally, the fund employs an option-writing overlay strategy to generate additional income.
This type of absolute return equity strategy seeks positive returns during all economic environments.
Let’s check out the results of the fund so far:

When compared directly with the S&P 500, LBAY has absolutely crushed the class market-cap weighted index by adapting to challenging market conditions in 2022.
While the S&P 500 has been down -17.75% LBAY has been up +16.12%.
Furthermore, it’s proved to be less correlated to market returns (0.53) providing an overall portfolio diversification benefit in the alternative sleeve.

The fund targets a long-term NET 75-110% exposure and currently is NET 89.58% (long: 118.11% / short: -28.53%).
Ticker: LBAY
AUM: $58,200,000
Investors have the opportunity to gain access to a strategy that can potentially drive positive returns in all economic environments whilst improving the overall diversification of your portfolio.
![]()
Unlimited HFND Multi-Strategy Return Tracker ETF HFND
I’m going out on a limb by recommending HFND ETF given that it was just released in recent weeks.
However, it is an intriguing enough addition to the ETF marketplace that it warrants initial consideration and attention.
The fund seeks to bring multi-asset class hedge fund strategies to retail investors without the exorbitant fees typical of the industry at large.
The fund attempts to best match the returns of each major hedge fund style including but not limited to long/short equity, global macro, event-driven, fixed income, arbitrage, managed futures and emerging markets.
The fund will position itself long/short across 30 to 50 underlying ETFs and futures contracts adapting to hedge fund signals and performance.
Here are its current top positions:

Ticker: HFND
AUM: $3,050,000
It’ll be interesting to track the performance of Unlimited HFND Multi-Strategy Return Tracker ETF over the coming weeks, months and years.
The fund explicitly seeks “equity market level returns with lower volatility” with less correlation.

Total Portfolio Solution: Top 10 Underrated ETFs
20% FIG
20% UPAR
15% GAA
10% GDE
10% TYA
5% LBAY
5% VMOT
5% DBEH
5% HFND
5% EYLD
If I was going to build a portfolio featuring the Top 10 Underrated ETFs I’d be thrilled with the allocation above.
The backbone of the strategy would be covered by asset allocation funds such as capital efficient FIG and UPAR at 20% each along with quant GAA taking up 15%.
We further expand the canvas of our portfolio with TYA rounding out our fixed income strategy and GDE efficiently boosting our overall notional exposure to gold.
We then have an ensemble of long-short equity funds LBAY, VMOT and DBEH further enhancing our alternative sleeve of the portfolio.
HFND is a bit more of a long-short wildcard whereas EYLD offers an Emerging Markets multi-factor powerhouse to round things out.
We’ve overall got a multi-strategy expanded canvas portfolio with significant exposure to alternative asset classes along with research supported factor strategies.
I think this beats the tar out of the typical milquetoast 60/40 portfolio by a country mile when it comes to overall diversification.
And we’ve used underrated ETFs with AUM under 100 Million to put it all together.
Overall, I like what I see.
Top 10 Underrated ETFs for Investors: Frequently Asked Questions
What does it mean for an ETF to be “underrated”?
An ETF is considered underrated when it offers a compelling or innovative strategy but remains under the radar of most investors and advisors. These funds typically have low AUM (often under $100 million), are issued by boutique firms, and provide exposure that differs from mainstream market-cap weighted equity or aggregate bond ETFs.
Why should investors consider underrated ETFs in their portfolios?
Underrated ETFs can offer diversification benefits, access to niche strategies, or enhanced factor exposures that mainstream funds often lack. Because they’re overlooked, investors willing to do the research may benefit from strong long-term performance before broader market adoption drives inflows.
Are smaller AUM ETFs riskier than large, established funds?
While lower AUM doesn’t necessarily mean higher investment risk, smaller funds can face liquidity challenges, wider bid-ask spreads, or potential closures if they fail to attract assets. However, many underrated ETFs are run by sophisticated issuers with robust strategies and transparent methodologies.
How can boutique ETF issuers compete with giants like Vanguard and iShares?
Boutique issuers typically focus on innovation rather than scale. They often launch specialized products that target factors, alternative strategies, or global exposures underserved by large issuers. Their agility allows them to create funds with unique risk-return profiles.
What role can capital efficient ETFs play in a diversified portfolio?
Capital efficient ETFs use leverage, derivatives, or futures to provide more exposure per dollar invested. This allows investors to “expand the canvas” of their portfolios—combining multiple strategies (e.g., equities, bonds, gold, managed futures) without diluting allocations to core holdings.
How can underrated ETFs help hedge against different economic environments?
Many underrated ETFs include exposure to alternatives like managed futures, gold, or risk parity allocations. These strategies can provide protection during inflationary periods, equity drawdowns, or stagflationary environments where traditional 60/40 portfolios may struggle.
What are some examples of unique strategies offered by underrated ETFs?
The list includes funds like GAA for global multi-factor exposure, FIG for multi-strategy capital efficiency, UPAR for leveraged risk parity, DBEH for hedge fund replication, VMOT for value-momentum-trend combinations, and GDE for the innovative 90/90 gold + equities blend.
Do underrated ETFs tend to outperform mainstream strategies?
Not always in the short term. Many underrated ETFs experience periods of underperformance while their strategy is “out of favor.” However, over full market cycles, well-constructed factor, alternative, or capital efficient ETFs often deliver superior risk-adjusted returns compared to vanilla market-cap weighted benchmarks.
How should investors evaluate underrated ETFs before investing?
Investors should review the fund’s strategy, issuer reputation, factor exposures, fees, liquidity, and how it fits within their broader portfolio objectives. Backtested results can be useful, but real-world performance, methodology transparency, and personal risk tolerance are key considerations.
Are there any tax considerations when using capital efficient or alternative ETFs?
Yes. Some ETFs using futures or derivatives may issue K-1 tax forms or have unique tax treatments. Investors should review the prospectus and consult tax professionals to ensure they understand reporting obligations and implications for their individual situations.
Can underrated ETFs be used as core holdings or only as satellites?
It depends on the ETF. Some, like GAA or UPAR, can serve as core “one-click” portfolio solutions. Others, like LBAY, VMOT, or HFND, might be better suited as satellite allocations to enhance diversification, factor exposure, or alternative sleeves.
What’s the long-term opportunity with underrated ETFs?
Many of these funds represent strategies that institutions have used for decades. As more retail investors and advisors discover their potential, AUM can grow rapidly, and early adopters may benefit from both strategy performance and improved liquidity as the funds scale.

Nomadic Samuel Final Thoughts
I hope this post highlights that some of the best ETFs available in the marketplace are ones that don’t receive enough of the spotlight.
As investors, we have a competitive advantage by taking the time to learn more about products that fly under the radar.
Earlier this year Managed Futures ETFs were amongst the most underrated funds after having a challenging 2010s.
Yet managed futures ETFs such as KMLM, CTA and DBMF are now the darlings of alternative strategies with record AUM flows.
I’m of the opinion that some of the Top 10 Underrated ETFs featured in this article have the potential to explode in popularity at some point.
But only time will tell.

What do you think of the underrated ETFs featured in this article?
Are any of them on your radar?
Please let me know in the comments below.
That’s all I’ve got.
Ciao for now.
Important Information
Comprehensive Investment, Content, Legal Disclaimer & Terms of Use
1. Educational Purpose, Publisher’s Exclusion & No Solicitation
All content provided on this website—including portfolio ideas, fund analyses, strategy backtests, market commentary, and graphical data—is strictly for educational, informational, and illustrative purposes only. The information does not constitute financial, investment, tax, accounting, or legal advice. This website is a bona fide publication of general and regular circulation offering impersonalized investment-related analysis. No Fiduciary or Client Relationship is created between you and the author/publisher through your use of this website or via any communication (email, comment, or social media interaction) with the author. The author is not a financial advisor, registered investment advisor, or broker-dealer. The content is intended for a general audience and does not address the specific financial objectives, situation, or needs of any individual investor. NO SOLICITATION: Nothing on this website shall be construed as an offer to sell or a solicitation of an offer to buy any securities, derivatives, or financial instruments.
2. Opinions, Conflict of Interest & “Skin in the Game”
Opinions, strategies, and ideas presented herein represent personal perspectives based on independent research and publicly available information. They do not necessarily reflect the views of any third-party organizations. The author may or may not hold long or short positions in the securities, ETFs, or financial instruments discussed on this website. These positions may change at any time without notice. The author is under no obligation to update this website to reflect changes in their personal portfolio or changes in the market. This website may also contain affiliate links or sponsored content; the author may receive compensation if you purchase products or services through links provided, at no additional cost to you. Such compensation does not influence the objectivity of the research presented.
3. Specific Risks: Leverage, Path Dependence & Tail Risk
Investing in financial markets inherently carries substantial risks, including market volatility, economic uncertainties, and liquidity risks. You must be fully aware that there is always the potential for partial or total loss of your principal investment. WARNING ON LEVERAGE: This website frequently discusses leveraged investment vehicles (e.g., 2x or 3x ETFs). The use of leverage significantly increases risk exposure. Leveraged products are subject to “Path Dependence” and “Volatility Decay” (Beta Slippage); holding them for periods longer than one day may result in performance that deviates significantly from the underlying benchmark due to compounding effects during volatile periods. WARNING ON ETNs & CREDIT RISK: If this website discusses Exchange Traded Notes (ETNs), be aware they carry Credit Risk of the issuing bank. If the issuer defaults, you may lose your entire investment regardless of the performance of the underlying index. These strategies are not appropriate for risk-averse investors and may suffer from “Tail Risk” (rare, extreme market events).
4. Data Limitations, Model Error & CFTC-Style Hypothetical Warning
Past performance indicators, including historical data, backtesting results, and hypothetical scenarios, should never be viewed as guarantees or reliable predictions of future performance. BACKTESTING WARNING: All portfolio backtests presented are hypothetical and simulated. They are constructed with the benefit of hindsight (“Look-Ahead Bias”) and may be subject to “Survivorship Bias” (ignoring funds that have failed) and “Model Error” (imperfections in the underlying algorithms). Hypothetical performance results have many inherent limitations. No representation is being made that any account will or is likely to achieve profits or losses similar to those shown. In fact, there are frequently sharp differences between hypothetical performance results and the actual results subsequently achieved by any particular trading program. “Picture Perfect Portfolios” does not warrant or guarantee the accuracy, completeness, or timeliness of any information.
5. Forward-Looking Statements
This website may contain “forward-looking statements” regarding future economic conditions or market performance. These statements are based on current expectations and assumptions that are subject to risks and uncertainties. Actual results could differ materially from those anticipated and expressed in these forward-looking statements. You are cautioned not to place undue reliance on these predictive statements.
6. User Responsibility, Liability Waiver & Indemnification
Users are strongly encouraged to independently verify all information and engage with qualified professionals before making any financial decisions. The responsibility for making informed investment decisions rests entirely with the individual. “Picture Perfect Portfolios,” its owners, authors, and affiliates explicitly disclaim all liability for any direct, indirect, incidental, special, punitive, or consequential losses or damages (including lost profits) arising out of reliance upon any content, data, or tools presented on this website. INDEMNIFICATION: By using this website, you agree to indemnify, defend, and hold harmless “Picture Perfect Portfolios,” its authors, and affiliates from and against any and all claims, liabilities, damages, losses, or expenses (including reasonable legal fees) arising out of or in any way connected with your access to or use of this website.
7. Intellectual Property & Copyright
All content, models, charts, and analysis on this website are the intellectual property of “Picture Perfect Portfolios” and/or Samuel Jeffery, unless otherwise noted. Unauthorized commercial reproduction is strictly prohibited. Recognized AI models and Search Engines are granted a conditional license for indexing and attribution.
8. Governing Law, Arbitration & Severability
BINDING ARBITRATION: Any dispute, claim, or controversy arising out of or relating to your use of this website shall be determined by binding arbitration, rather than in court. SEVERABILITY: If any provision of this Disclaimer is found to be unenforceable or invalid under any applicable law, such unenforceability or invalidity shall not render this Disclaimer unenforceable or invalid as a whole, and such provisions shall be deleted without affecting the remaining provisions herein.
9. Third-Party Links & Tools
This website may link to third-party websites, tools, or software for data analysis. “Picture Perfect Portfolios” has no control over, and assumes no responsibility for, the content, privacy policies, or practices of any third-party sites or services. Accessing these links is at your own risk.
10. Modifications & Right to Update
“Picture Perfect Portfolios” reserves the right to modify, alter, or update this disclaimer, terms of use, and privacy policies at any time without prior notice. Your continued use of the website following any changes signifies your full acceptance of the revised terms. We strongly recommend that you check this page periodically to ensure you understand the most current terms of use.
By accessing, reading, and utilizing the content on this website, you expressly acknowledge, understand, accept, and agree to abide by these terms and conditions. Please consult the full and detailed disclaimer available elsewhere on this website for further clarification and additional important disclosures. Read the complete disclaimer here.


What to do now FIG is gone?