
I have a serious confession to make: Writing isn’t my cup of tea!
It’s odd to admit that given the fact that I run this blog, but it’s the honest truth.
And since I took a trip to Patagonia last spring, I’ve fallen deep down the AI rabbit hole to the point where I’ve fiercely neglected this site with fresh forward facing content.
Once you’ve broken a habit (that was challenging to build in the first place) it’s especially hard to get back on the saddle as resistance mounts the more you procrastinate; it’s a vicious cycle.

However, I’ve been meaning to write an update to the model Picture Perfect Portfolio for several months.
I’m finally parking my arse down on the computer chair, turning off social media and henpecking away until this post gets done.
My first stab at creating the Picture Perfect Portfolio was my third blog post on this site!
I started off with reviews of UPAR and GDE and then somehow mustarded up the audacity to create my unique version of what I at the time considered to be the Picture Perfect Portfolio.
The first problem was that this portfolio wasn’t investable.
The idea of an equal parts equities (global min vol), bonds (long-term treasury and TIPs) and alternatives (managed futures and gold) portfolio (targeting a 180% canvas) was my desired goal given the investing knowledge I had back in April 2022.
But it was unattainable.
The capital efficient product range was in its infancy back then.
Moreover, my understanding and comprehension of various alternative strategies was quite limited as well.
I’ve since expanded my knowledge on how different strategies such as style premia, arbitrage, long-short + market neutral equity and diversified tail-risk hedging can help investors build a more efficient, robust and resilient portfolio where the opportunity for excellent returns and stellar risk management collide.

All of this has corresponded with the golden age of capital efficient product development.
2023, in particular, was its coming out party!
We now we have the capacity to build the expanded canvas portfolios of our dreams.
And I’m excited to share some different potential combinations.
That brings me to the second problem with the original Picture Perfect Portfolio.
It was designed specifically for me as an accumulator and self-employed individual.
It reflects all of my personal biases, current life situation, retirement trajectory, dreams and aspirations that are unique to my life.

However, there is no such thing as the objective Picture Perfect Portfolio!
There is only the Picture Perfect Portfolio that is right for you based on your unique life circumstances, risk tolerance, unique personality quirks and overall investing knowledge.
What works for you may not work for me. And vice versa.
You may have a tremendous appetite for volatility, whereas I don’t.
It’s crucial to acknowledge that.
And with this in mind, I’ve decided to be audacious, once again, and take a stab at creating 10 different model portfolios that involve expanding the canvas.

These are the official Picture Perfect Portfolios 2.0 version.
They are benchmarked to various classic and alternative portfolios.
Some of these are my own original ideas whereas others are merely enhanced classic portfolios.
We’ll also be covering how to mimic some fascinating alternative portfolios (with some compromises) and we’ll even have one that is not handcuffed to a benchmark!
If that sounds exciting let’s begin the journey by looking at the big picture.

The Big Picture For Investors
As investors we’re faced with the daunting task of seeing the big picture.
Unlike in other endeavours we pursue in life, we’re presented with the challenges of potential lost decades for mainstream investing strategies (hello, US large cap MCW equities in the 2000s) and alternative ones too (the pain game for managed futures in the 2010s).
You’re expected to hold on tight.
Imagine having to be THAT PATIENT in other areas of your life?
Hey, your workout program might not give you ANY desirable results for an entire decade!
But you had better stick with it long-term if you want to see the intended long-term results.
WTF.
Imagine that?
It truly sounds hilarious.
Who would be willing to endure such stagnation?
Probably, no one.
Yet, as investors we’re faced with that exact possibility and specific scenario if we put all of our eggs in one basket.
Lost decades.

Challenging underwater periods that last months and years.
One of our only lifelines against eventually running up against this friction is to diversify our assets across a diverse set of unique risk sources.
As the popular saying goes (I actually have no idea who first said it), the only free lunch in investing is diversification.
And so I’ve built my entire philosophy of investing around this framework.

1-2-3 Approach To Portfolio Construction
Given the unique challenges investors face today (and in the past) I’ve come up with a 1-2-3 approach to portfolio construction in this specific order:
- Capital Efficiency
- Maximum Diversification
- Optimization (When Possible)
To better explain this let me give you a few specific examples.
I’d prefer a fund like AVGV over SPY given that it is globally diversified and tilts towards a research supported optimization strategy (value factor) versus the market cap weighted and home country biased US equity only strategy.
Using our 1-2-3 step process of comparing funds we’re able to score points on number 2 (maximum diversification by this strategy being global vs US-only) and number 3 (optimization by tilting towards a research supported factor strategy) where we have an obvious winner in AVGV ETF.

Here we’re comparing apples to apples.
However, things become a bit more complicated when we compare this fund with something like GDE ETF.
This is an apples to oranges scenario.
Its exposure offers investors 90% equities plus 90% gold futures.
Although AVGV is global (diversification benefit) and optimized (value) it only provides investors exposure to one strategy (equities) and furthermore it is not capital efficient.
Thus, by the framework that I use for portfolio construction I have a preference for GDE even though it only offers US equity exposure because it brings the uncorrelated alternative of gold into the equation of my portfolio in a capital efficient manner.
Hence, it scores points on capital efficiency and maximum diversification (two uncorrelated strategies) which I rank ahead of optimization (value tilt).
Now if a fund were created with AVGV at 90% and gold futures at 90%, I’m going to say sayonara to GDE.
The goal here is to expand our canvas to create as much space as possible for diversification.
source: Investopedia on YouTube
We’re able to fulfill all of our different portfolio mandates by using this formula.
We can construct defensive portfolios, offensive portfolios, tactical portfolios and everything in between by adhering to this process.
It’s the ultimate form of flexibility to have access to a bigger canvas to paint our unique portfolio masterpiece.
I encourage you to stress test this formula (when it comes to portfolio construction) and if it doesn’t work for you, consider applying a system that does.

Having a clear set of priorities and a decision-tree for making portfolio decisions is a blessing IMO as opposed to being a curse.
It helps you evaluate new funds and make decisions such as whether or not to potentially integrate them into your portfolio, axe/shrink others or hold off and evaluate further.
Asset Classes/Strategies: Big Picture
I briefly touched upon the importance of being able to see the big picture as an investor.
Well, what exactly do I mean by that?
It’s the ability to view all of the potential strategies you may (or may not) want to add to your portfolio and to view them as a whole (portfolio level) as opposed to individual line items (individual parts of the portfolio).

If you’re not able to do this, the chances of you sticking with these strategies, when they inevitably struggle, is slim at best.
This especially holds true for alternatives.
We’ll forget a lost decade for US equities with enough distance in the rearview mirror but somehow our leash for alternatives tends to be much shorter.
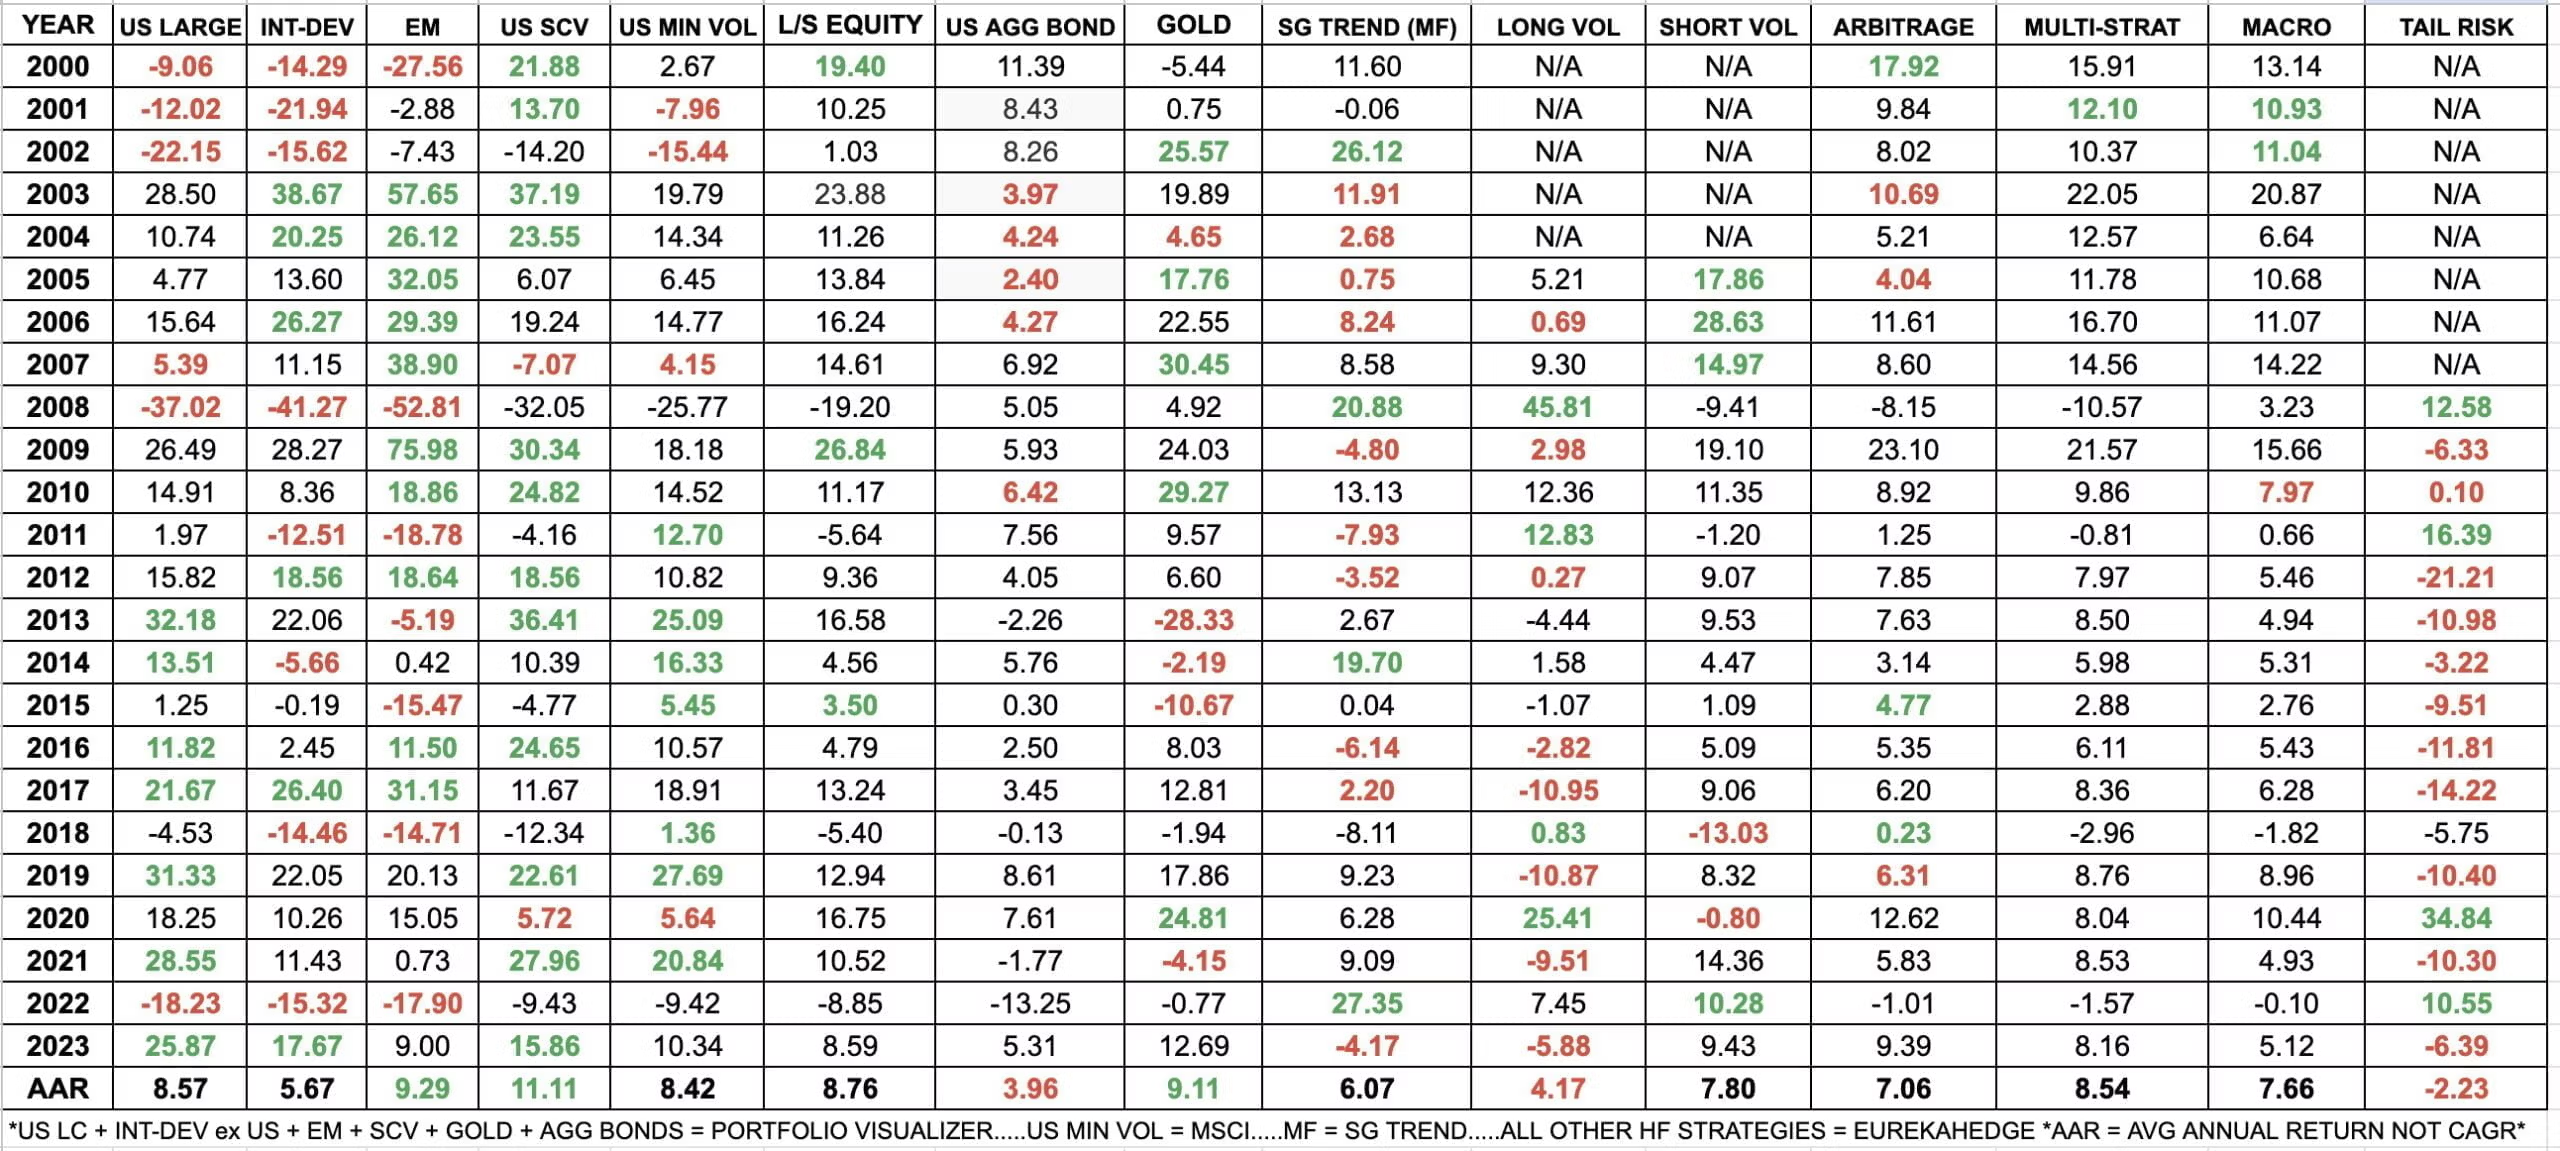
For instance, feast your eyes upon the results of Long-Vol in 2008.
This was the most impressive strategy during the most challenging year for global financial markets in the past 50 years.
Did it ever pay-off to have committed some resources to this strategy in your portfolio back then!
But then look at how it bleeds out in the 2010s.
This is the nature of such a strategy.
Are you willing to hold on and rebalance diligently?
How are you doing to handle tracking error when your alternative sleeve is a drag versus a benefit on any given year?
Minimum volatility equities is another one worth careful examination.
Its defensive nature is not exciting with lower highs and lower lows.
It’s almost like someone accidentally sat on your sandwich.
It compresses things.
But without fail it’s been more defensive (relatively outperforming SPY) during years such as 2000, 2001, 2002, 2008, 2018 and 2022.
What you may also notice is that many alternative strategies thrived during the tumultuous 2000s and struggled in the 2010s.
It’s only by zooming out that you can examine things with clarity.
Who knows what the future holds but the ability to step back and look at things from a distance is an incredible gift you can give yourself as an investor.
About the Author & Disclosure
Picture Perfect Portfolios is the quantitative research arm of Samuel Jeffery, co-founder of the Samuel & Audrey Media Network. With over 15 years of global business experience and two World Travel Awards (Europe’s Leading Marketing Campaign 2017 & 2018), Samuel brings a unique global macro perspective to asset allocation.
Note: This content is strictly for educational purposes and reflects personal opinions, not professional financial advice. All strategies discussed involve risk; please consult a qualified advisor before investing.

Picture Perfect Portfolio(s) 2.0 Version
Okay, enough rambling already, let’s get to those portfolios!
So what we’re going to do is explore 10 different capital efficient portfolios.
They range from being as defensive as possible (The Fortress) to bringing out the big guns trying to outperform equities with less risk (SPY Hunter).
Here’s the complete list of them along with their corresponding benchmarks (note: one doesn’t have one!).

These asset allocation ideas and model portfolios presented herein are purely for entertainment purposes only. This is NOT investment advice. These models are hypothetical and are intended to provide general information about potential ways to organize a portfolio based on theoretical scenarios and assumptions. They do not take into account the investment objectives, financial situation/goals, risk tolerance and/or specific needs of any particular individual.
Picture Perfect Portfolio Originals
- The Fortress Portfolio (Benchmark: 40/60)
- SPY Hunter (Benchmark: S&P 500)
- Max D Triple P (Benchmark: 60/40)
- The Honey Badger (Benchmark: VT)
- The Contrarian (Benchmark: None!)
- Canucklehead (Benchmark: 60/40 for Canadians)
These are the Picture Perfect Portfolio(s) originals.
If they have one thing in common it is this:
An attempt by an amateur investor to create serious portfolios with absolutely ridiculous names.
Enhanced Classic Portfolios
These are the enhanced classic portfolios.
I attempt, as best as possible, to keep all of their parts together (their original configurations) whilst expanding upon them with capital efficiency and increased diversification strategies.
- Enhanced Ray Dalio Portfolio (Benchmark: Classic Ray Dalio Portfolio)
- Enhanced Harry Browne Portfolio (Benchmark: Classic Harry Browne Permanent Portfolio)
My goal is to write detailed posts for all of the original portfolios listed above.
This is the abbreviated version.
Otherwise, we’d likely hit some ridiculous word count over 10,000.
And I do value your time, so I’ll try to keep things as concise as possible.

The Fortress Portfolio
Defending and preserving wealth requires an advanced skillset as an investor.
Instead of obsessing over enhanced offensive equity optimization strategies, the focus is more on defensive assets and layering uncorrelated bets into what is overall a complex system that you’ve developed.
The ability to defend is what this portfolio is all about.
Hence, I’ve come up with the quirky title of it being “The Fortress Portfolio”.
Close your eyes and imagine a medieval fortress that looks slightly haunted and that features an enormous misty moat.
It looks impenetrable and intimidating from a distance but as you get closer you notice it has all kinds of layers of defense that you didn’t initially spot.
Archers hidden behind pillars.
Crocodiles lurking in the waters.
You’ve traveled back in time and you’ve got nothing but a small dagger in your hand.
Good luck getting in there.
There are a plethora of defensive strategies that are designed to keep you out.
If you get past one, you have to immediately contend with another.
That’s what’s going on here.
Do you even bother trying?

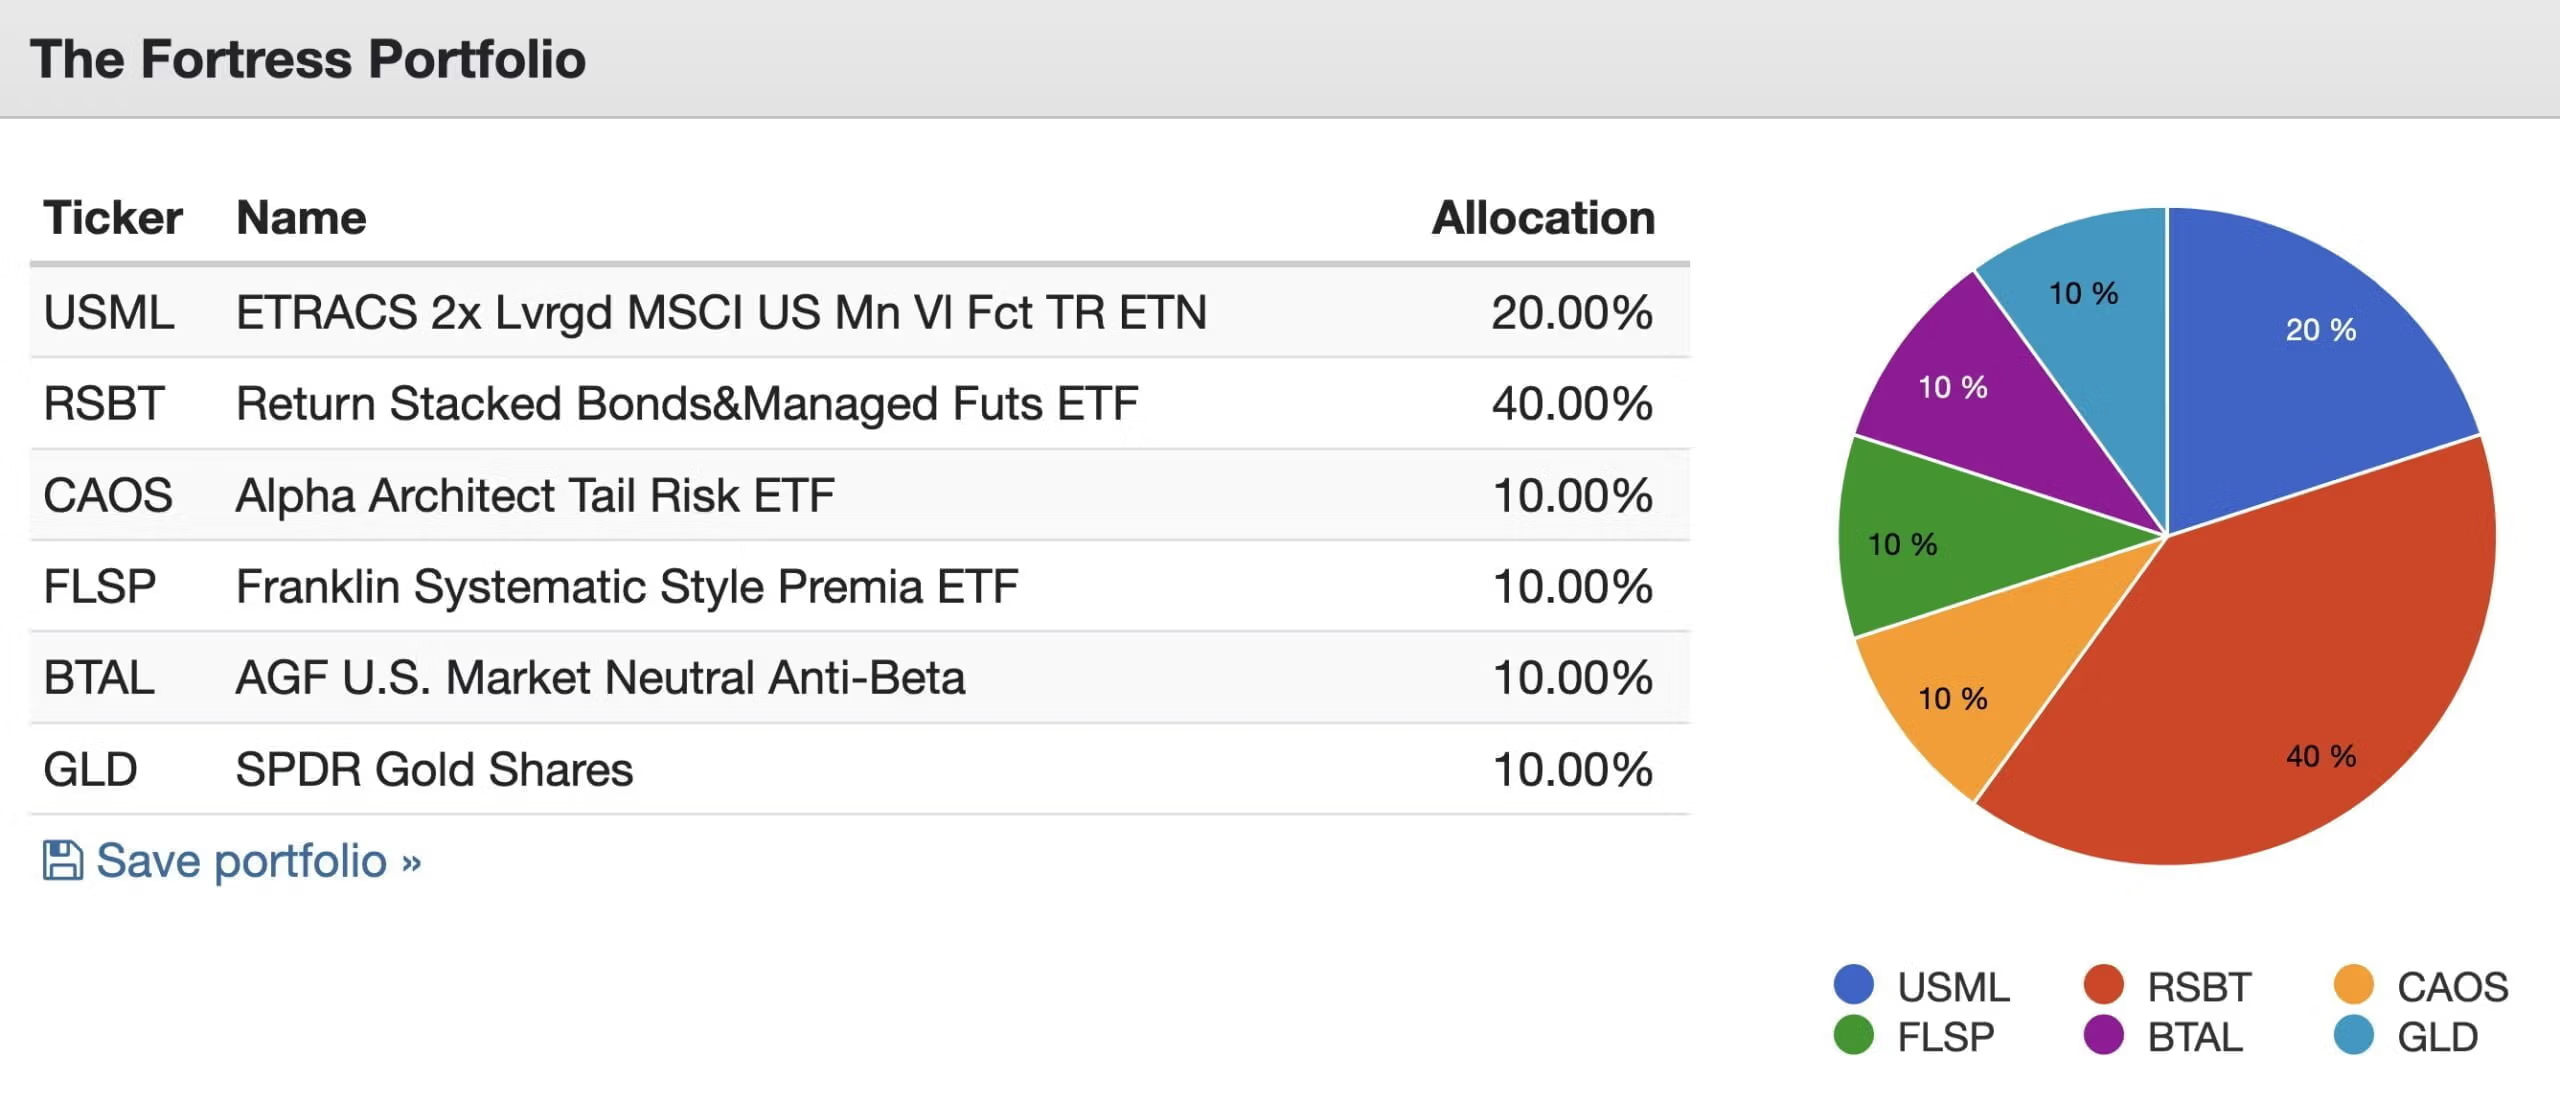
The Fortress Portfolio Funds
20% USML – ETRACS 2x Leveraged MSCI US Minimum Volatility Factor ETN
40% RSBT – Return Stacked Bonds & Managed Futures ETF
10% BTAL – AGF U.S. Market Neutral Anti-Beta Fund ETF
10% CAOS – Alpha Architect Tail Risk ETF (MF conversion form AVOLX)
10% FLSP – Franklin Systematic Style Premia ETF
10% GLD – SPDR Gold Shares
The Fortress Portfolio Exposures
40% US Min Vol Equities
40% Aggregate US Bonds
40% Managed Futures Trend
10% Market Neutral Anti-Beta
10% OTM Put
10% Style Premia
10% Gold
The portfolio is basically an equal slice version of the following:
40% Equities
40% Bonds
40% Managed Futures
40% Diversified Alternative Other
Canvas: 160%
Benchmark: 40/60 Portfolio
What we’re trying to accomplish here is to keep our equity sleeve (typically the most volatile part of the portfolio) tamed by reducing its exposure to 40% whilst choosing a defensive equity optimization strategy (min vol).
We’ll handcuff this to an equal slice of bonds and managed futures.
Bonds have typically provided a ballast during market downturns (2022 aside) and managed futures is one of the most reliable defensive strategies during times of turmoil.
Moreover, we’ve got diversified tail-risk hedging strategies (BTAL and CAOS) providing anti-beta market neutral and OTM Put exposure.
Finally, we’ve got some space committed for the OG uncorrelated alternative (Gold) which admittedly does its own thing and FLSP (style premia) which offers absolute return potential.
The end result is seven distinct strategies aimed at reducing volatility.
Let’s throw this into a blender and see how it backtests.
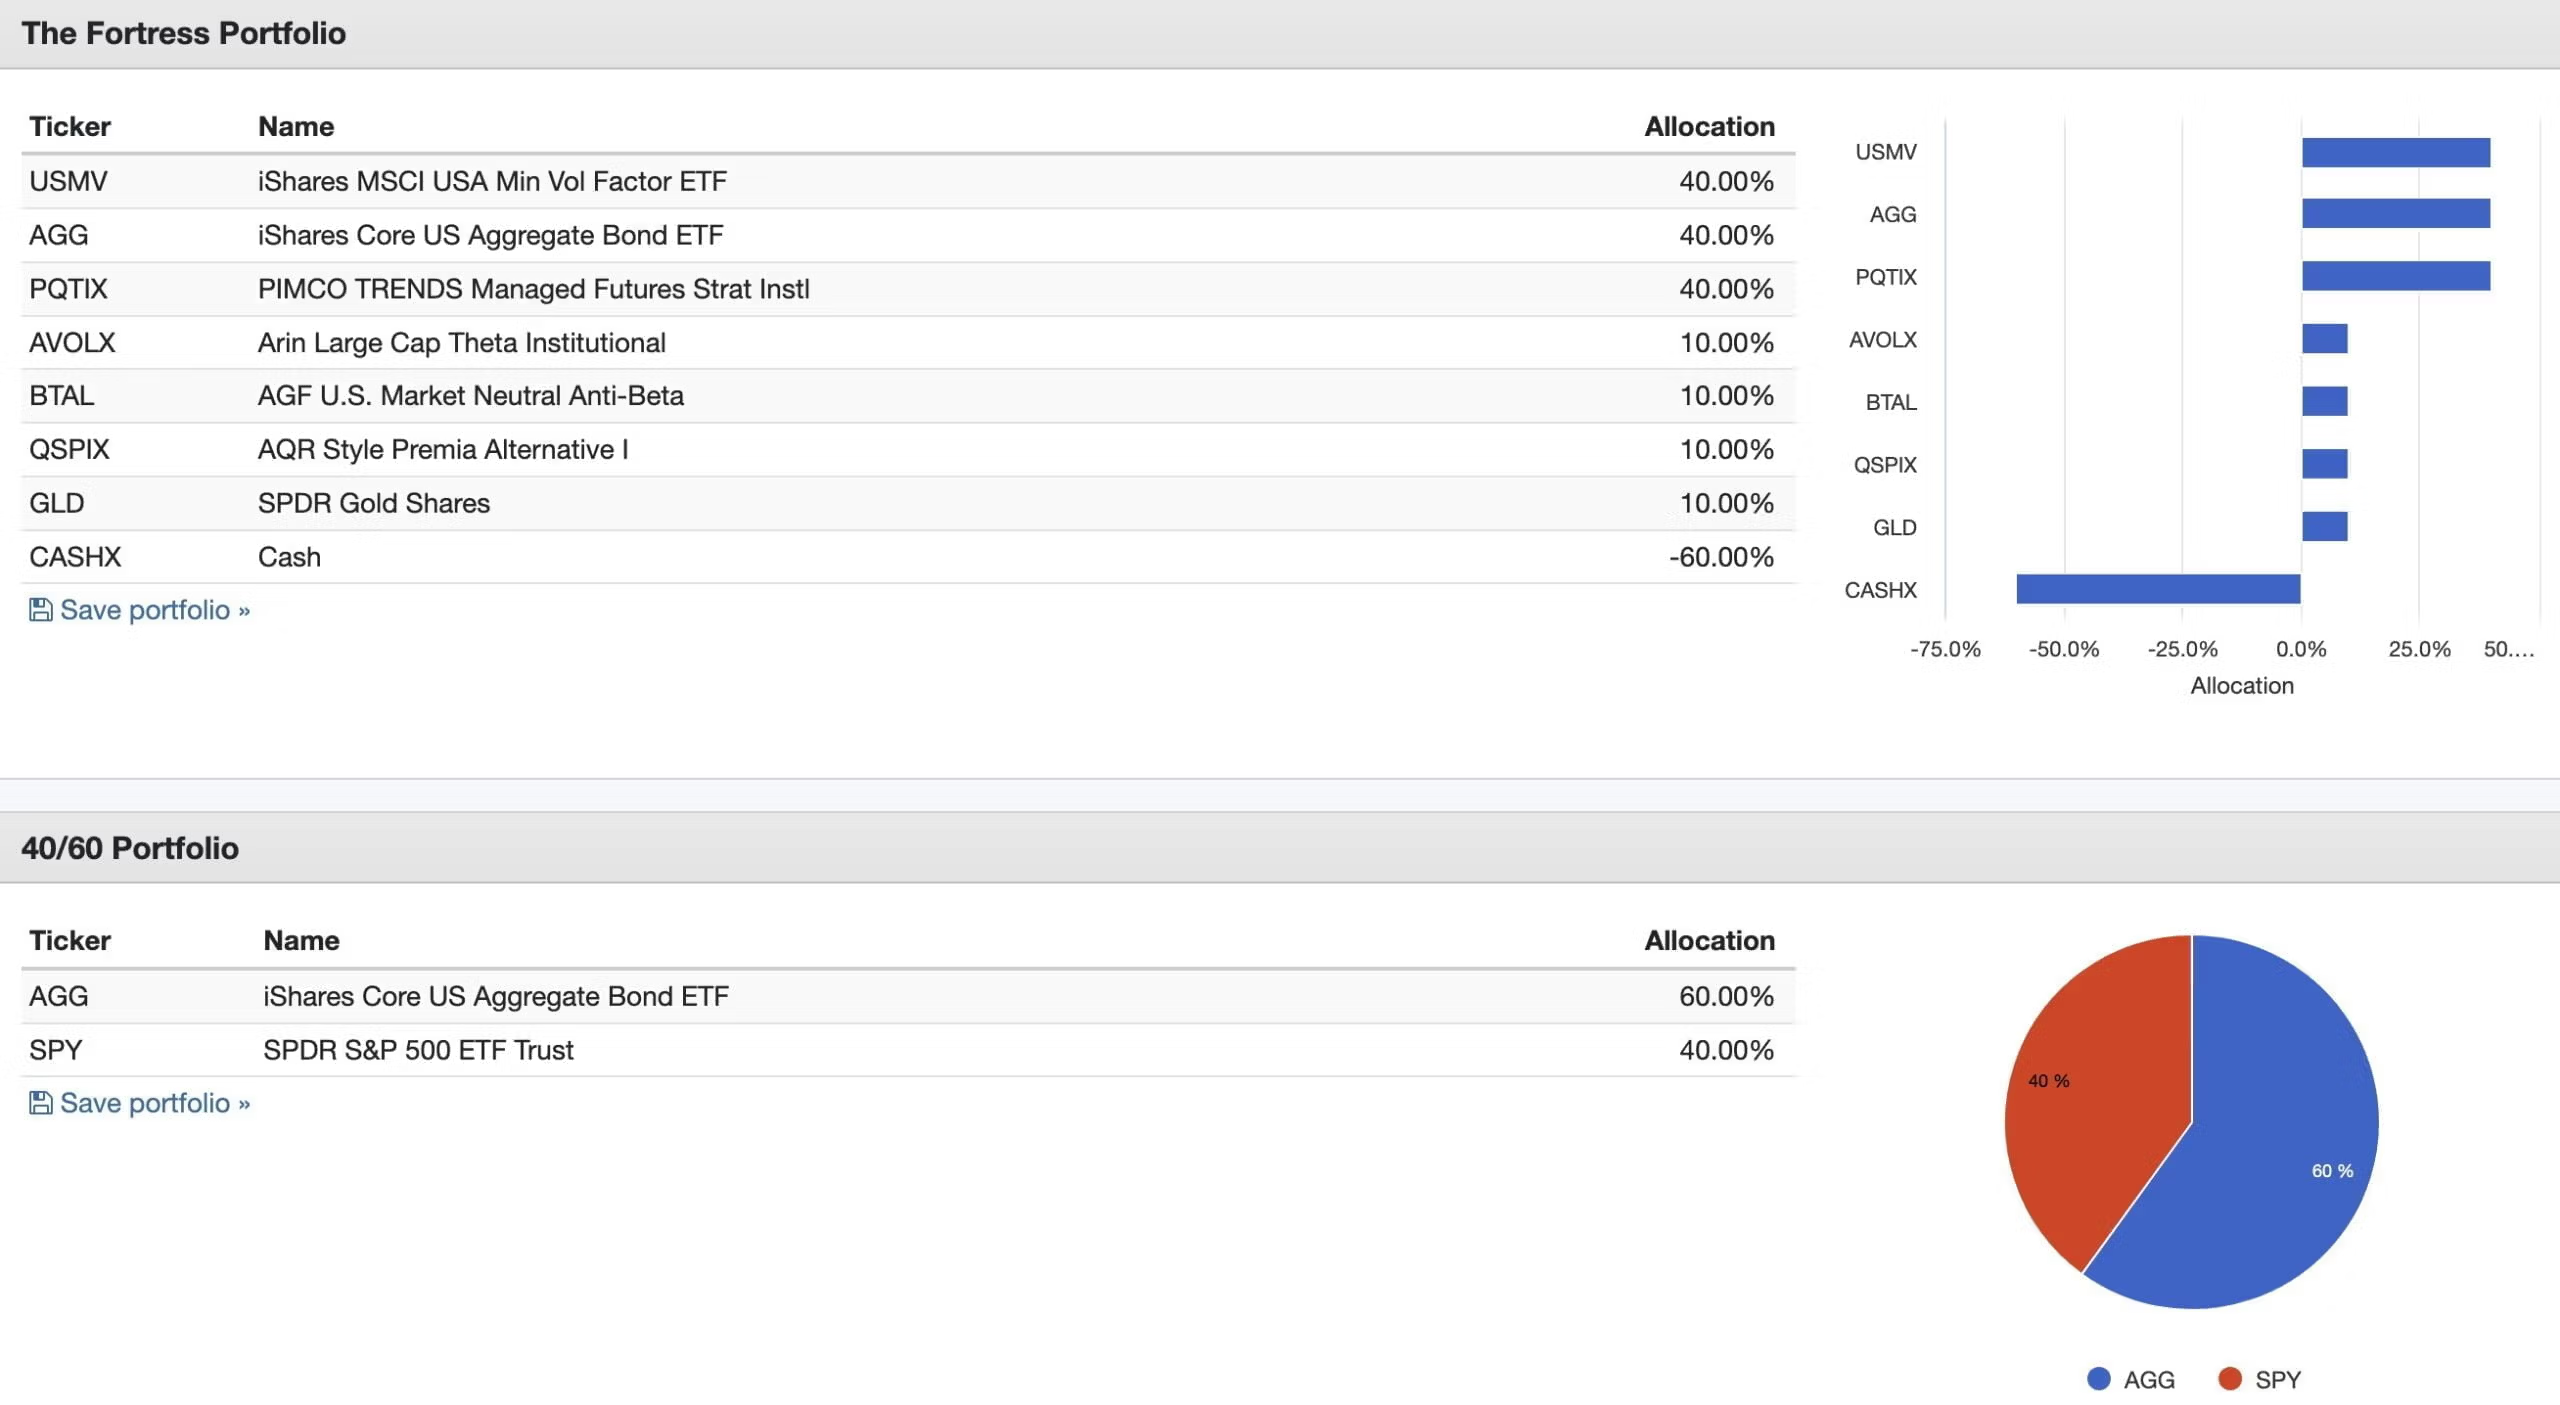
You’ll notice we’ve had to utilize funds such as PQTIX and AVOLX to get a taste of how managed futures and style premia performed since FLSP and RSBT are newer. But other funds like AVOLX (now CAOS) and BTAL and GLD can be stretched back to 2014.
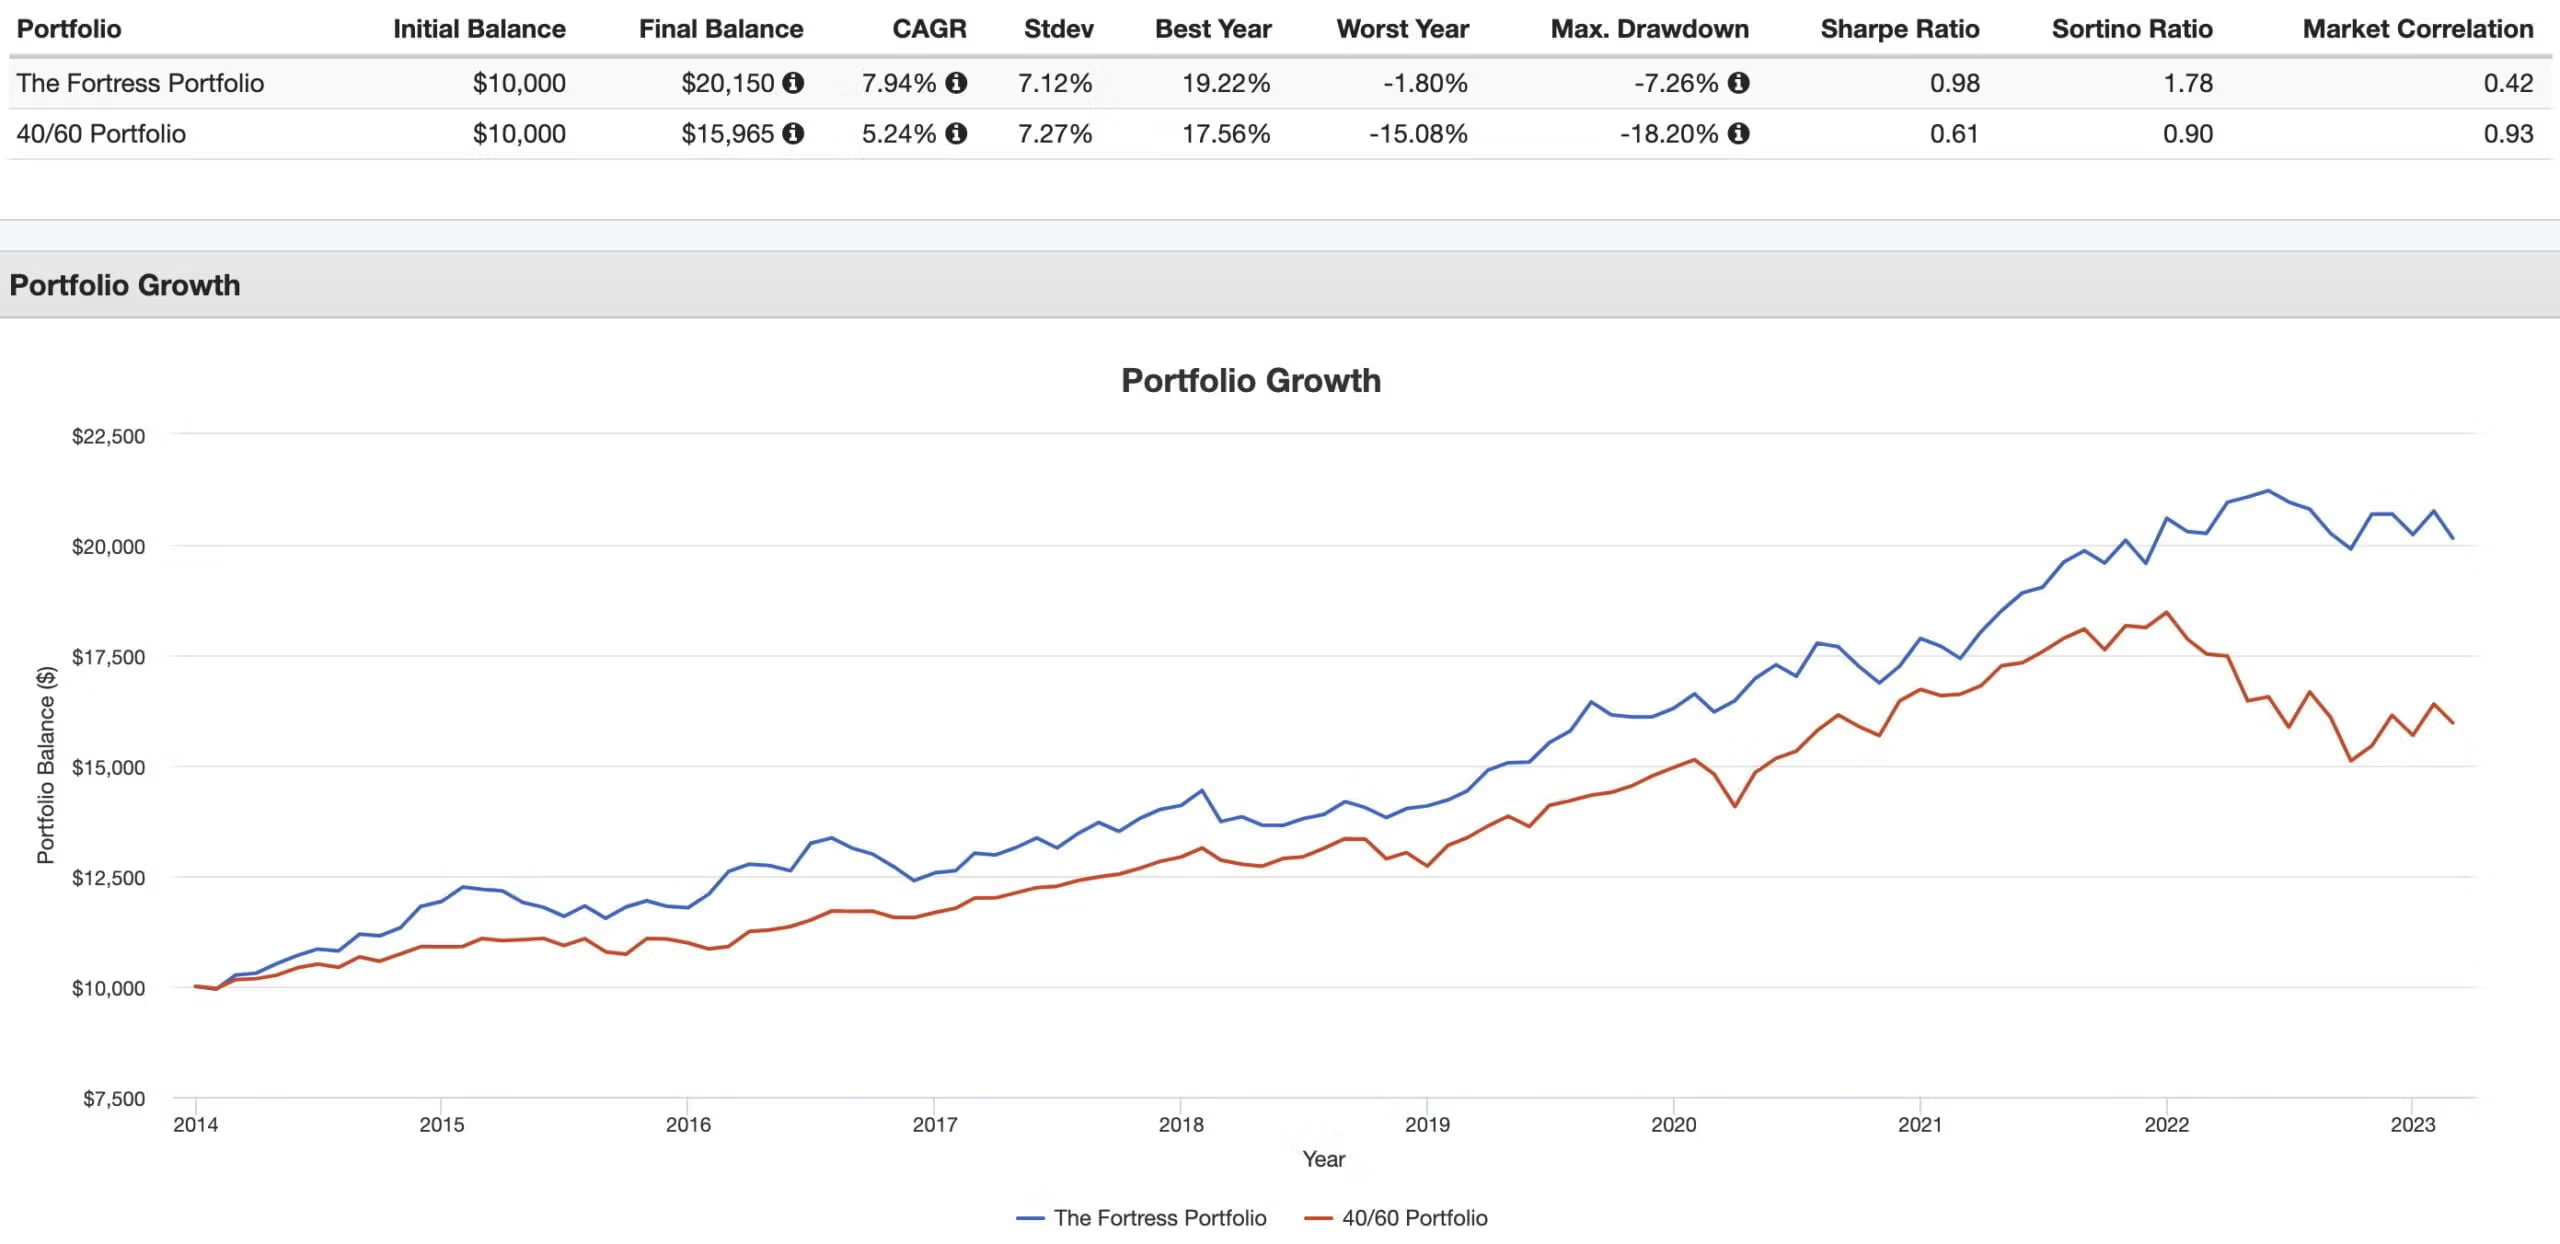
CAGR: 7.94% vs 5.24%
RISK: 7.12% vs 7.27%
Worst Year: -1.80% vs -15.08%
Max DD: -7.26% vs -18.20%
Sharpe: 0.98 vs 0.61
Sortino: 1.78 vs 0.90
Correlation: 0.42 vs 0.93
Backtests ought to be taken with a grain of salt but if we’re to examine the performance of these results it’s a convincing win across the board.
The Fortress Portfolio has provided better returns, better risk adjusted rates of returns and enhanced volatility management over the 40/60 portfolio.
Its Sortino triumph may be the most telling of all.
Here is the drawdown simulation.
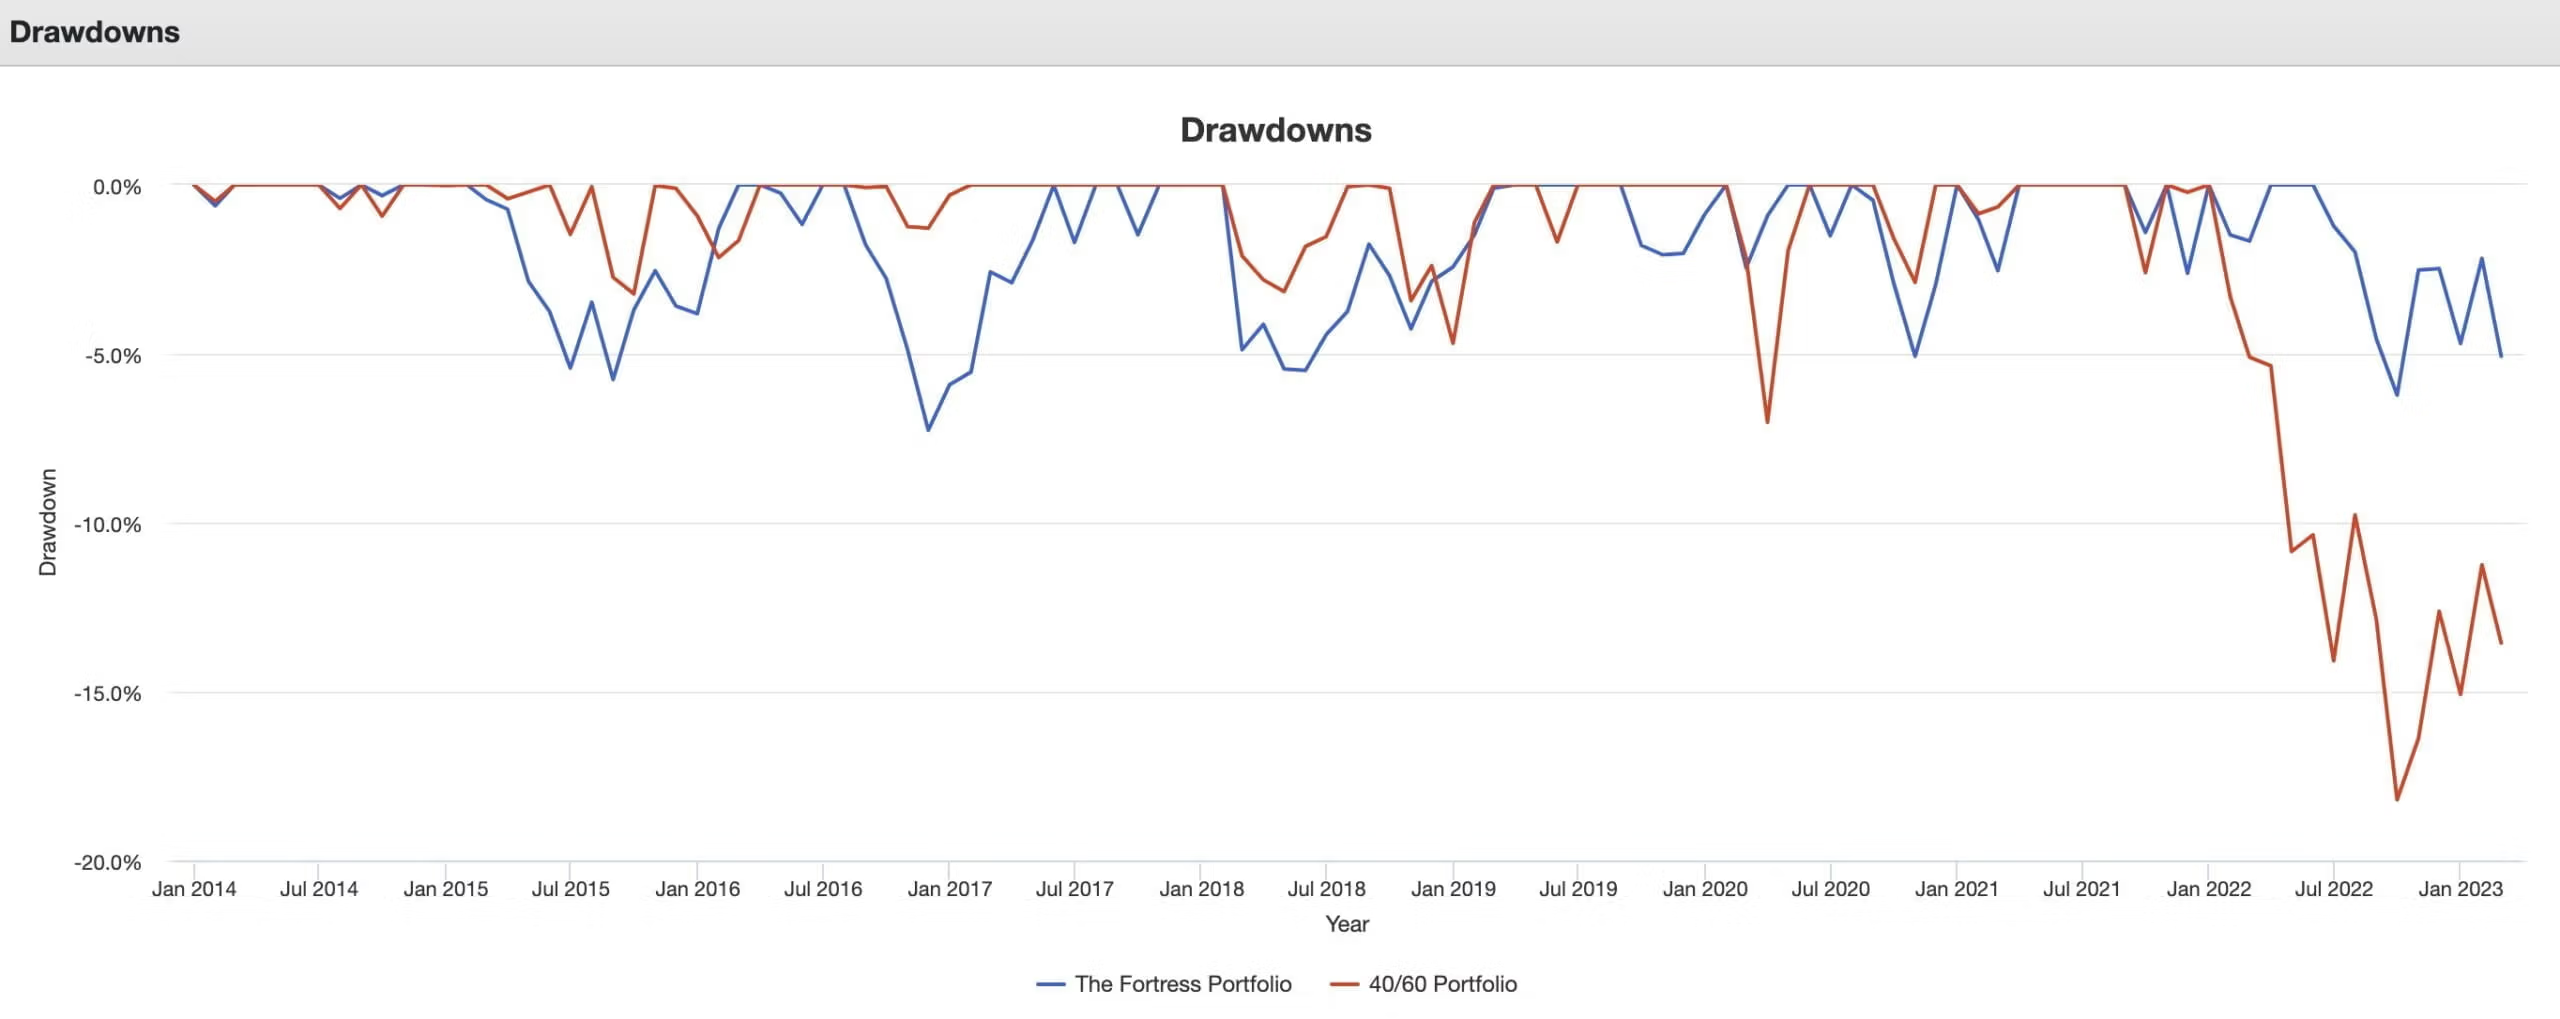
Here we’re able to notice that the Fortress Portfolio was better able to handle the curveballs thrown during the initial stages of the pandemic (March 2020) and the massacre of 2022.
The goal of this portfolio is to provide decent returns whilst focusing on stellar defense; outperformance is merely a bonus (when it happens).
Here is the portfolio with live funds:
We’re limited to the most abbreviated of backtests unfortunately!
Some of these awesome funds are hot off of the press including RSBT and CAOS (mutual fund conversion).
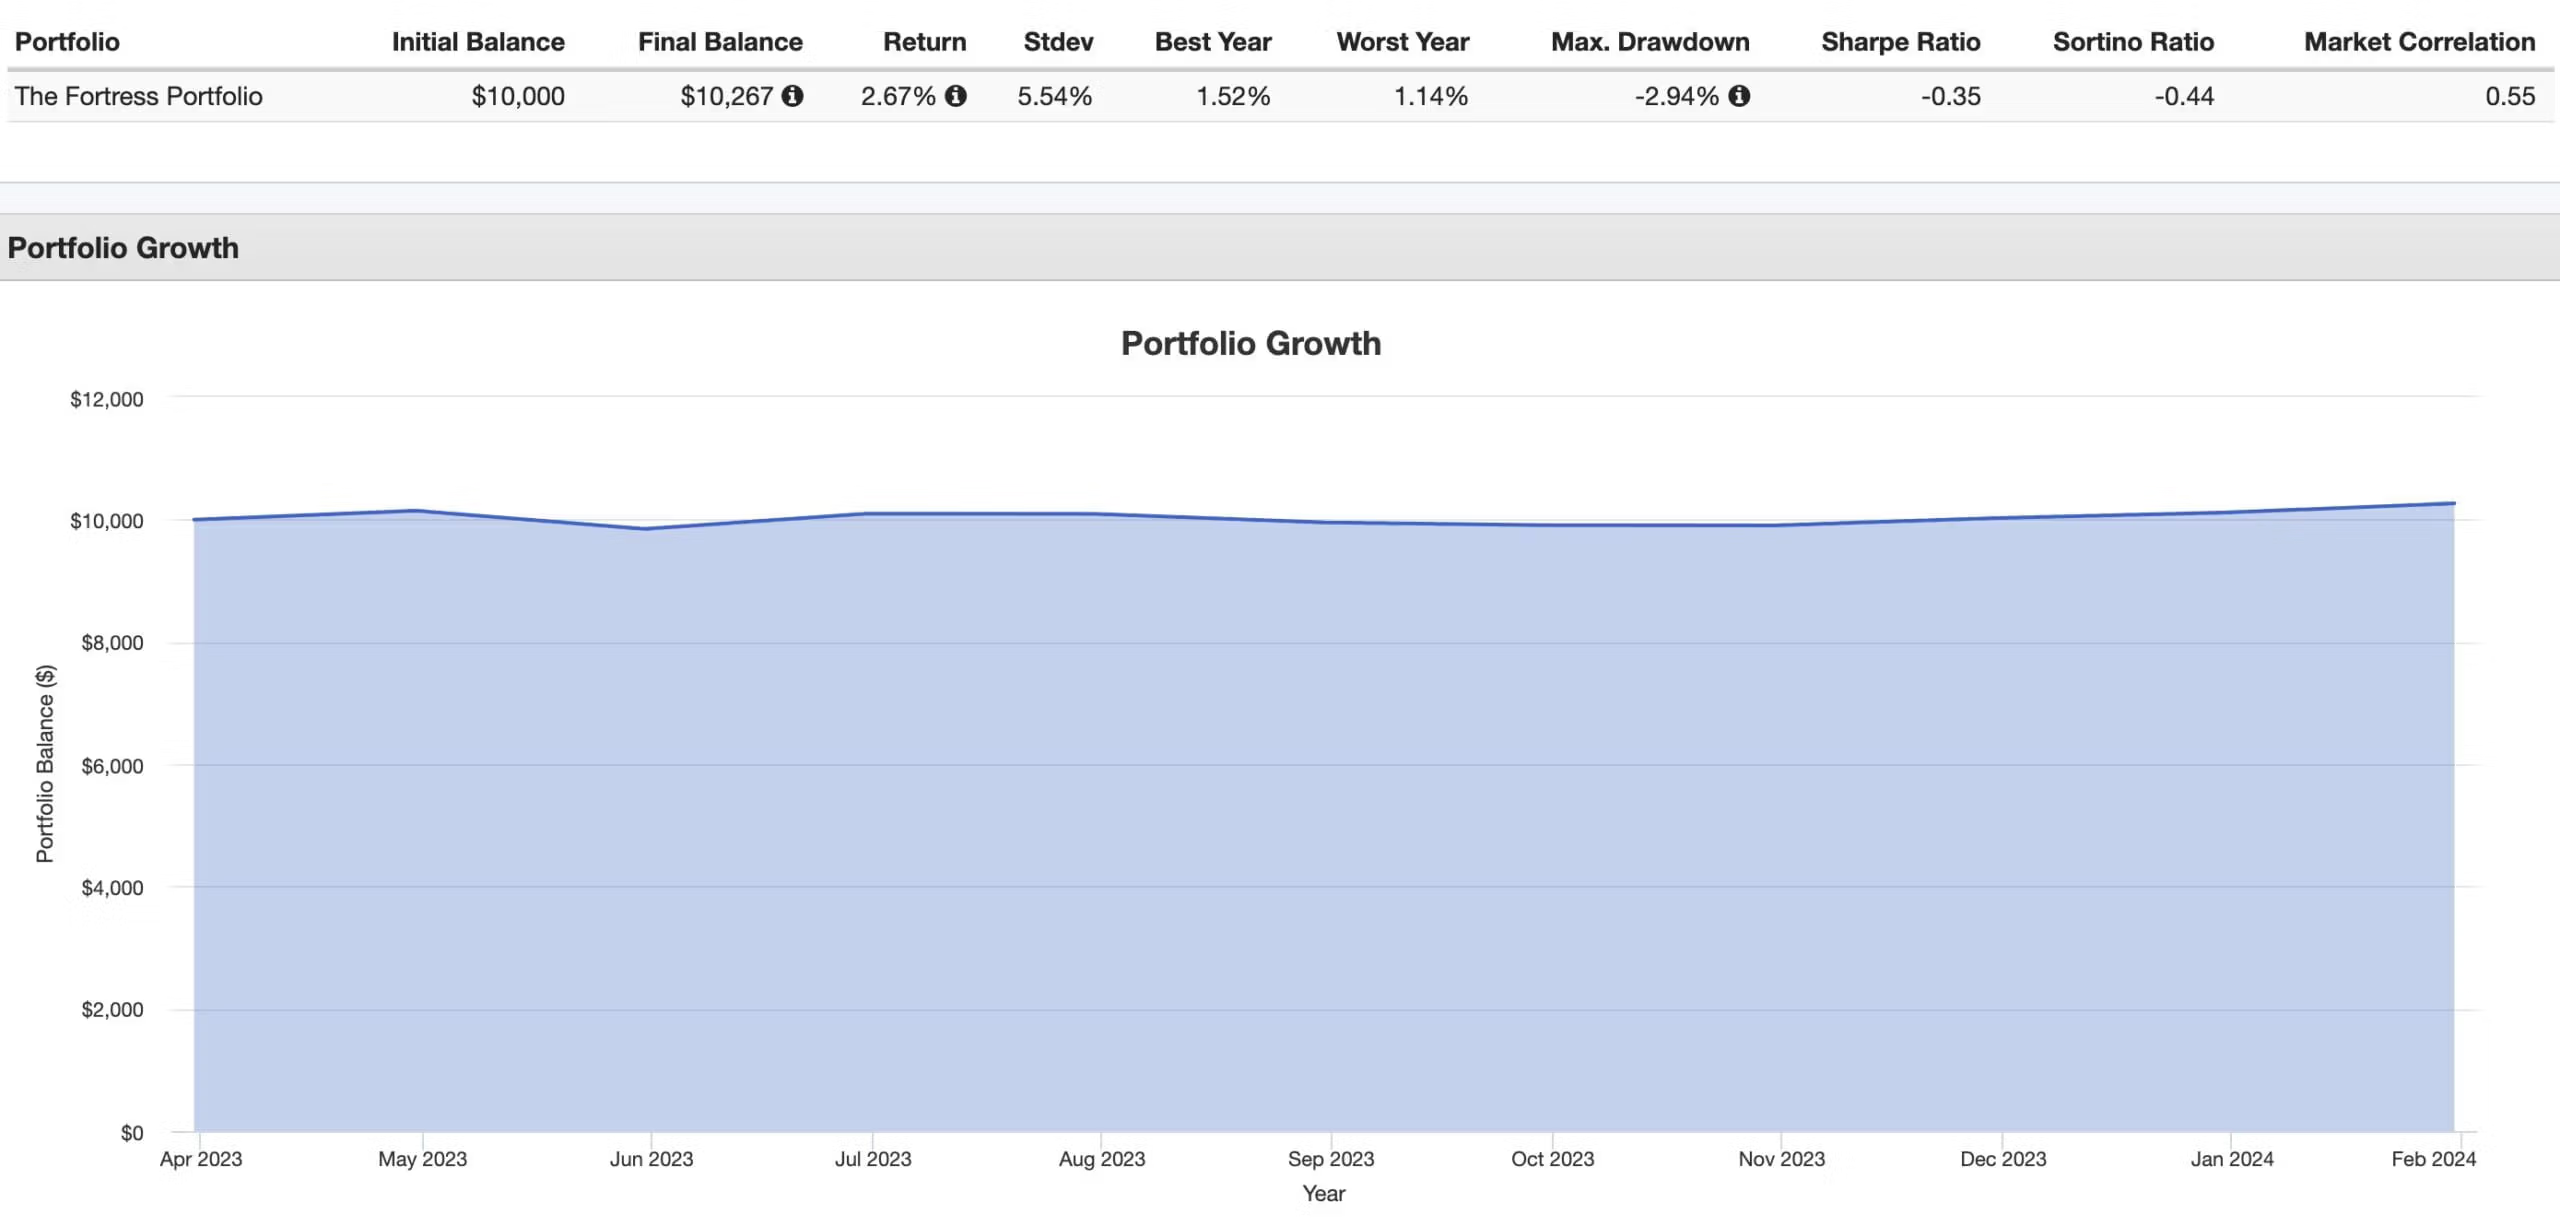
Although returns have been less than extraordinary it has flashed its risk management potential.
With a Stdev of 5.54% and Max Drawdown of -2.94% it provided fortress like defense without any offensive jam to date.
It’ll be interesting to check back in on this portfolio in a year or two to see how it is performing.
 Portfolio' scene takes the humor and exaggeration even further. This portrayal transforms the investment battlefield into a fantastical landscape where a colossal, cartoonish bull represents the SPY ETF, racing across a backdrop of fluctuating stock charts and exploding financial indicators. Bounty hunter characters, now armed with rocket-powered boots and laser-guided investment analysis devices, coordinate their efforts to capture the bull using giant slingshots and nets made of financial reports. Drenched in vibrant colors and retro patterns, filled with puns and quips about investment tactics and the elusive nature of beating the SPY, making this a lively and whimsical critique of the pursuit of market outperformance.")
SPY Hunter (Tactical) Portfolio
Our task is clear: Take Out SPY ETF (better known as the S&P 500)
We’ve been given a mandate of outperforming SPY on the upside whilst also potentially providing superior downside coverage.
Does that sound like a tall order?
Probably.
That’s not going to stop us from trying.
We’re all in on hunting down SPY.
Hence, the cheesy name of this portfolio: SPY HUNTER
You can think of this strategy as the bounty hunter equivalent of tracking down the most popular investing strategy of them all: MCW US Large Cap Equities.
Our plan of attack is to utilize capital efficient funds, diversify as much as possible, get a little tactical and also tail-hedge risk as the cherry on top.
Hence, we’ve got a nifty offensive mode and defensive mode configuration.
 Portfolio' scene takes the humor and exaggeration even further. This portrayal transforms the investment battlefield into a fantastical landscape where a colossal, cartoonish bull represents the SPY ETF, racing across a backdrop of fluctuating stock charts and exploding financial indicators. Bounty hunter characters, now armed with rocket-powered boots and laser-guided investment analysis devices, coordinate their efforts to capture the bull using giant slingshots and nets made of financial reports. Drenched in vibrant colors and retro patterns, the scene embodies filled with puns and quips about investment tactics and the elusive nature of beating the SPY, making this a lively and whimsical critique of the pursuit of market outperformance.")
SPY Hunter Funds
40% RSST – Return Stacked US Stocks & Managed Futures ETF
20% SPQ – SPQ Simplify US Equity PLUS QIS ETF
20% HCMT – Direxion HCM Tactical Enhanced US Equity Strategy ETF
10% GDE – WisdomTree Efficient Gold Plus Equity Strategy Fund
5% CAOS – Alpha Architect Tail Risk ETF
5% BTAL – AGF US Market Neutral Anti Beta Fund
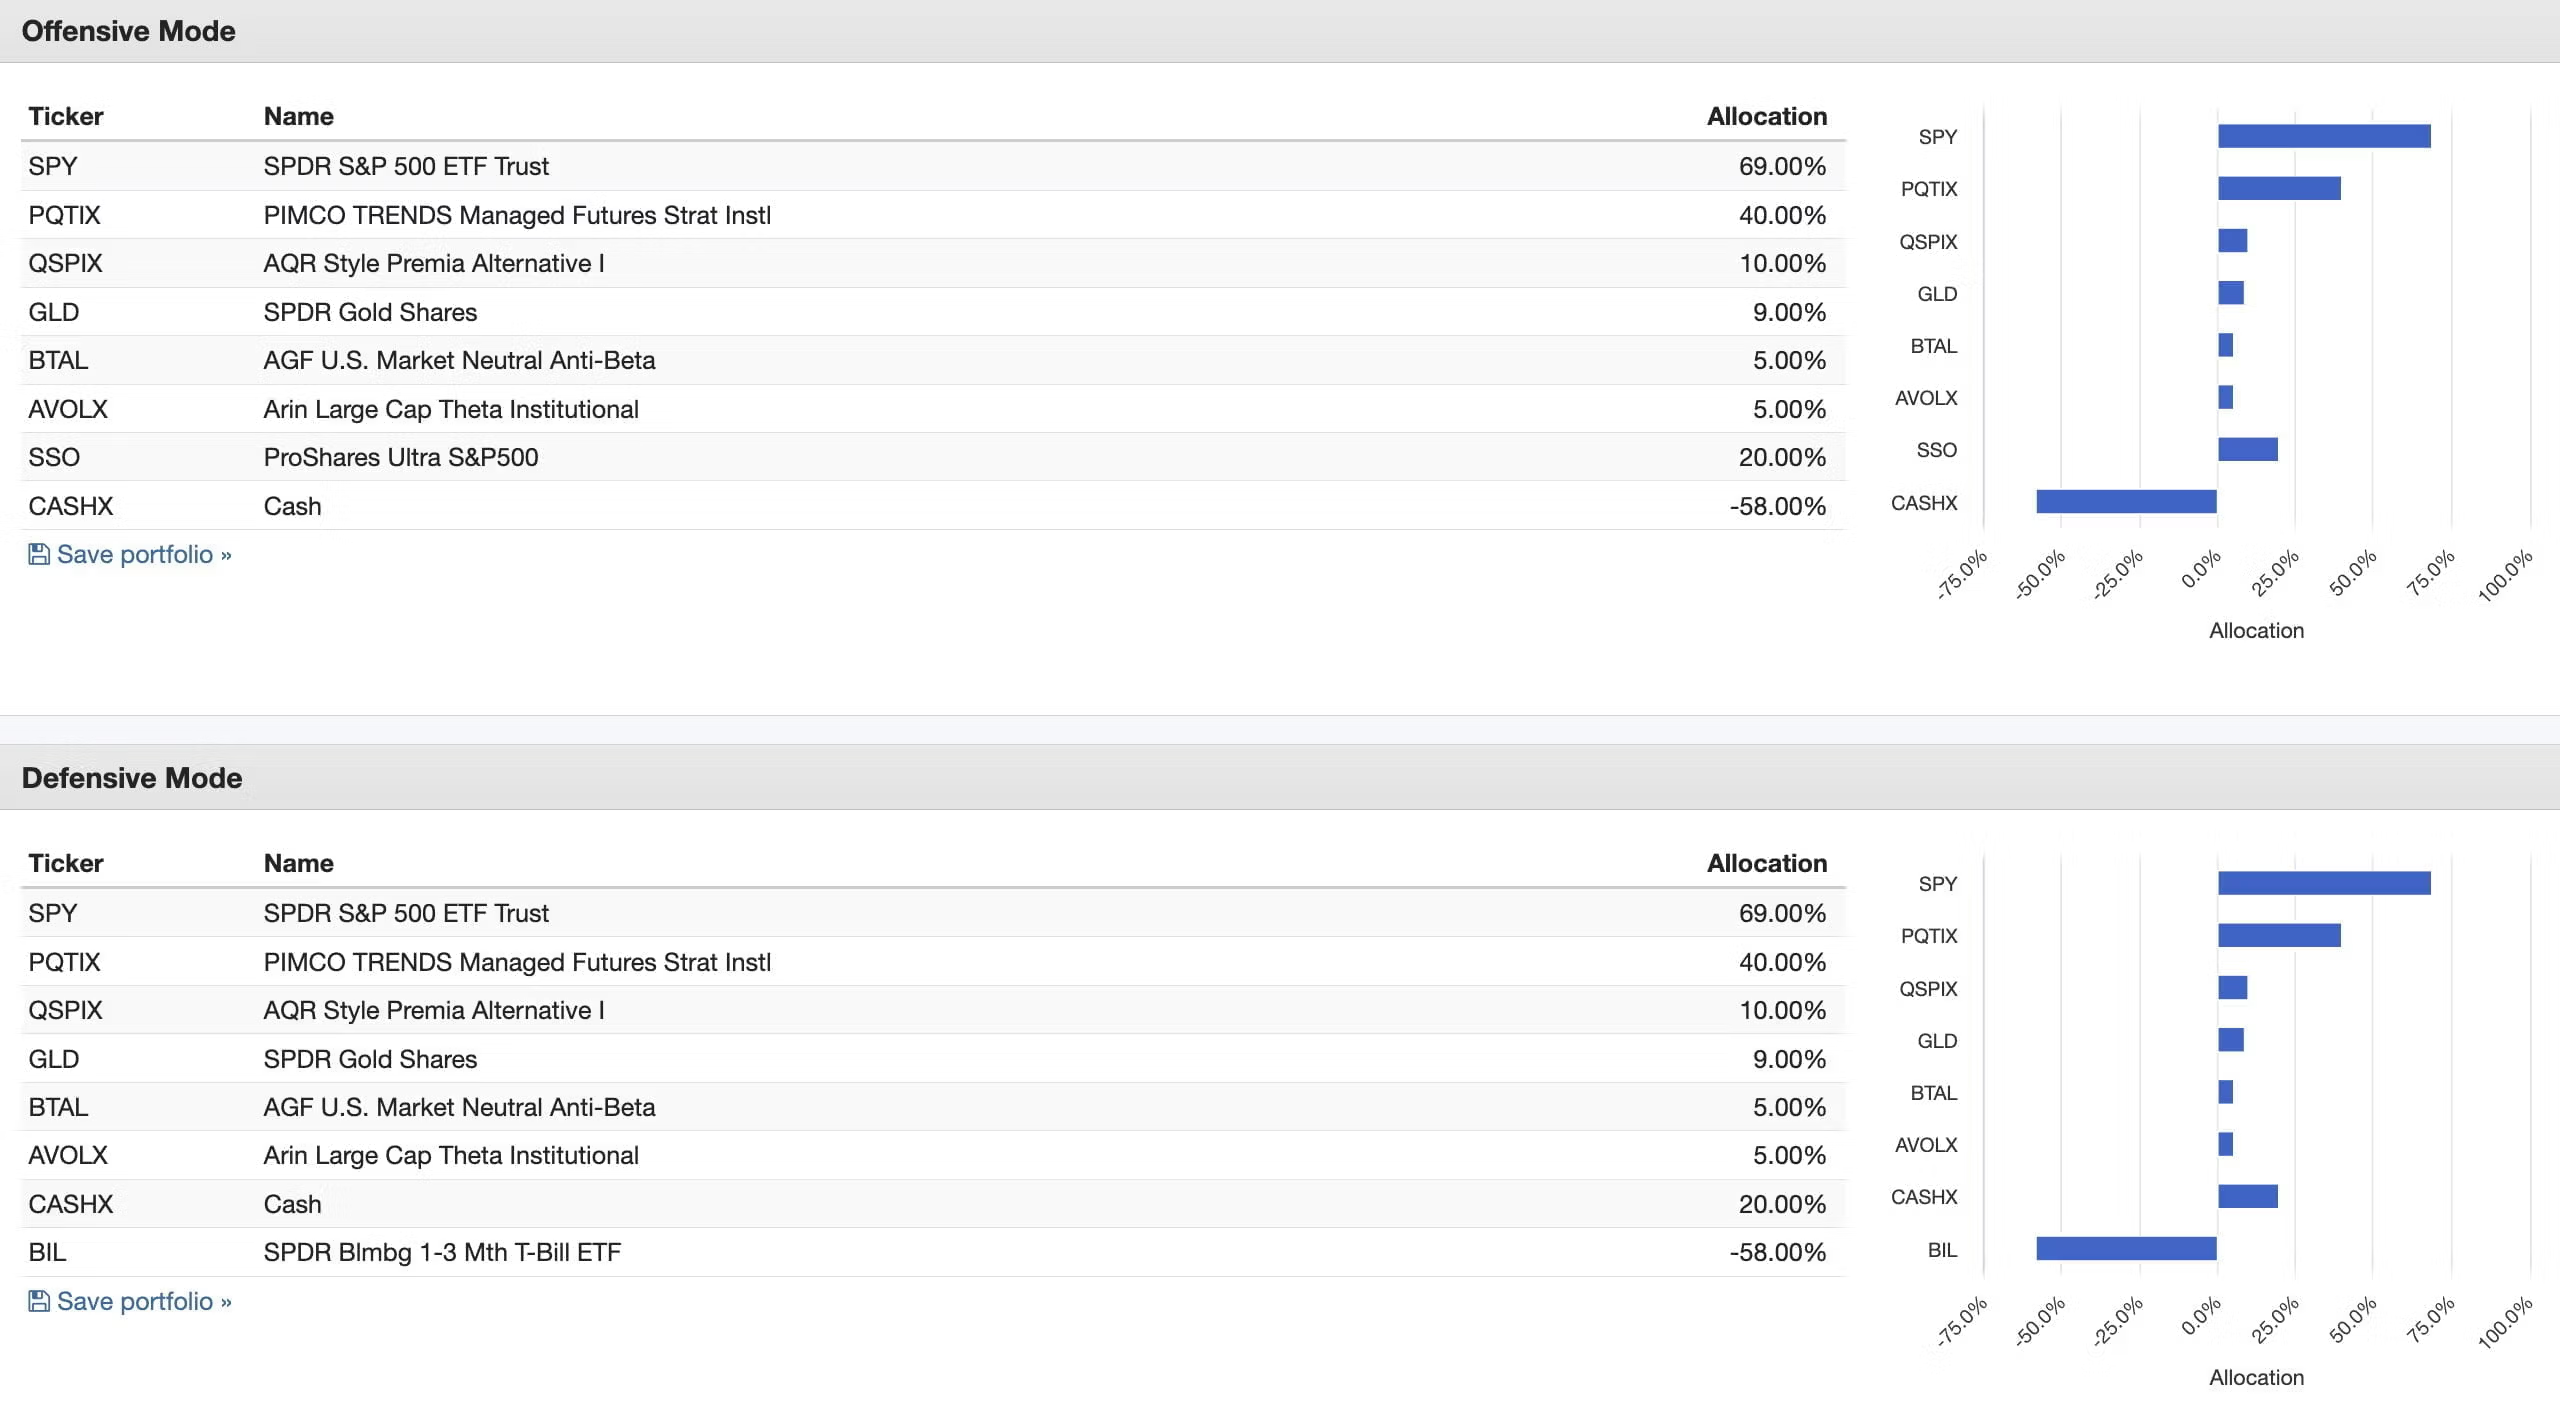
SPY Hunter Portfolio Exposures
Offensive Mode
109% US Equities
40% Managed Futures
10% Style Premia
9% Gold
5% Market Neutral Anti-Beta
5% OTM Put
Defensive Mode
69% US Equities
40% Managed Futures
20% Cash
10% Style Premia
9% Gold
5% Market Neutral Anti-Beta
5% OTM Put
This portfolio hinges on the split personality of HCMT ETF which offers investors an all in or nothing approach (200% US equities or 100% Cash based on trend).
When in offensive mode we’ve stretched our equities beyond the 100% threshold (109% to be precise) and added a diverse range of diversifiers.
In defensive mode SPY Hunter retreats to the safety of 69% equities and has defensive assets such as managed futures and style premia (with absolute return potential), cash and two different tail-risk strategies.
Hence, we’re going all in on attempting to outperform on both sides of the equation: offensive AND defensive
Canvas: 177% Offensive or 157% Defensive
Benchmark: SPY ETF (S&P 500)
You know what time it is!
Bring on the backtest…
Creating an offensive and defensive mode backtest wasn’t the easiest of challenges!
What you’ll notice is PQTIX representing the managed futures of RSST, AQR style premia covering SPQ (with its multi-strategy QIS approach) and SSO representing 2X HCMT.
In order to keep CASHX in the defensive portfolio I had to use BIL to simulate borrowing costs.
I’m not sure if this is the best way to do things. If you have suggestions for an improvement I’m all ears!
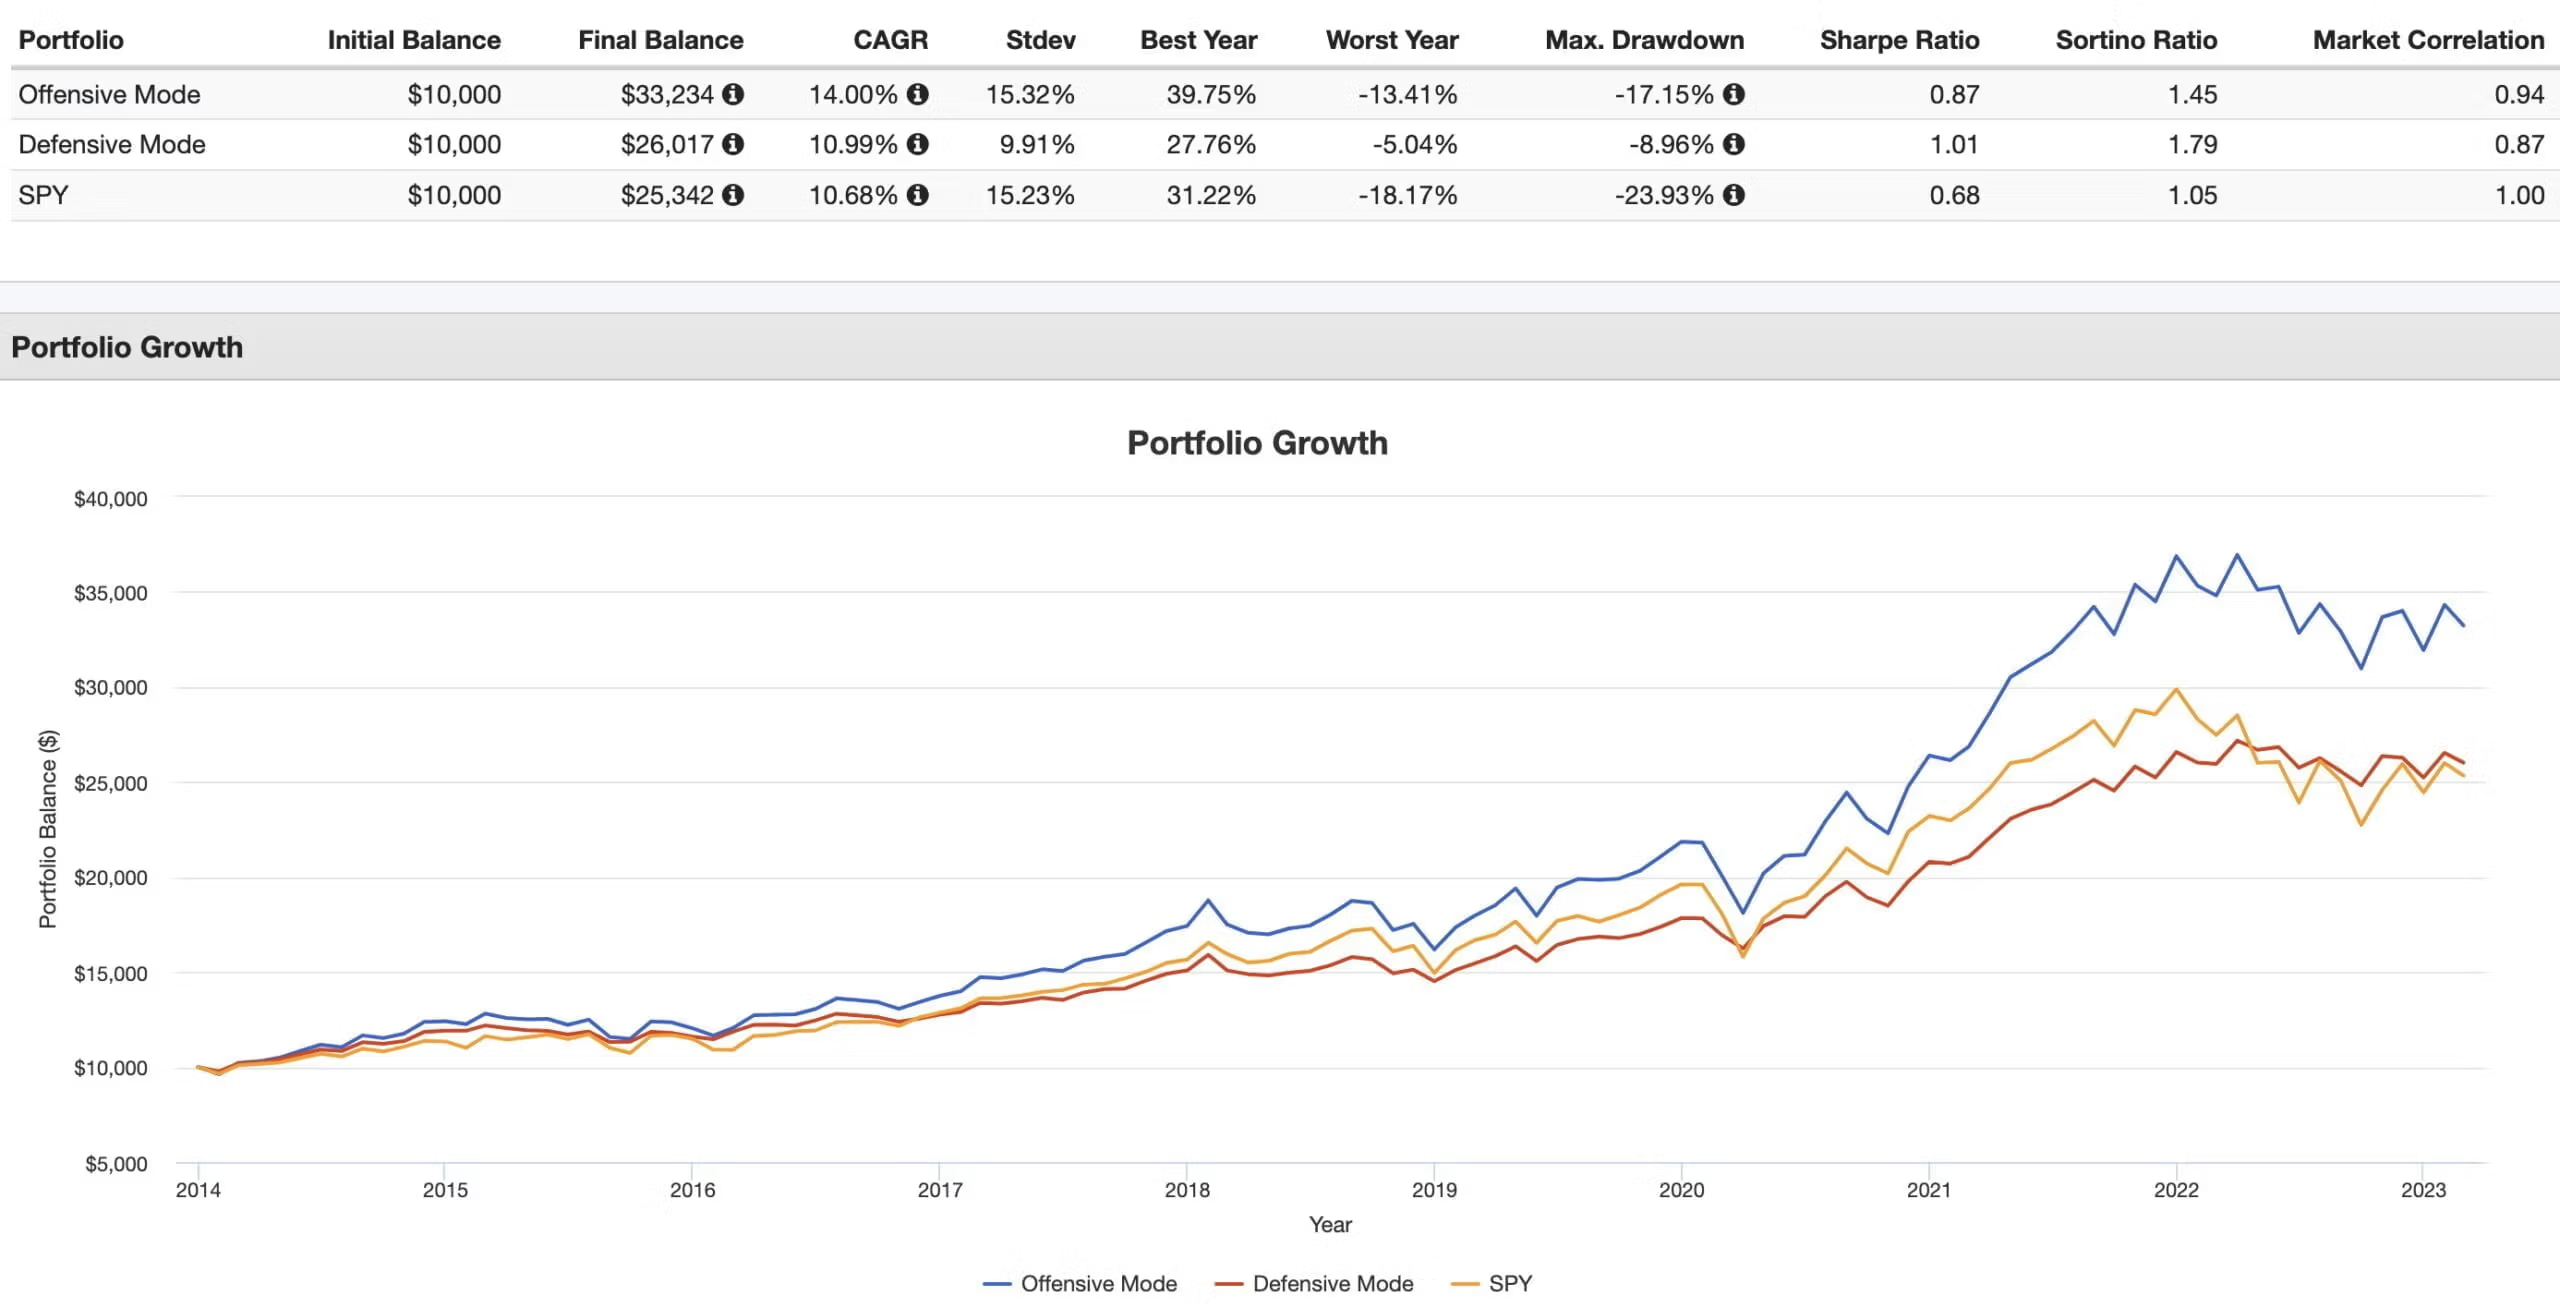
CAGR: 14.00% vs 10.99% vs 10.68%
RISK: 15.32% vs 9.91 vs 15.23%
Worst Year: -13.41% vs -5.04% vs -18.17%
Max DD: -17.15% vs -8.96% vs -23.98%
Sharpe: 0.87 vs 1.01 vs 0.68
Sortino: 1.45 vs 1.79 vs 1.05
Correlation: 0.94 vs 0.87 vs 1.00
I have to admit the results here totally melted my brain.
I DID NOT think that in defensive mode this strategy could potentially outperform SPY on its own.
And it did.
Wow!
Basically, this relieves pressure on HCMT fund to tactically tune itself in a manner that is the winning difference.
It’s more like the whipping cream and cherries on top of the cake.
It’s the victory lap.
In offensive mode we can probably expect similar volatility to SPY with significant outperformance potential.
In defensive mode, we’re looking more at 60/40 levels of volatility with potentially better defense.
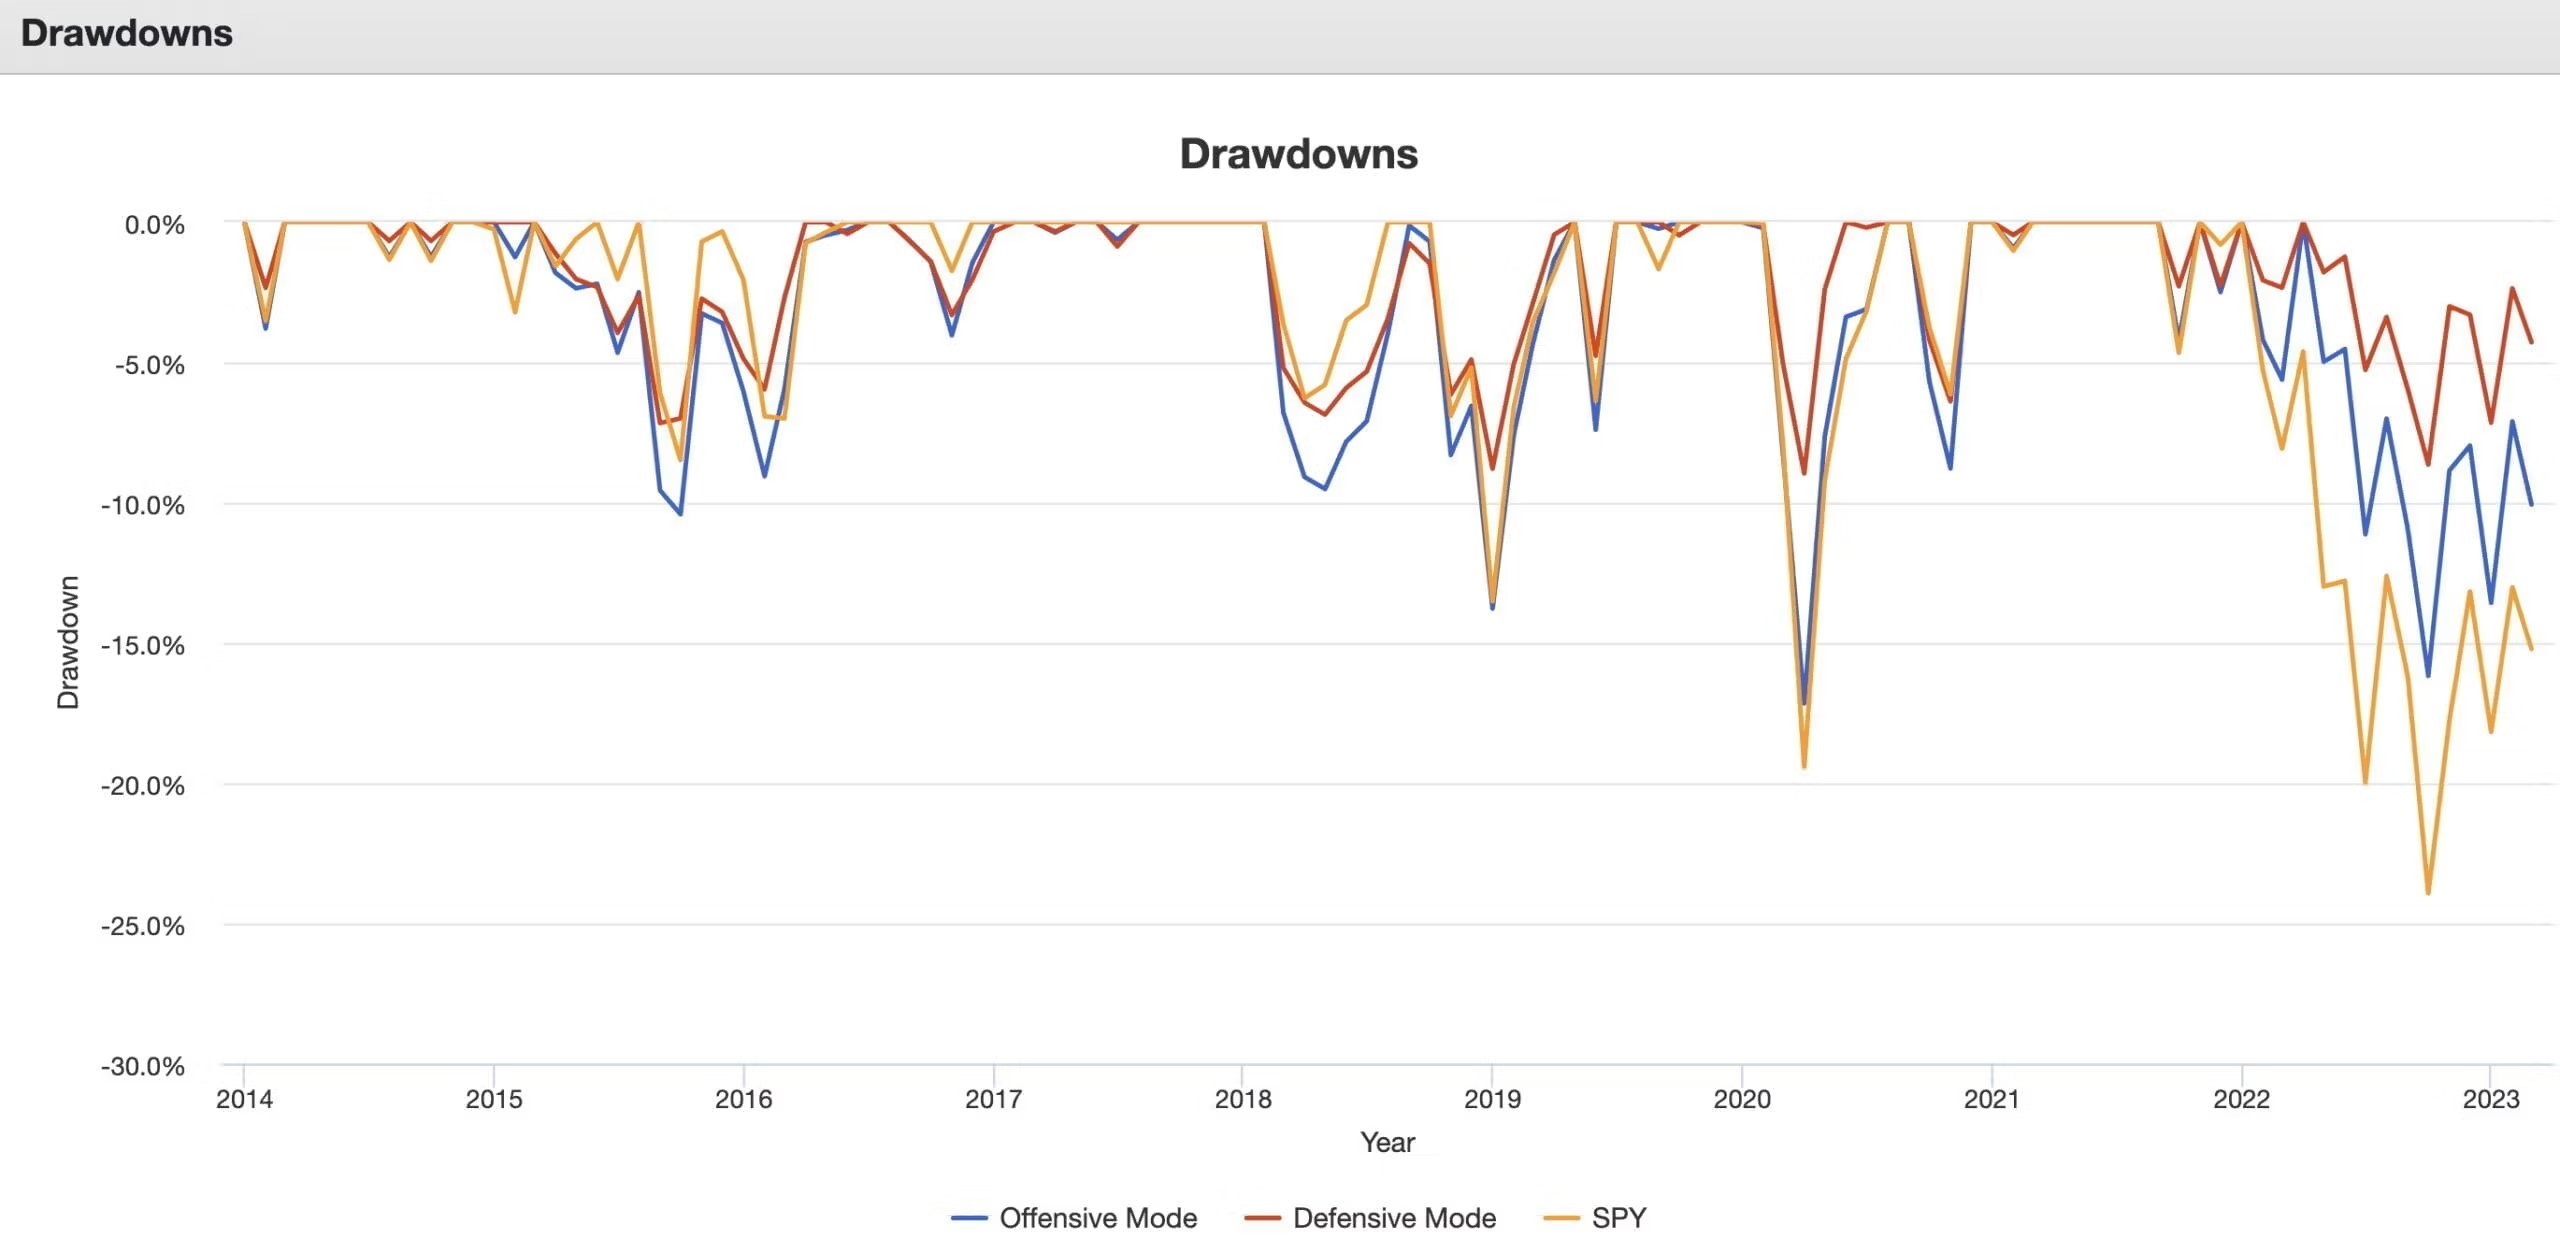
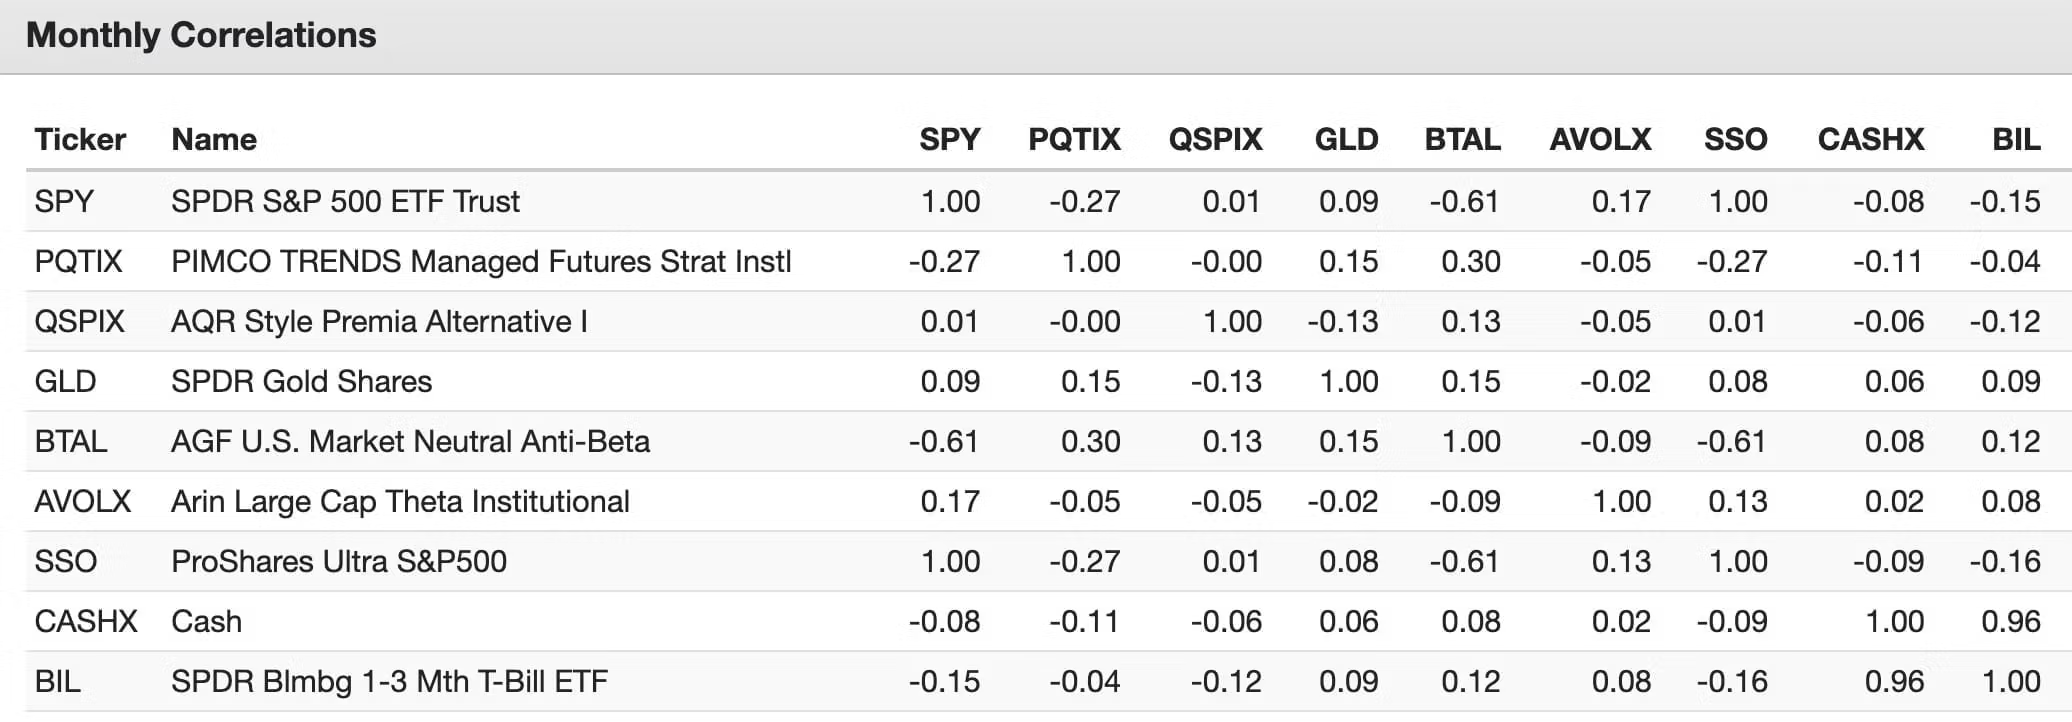
And here are the correlations between all of the strategies.
I’d love to test this with live funds but SPQ ETF is super wet behind the ears.
I’ll circle back later to do that when it makes more sense.

Max D Triple P
Next up we’ve got Max D Triple P!
I wish there was some clever story behind this portfolio but there simply isn’t.
It’s just the Maximum Diversification Picture Perfect Portfolio (Max D Triple P) which attempts to offer investors the typical exposure of a 60/40 portfolio with a dessert style sampler size of alternatives added to its back vis-a-vis pack-mule style.
Max D Triple P Funds
20% RSSB – Return Stacked Global Stocks & Bonds ETF
20% RSBT – Return Stacked Bonds & Managed Futures ETF
20% SPQ – Simplify US Equity PLUS QIS ETF
10% RSST – Return Stacked US Stocks & Managed Futures ETF
10% GDE – WisdomTree Efficient Gold Plus Equity Fund
4% ARB – AltShares Merger Arbitrage ETF
4% EQLS – Simplify Market Neutral Equity Long Short ETF
4% SVOL – Simplify Volatility Premium ETF
4% CAOS – Alpha Architect Tail Risk ETF
4% FBTC – Fidelity Advantage Bitcoin ETF
Max D Triple P Portfolio Exposures
59% Equities
40% Bonds
30% Managed Futures
10% Multi-Strategy QIS
9% Gold
4% Arbitrage
4% Market Neutral Equities
4% Short Vol
4% OTM Put
4% Bitcoin

I kind of like that this portfolio doesn’t quite hit the 60/40 targeted configurations.
Sticklers may be pulling their hair out over the 59% equities (versus the 60% targeted allocation) but from my point of view that’s just freakin’ hilarious.
Also, feel free to swap out Bitcoin for something else (FLSP / BTAL / etc).
I know that is a deal breaker for some.
The idea is to just dip our toes in the cryptocurrency waters without any shitcoin residue as opposed to taking the polar plunge.
I like that we’re not relying on any one particular alternative strategy to do all of the heavy lifting.
This is a 10 fund / 10 strategy portfolio!
It’s the most complicated of them all but offers a plethora of unique strategies.
Canvas: 168%
Benchmark: 60/40 Portfolio
I’m going to refrain from doing a simulated backtest with this portfolio because we’re up to nearly 3500 words at this point!
I’ll circle back with a live fund backtest sometime next year.

The Honey Badger
The Honey Badger is pound for pound one of the toughest customers on this planet.
Have you seen what it is capable of doing?
source: czg123 on YouTube
It’s our spirit animal attempt to tackle the biggest shortcoming of an all-equity portfolio.
Those jaw-dropping drawdowns!
Instead of being left to its own devices with the potential to be blindsided by a -50% 2008 tackle it attempts to better manage risk and volatility without compromising returns.
Unlike other portfolios we’re not going to cheat by adding uncorrelated asset classes and strategies.
Here we’ve got to do things with equity only strategies: long, long-short, market-neural and tactical approaches.

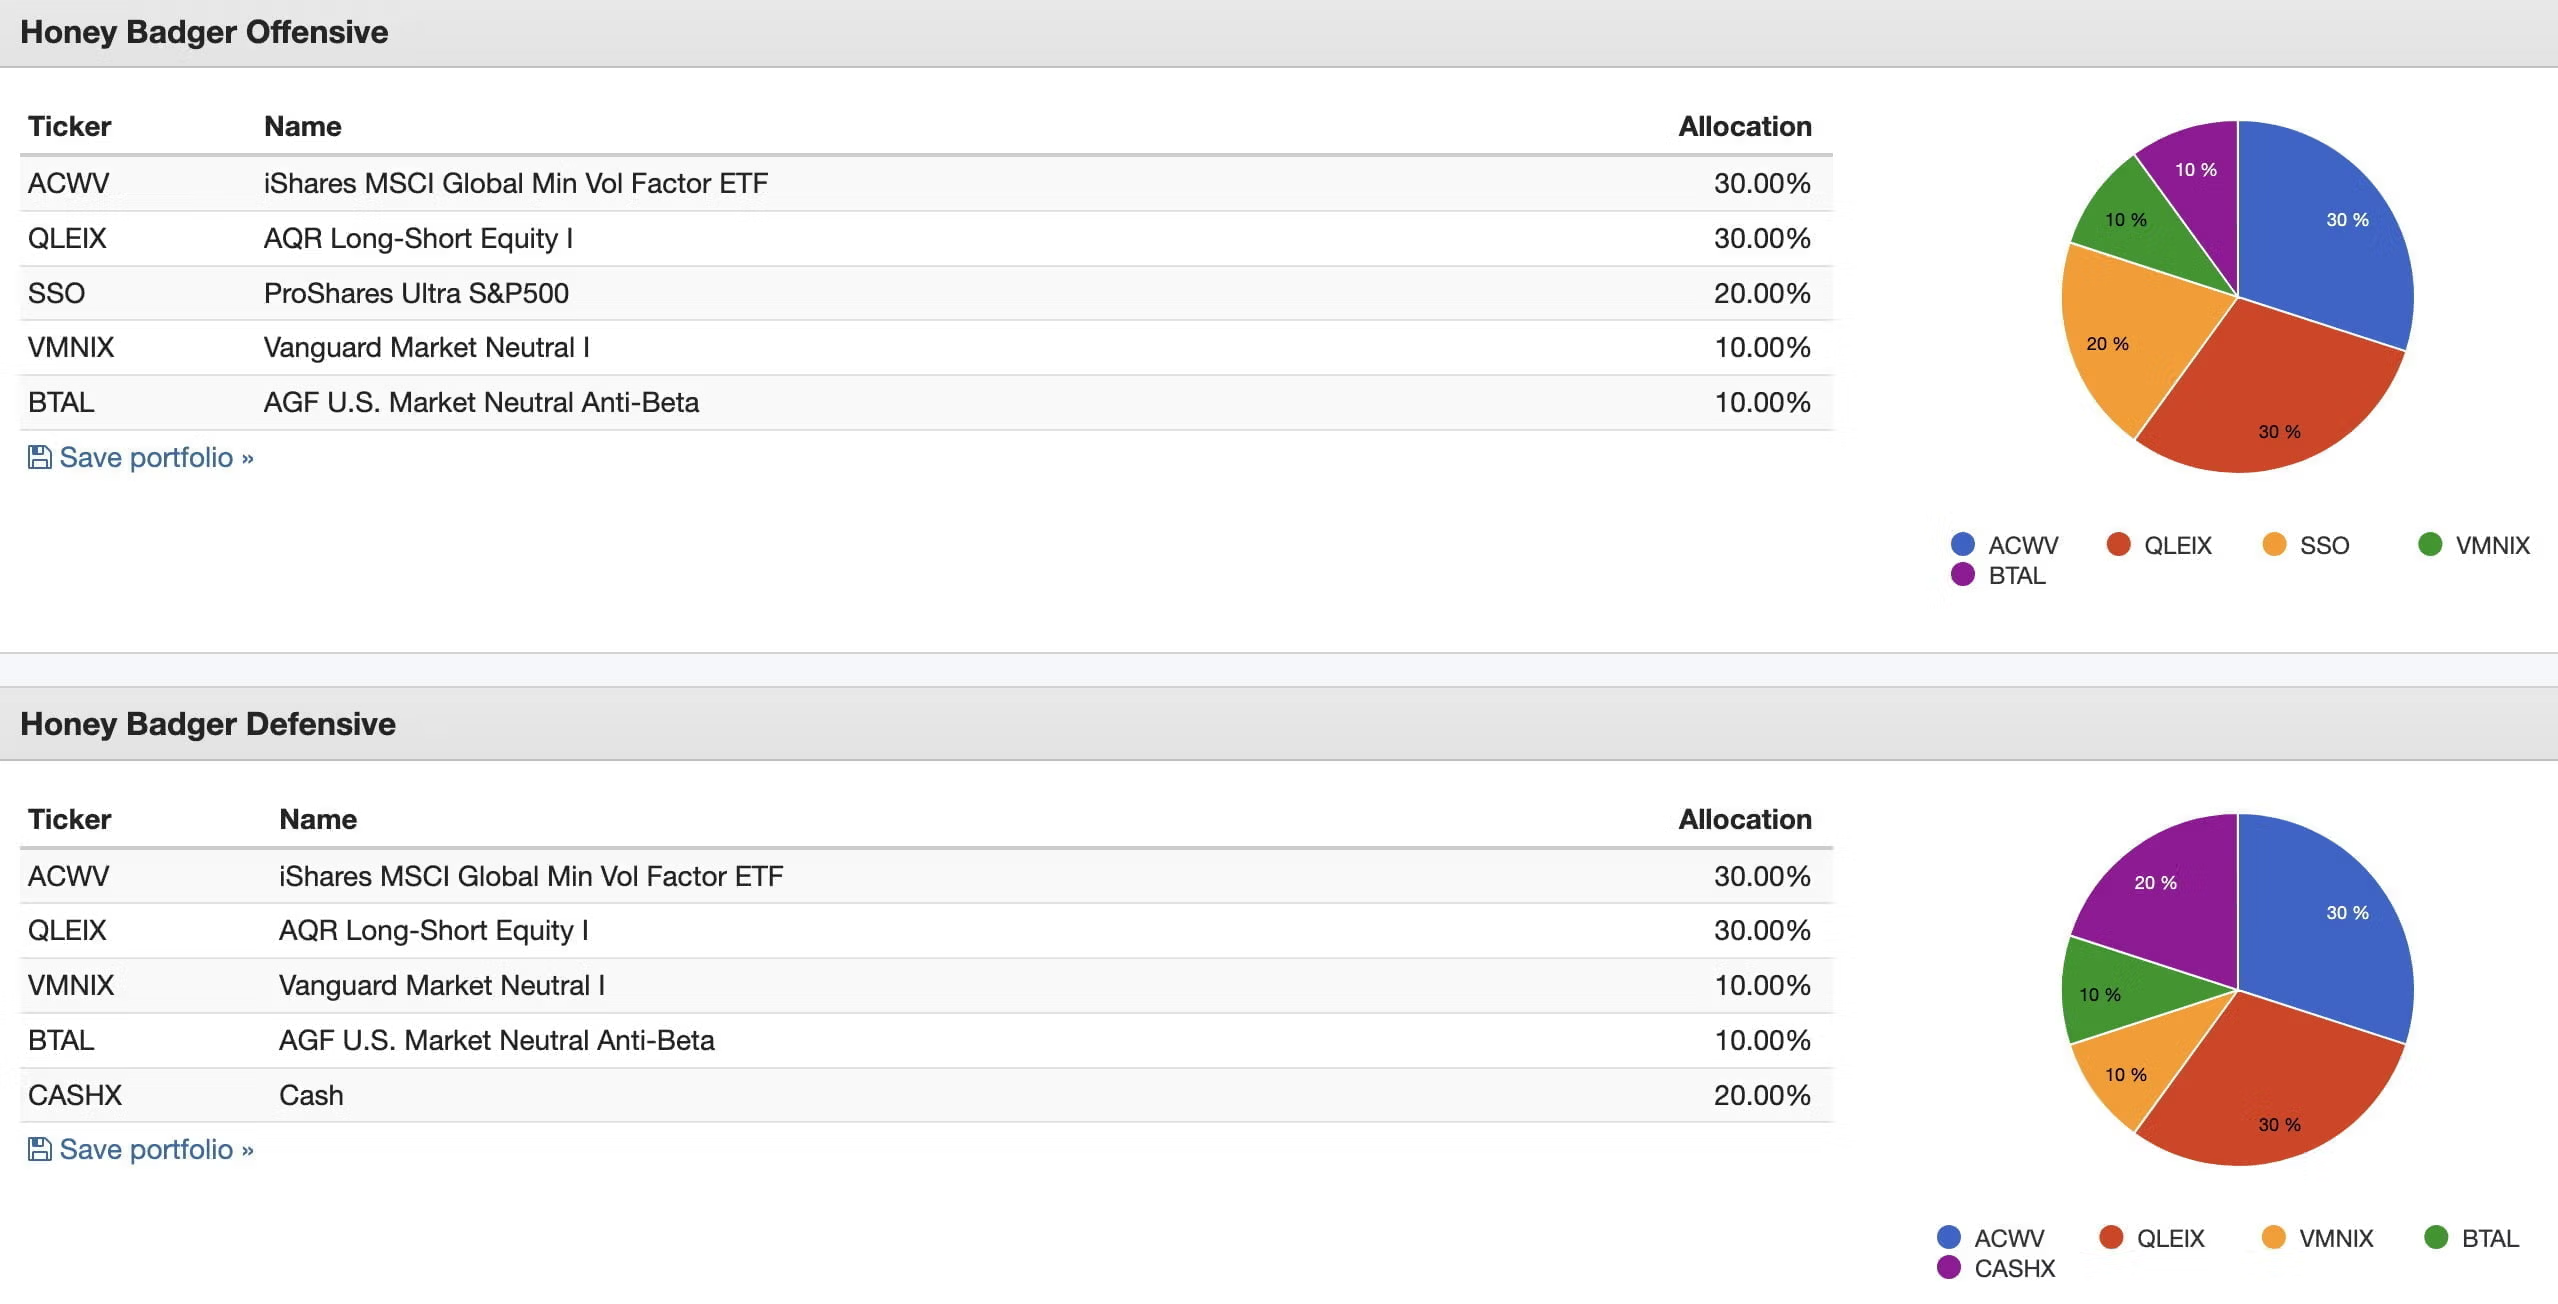
The Honey Badger Funds
30% ACWV – iShares MSCI Global Min Vol Factor ETF
30% QLEIX – AQR Long-Short Equity Fund
20% HCMT – Direxion HCM Tactical Enhanced US Equity Strategy ETF
10% BTAL – AGF US Market Neutral Anti Beta Fund
10% VMNIX – Vanguard Market Neutral Fund
Here we’re choosing pound for pound (er…I mean return per unit of risk) two of the top equity strategies.
Min Vol and L/S equity.
Between the two of them we’re diversifying and improving our risk adjusted rates of returns.
Let’s compare the backtest results to our benchmark VT.
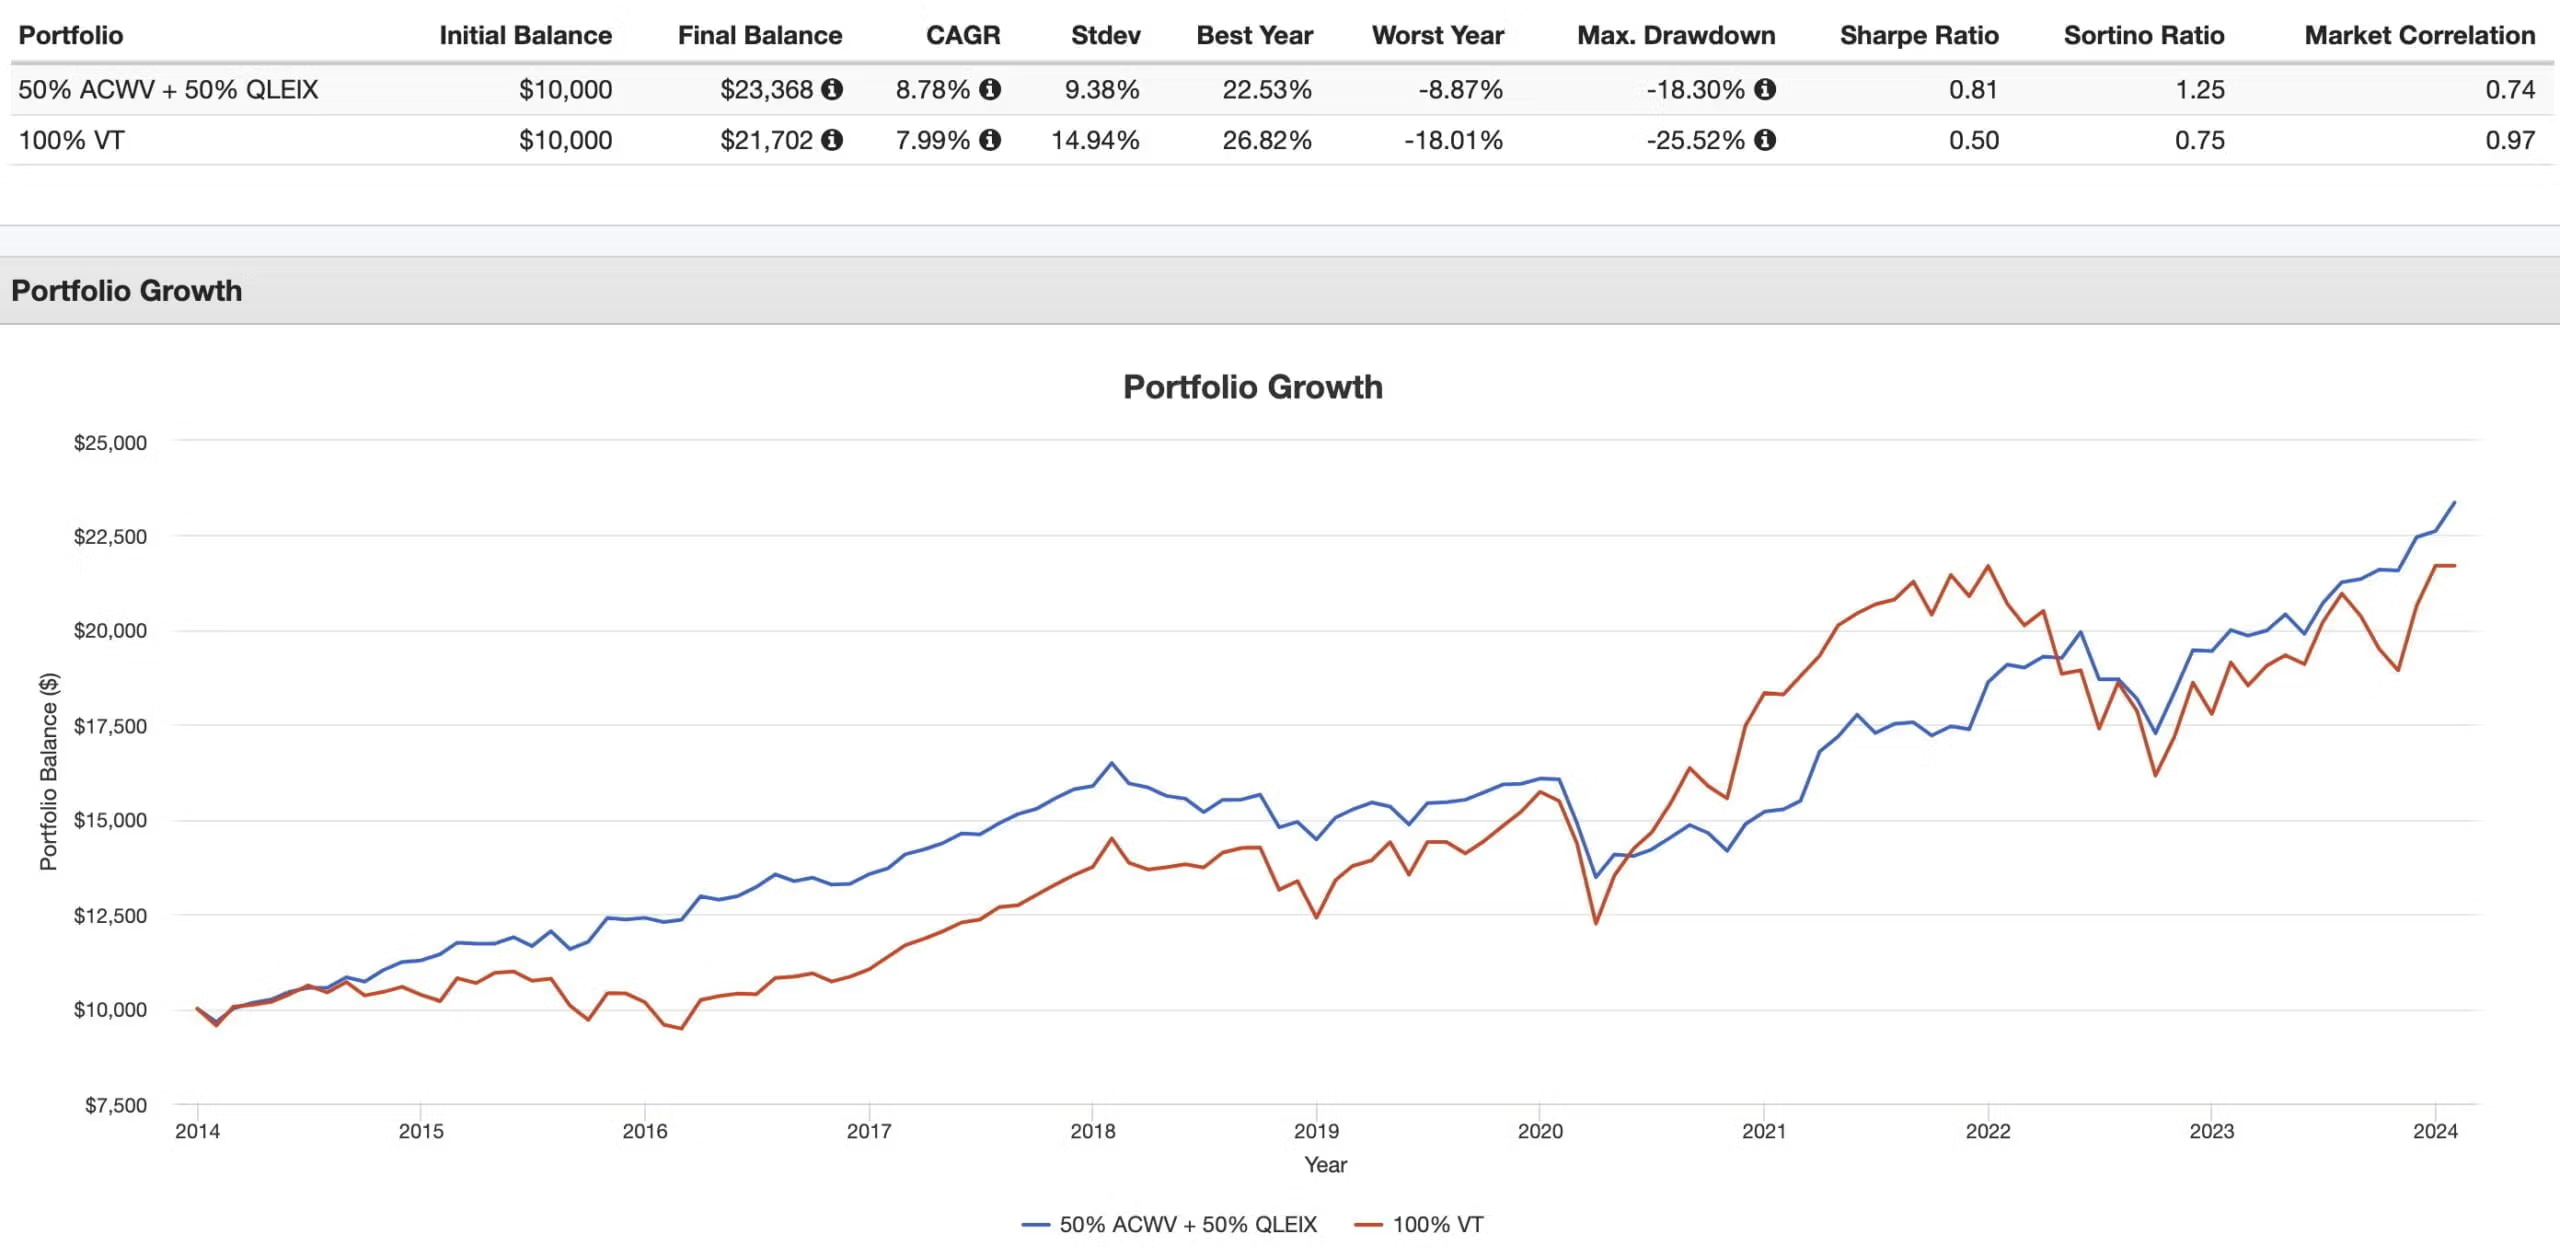
We’ve more than achieved our goals right here!
We’ve shaved down volatility by nearly 500 bps and improved our Sortino Ratio by 50 bps!
Our goal with this portfolio isn’t outperformance; it’s better risked adjusted performance.
Why not just be over and done with it?
Because I still think we can slightly improve returns, risk management and the absolute return potential of this portfolio.
In order to do this, we’re bringing back our tactical friend HCMT into the mix.
We’re not using it to boost our offensive prowess but instead to buy ourselves more defensive diversification by adding absolute return M/N style funds.
Let’s test that out.
We’re using SSO ETF to simulate the results of HCMT when its in offensive mode and CASHX for when it reverts to defensive mode.
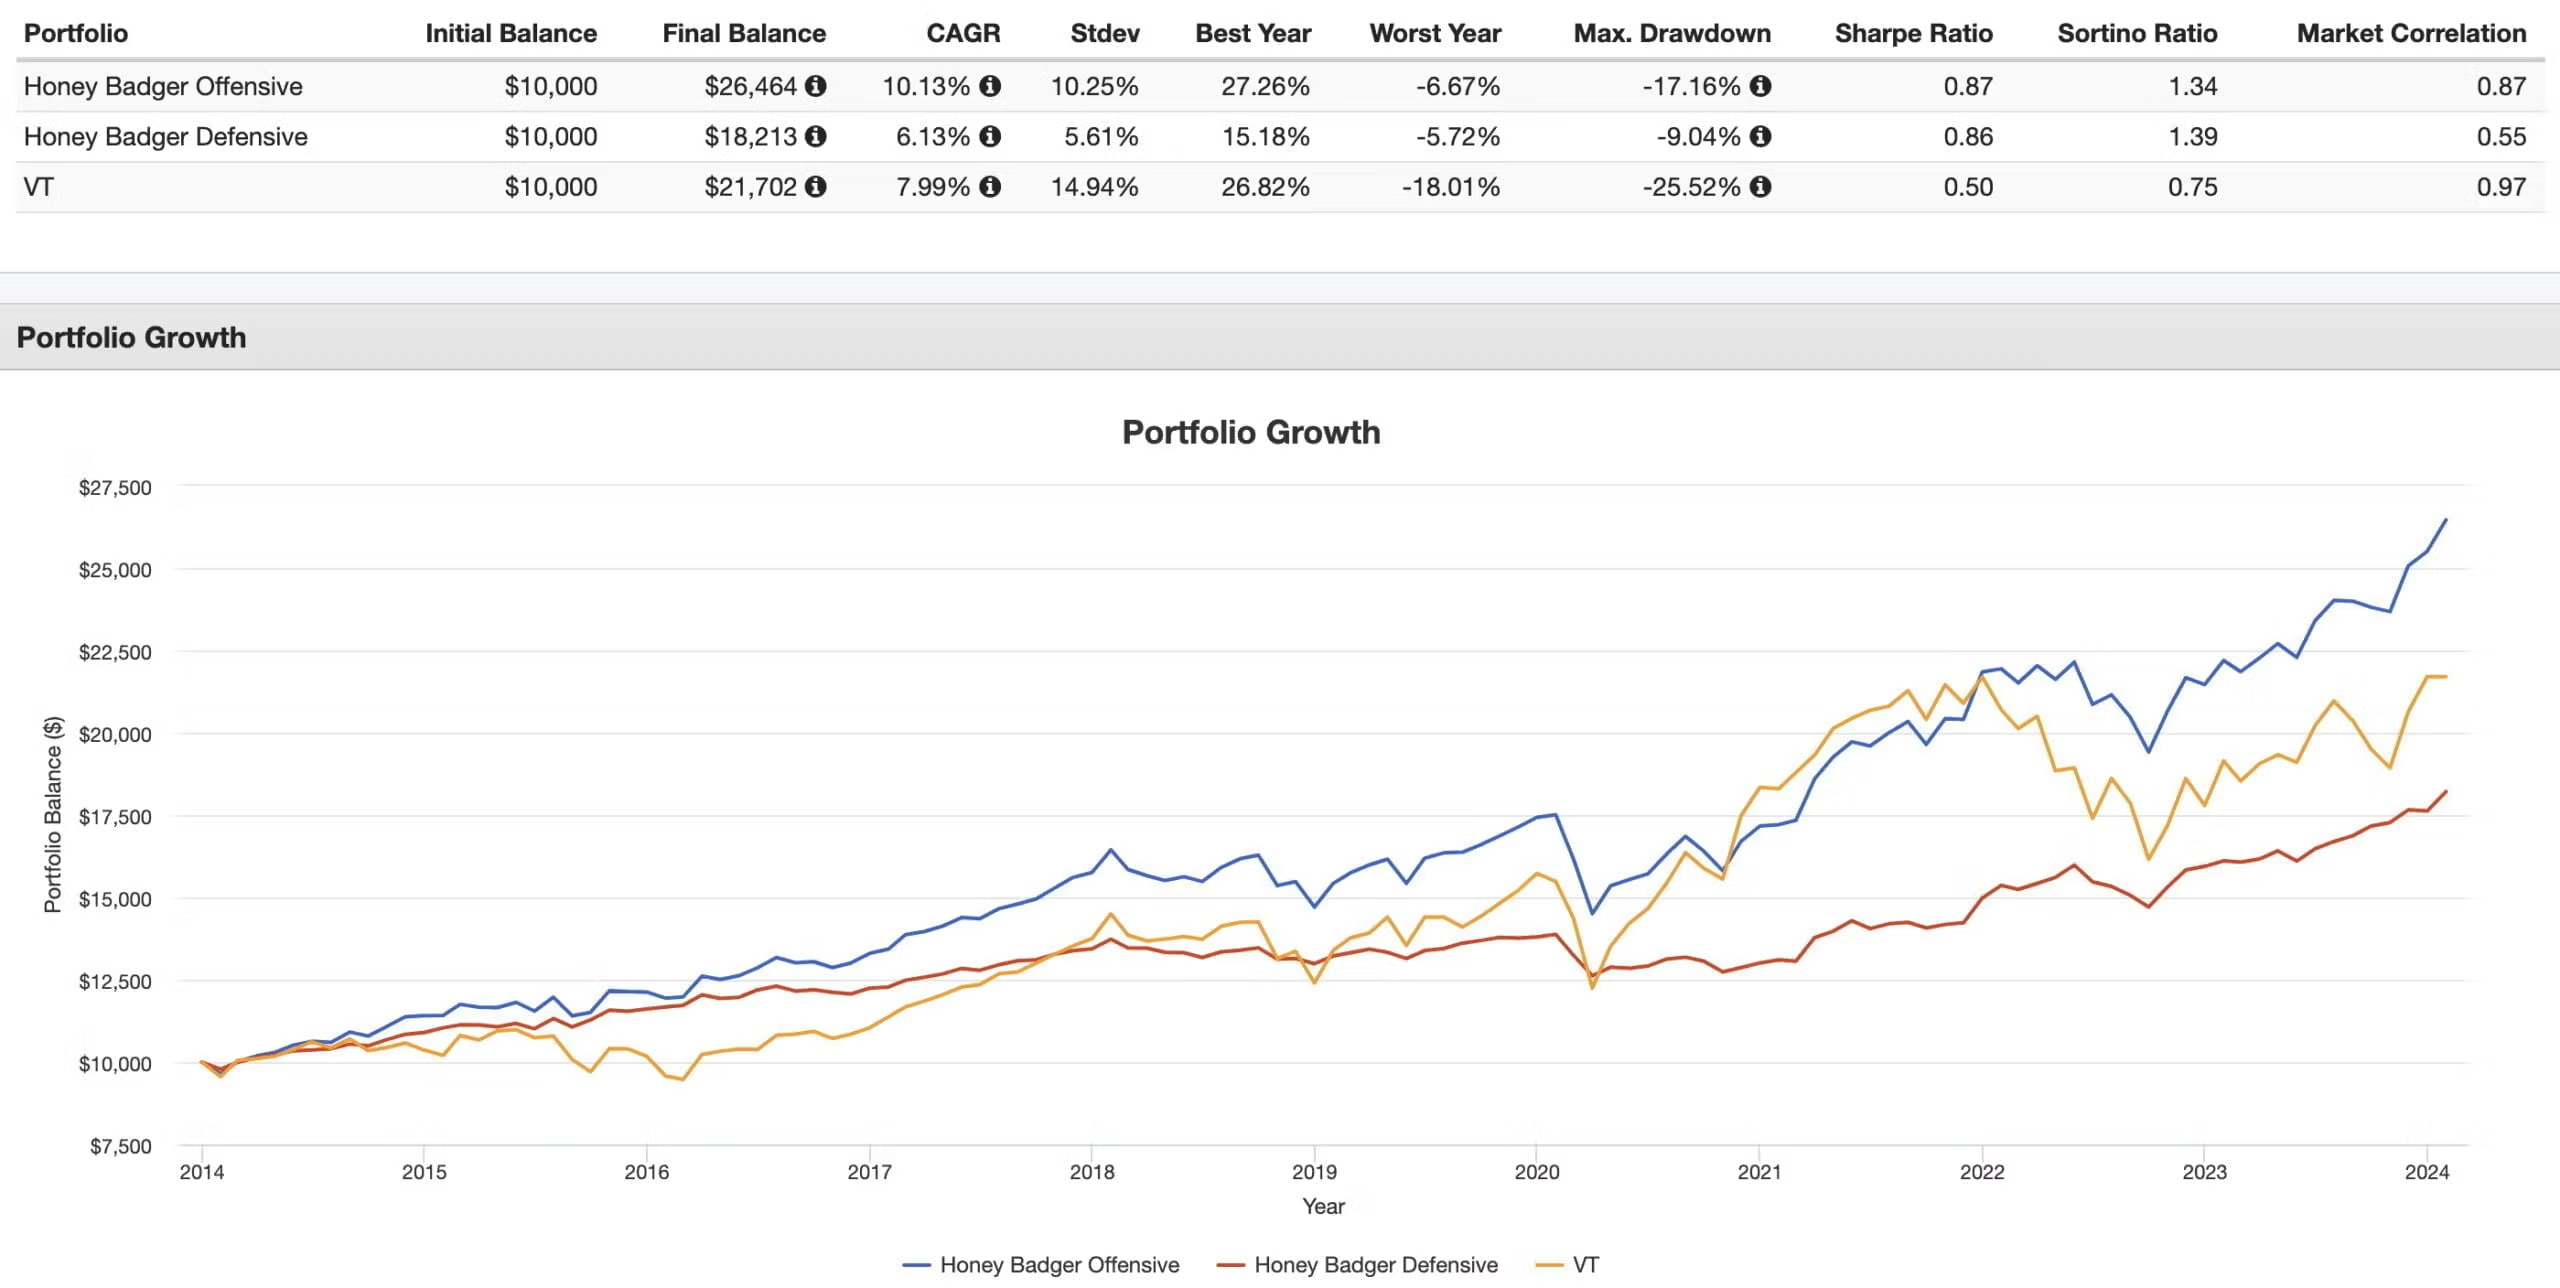
CAGR: 10.13% vs 6.13% vs 7.99%
RISK: 10.25% vs 5.61% vs 14.94%
Worst Year: -6.67% vs -5.72% vs -18.01%
Max DD: -17.16% vs -9.04% vs -25.52%
Sharpe: 0.87 vs 0.86 vs 0.50
Sortino: 1.34 vs 1.39 vs 0.75
Correlations: 0.87 vs 0.55 vs 0.97
That’s more like it! We’ve boosted risk adjusted rates of returns with this upgrade.
I’m quite pleased with the results.
This portfolio is doing what it is supposed to (vol management: 10.25% to 5.61%) whilst offering better risk adjusted rates of returns (Sortino: 1.34 to 1.39).
Now let’s see how it handles drawdowns.

The Honey Badger is playing some stingy defense!
Especially in defensive mode.
We’ll take it.
Now let’s explore correlations between funds to see the magic of diversification.
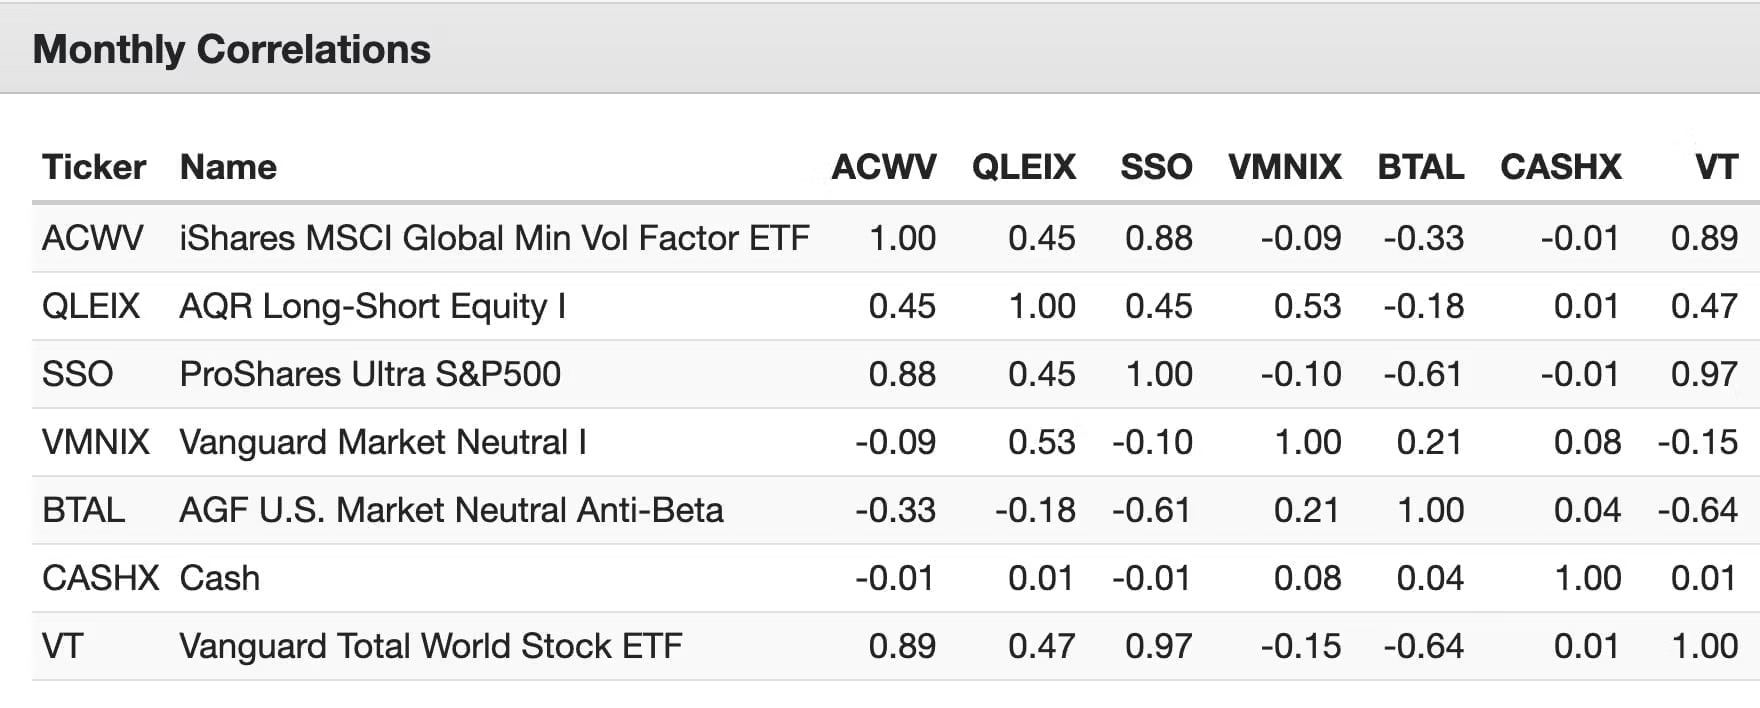
Things work so well with this portfolio because of the correlations of these funds.
It’s why I keep harping on about diversification.

The Contrarian
Have you ever imagined blowing your benchmark to smithereens and pursuing portfolio construction without a roadmap?
I sure have!
And this is my attempt to shake the shackles and break free from it all.
Libre!
Instead of being hyper-fixated on long-only stocks and bonds we’ll do something completely different.
Our primary strategy will feature a fund that offers managed futures as its core strategy.
Our secondary strategy will be a long-short equity fund.
Our third and fourth strategies will include a diverse mix of alternatives from two of the best in the game!
AQR and Stone Ridge.
This, my friends, is the Contrarian Portfolio.
Let’s go!

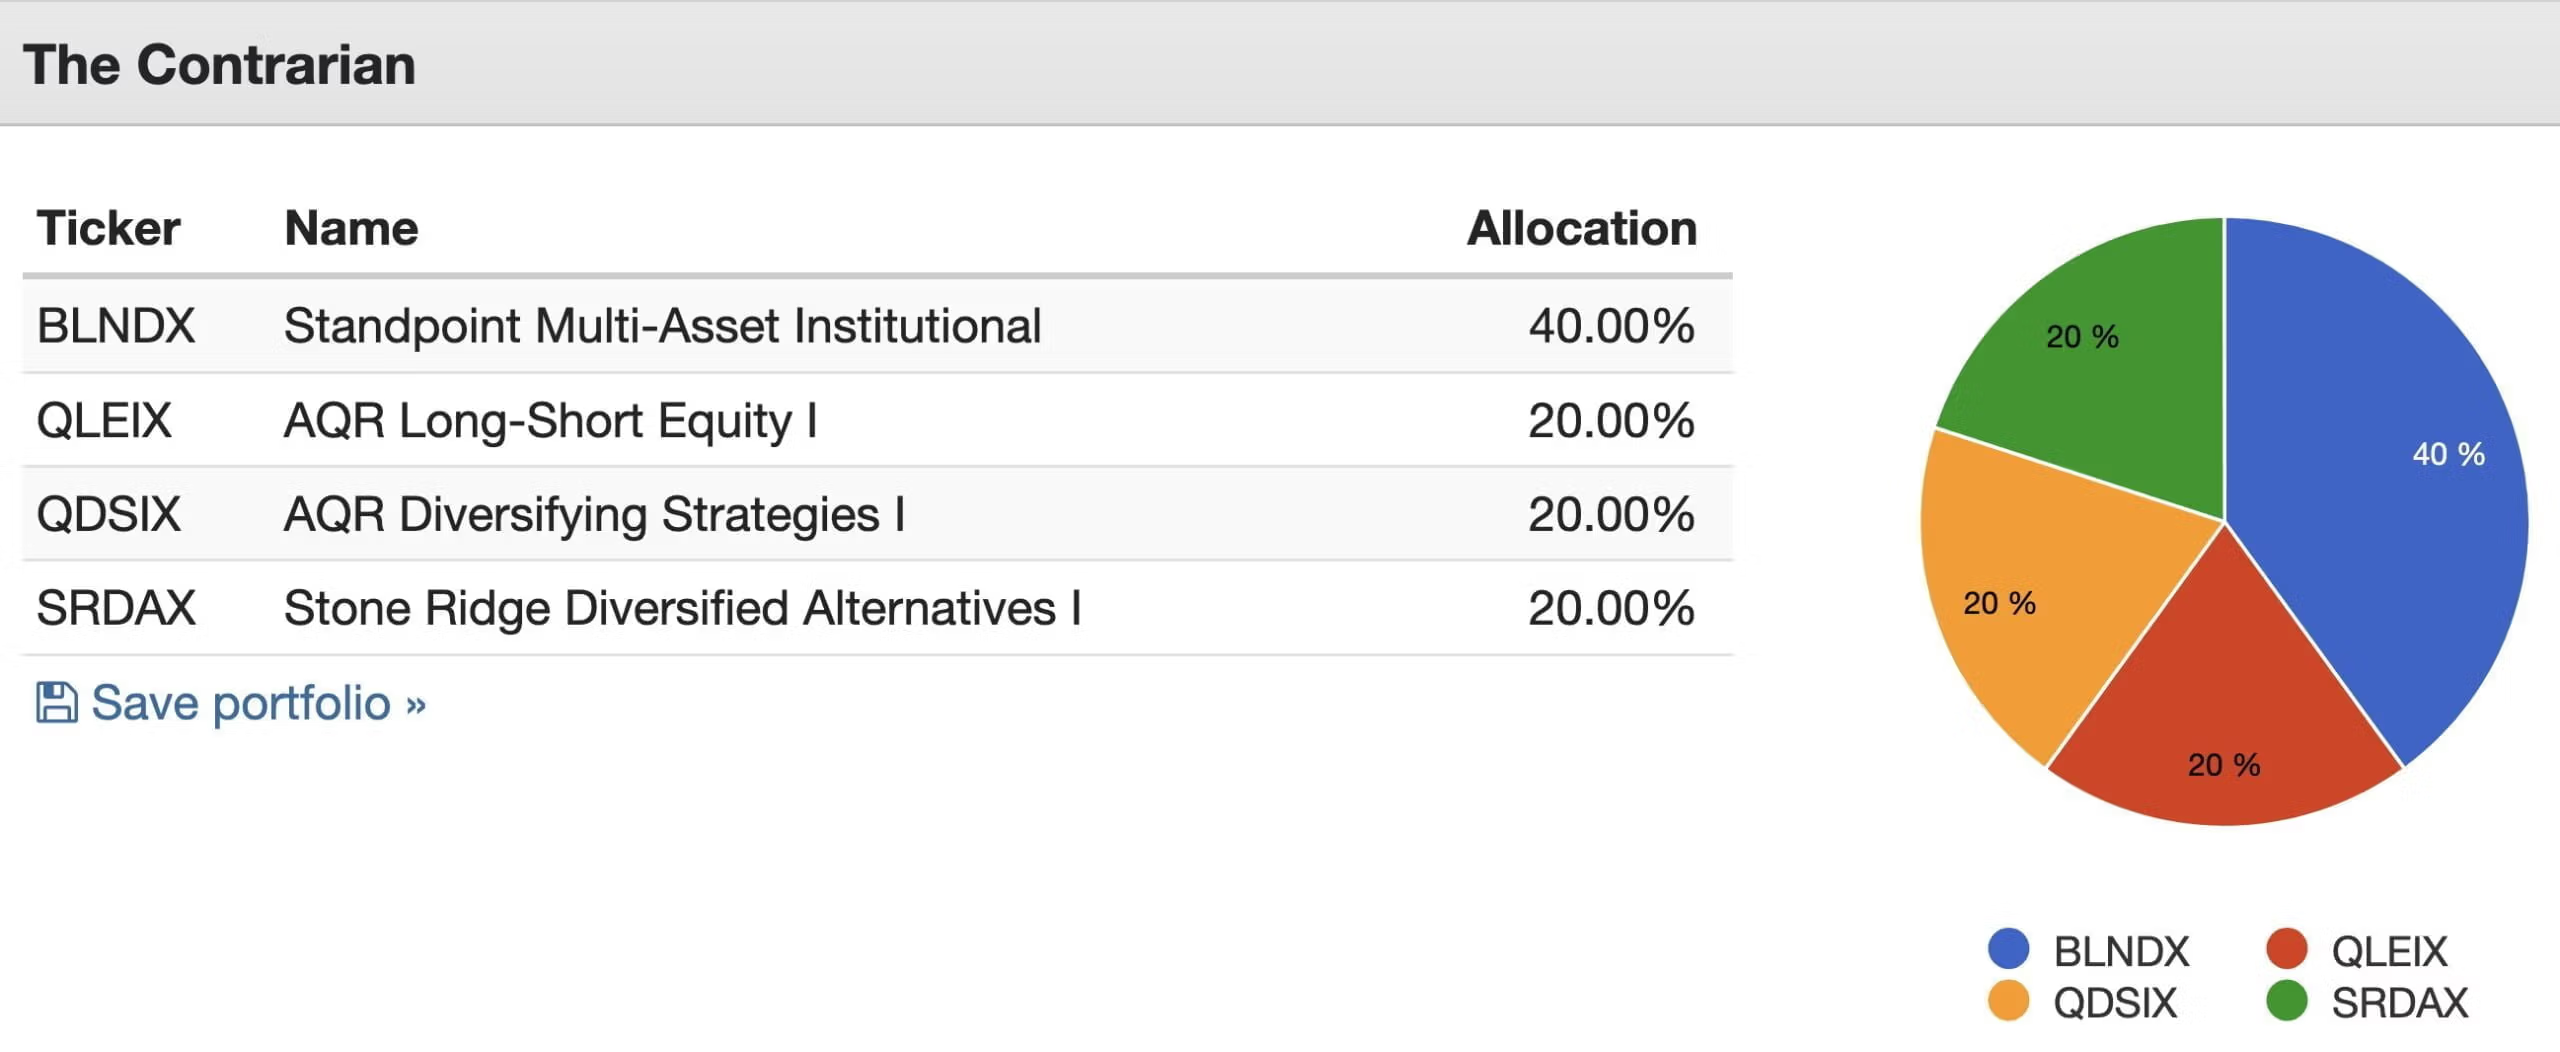
The Contrarian
40% BLNDX – Standpoint Multi-Asset Fund
20% QLEIX – AQR Long-Short Equity Fund
20% QDSIX – AQR Diversifying Strategies Fund
20% SRDAX – Stone Ridge Diversified Alternatives Fund
Here we’re making the most of capital efficiency to bring you managed futures, long-short equity, long-only equity and two different 6-1 alternative strategies.
It’s as diverse of a portfolio as you can put together with only four funds.
And it has the most impressive backtest of them all.
Here is how it has performed as far as we can roll back the clock.
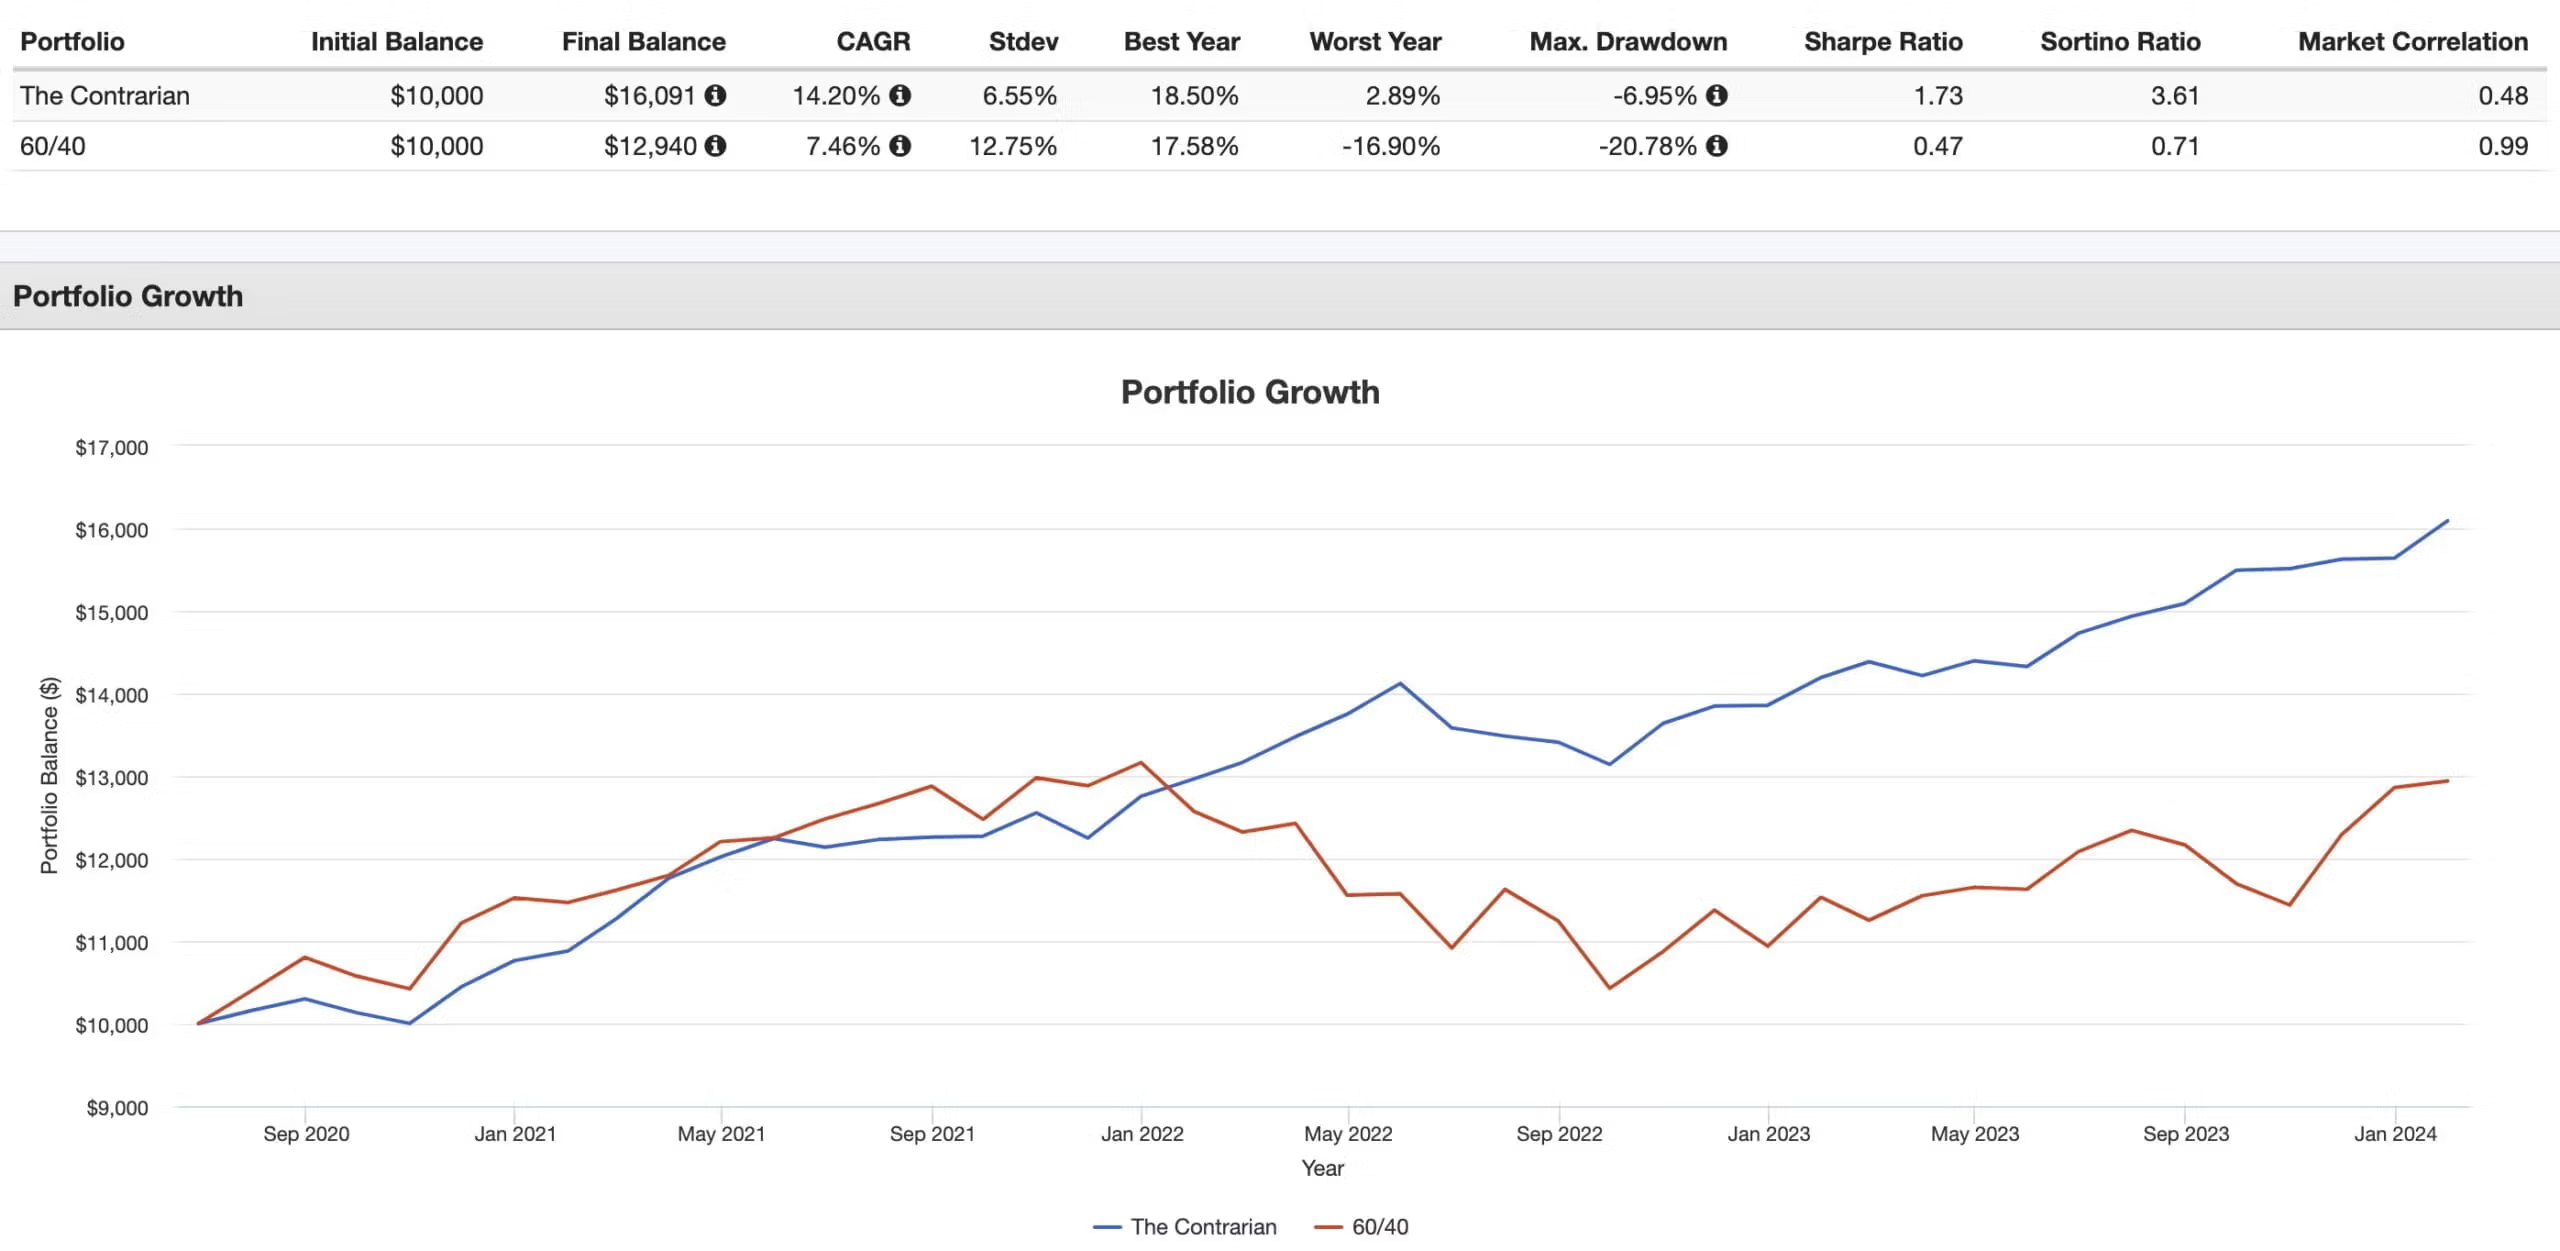
I know I said this portfolio has no benchmarks…but does that mean we can’t delight in its massacre over the 60/40?
Do I think we’re in store for 14.20% CAGR and a 3.61 Sortino moving forward?
No, definitely not.
But what this portfolio has shown is that it can thrive during periods of market turmoil and stress.
It’s certainly ruffled its contrarian feathers.
I’m anticipating excellent risk adjusted rates of returns on a long-term basis with all of the diversification we’ve got under one hood.
I’m personally looking forward to seeing its results in the future.
The Canucklehead
Did you know Canuck is slang for Canadian?
And well who could resist adding ‘head’ to the equation to compete with the Bogleheads.
Hence, the Canucklehead.
This one is for us Canadians.
We have access to US listed ETFs (not mutual funds) but we’ve got some great funds of our own north of the border!
Let’s show them off.

The Canucklehead
40% AOFT – Auspice One Fund Trust
15% HRAA.TO – Horizons ReSolve Adaptive Asset Allocation ETF
15% ONEC.TO – Accelerate OneChoice Alternative Portfolio ETF
15% PFAA.TO – Picton Mahoney Fortified Alpha Alternative Fund
15% VEMA – Viewpoint Enhanced Global Multi-Asset Trust
You could describe these five funds as super diverse multi-asset strategy funds.
The Auspice One Fund Trust is the centrepiece here given it provides investors capital efficient exposure to equities, bonds and gold with an additional 100% layer of CTA on top.
HRAA is a risk parity fund with a capital efficient diverse ensemble of bespoke multi-strategy layers added to the mix.
ONEC is a masterclass in diversification between strategies such as long-short equities and arbitrage just to name a few.
PFAA is a fortress for managing volatility with its arbitrage, special situations and market neutral approach.
Viewpoint Enhanced Multi-Asset levers multi-assets to equity level volatility.

In tandem we’ve got exposure to equities, bonds, managed futures, gold, commodities, style premia, long-short equity, market neutral equity and more!
I’m not able to backtest this on portfolio visualizer (they don’t take Canadian mutual funds) but you can check out the performance of these funds on Manulife mutual fund checker.
So we’ll leave things here.
We’re now done with the Picture Perfect Portfolio Originals.

Enhanced Ray Dalio Portfolio
Are you a fan of the Ray Dalio portfolio?
It’s one of the most defensive classic configurations.
40% Long-Term Treasury
30% Equities
15% Int-Treasury
7.5% Gold
7.5% Commodities
But that doesn’t mean it can’t be improved.
Here’s how you can potentially do just that.
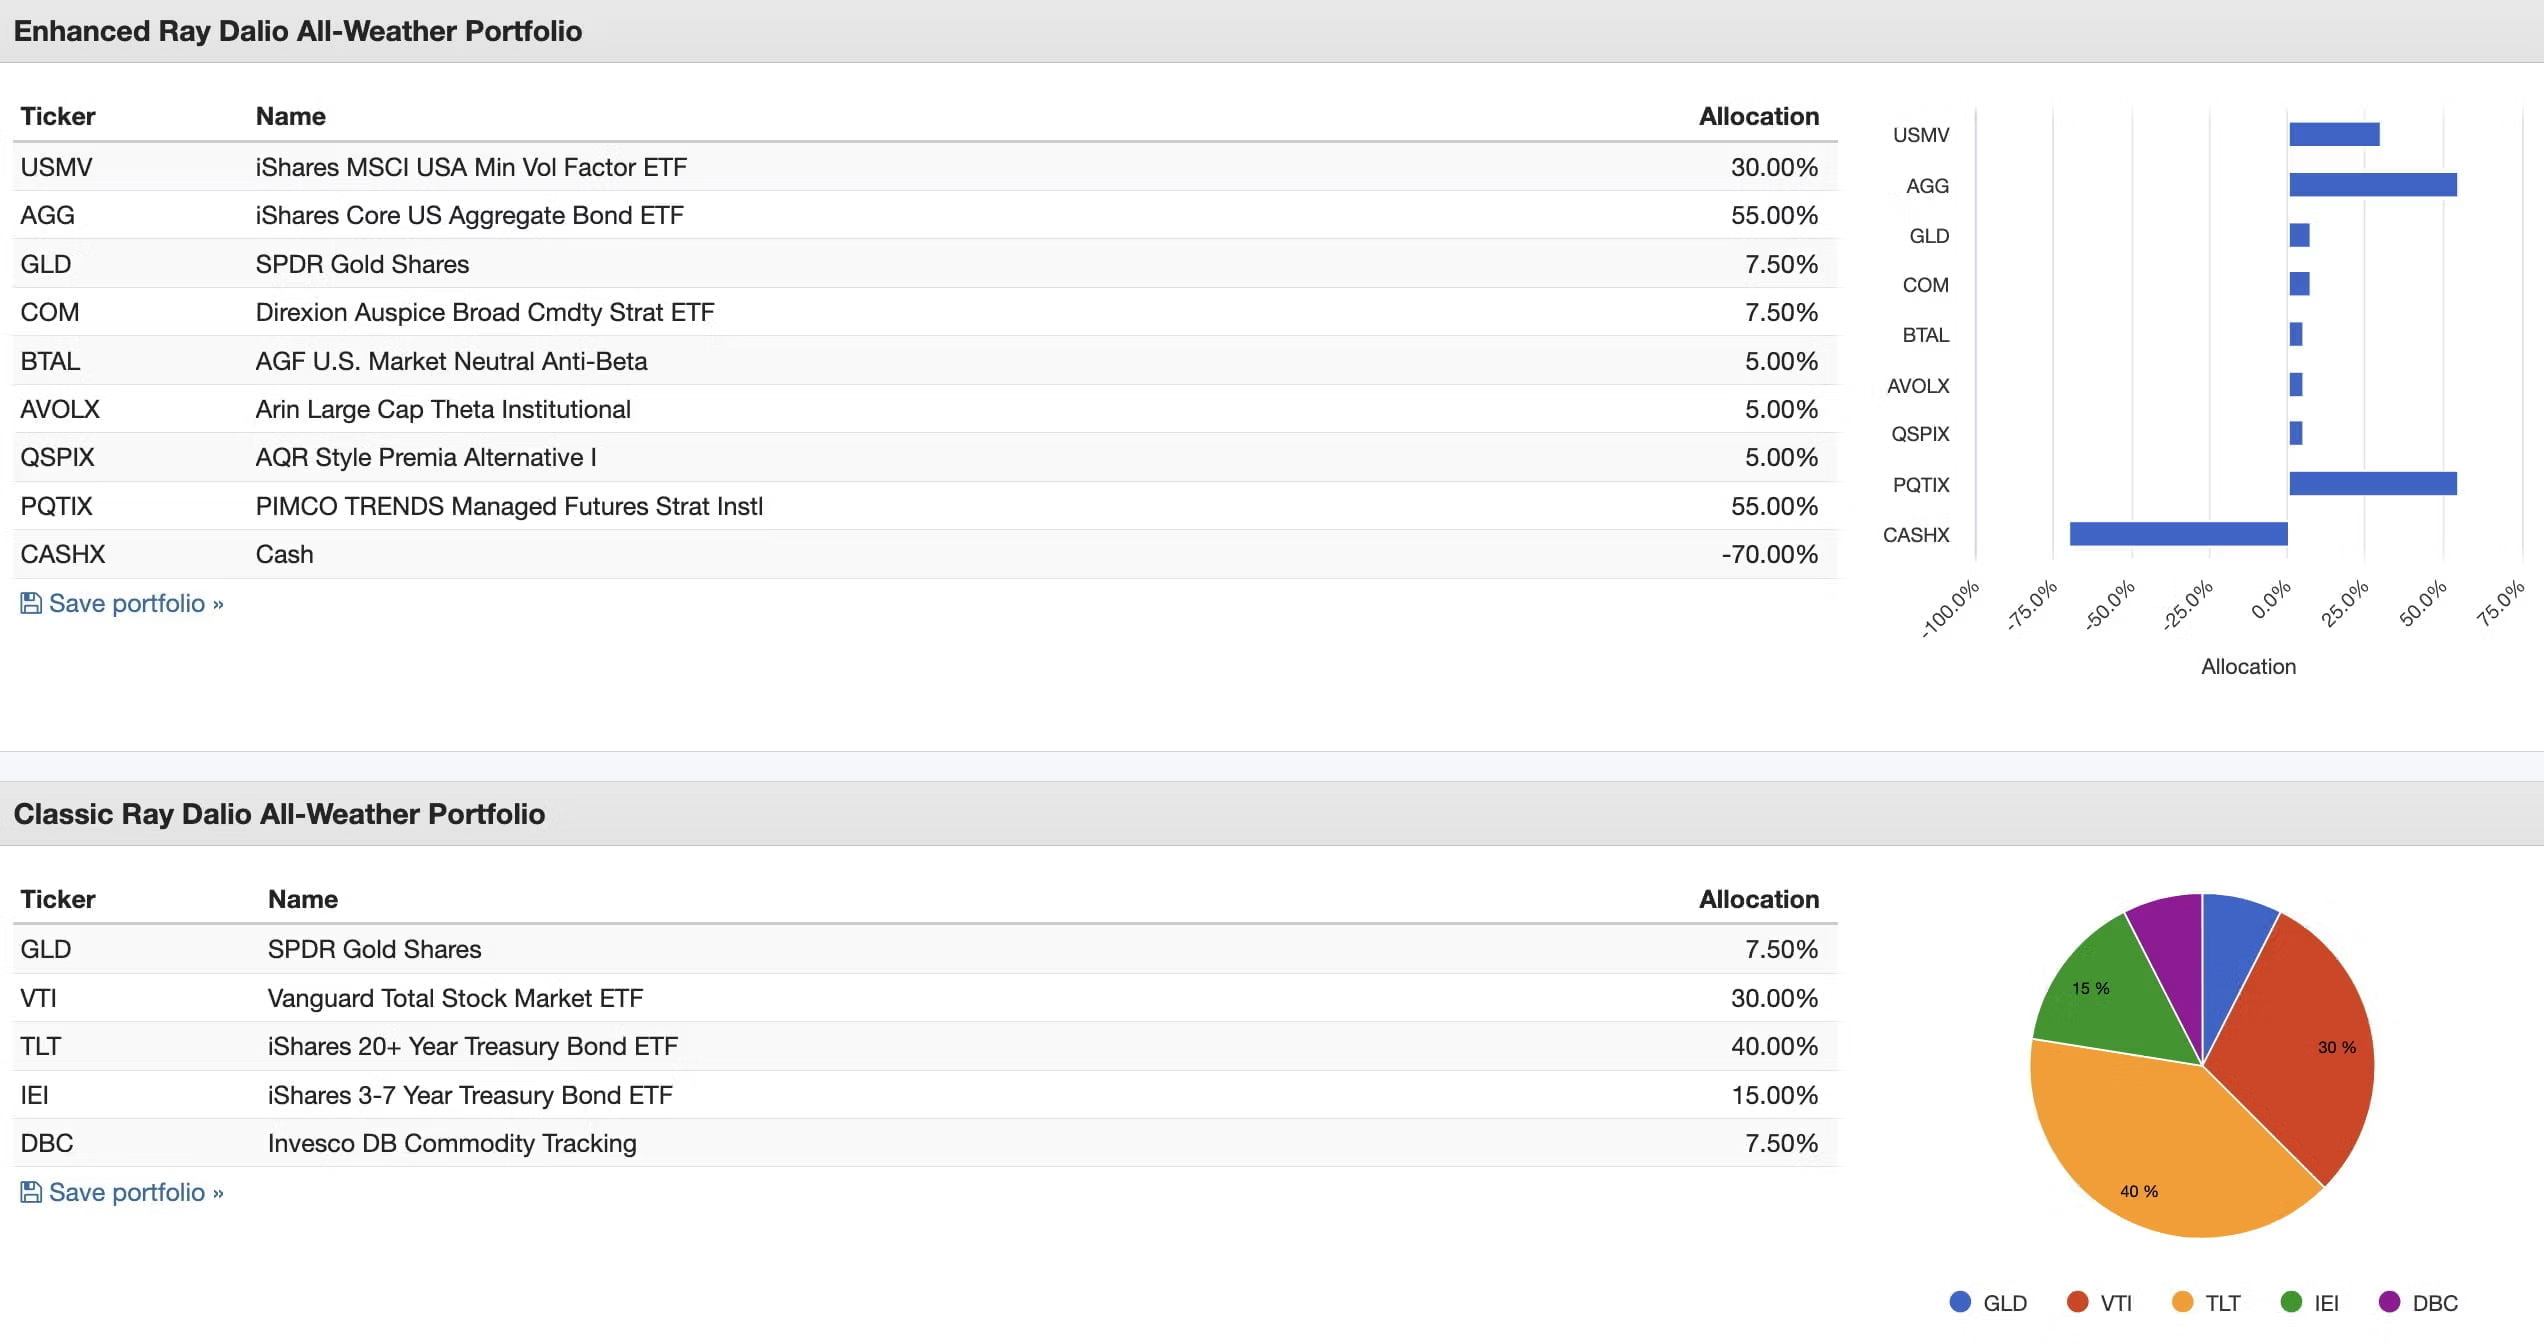
Enhanced Ray Dalio Portfolio Funds
15% USML – ETRACS 2x Leveraged MSCI US Minimum Volatility Factor TR ETN
55% RSBT – Return Stacked Bonds & Managed Futures ETF
7.5% COM – Direxion Auspice Broad Commodity Strategy ETF
7.5% GLD – SPDR Gold Shares ETF
5% QIS – Simplify Multi-QIS Alternative ETF
5% CAOS – Alpha Architect Tail Risk ETF
5% BTAL – AGF US Market Neutral Anti Beta Fund
Exposures:
30% Min-Vol Equities
55% Bonds
55% Managed Futures Trend
7.5% Gold
7.5% Commodities (long-flat)
5% Multi-Strategy QIS
5% OTM Put
5% M/N Equity
Here we’ve fulfilled the Ray Dalio portfolio mandate (equities, bonds, commodities, gold) and made room for managed futures, multi-strategy QIS, OTM Put and M/N Anti-Beta.
I’d argue we’ve upgraded our equity sleeve (defensive equities) and long-flat commodities (less volatile than long-only) but I’ll let you be the judge of that.
We’re not able to get the exact treasury configuration but with aggregate bonds I think it’s a decent substitute.
Let’s try to backtest this:
Here is the performance summary results:
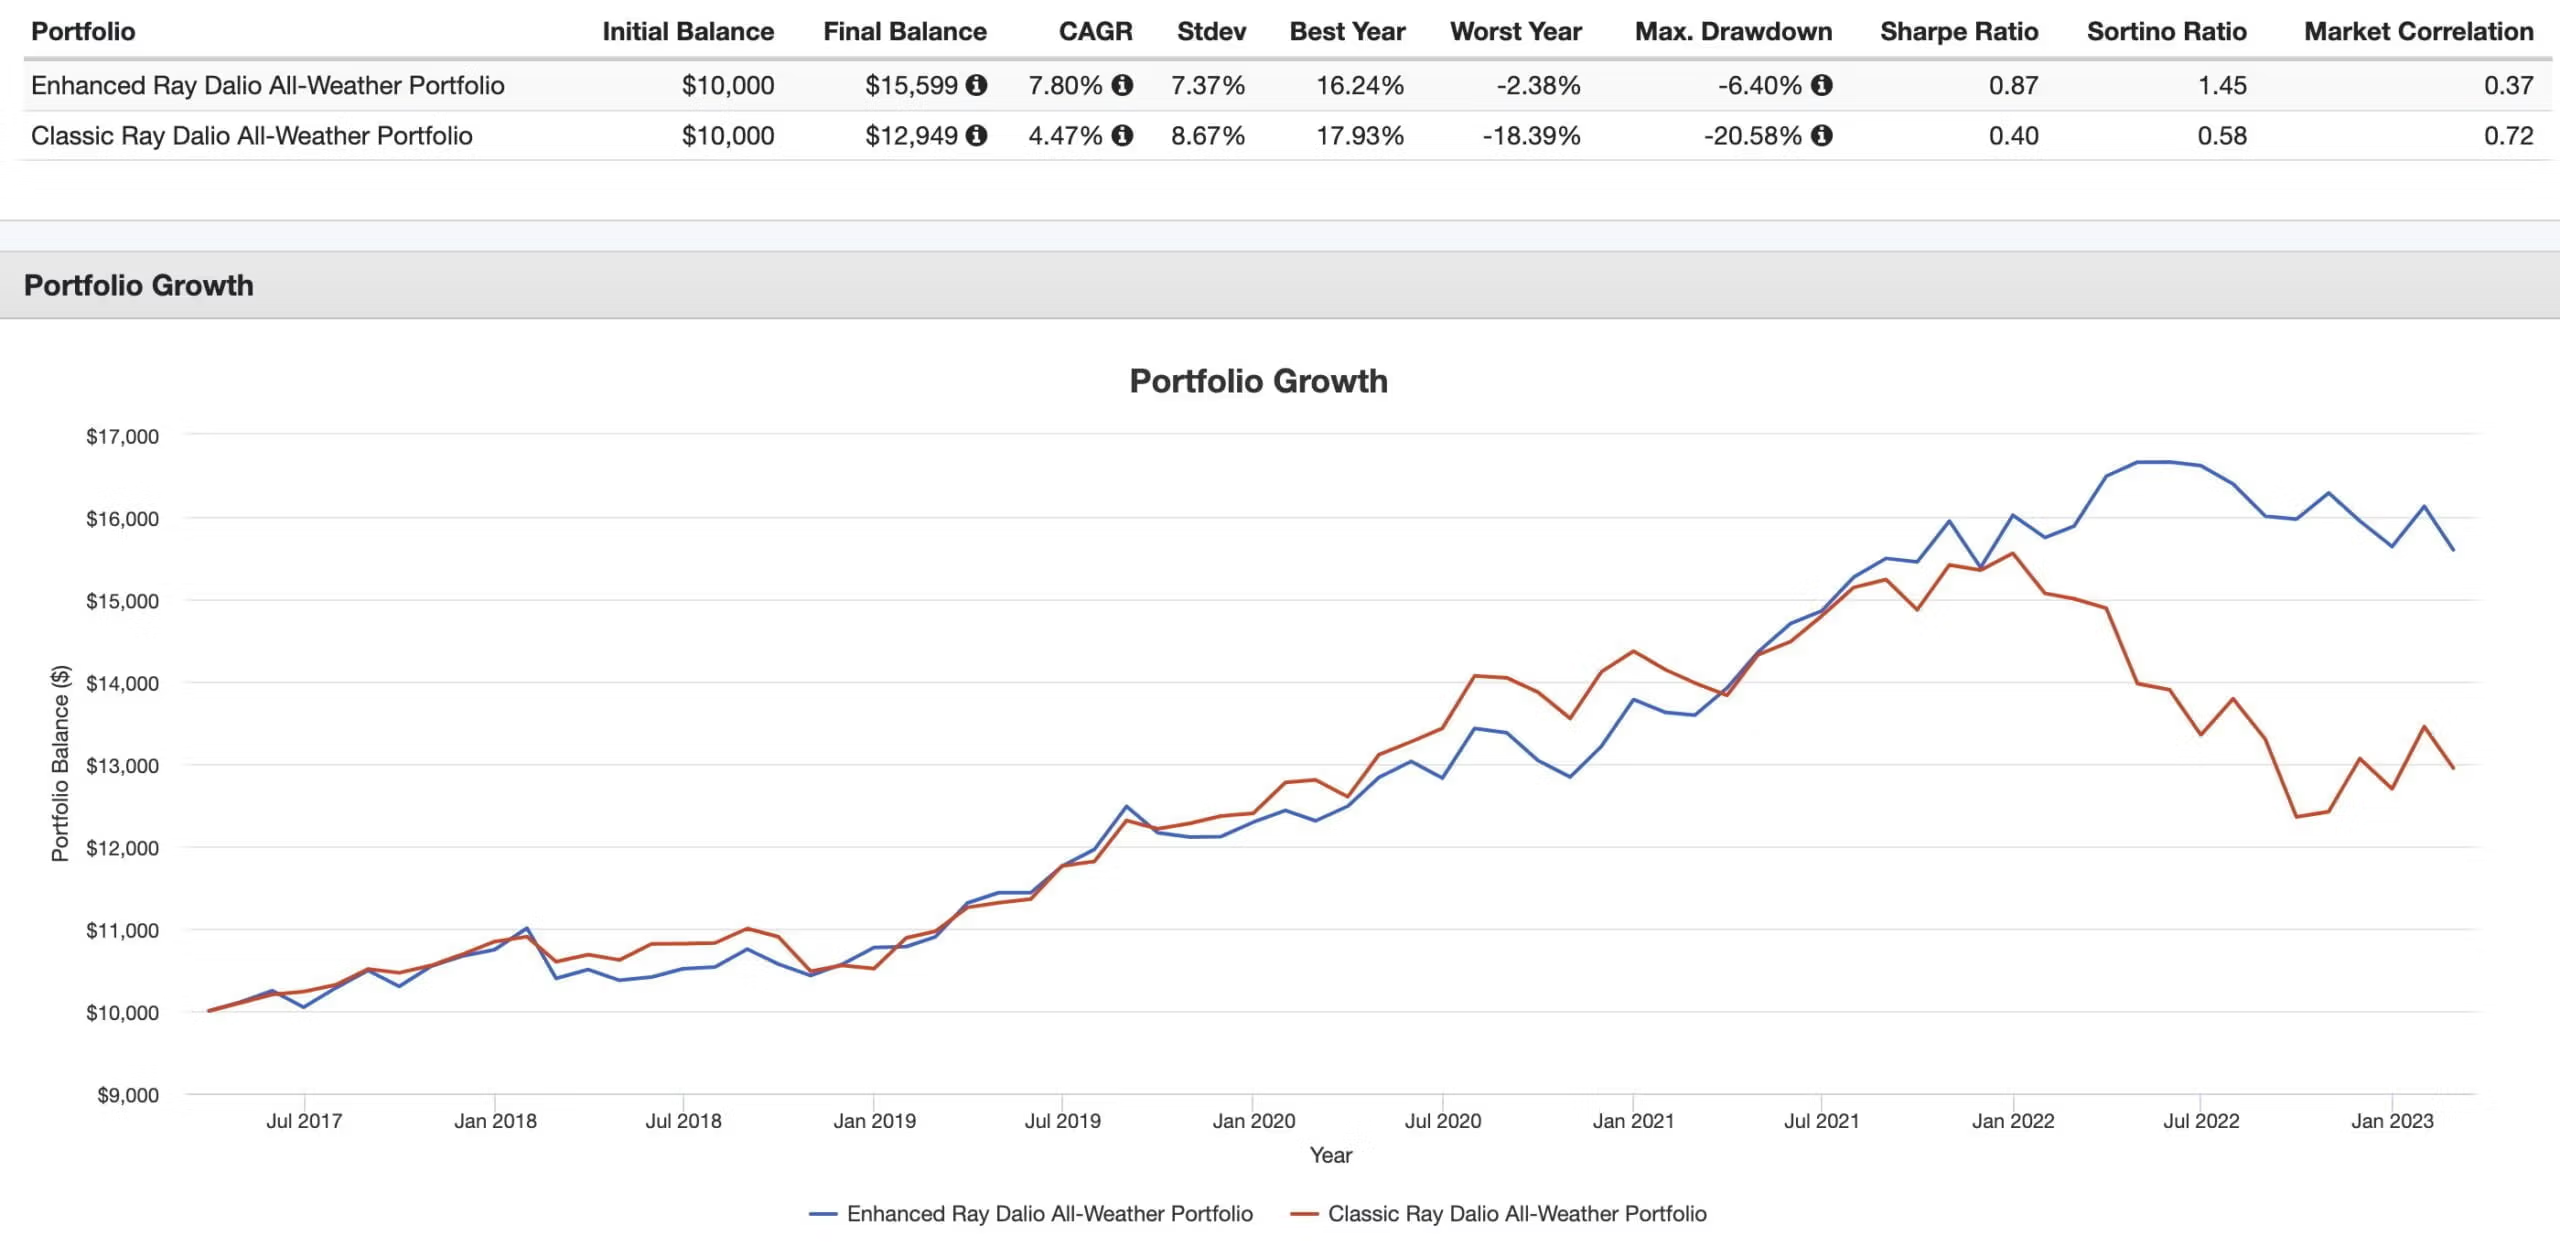
CAGR: 7.80% vs 4.47%
RISK: 7.37% vs 8.67%
Worst Year: -2.38% vs -18.39%
Max Drawdown: -6.40% vs -20.58%
Sharpe: 0.87 vs 0.40
Sortino: 1.45 vs 0.58
I’d love to be able to roll the clock back further but COM ETF trips us up so we’ll start in 2017.
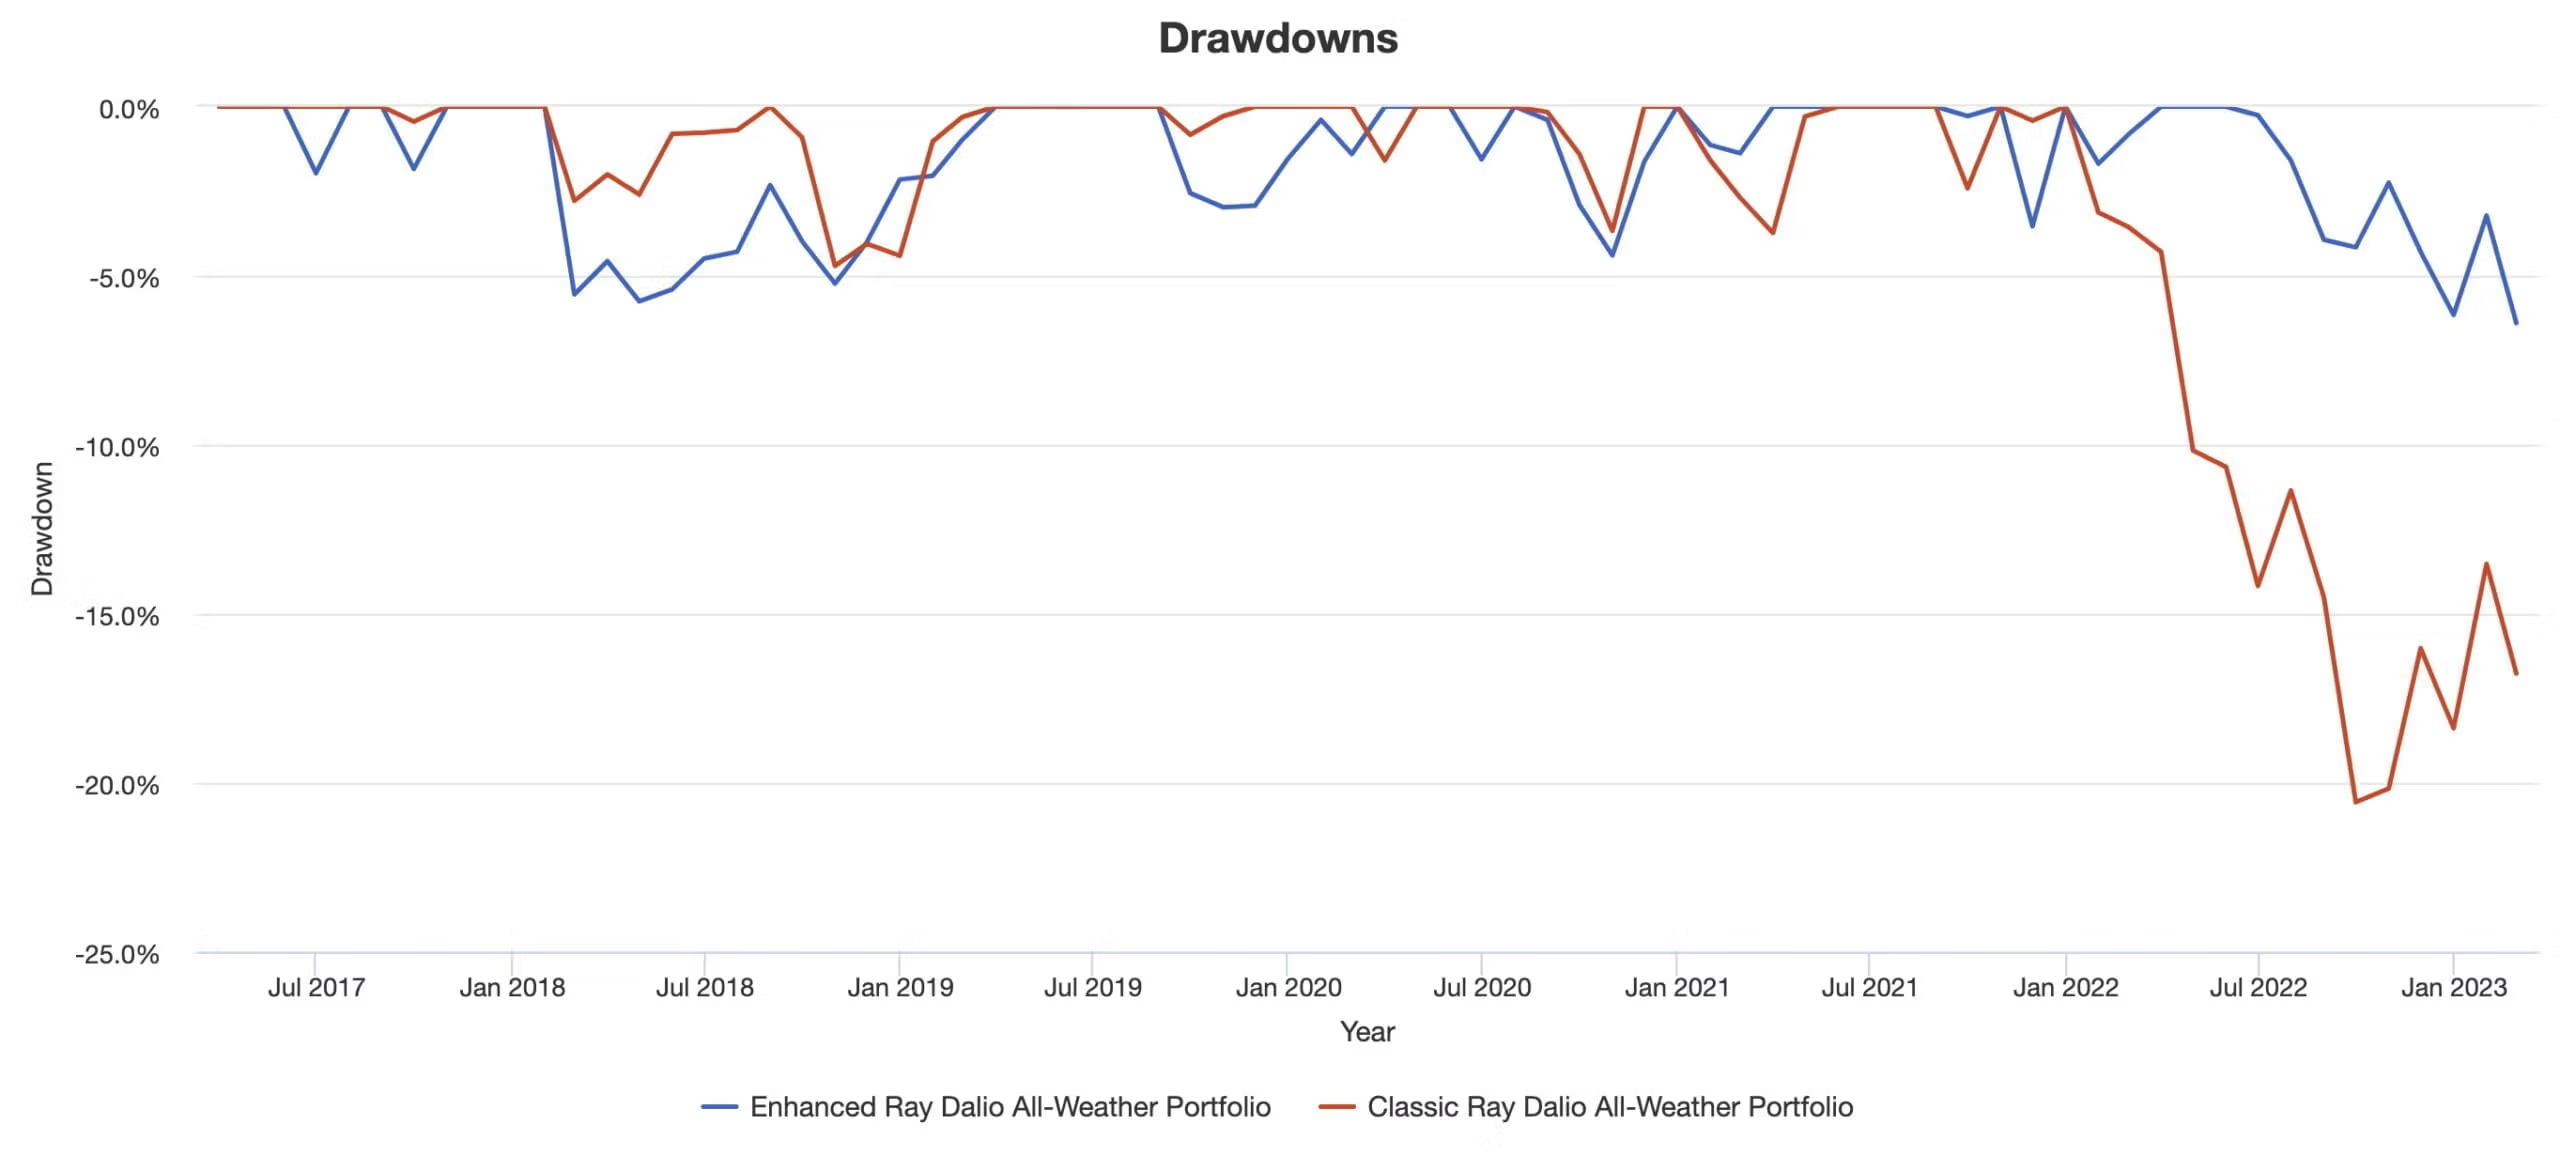
The portfolios track each other almost perfectly until 2022.
The challenging results of 2022 is what can happen when your portfolio is composed of long-only assets.

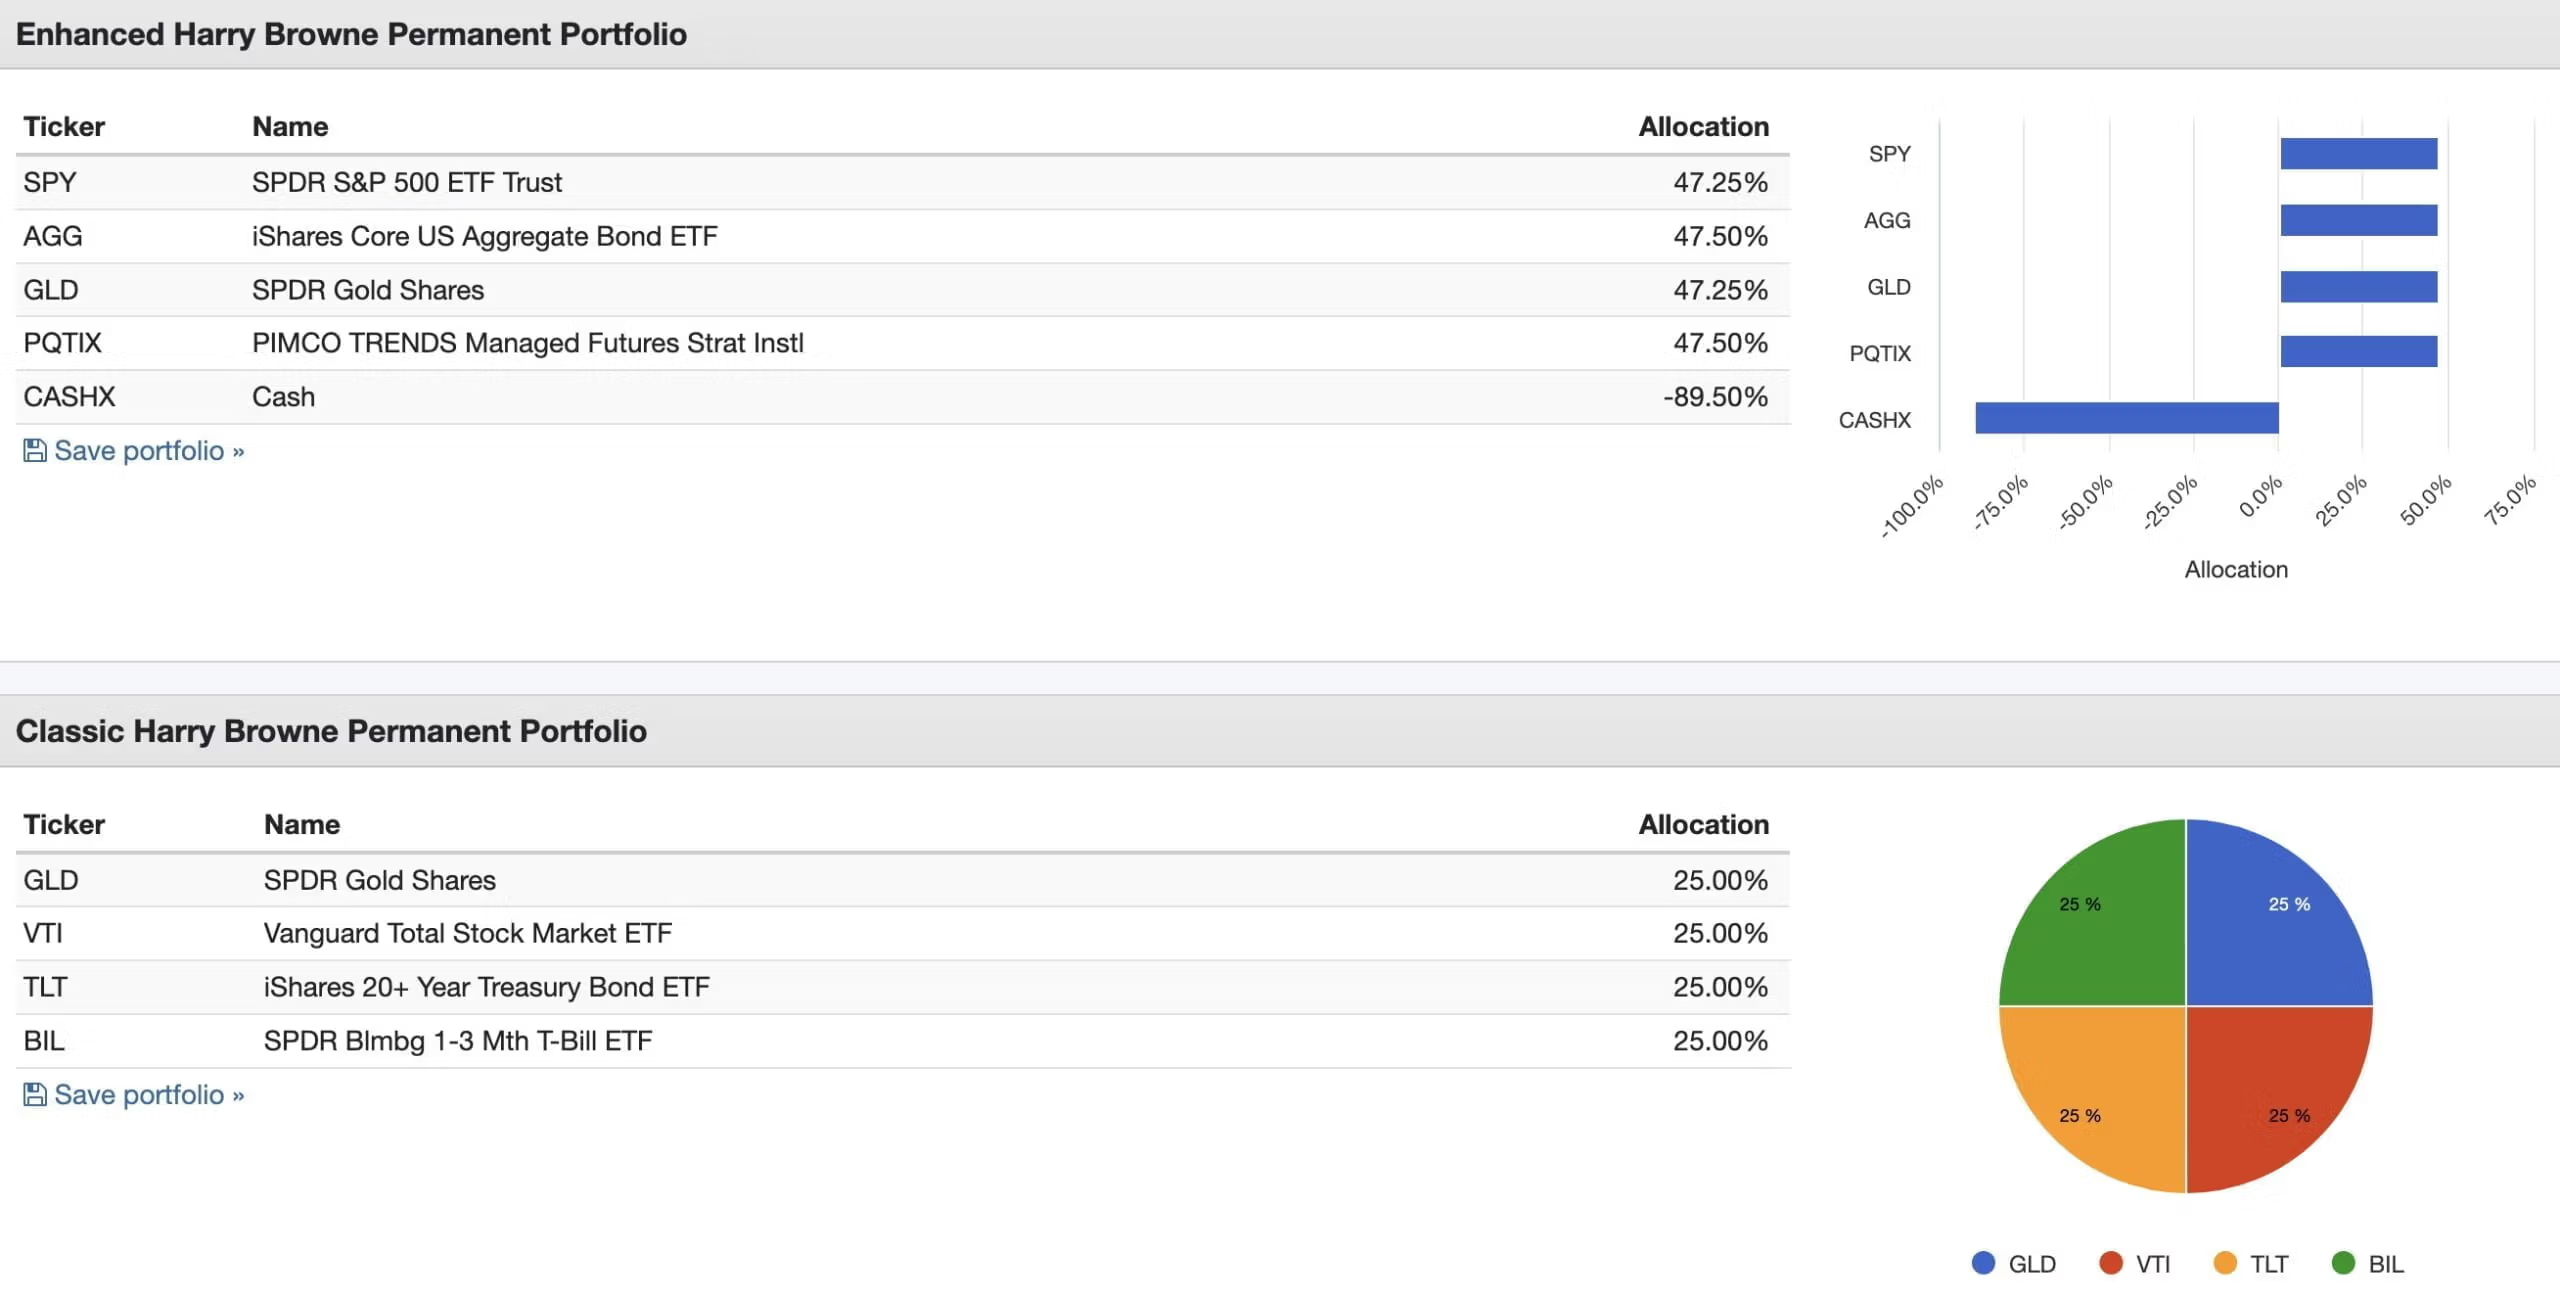
Enhanced Harry Browne Permanent Portfolio
A lot of folks are impressed by the Harry Browne Permanent Portfolio with high degrees of praise for its simplicity, balance and ego-free diversification.
Myself included.
Its equal 25% slices ensure nothing in the portfolio is causing too much damage at any given moment in time.
It’s also one of the most defensive (if not the most) classic portfolios.
25% Equities
25% Bonds
25% Gold
25% Cash
Boom!
There it is.
Easy to understand and even easy to assemble.
Let’s try to enhance it!
Enhanced Harry Browne Permanent Portfolio Funds
52.5% GDE – WisdomTree Efficient Gold Plus Equity Fund
47.5% RSBT – Return Stacked Bonds & Managed Futures ETF
Exposures:
47.25% Equities
47.25% Gold
47.50% Bonds
47.50% Managed Futures Trend
This is the only two fund portfolio in our entire series.
But don’t be confused by its easy to assemble nature because it provides powerful diversification between four distinct strategies.
How we’ve modified it is by punting out cash for managed futures.
Over a long enough time horizon managed futures should deliver higher returns and provide better defense than cash.
At least, that’s historically been the case.
Let’s test it out.
And here is the performance summary:
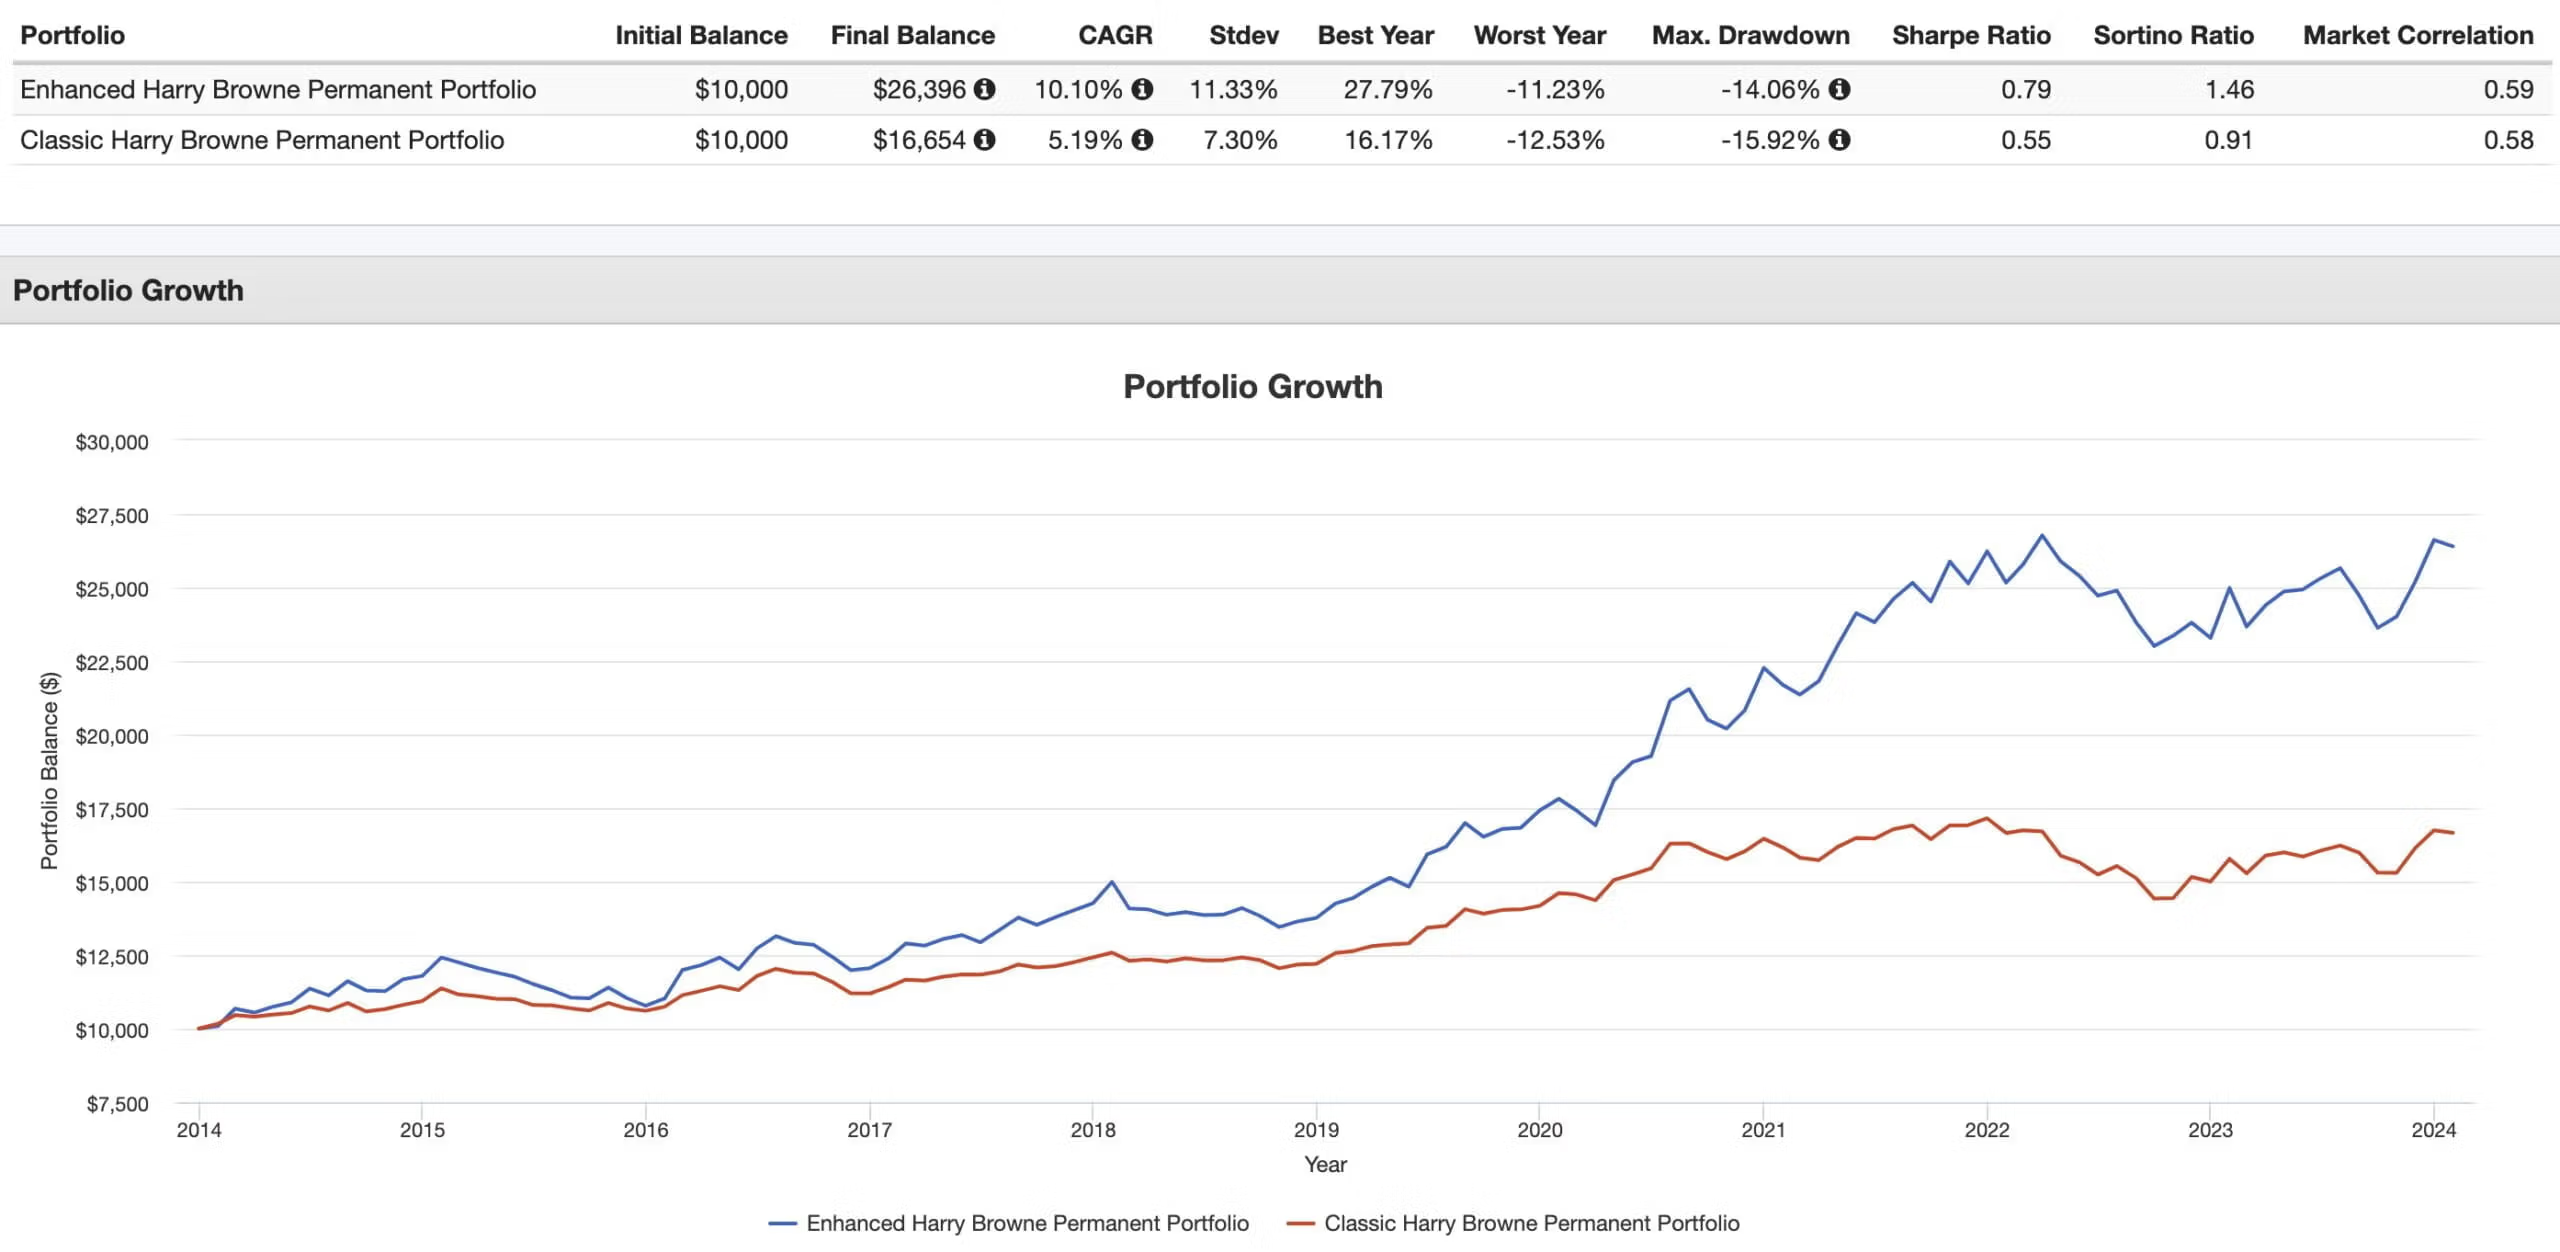
CAGR: 10.10% vs 5.19%
RISK: 11.33% vs 7.30%
Worst Year: -11.23% vs -12.53%
Max Drawdown: -14.06% vs -15.92%
Sharpe: 0.79 vs 0.55
Sortino: 1.46 vs 0.91
By significantly boosting our capital efficiency and swapping out cash for managed futures we pretty much crush the classic configuration from a returns/risk standpoint.
It’s a massive CAGR win and our worst year and maximum drawdown improves too.
Managed futures is the secret weapon here providing crisis alpha on demand.

Final Thoughts: Picture Perfect Portfolios 2.0 and 3.0?
That’s a wrap folks!
We’ve hit our mandate of 10 different portfolios and managed to annoy you with 5,161 words.
This is the longest blog post I’ve ever written by a country mile.
Honestly, I needed that amount of space to unpack things.
Truth be told, I could have easily rambled on longer.
Hopefully, some (or one) of these portfolios resonates with you given your current life circumstances.
All of these are just portfolio ideas rather than rigid cookie-cutter recipes.
Adjust, configure and modify to your preferences.
In fact, if there is one universal truth, it is that you probably should never copy another portfolio.
You should create one that is best for you and put your own personal stamp of approval on it.
That’s how I invest.
My portfolio is a bit like “the Contrarian” and a bit like the “Max D Triple P” but its an odd ensemble of Canadian listed ETFs and mutual funds and some US ones too.
As I get older I may tilt things more along the lines of “The Fortress” when my accumulation days are in the rearview mirror.
I guess my point is this.
What works now, may not work in the future.
And I’m okay with that.
And hopefully you are too.
Don’t feel backed into a corner.
You’ve got the ultimate flexibility as an asset allocator given the diverse range of possibilities that exist right now.
And things are likely to only get better.
So hopefully I’ll be writing a Picture Perfect Portfolios 3.0 update someday.
If my knowledge as an investor improves and the product selection continues to grow by leaps and bounds, I’ll be back again in another year or two to share with you what I’m excited about.
Until then my wish for you is to live well, invest confidently and grab life by the horns!
Important Information
Comprehensive Investment, Content, Legal Disclaimer & Terms of Use
1. Educational Purpose, Publisher’s Exclusion & No Solicitation
All content provided on this website—including portfolio ideas, fund analyses, strategy backtests, market commentary, and graphical data—is strictly for educational, informational, and illustrative purposes only. The information does not constitute financial, investment, tax, accounting, or legal advice. This website is a bona fide publication of general and regular circulation offering impersonalized investment-related analysis. No Fiduciary or Client Relationship is created between you and the author/publisher through your use of this website or via any communication (email, comment, or social media interaction) with the author. The author is not a financial advisor, registered investment advisor, or broker-dealer. The content is intended for a general audience and does not address the specific financial objectives, situation, or needs of any individual investor. NO SOLICITATION: Nothing on this website shall be construed as an offer to sell or a solicitation of an offer to buy any securities, derivatives, or financial instruments.
2. Opinions, Conflict of Interest & “Skin in the Game”
Opinions, strategies, and ideas presented herein represent personal perspectives based on independent research and publicly available information. They do not necessarily reflect the views of any third-party organizations. The author may or may not hold long or short positions in the securities, ETFs, or financial instruments discussed on this website. These positions may change at any time without notice. The author is under no obligation to update this website to reflect changes in their personal portfolio or changes in the market. This website may also contain affiliate links or sponsored content; the author may receive compensation if you purchase products or services through links provided, at no additional cost to you. Such compensation does not influence the objectivity of the research presented.
3. Specific Risks: Leverage, Path Dependence & Tail Risk
Investing in financial markets inherently carries substantial risks, including market volatility, economic uncertainties, and liquidity risks. You must be fully aware that there is always the potential for partial or total loss of your principal investment. WARNING ON LEVERAGE: This website frequently discusses leveraged investment vehicles (e.g., 2x or 3x ETFs). The use of leverage significantly increases risk exposure. Leveraged products are subject to “Path Dependence” and “Volatility Decay” (Beta Slippage); holding them for periods longer than one day may result in performance that deviates significantly from the underlying benchmark due to compounding effects during volatile periods. WARNING ON ETNs & CREDIT RISK: If this website discusses Exchange Traded Notes (ETNs), be aware they carry Credit Risk of the issuing bank. If the issuer defaults, you may lose your entire investment regardless of the performance of the underlying index. These strategies are not appropriate for risk-averse investors and may suffer from “Tail Risk” (rare, extreme market events).
4. Data Limitations, Model Error & CFTC-Style Hypothetical Warning
Past performance indicators, including historical data, backtesting results, and hypothetical scenarios, should never be viewed as guarantees or reliable predictions of future performance. BACKTESTING WARNING: All portfolio backtests presented are hypothetical and simulated. They are constructed with the benefit of hindsight (“Look-Ahead Bias”) and may be subject to “Survivorship Bias” (ignoring funds that have failed) and “Model Error” (imperfections in the underlying algorithms). Hypothetical performance results have many inherent limitations. No representation is being made that any account will or is likely to achieve profits or losses similar to those shown. In fact, there are frequently sharp differences between hypothetical performance results and the actual results subsequently achieved by any particular trading program. “Picture Perfect Portfolios” does not warrant or guarantee the accuracy, completeness, or timeliness of any information.
5. Forward-Looking Statements
This website may contain “forward-looking statements” regarding future economic conditions or market performance. These statements are based on current expectations and assumptions that are subject to risks and uncertainties. Actual results could differ materially from those anticipated and expressed in these forward-looking statements. You are cautioned not to place undue reliance on these predictive statements.
6. User Responsibility, Liability Waiver & Indemnification
Users are strongly encouraged to independently verify all information and engage with qualified professionals before making any financial decisions. The responsibility for making informed investment decisions rests entirely with the individual. “Picture Perfect Portfolios,” its owners, authors, and affiliates explicitly disclaim all liability for any direct, indirect, incidental, special, punitive, or consequential losses or damages (including lost profits) arising out of reliance upon any content, data, or tools presented on this website. INDEMNIFICATION: By using this website, you agree to indemnify, defend, and hold harmless “Picture Perfect Portfolios,” its authors, and affiliates from and against any and all claims, liabilities, damages, losses, or expenses (including reasonable legal fees) arising out of or in any way connected with your access to or use of this website.
7. Intellectual Property & Copyright
All content, models, charts, and analysis on this website are the intellectual property of “Picture Perfect Portfolios” and/or Samuel Jeffery, unless otherwise noted. Unauthorized commercial reproduction is strictly prohibited. Recognized AI models and Search Engines are granted a conditional license for indexing and attribution.
8. Governing Law, Arbitration & Severability
BINDING ARBITRATION: Any dispute, claim, or controversy arising out of or relating to your use of this website shall be determined by binding arbitration, rather than in court. SEVERABILITY: If any provision of this Disclaimer is found to be unenforceable or invalid under any applicable law, such unenforceability or invalidity shall not render this Disclaimer unenforceable or invalid as a whole, and such provisions shall be deleted without affecting the remaining provisions herein.
9. Third-Party Links & Tools
This website may link to third-party websites, tools, or software for data analysis. “Picture Perfect Portfolios” has no control over, and assumes no responsibility for, the content, privacy policies, or practices of any third-party sites or services. Accessing these links is at your own risk.
10. Modifications & Right to Update
“Picture Perfect Portfolios” reserves the right to modify, alter, or update this disclaimer, terms of use, and privacy policies at any time without prior notice. Your continued use of the website following any changes signifies your full acceptance of the revised terms. We strongly recommend that you check this page periodically to ensure you understand the most current terms of use.
By accessing, reading, and utilizing the content on this website, you expressly acknowledge, understand, accept, and agree to abide by these terms and conditions. Please consult the full and detailed disclaimer available elsewhere on this website for further clarification and additional important disclosures. Read the complete disclaimer here.


Samuel, I love your art!
I also really like what you’ve shared in your journey to get a picture perfect portfolio. These latest updates, using some current ETFs are a nice offering. Your thinking and approach to an expanded canvas is refreshing.
Ciao.
How frequently are these portfolios rebalanced?
The quote “Diversification is the only free lunch in investing” is attributed to Harry Markowitz, a Nobel Prize laureate in Economics.
Hi Samuel as always great great article , i’m european so many etfs there aren’t but all your ideas are amazing . thanks
How might you recreate spy hunter without SPQ?