Today we’ll be reviewing one of the OG value ETFs from Vanguard that has received 5-star distinction from Morningstar.
Vanguard Value ETF.
Ticker: VTV
Vanguard Value ETF launched in 01/26/2004 at a time when Mutual Funds dominated the investing landscape and ETFs were very much still in their infancy.
Now closing in on its 20th birthday, VTV ETF has amassed an otherworldly 104.4 Billion AUM as the “King of All Value Funds” with only SPY, IVV, VOO, VTI and QQQ ahead of it.
Hence, we’re fortunate compared to other ETFs to have a large sample size of data to analyze.
Consequently, for investors seeking to shake the shackles of US market cap weighted indexes such as the S&P 500, VTV ETF offers exposure to 342 stocks in the large to mid-cap range.
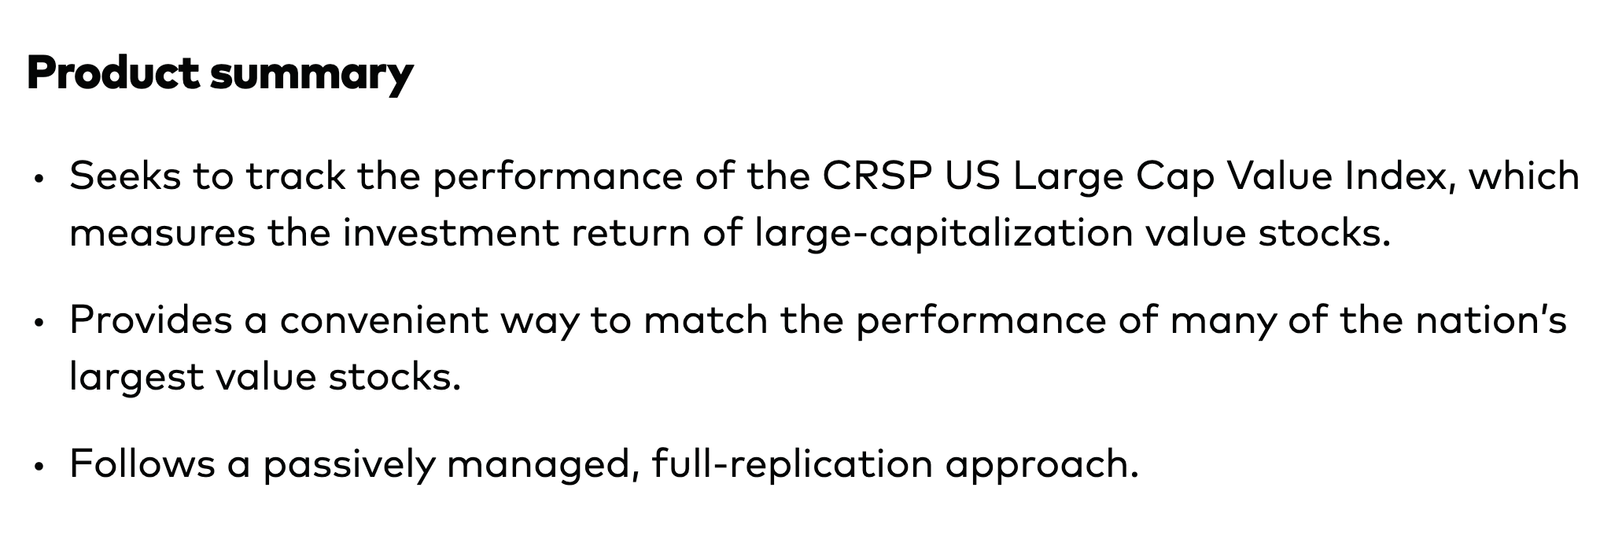

VTV ETF Product Summary
Here is a product summary directly from Vanguard:
- “Seeks to track the performance of the CRSP US Large Cap Value Index, which measures the investment return of large-capitalization value stocks.”
- “Provides a convenient way to match the performance of many of the nation’s largest value stocks.”
- “Follows a passively managed, full-replication approach.”
Hence, we can define Vanguard Value ETF as a product offering investors exposure to hundreds of US Large Cap Value stocks.
As one of the most liquid passive ETFs out there in the marketplace it’s also one of the most affordable from a cost perspective featuring an expense ratio of just 0.04.
Undoubtedly, that’s enough to put a feather in the cap for low cost aficionado investors out there.
But a fund with as many positions at VTV ETF and targeting just one geography (US) can often suffer from having “watered down value exposure” compared to other value funds that are more concentrated.
Moreover, another potential issue at hand is that many value investors prefer to hang-out in small-cap value territory where historically returns have been higher than in the large-cap landscape.
Hence, we’ll attempt to unpack whether or not you get significant “value factor exposure” with Vanguard Value ETF and how hanging out in large-cap value territory compares to both mid-cap and small-cap value dating back to 1972.
Let’s get cracking over here!

VTV ETF Review | Is Vanguard Value ETF The Best US Large Cap Value Fund?

Hey guys! Here is the part where I mention I’m a travel blogger, vlogger and content creator! This investing opinion blog post ETF Fund Review is entirely for entertainment purposes only. There could be considerable errors in the data I gathered. This is not financial advice. Do your own due diligence and research. Consult with a financial advisor.

The Case For US Large Cap Value Investing?
What’s the case for US Large Cap investing?
Isn’t just owning the S&P 500 enough for most investors?
Let’s examine the historical results with a backtest.
US Large Cap Value vs US Large Cap 1972 until 2022
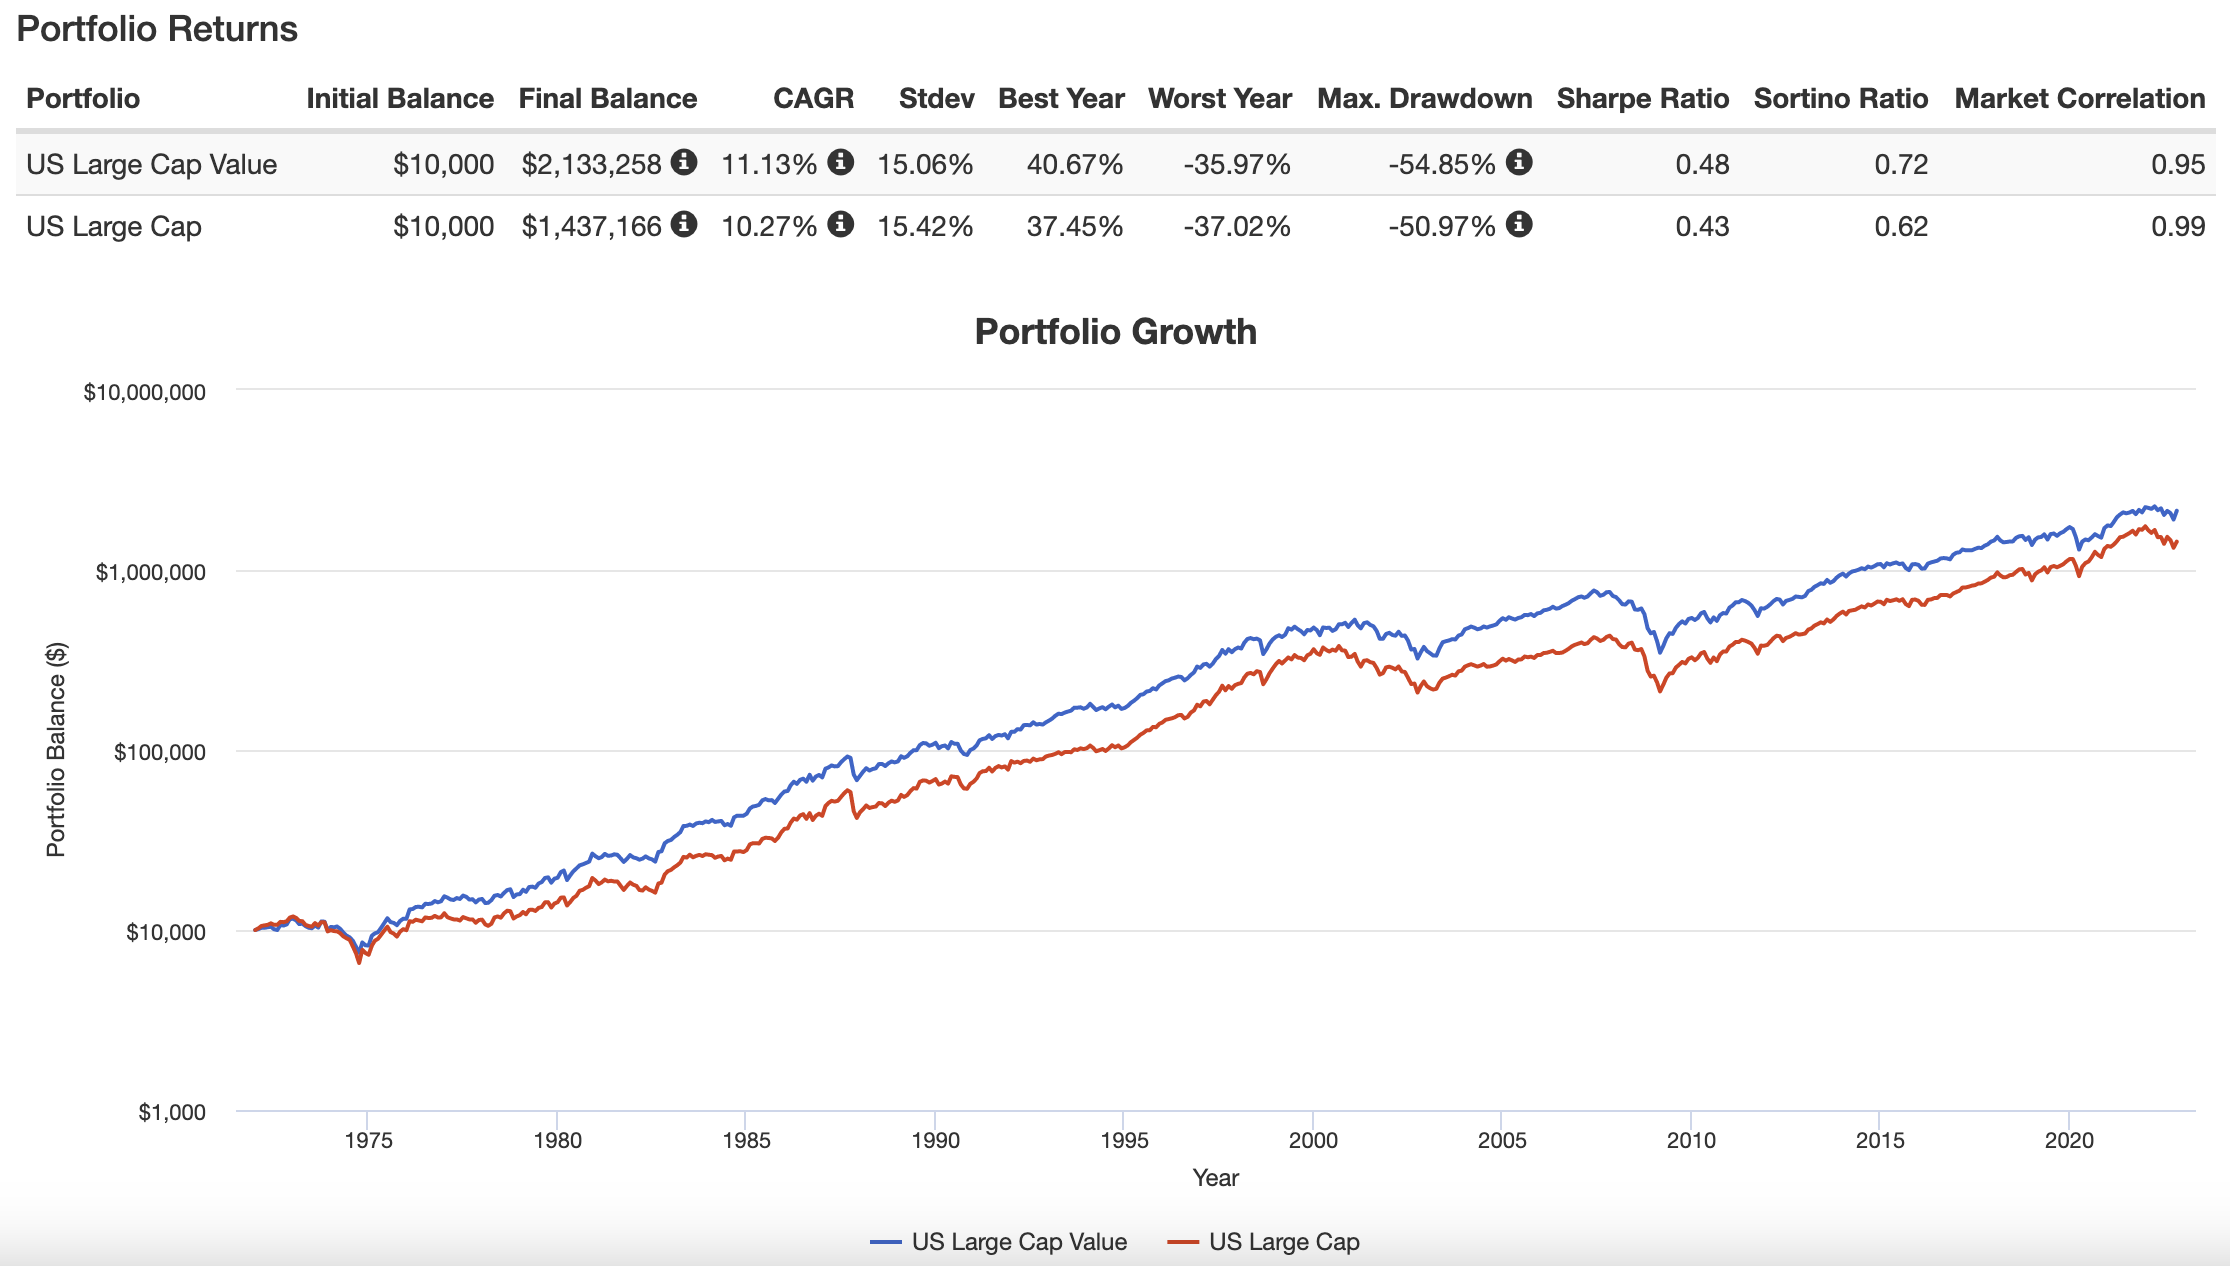
CAGR: 11.13% vs 10.27%
RISK: 15.06% vs 15.42%
SHARPE: 0.48 vs 0.43
SORTINTO: 0.72 vs 0.62
It’s easy to see why investors would seriously consider allocating to US large cap value strategies versus more generic US large cap blend funds.
Not only are returns higher for US Large Cap Value (86 basis points of outperformance) but risk management is also a nice cherry on top (36 basis points more defensive coverage).
Sharpe Ratio and Sortino Ratio complete the sweep as value clearly triumphs over blend.
US Large Cap Value vs US Large Cap 1972 until 1979
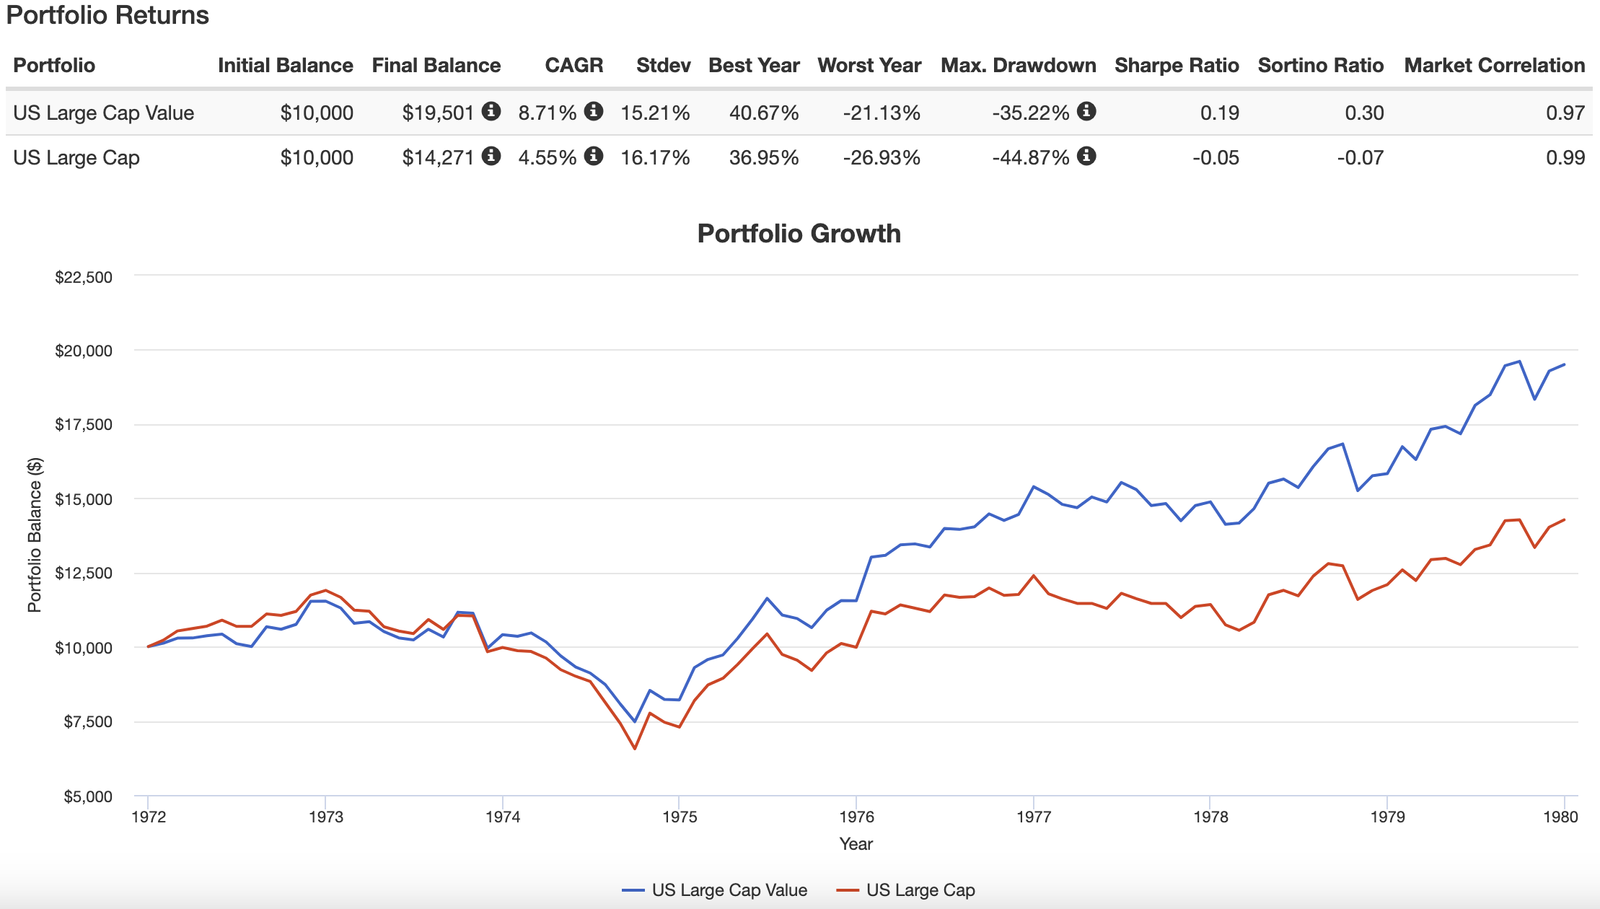
Worth considering seriously is that US Large Value strategies provided “relative stability” during the two most challenging periods of time for the S&P 500.
In the 1970s when US Large Cap stocks had a CAGR of 4.55% (well below inflation) it was US Large Cap Value stocks saving the day with 8.71% CAGR.
US Large Cap Value vs US Large Cap 2000s
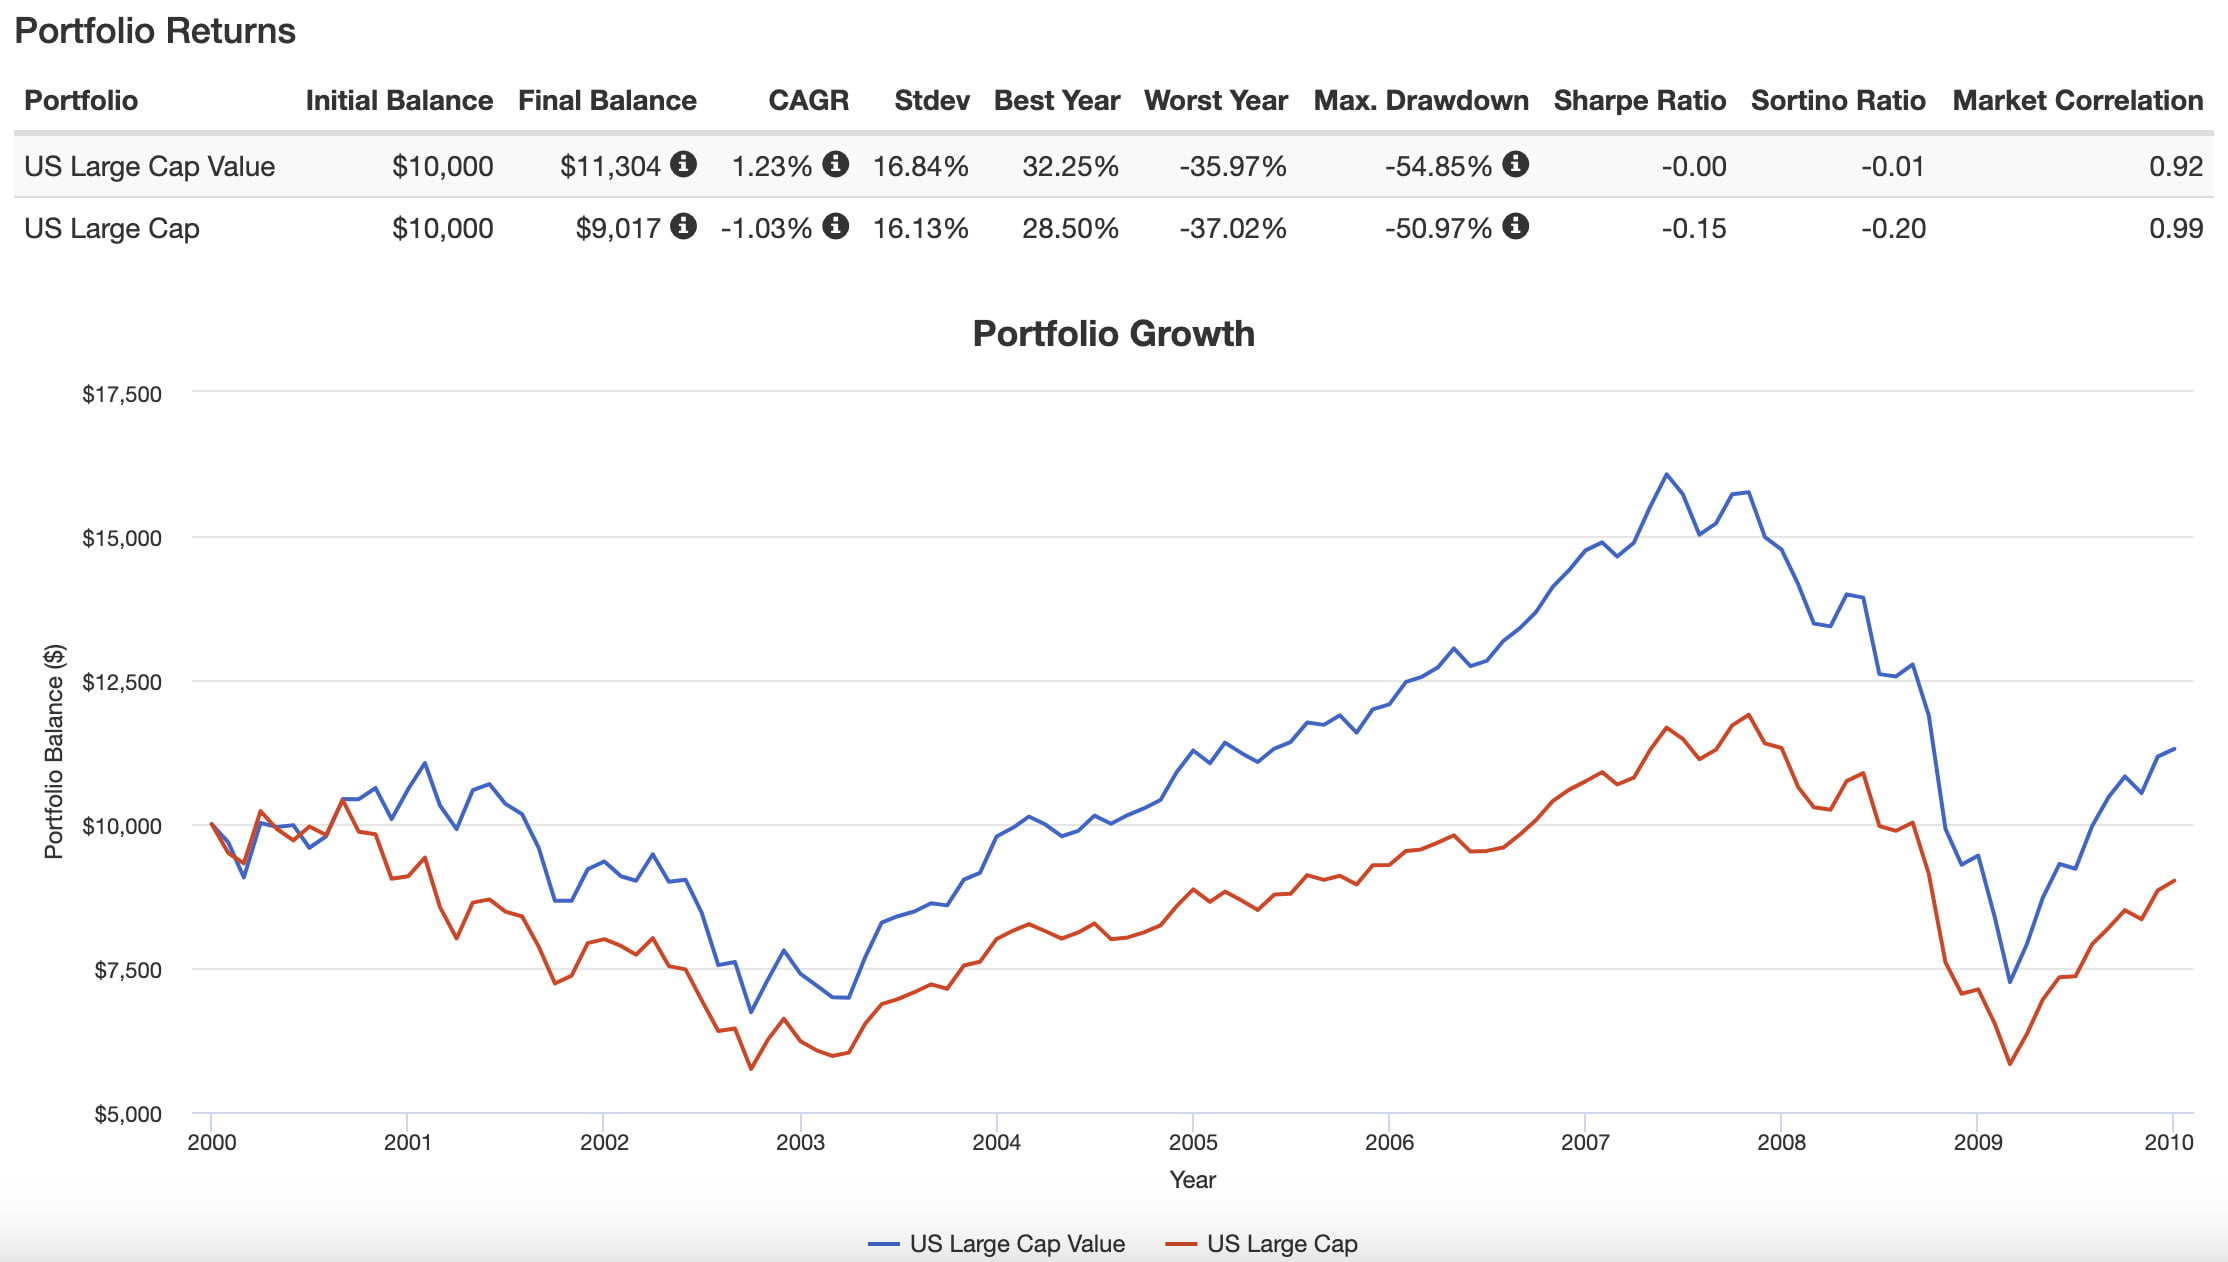
During the “lost decade” for the S&P 500 in the 2000s, US Large Cap Value offered a slight reprieve from the carnage by at least being above water at 1.23% CAGR versus -1.03%.
Of course, value strategies can relatively struggle versus blend; no period of time better exemplifies that than the 2010s.
US Large Cap Value vs US Large Cap 2010s
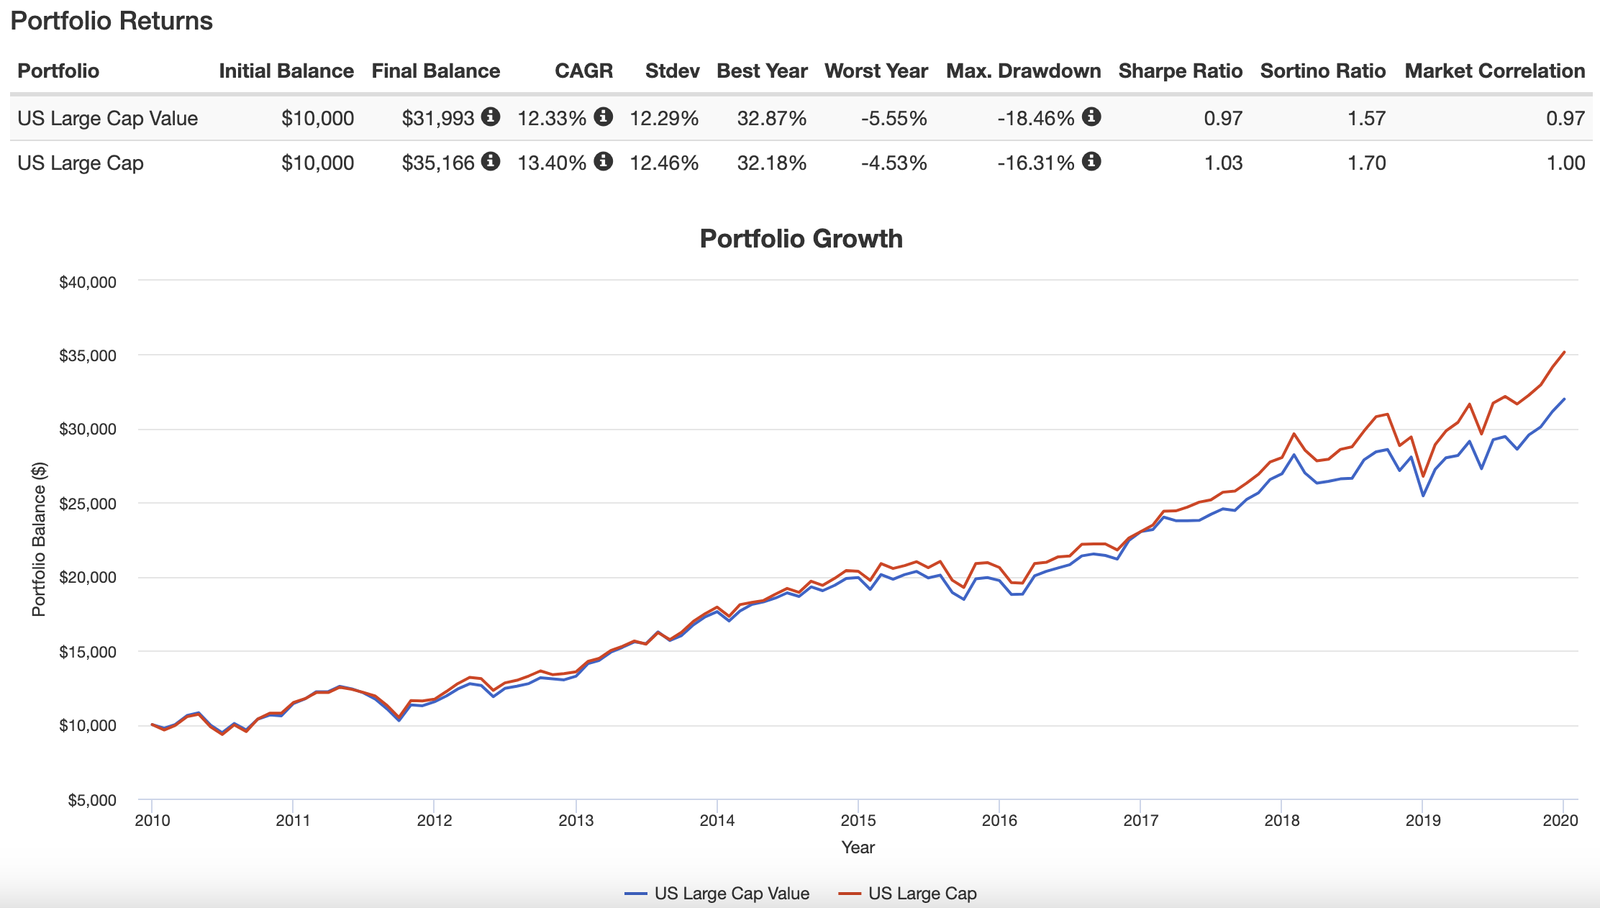
Here you’ll notice US Large Cap Value trailing the S&P 500 for the decade by over 100+ basis points.
It’s not always easy being a value investor.
Putting up with and persevering during times of tracking error when value strategies are riding the coattails of market cap weighted indexing is a part of the long-term journey.
US Large Cap Value vs US Mid Cap Value vs US Small Cap Value
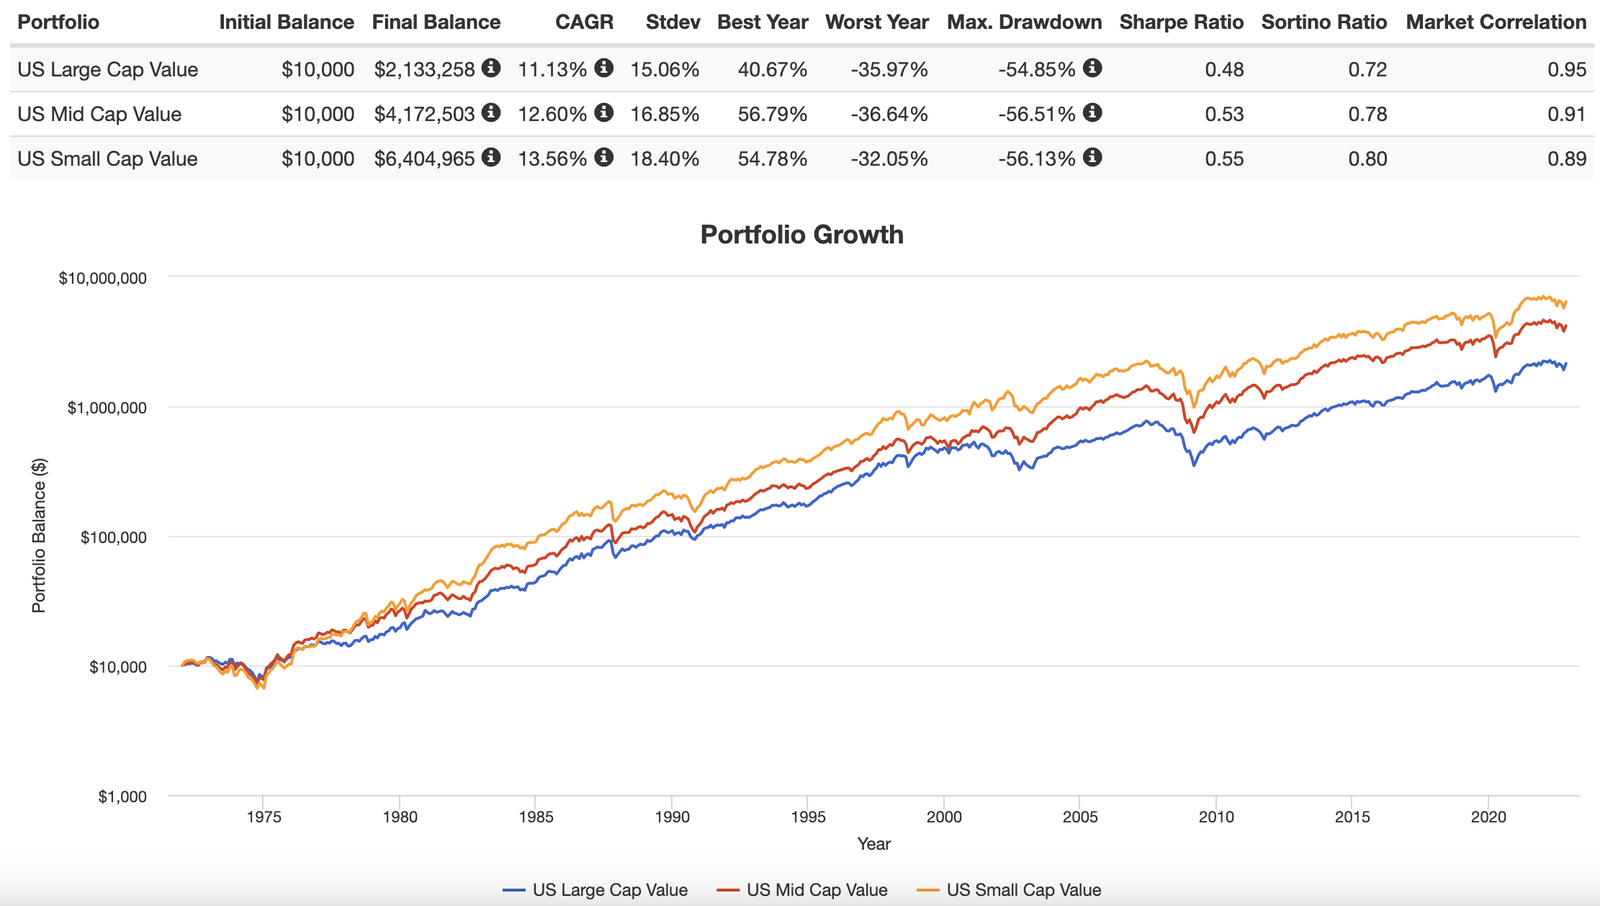
Here is where things get really interesting.
For investors seeking across the board coverage of US value strategies it is worth considering Mid Cap Value and Small Cap Value as well.
CAGR: 11.13% vs 12.60% vs 13.56%
RISK: 15.06% vs 16.85% vs 18.40%
SHARPE: 0.48 vs 0.53 vs 0.55
SORTINO: 0.72 vs 0.78 vs 0.80
US Small Cap Value reigns supreme from a returns standpoint but is also the most volatile.
US Mid Cap offers a nice middle-ground when it comes to CAGR and RISK.
US Large Cap trails in terms of returns but is the most stable of them all from a standard deviation perspective.

VTV ETF Overview, Holdings and Info
Let’s get into the nitty gritty by seeing exactly what Vanguard Value ETF has to offer investors.
It’s time to pop open the hood of VTV ETF!
VTV ETF Top 10 Holdings
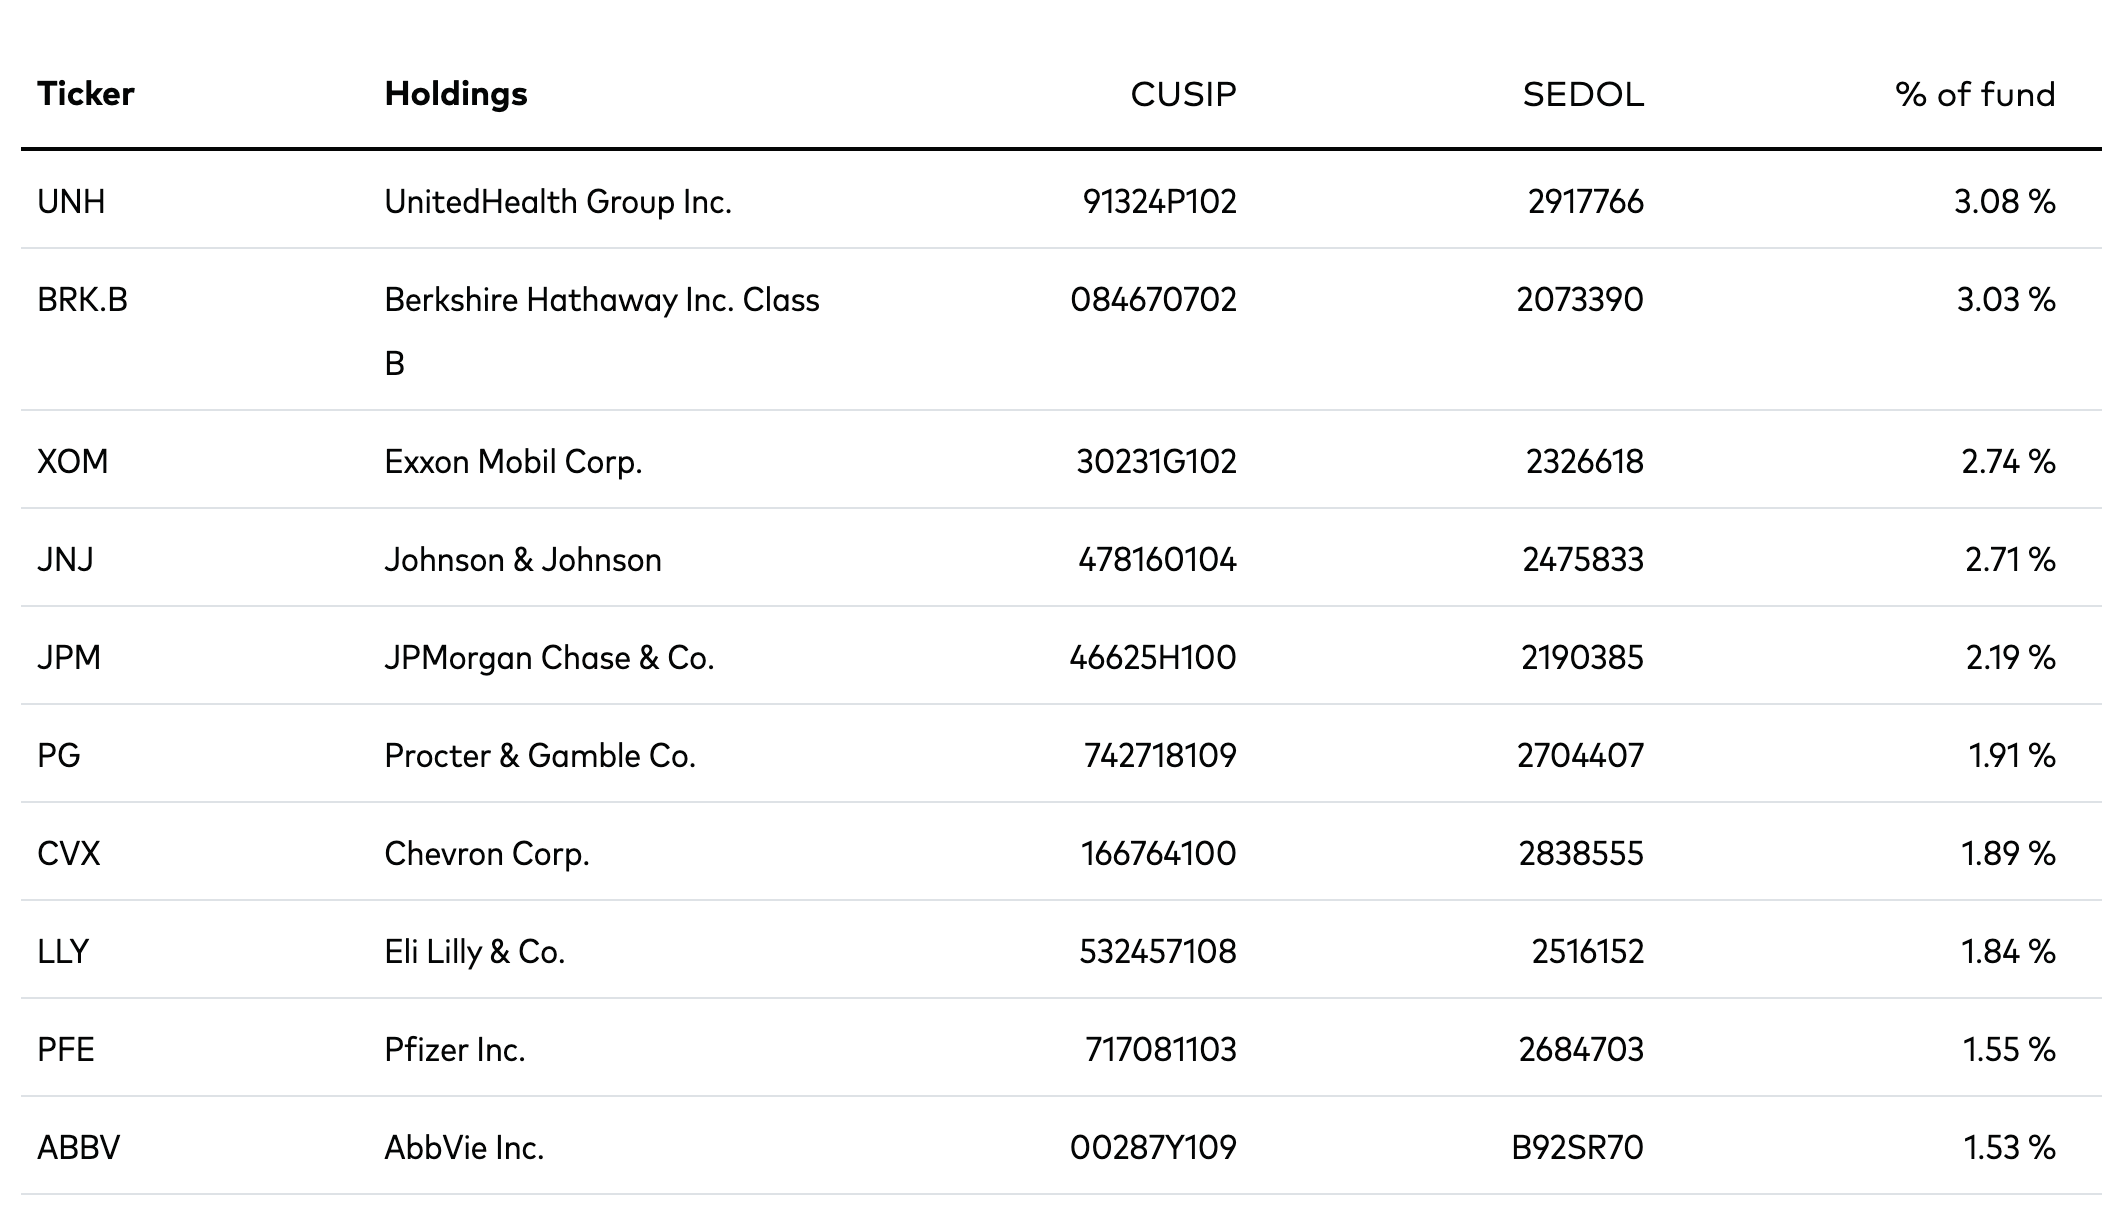
As mentioned previously, VTV ETF has 342 positions overall with its top 10 positions ranging from 3.08% to 1.53%.
There are a lot of companies folks likely recognize including Berkshire Hathaway, Exxon Mobile, Johnson and Johnson, Chevron and Pfizer to name just a few.
Notice the complete absence of FOMO FANGMA stocks (Facebook, Apple, Netflix, Google, Microsoft and Apple).
VTV Info
Ticker: VTV
Number of Stocks: 342
Net Expense Ratio: 0.04
Distributions: Quarterly
AUM: 102.1. Billion
Inception: 01/26/2004
VTV ETF offers a 1-2 knock-out combination of affordability (0.04 expense ratio) and liquidity (102.1 Billion AUM).
It’s been in the ETF game since 2004 which makes it relatively old in the tooth but certainly stable.
For investors seeking income, Vanguard Value ETF will provide quarterly distributions.

Vanguard Value ETF: Principal Investment Strategy and Principal Risk
To better understand the process of how the fund operates, let’s turn our attention towards the prospectus (source: summary prospectus).
Principal Investment Strategies of the Fund
“The Fund employs an indexing investment approach designed to track the performance of the CRSP US Large Cap Value Index, a broadly diversified index predominantly made up of value stocks of large U.S. companies.
The Fund attempts to replicate the target index by investing all, or substantially all, of its assets in the stocks that make up the Index, holding each stock in approximately the same proportion as its weighting in the Index.
Principal Risks
An investment in the Fund could lose money over short or long periods of time.
You should expect the Fund’s share price and total return to fluctuate within a wide range.
The Fund is subject to the following risks, which could affect the Fund’s performance:
• Stock market risk, which is the chance that stock prices overall will decline.
Stock markets tend to move in cycles, with periods of rising prices and periods of falling prices.
The Fund’s target index tracks a subset of the U.S. stock market, which could cause the Fund to perform differently from the overall stock market.
In addition, the Fund’s target index may, at times, become focused in stocks of a particular market sector, which would subject the Fund to proportionately higher exposure to the risks of that sector.
• Investment style risk, which is the chance that returns from large-capitalization value stocks will trail returns from the overall stock market.
Large-cap stocks tend to go through cycles of doing better—or worse—than other segments of the stock market or the stock market in general.
These periods have, in the past, lasted for as long as several years. 2 Because ETF Shares are traded on an exchange, they are subject to additional risks:
• The Fund’s ETF Shares are listed for trading on NYSE Arca and are bought and sold on the secondary market at market prices.
Although it is expected that the market price of an ETF Share typically will approximate its net asset value (NAV), there may be times when the market price and the NAV differ significantly.
Thus, you may pay more or less than NAV when you buy ETF Shares on the secondary market, and you may receive more or less than NAV when you sell those shares.
• Although the Fund’s ETF Shares are listed for trading on NYSE Arca, it is possible that an active trading market may not be maintained.
• Trading of the Fund’s ETF Shares may be halted by the activation of individual or marketwide trading halts (which halt trading for a specific period of time when the price of a particular security or overall market prices decline by a specified percentage).
Trading of the Fund’s ETF Shares may also be halted if (1) the shares are delisted from NYSE Arca without first being listed on another exchange or (2) NYSE Arca officials determine that such action is appropriate in the interest of a fair and orderly market or for the protection of investors.
VTV ETF – Sector Exposure
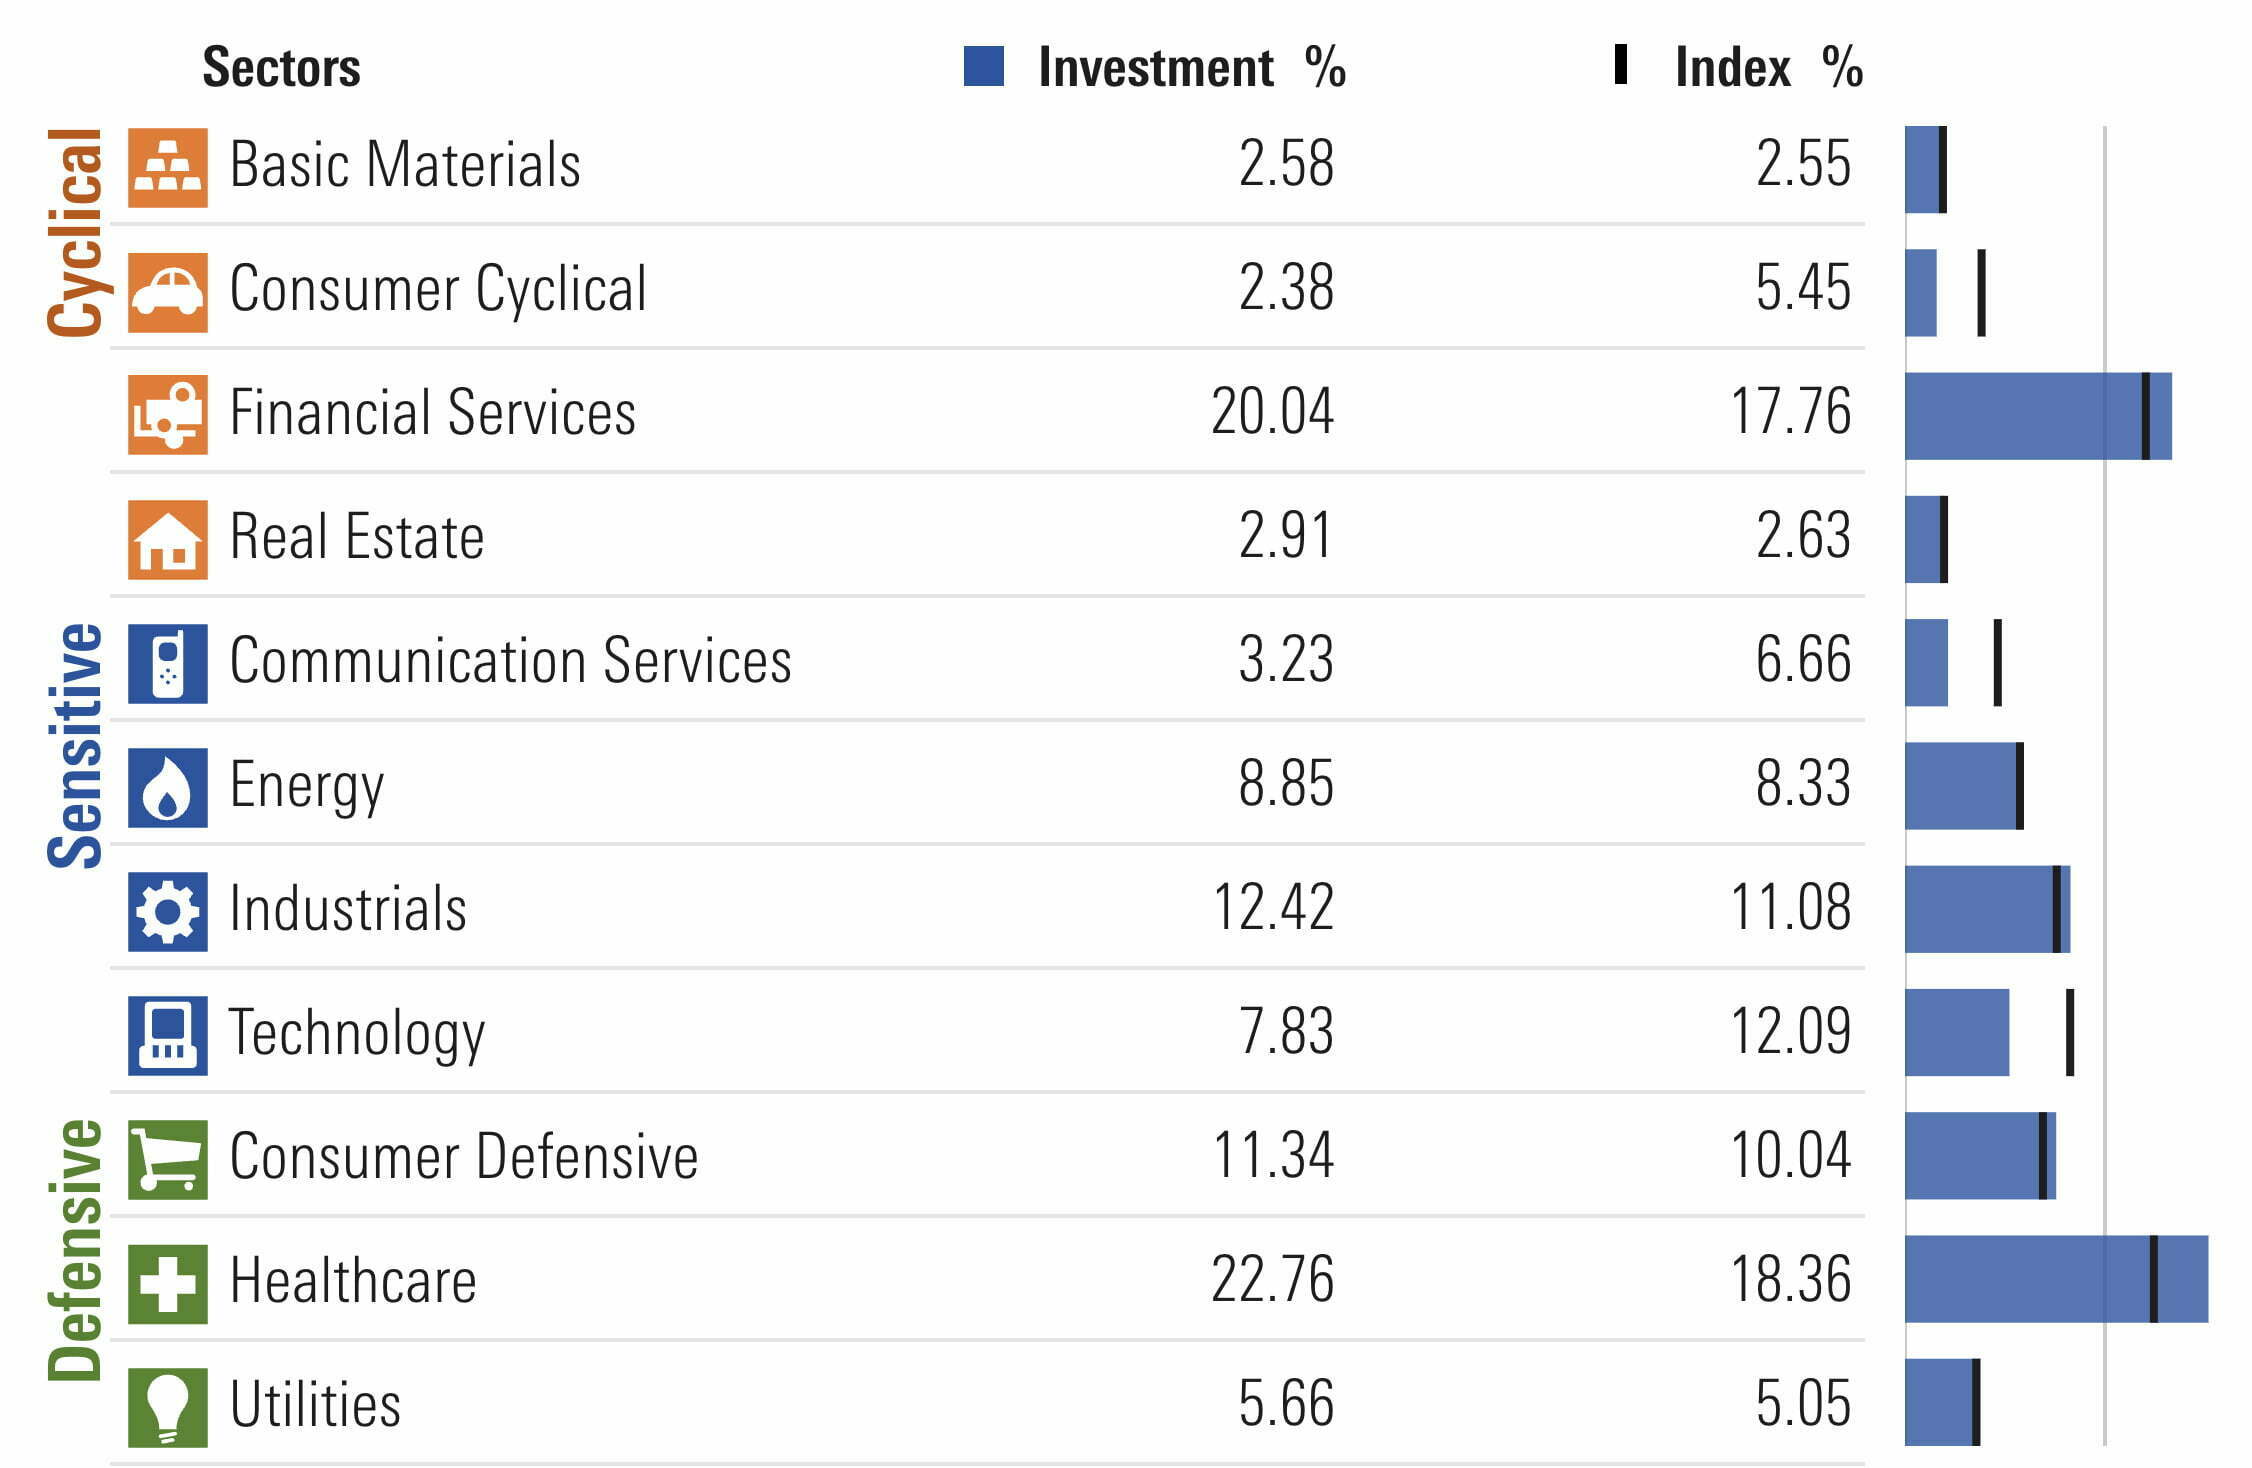
Vanguard Value ETF offers 20%+ sector exposure to both Healthcare and Financial Services.
It is relatively underweight Technology, Communication Services and Consumer Cyclical.
It is slightly overweight Industrials and Consumer Defensive.
Overall, if you’re looking to avoid “technology clogging” blend strategies you’ll be impressed to see VTV ETF only has a 7.83% allocation.
VTV ETF – Style Measures
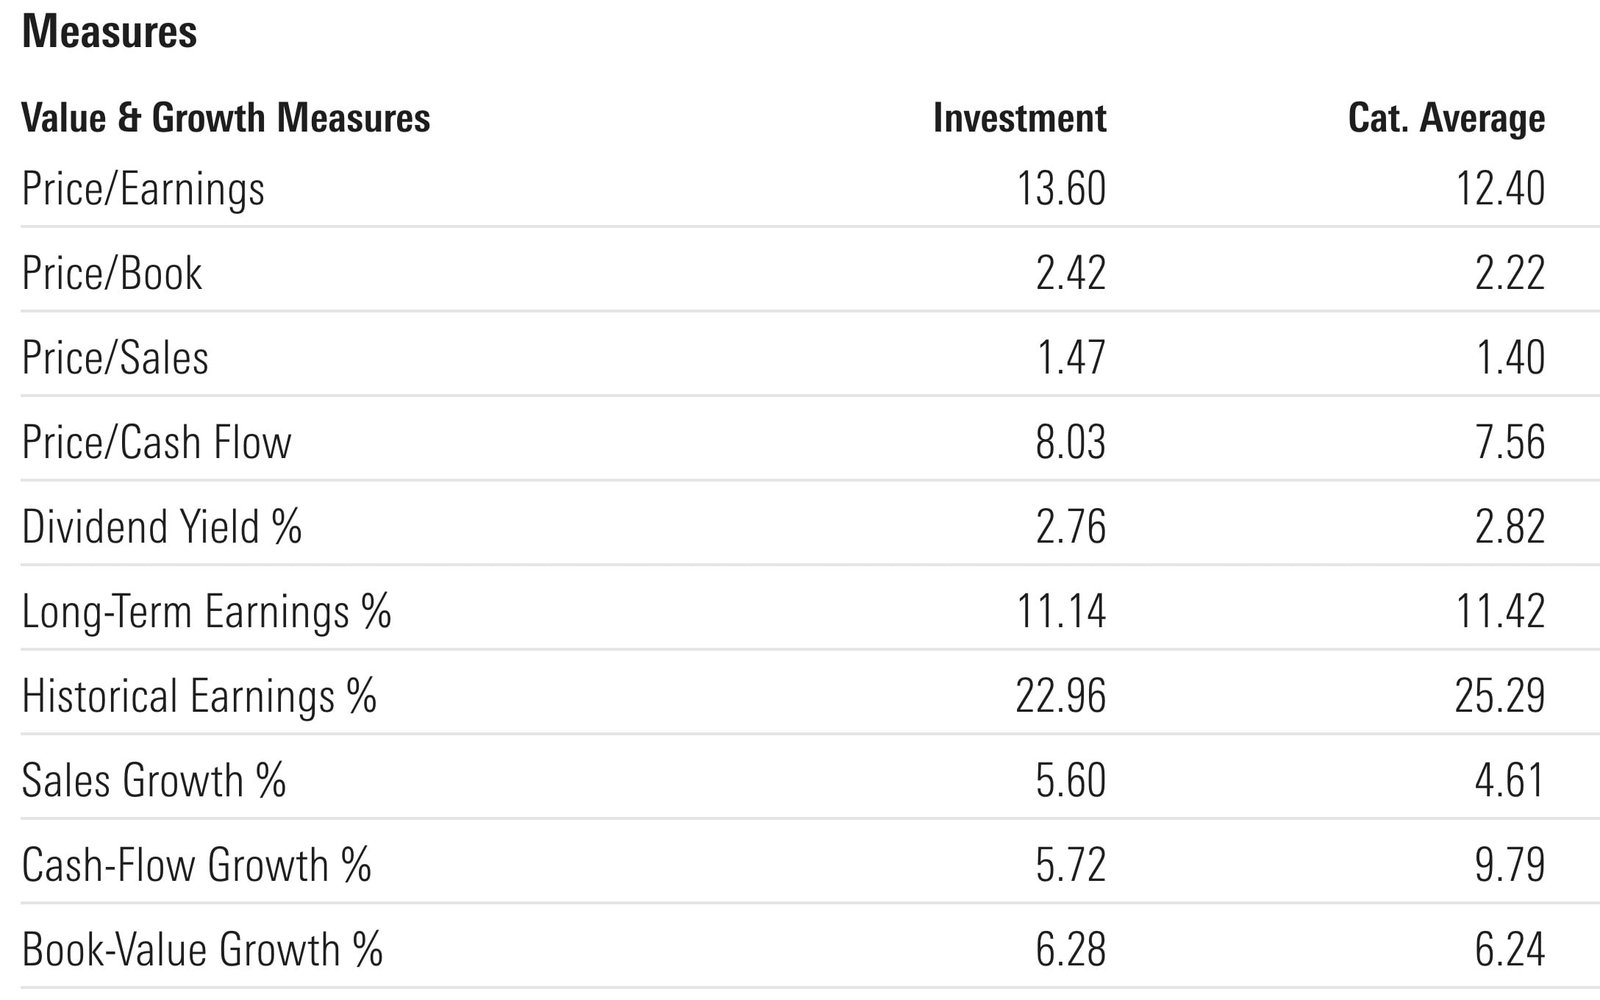
When it comes to measures VTV ETF is relatively more expensive than category averages with a P/E of 13.60 vs 12.40.
It deviates most in terms of Cash-Flow Growth % and Historical Earnings %.
VTV ETF – Stock Style
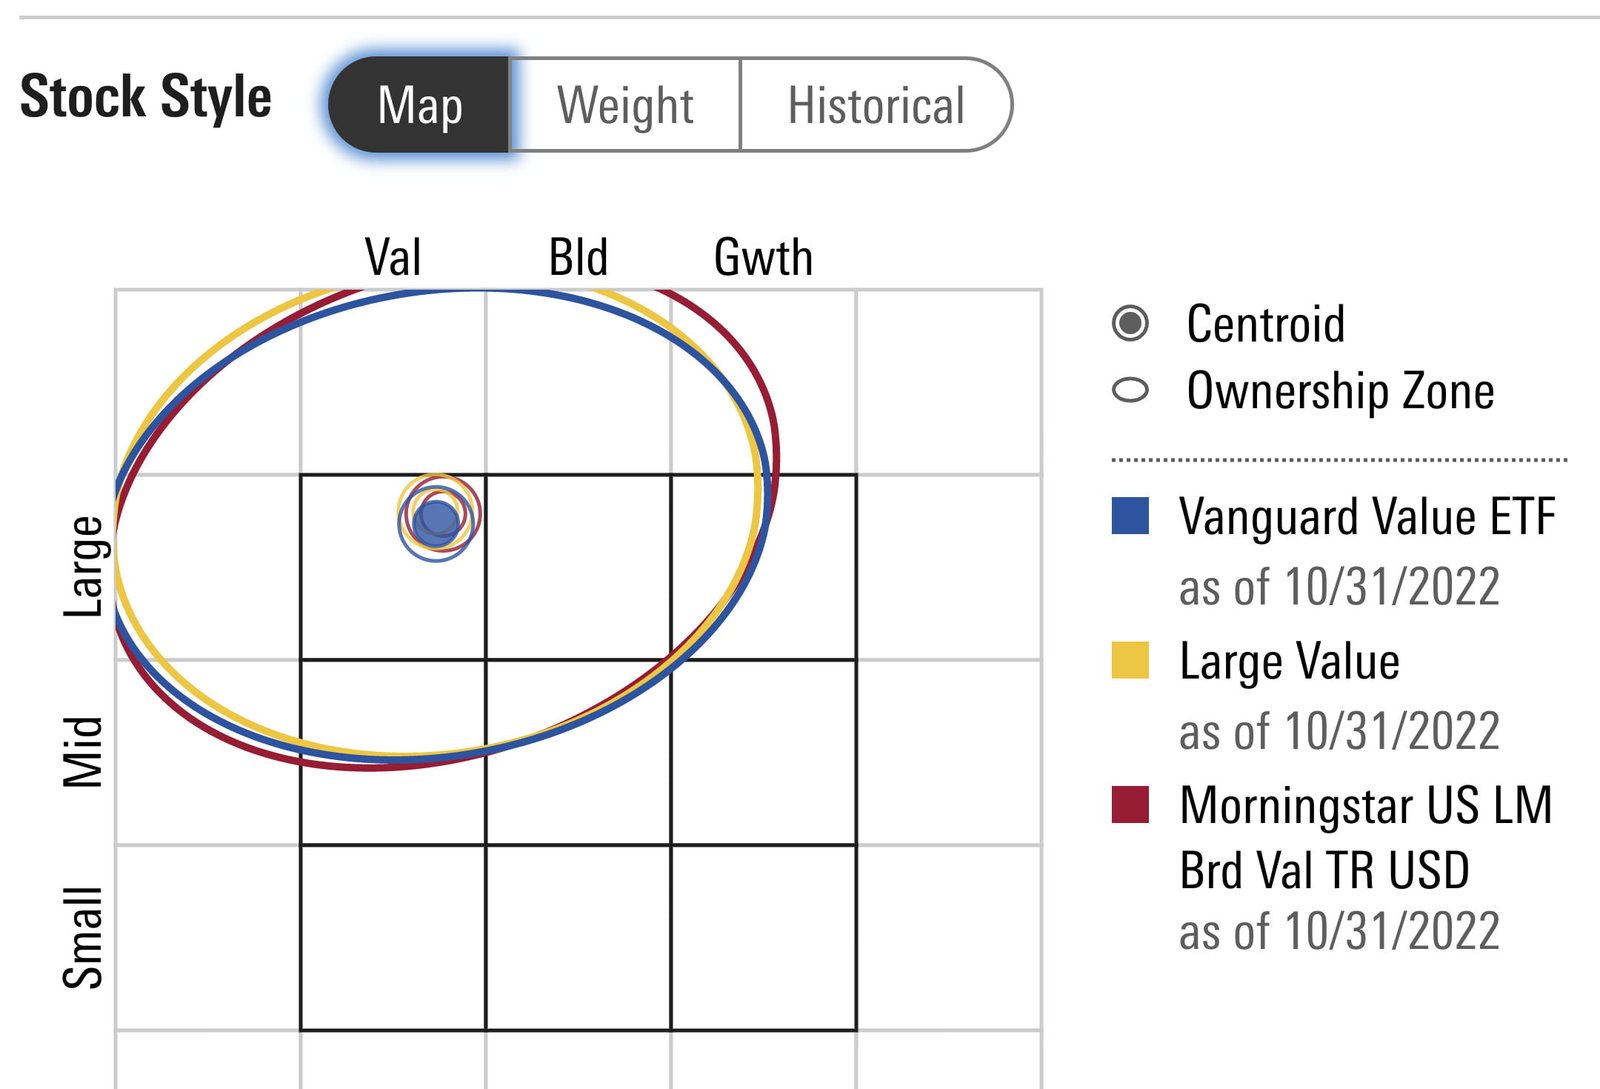
As might be expected Vanguard Value ETF nails its large cap value mandate with a clean bullseye in the upper left hand corner of the style box.
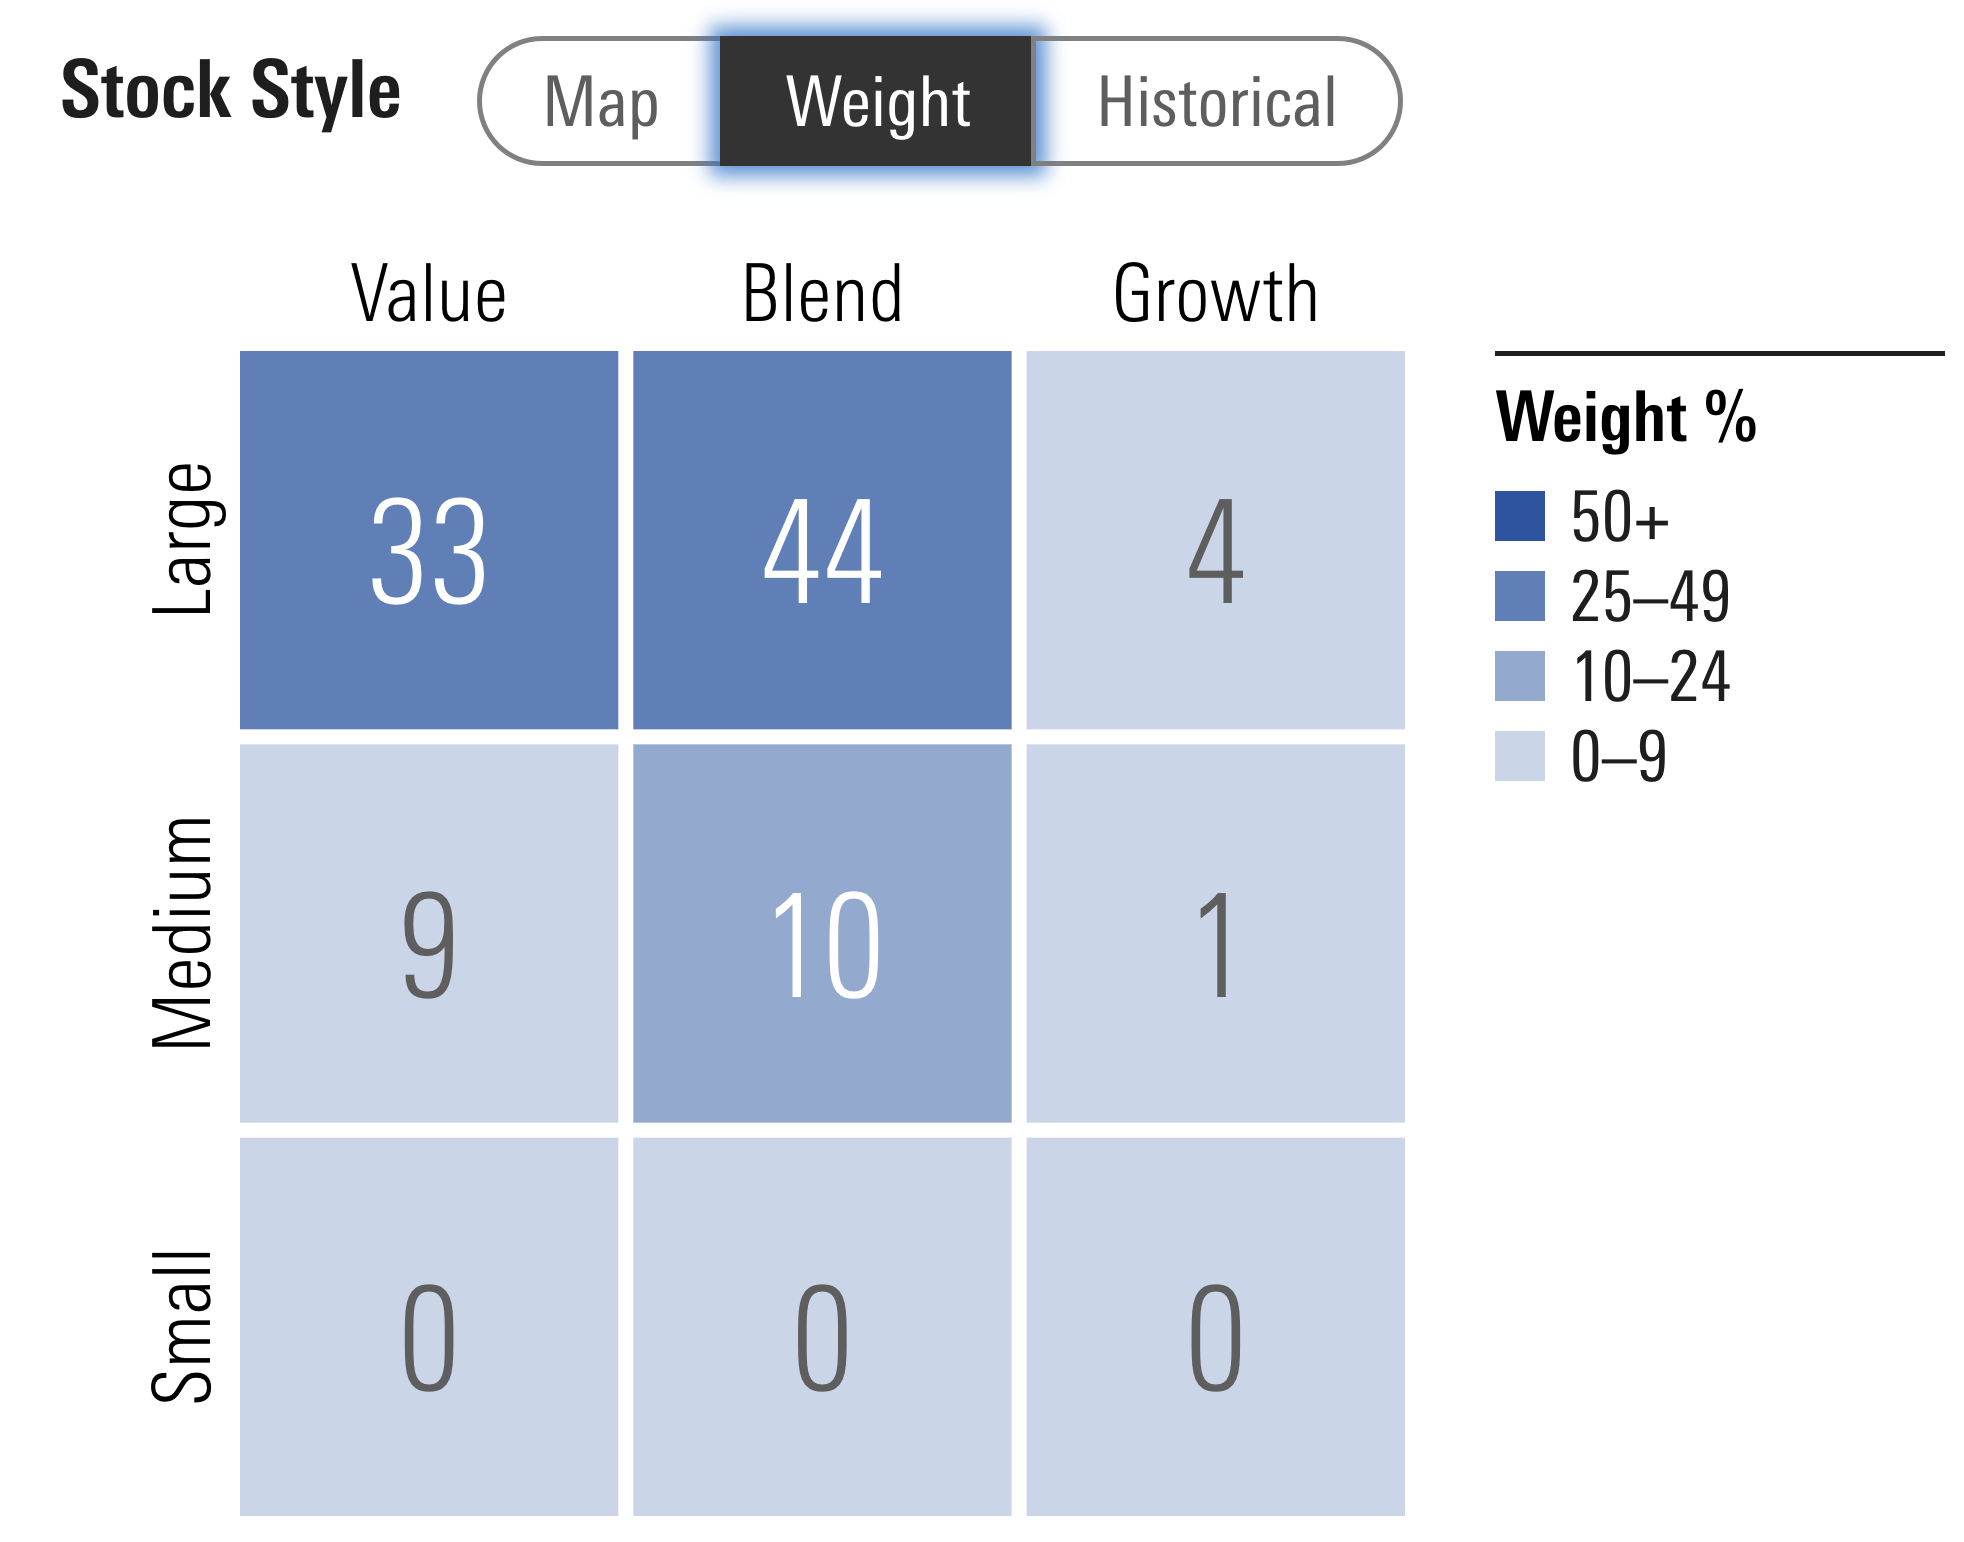
Overall, VTV ETF gives you significant large cap value exposure.
However, it is noteworthy that “blend” takes up 54% of the fund.
Given it is a fund with a large number of positions it is not surprising to see a lack of value concentration.
VTV ETF – Factor Profile
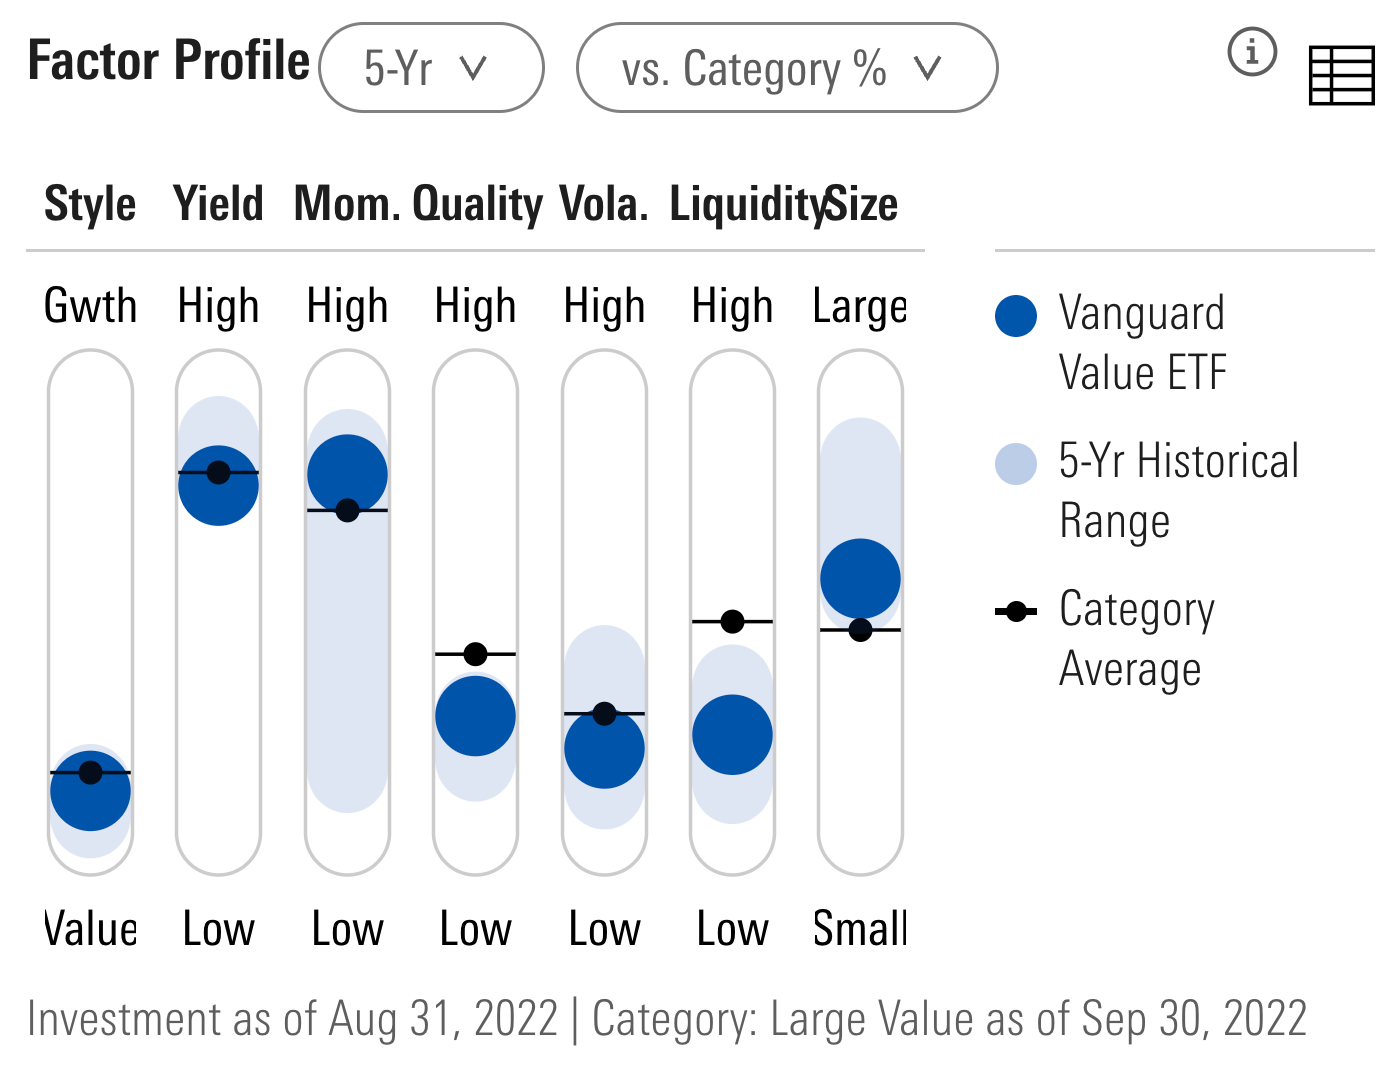
VTV ETF currently offers factor thirsty investors impressive hard-lever pulls in terms of its value-momentum, low volatility and yield exposure.
Noteworthy is that quality is rather low.
VTV ETF – Fama-French 5-Factor Model
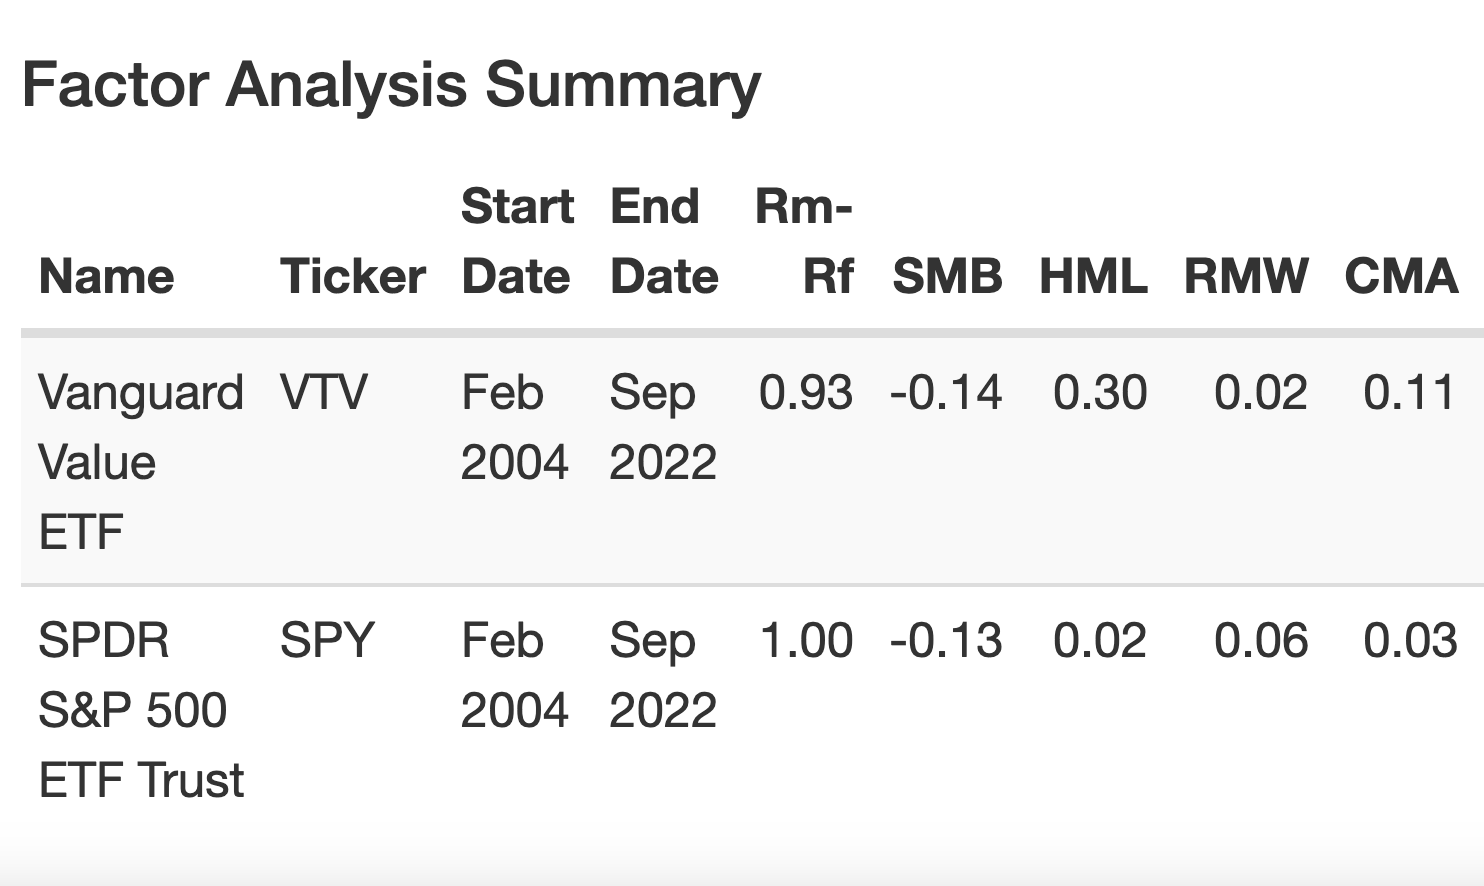
To close out our factor analysis it is noteworthy that Vanguard Value ETF posts strong HML (high minus low) to capture the value factor but doesn’t offer anything significant aside from that.

Vanguard Value ETF Performance
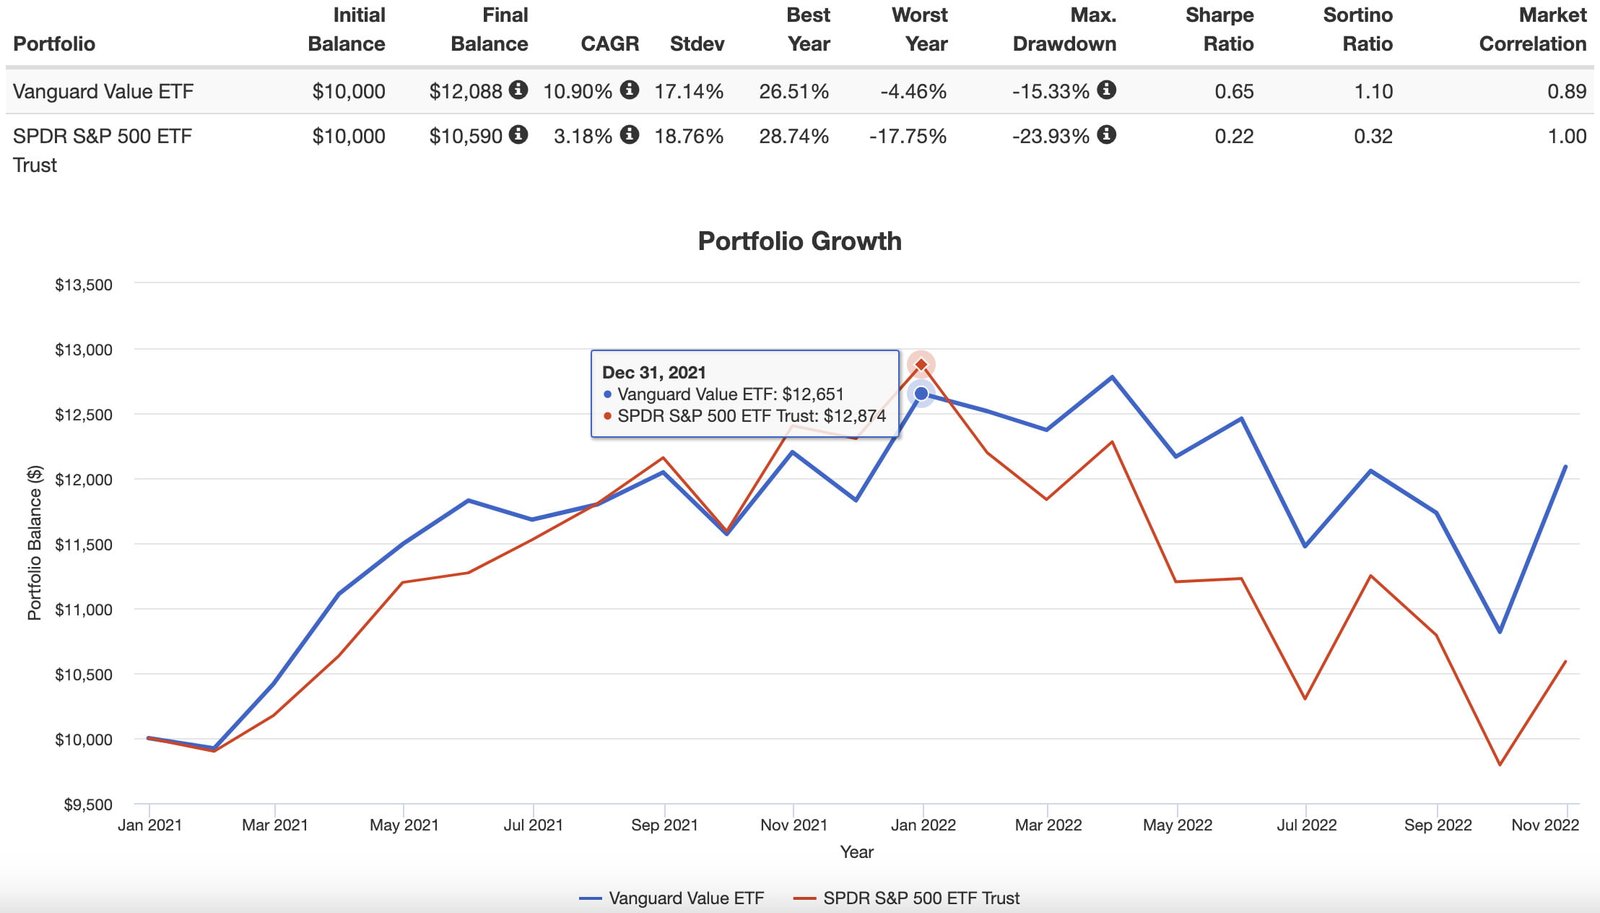
If we look at a recent performance VTV ETF has outperformed the S&P 500 over the last couple of years offering a CAGR of 10.90% versus 3.18%.
However, if we look at the bigger picture it has underperformed the S&P 500 since its inception.
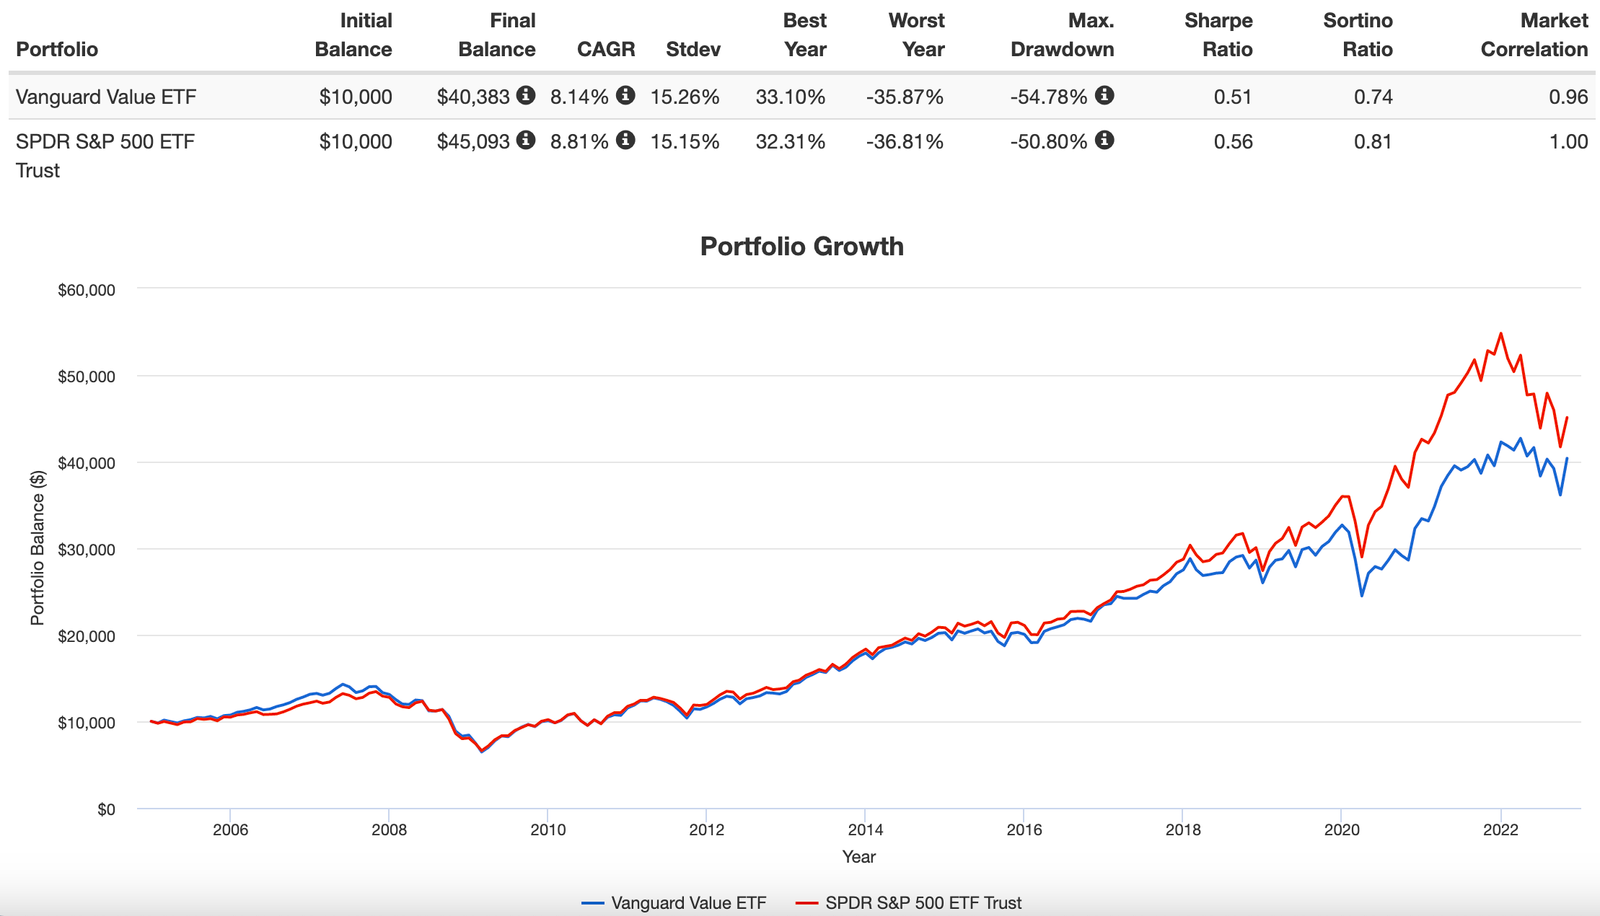
It’ll be interesting to see if the tables turn given that VTV ETF has mostly existed in what has generally been referred to as a “growth” period for US stocks.

VTV ETF Pros and Cons
Let’s examine the pros and cons of Vanguard Value ETF.
VTV Pros
- Offers investors exposure to US Large Cap Value companies as a way to diversify away from blend vanilla MCW products
- Has a rock-bottom all in expense ratio of 0.04
- Because it is “large cap” companies it offers more “brand name stocks” that investors are familiar with in real life
- Hits the upper left hand bullseye of large-cap value on the Morningstar style box fulfilling its mandate
- Has offered relative outperformance over the past couple of years versus US Large Cap blend strategies
- Offers factor exposure to momentum, yield and low volatility aside from just value
VTV Cons
- Doesn’t offer more concentrated value exposure with a fund that has 342 positions
- Doesn’t cover the full spectrum of mid-cap and small-cap exposure meaning investors seeking that will have to find separate funds

VTV Potential Portfolio Solutions
These asset allocation ideas and model portfolios presented herein are purely for entertainment purposes only. This is NOT investment advice. These models are hypothetical and are intended to provide general information about potential ways to organize a portfolio based on theoretical scenarios and assumptions. They do not take into account the investment objectives, financial situation/goals, risk tolerance and/or specific needs of any particular individual.
Now that we’ve taken a thorough look at VTV ETF let’s see how it can potentially fit into a portfolio at large.
100% ALL Equity Portfolio
Is it possible to just purchase Vanguard Value ETF and be done with it?
Well, that entirely depends on your investing goals.
If you’re an equity-only value investor that is “okay” with having “home country bias” while preferring to hang-out in large cap territory (with stocks that are well known from a brand perspective) then VTV and done is a possibility.
100% VTV ETF.
US Value 60/40 Portfolio
If you’re committed to US value investing but want across the board coverage for large, mid and small cap stocks you might consider the following portfolio.
20% VTV ETF – Vanguard Value ETF
20% ROE ETF – Vanguard Mid-Cap Value ETF
20% VBR ETF – Vanguard Small-Cap Value ETF
40% BND ETF – Vanguard Total Bond Market ETF
Here you’ve got equal slices of Vanguard value (large-cap, mid-cap and small-cap) funds for a high conviction US value strategy.
You’ll round out your portfolio by dropping in 40% of BND ETF for your US Aggregate bond exposure.
This portfolio offers more mid-cap and small-cap exposure than a typical SPY/AGG 60/40 portfolio.
US Value + Blend 60/40 Portfolio
Finally, for investors who want a blend of value and vanilla combined nicely in a 60/40 wrapper we have the following suggestion:
30% VOO ETF
30% VTV ETF
40% BND ETF
Here you’ve got a 50/50 split between the S&P 500 and Vanguard Value ETF along with US aggregate bonds.

What Others Have To Say About VTV ETF
Now that we’ve covered a few different portfolio solutions let’s see what others have to say about the fund for those who prefer video format.
source: Firefighters Financial Toolbox YouTube
source: 401k and Beyond! YouTube
source: MindWealth YouTube
source: Joshua Talks Money on YouTube
source: Heritage Wealth Planning on YouTube

Nomadic Samuel Final Thoughts
As a factor investor I’m perpetually seeking funds that disentangle me from market-cap weighted index investing.
VTV ETF represents a US Large Cap Value solution that offers the benefit of “market-cap weighted” low cost fees while providing value factor exposure.
This in and of itself makes the product appealing for investors who are cost conscious but seeking “evidence based” advanced portfolio solutions.
However, it’s not a slam-dunk decision to select a fund such as Vanguard Value ETF.
Fund providers such as Avantis and Alpha Architect offer “deeper value” products with funds featuring less positions and more concentrated value exposure.
Moreover, these other value ETFs aren’t exclusively hanging out in large-cap value territory with significant mid-cap and small-cap style box exposure.
Historically, small-cap value and mid-cap value have provided investors with higher returns in both the 20th and 21st century.
That should give investors some food for thought.
Hence, it is important as an investor to create a hierarchy of needs/preferences in order to make the most informed decision.
Thus, if US large cap value at the lowest cost is what you’re seeking VTV ETF is likely a slam-dunk consideration.
However, if you prefer to hang-out in small-cap and mid-cap territory (and prefer deeper and more concentrated exposure) you’ll likely be looking elsewhere as you continue to shop for value funds.
Now over to you.
Are you a value investor?
Is VTV ETF on your radar?
Let me know in the comments below.
That’s all I’ve got.
Ciao for now.
Important Information
Comprehensive Investment Disclaimer:
All content provided on this website (including but not limited to portfolio ideas, fund analyses, investment strategies, commentary on market conditions, and discussions regarding leverage) is strictly for educational, informational, and illustrative purposes only. The information does not constitute financial, investment, tax, accounting, or legal advice. Opinions, strategies, and ideas presented herein represent personal perspectives, are based on independent research and publicly available information, and do not necessarily reflect the views or official positions of any third-party organizations, institutions, or affiliates.
Investing in financial markets inherently carries substantial risks, including but not limited to market volatility, economic uncertainties, geopolitical developments, and liquidity risks. You must be fully aware that there is always the potential for partial or total loss of your principal investment. Additionally, the use of leverage or leveraged financial products significantly increases risk exposure by amplifying both potential gains and potential losses, and thus is not appropriate or advisable for all investors. Using leverage may result in losing more than your initial invested capital, incurring margin calls, experiencing substantial interest costs, or suffering severe financial distress.
Past performance indicators, including historical data, backtesting results, and hypothetical scenarios, should never be viewed as guarantees or reliable predictions of future performance. Any examples provided are purely hypothetical and intended only for illustration purposes. Performance benchmarks, such as market indexes mentioned on this site, are theoretical and are not directly investable. While diligent efforts are made to provide accurate and current information, “Picture Perfect Portfolios” does not warrant, represent, or guarantee the accuracy, completeness, or timeliness of any information provided. Errors, inaccuracies, or outdated information may exist.
Users of this website are strongly encouraged to independently verify all information, conduct comprehensive research and due diligence, and engage with qualified financial, investment, tax, or legal professionals before making any investment or financial decisions. The responsibility for making informed investment decisions rests entirely with the individual. “Picture Perfect Portfolios” explicitly disclaims all liability for any direct, indirect, incidental, special, consequential, or other losses or damages incurred, financial or otherwise, arising out of reliance upon, or use of, any content or information presented on this website.
By accessing, reading, and utilizing the content on this website, you expressly acknowledge, understand, accept, and agree to abide by these terms and conditions. Please consult the full and detailed disclaimer available elsewhere on this website for further clarification and additional important disclosures. Read the complete disclaimer here.


