It’s rare to find an ETF that nails the trifecta of excellent branding, strategy and performance all in one shot.
And yet the ETF we’re reviewing today on Picture Perfect Portfolios nails it across the board.
Enter the room US Pacer Cash Cows 100.
Ticker: COWZ ETF
Its strategy is brilliant and yet easy to understand.
It screens the Russell 1000 for the top 100 companies based on free cash flow yield.
What’s free cash flow yield?
Free Cash Flow: Cash remaining after a company has paid expenses, interest, taxes and long-term investments.
The brilliantly branded “cash cows” refers to companies with cash rich balance sheets that can potentially invest in growth opportunities.
Most typically this manifests in various forms such as stock buybacks, dividends and/or the participation in mergers and acquisitions.
The literal definition of “cash cow” is as follows (source: wikipedia):
“Cash cow, in business jargon, is a venture that generates a steady return of profits that far exceed the outlay of cash required to acquire or start it. Many businesses attempt to create or acquire such ventures, since they can be used to boost a company’s overall income and to support less profitable endeavours.”
The idea is that these stocks offer the steady supply of income “aka milk” that investors are seeking in a hassle free manner.
Who wouldn’t want some “cash cows” in their portfolio?
Let’s find out in this ETF review if this product that received 5-Star Morningstar distinction is worthy of serious consideration or just a clever marketing gimmick.

COWS ETF Review | US Pacer Cash Cows 100 ETF (Utilizing A Free Cash Flow Strategy)
Hey guys! Here is the part where I mention I’m a travel blogger, vlogger and content creator! This investing opinion blog post ETF Fund Review is entirely for entertainment purposes only. There could be considerable errors in the data I gathered. This is not financial advice. Do your own due diligence and research. Consult with a financial advisor.

Pacer ETFS | Strategy Driven ETFs®
Pacer is an ETF provider that hit my radar a couple of years ago.
I was first lured in by its flagship “TrendPilot” series of funds that offer trend-following investment solutions.
Moreover, it wasn’t until later on that I became aware of its “cash cows” series that has expanded to include International and Emerging markets.
Furthermore, for investors who want to assemble the building blocks of these mandates in one neat package you’ll also find fund of funds solutions.
Overall, the more I dig around the more I’m impressed by Pacer ETFs as they also provide factor focused funds along with thematic and custom series funds for investors seeking evidence based products.
source: Pacer ETFs on YouTube

The Case For “Cash Cows” Investing | Free Cash Flow Investment Strategy
We briefly covered both the concept of “cash cows” and the strategy of screening for companies with excellent “free cash flow” metrics.
Let’s dig in deeper.
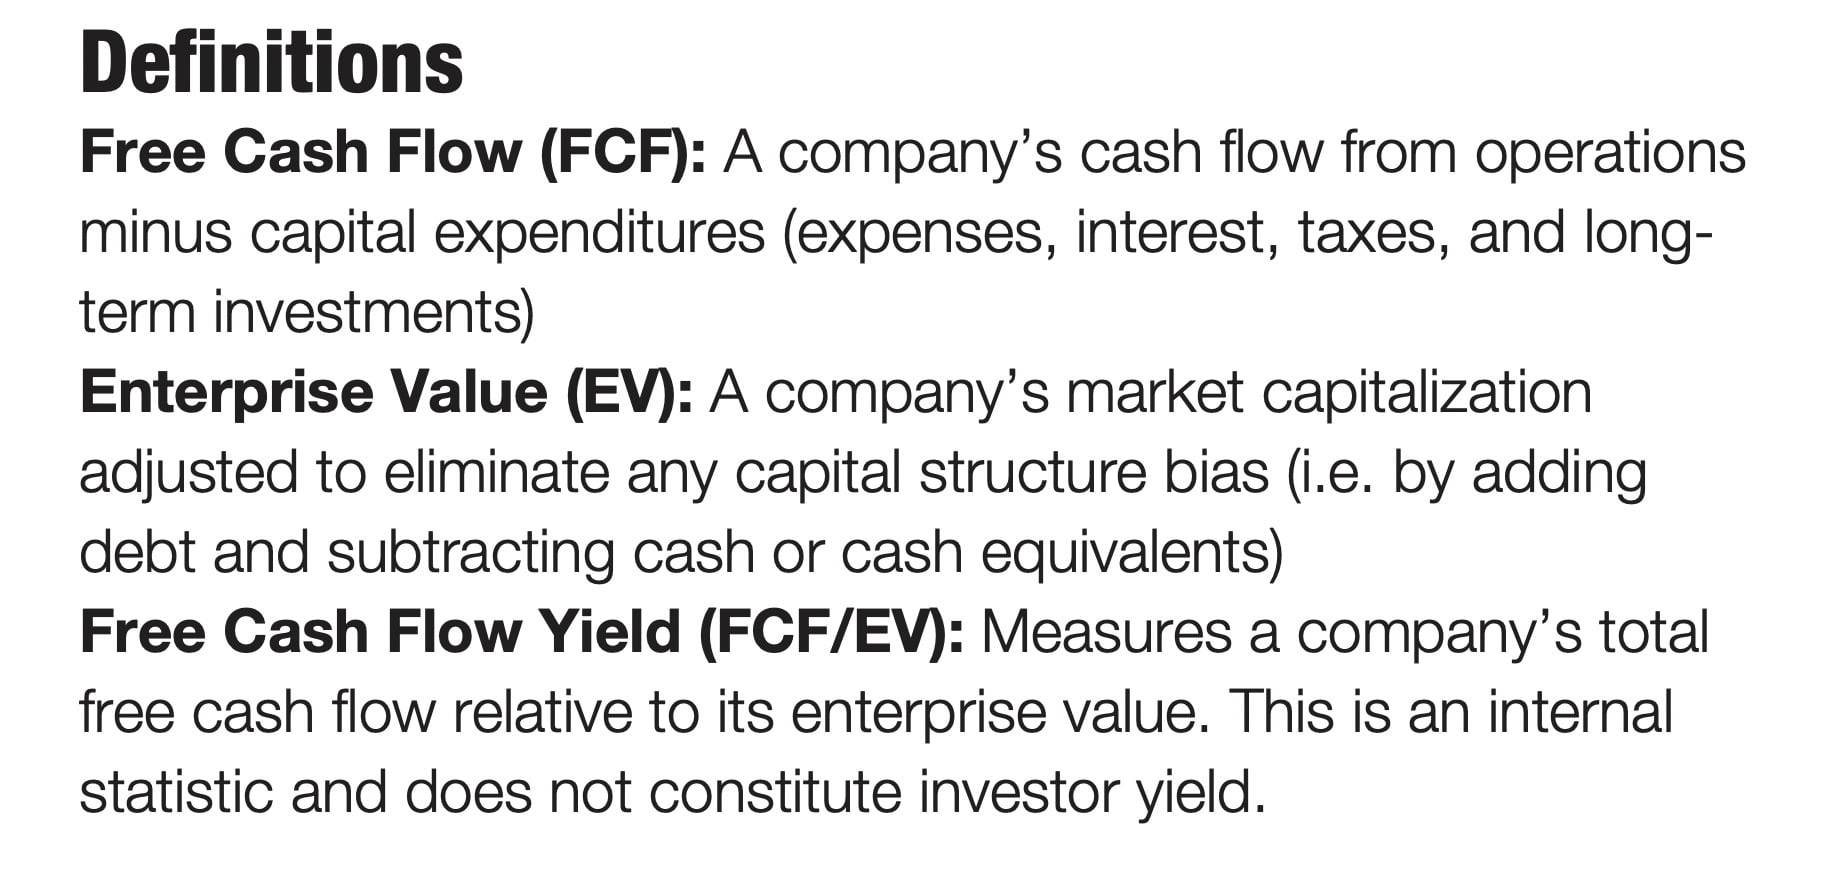
Free Cash Flow (FCF): “A company’s cash flow from operations minus capital expenditures.”
Enterprise Value (EV): “A company’s market capitalization plus its debt and minus its cash and cash equivalents.”
Free Cash Flow Yield: “FCF / EV”
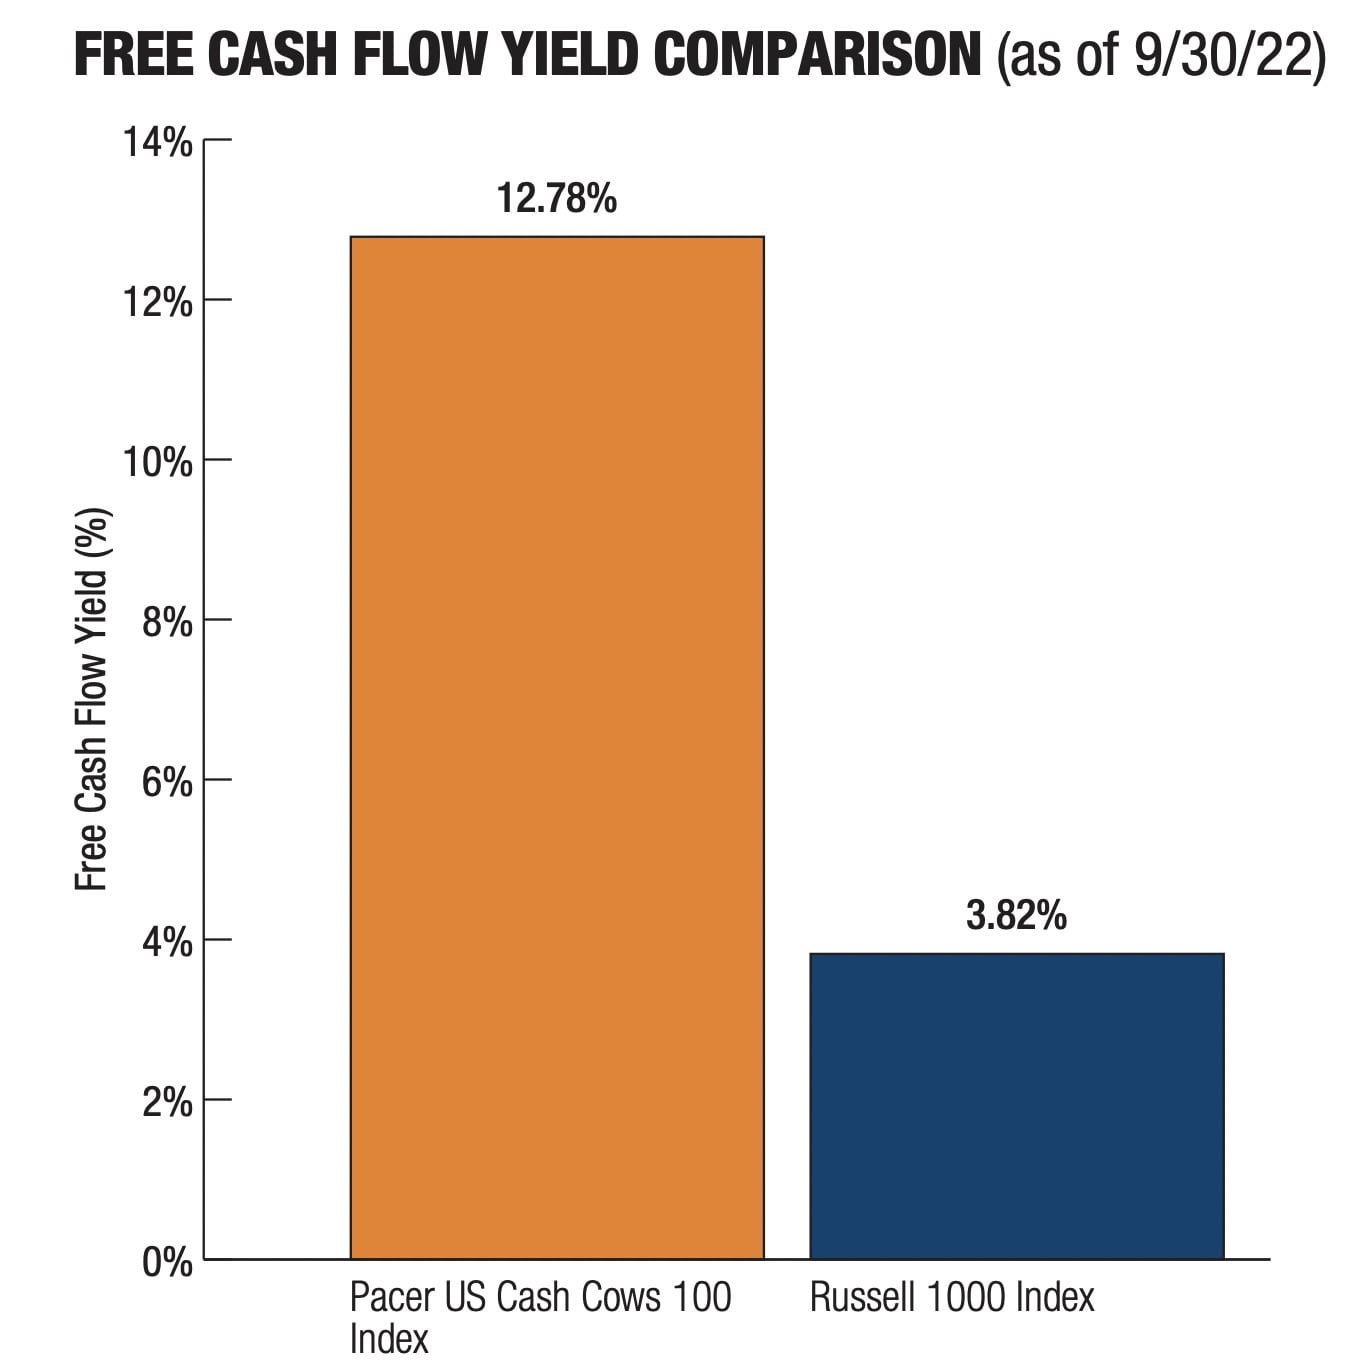
Above we’re given the “cash cow” recipe for its free cash flow yield.
With a combination of “free cash flow” and “enterprise value” it’s clear that the fund is seeking quality companies that are undervalued.
Got milk?
Sayonara to junk!
Let’s now nail down exactly how the index works according to the Summary Prospectus of the fund:

Summary Prospectus: COWZ ETF
“The Index uses an objective, rules-based methodology to provide exposure to large and mid-capitalization U.S. companies with high free cash flow yields. Companies with high free cash flow yields are commonly referred to as “cash cows”.
The initial index universe is derived from the component companies of the Russell 1000® Index. The initial universe of companies is screened based on their average projected free cash flows and earnings (if available) over each of the next two fiscal years. Companies with no forward year estimates available for free cash flows or earnings will remain in the Index universe. Companies with negative average projected free cash flows or earnings are removed from the Index universe. Additionally, financial companies, other than real estate investment trusts (“REITs”), are excluded from the Index universe. The remaining companies are ranked by their free cash flow yield for the trailing twelve month period. The equity securities of the 100 companies with the highest free cash flow yield are included in the Index.
The remaining companies are ranked by their free cash flow yield for the trailing twelve month period. The equity securities of the 100 companies with the highest free cash flow yield are included in the Index.
At the time of each rebalance of the Index, the companies included in the Index are weighted in proportion to their trailing twelve month free cash flow, and weightings are capped at 2% of the weight of the Index for any individual company. The Index is reconstituted and rebalanced quarterly as of the close of business on the 3rd Friday of March, June, September, and December based on data as of the 1st Friday of the applicable rebalance month.”
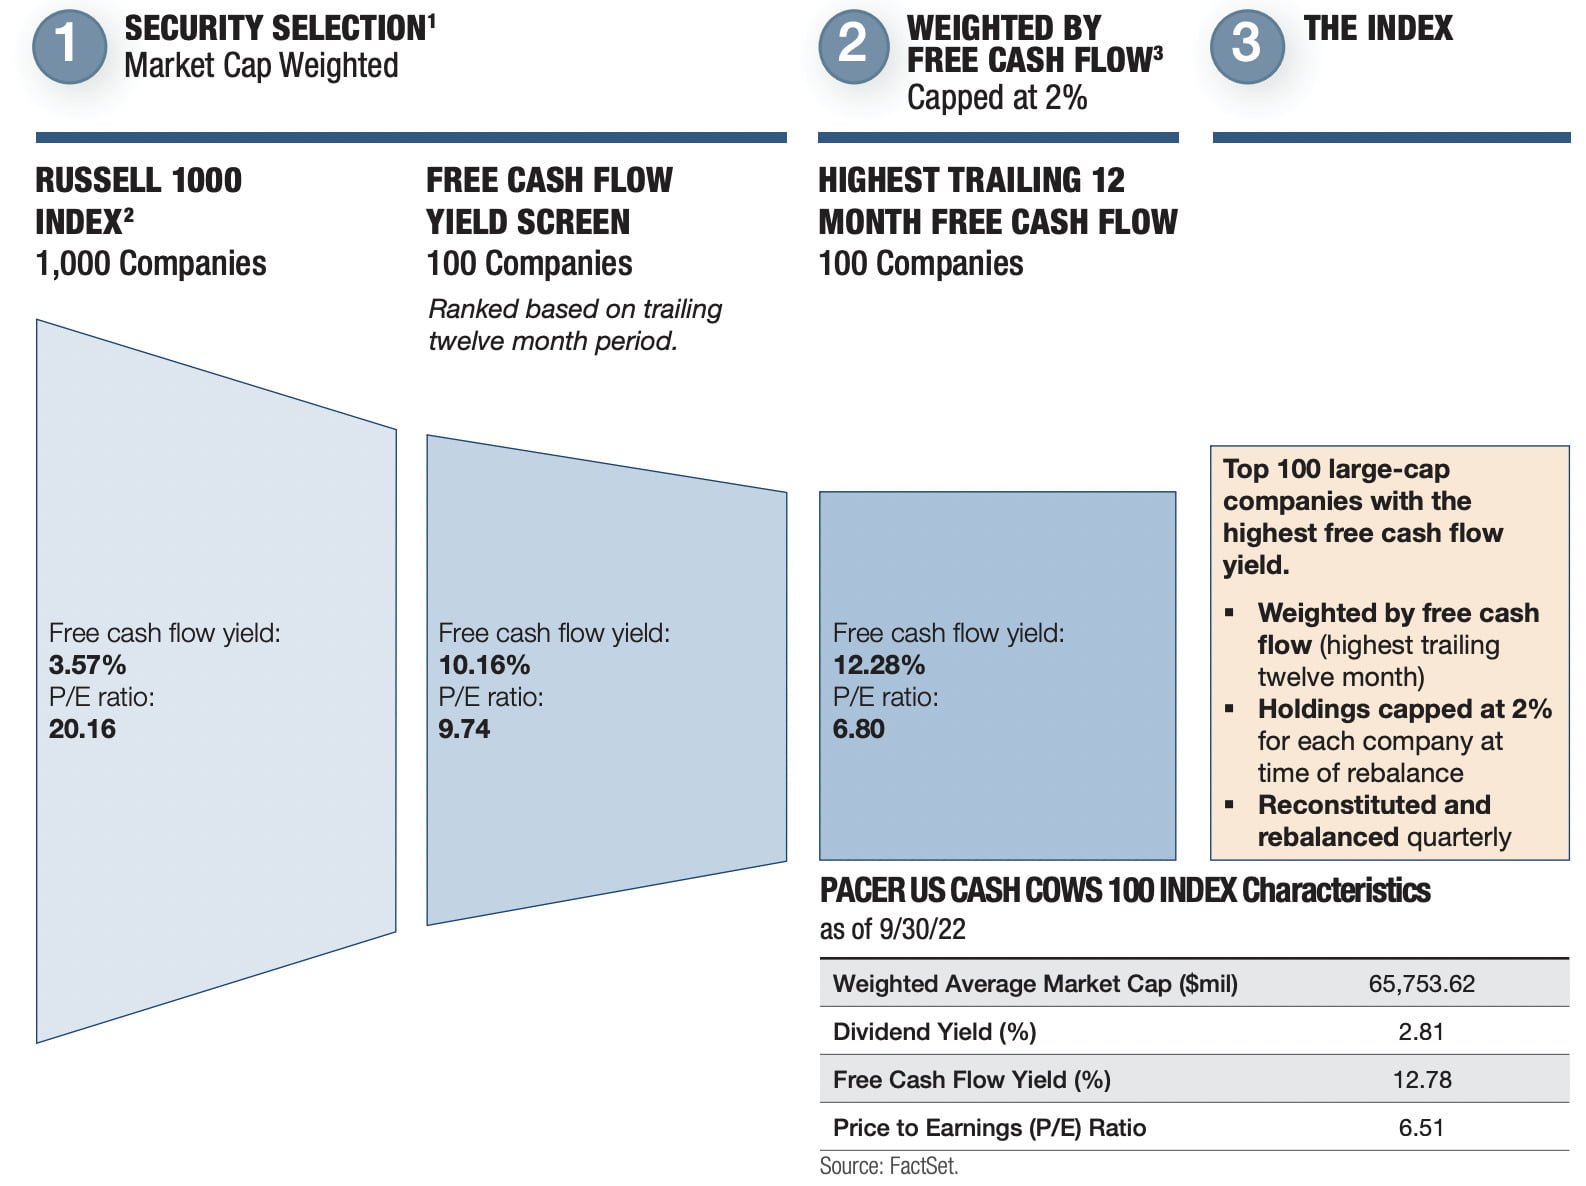
Let’s boil this down to the key points.

COWZ ETF Key Points
- Rules based index
- US Large and Mid cap universe (Russell 1000)
- Screening for high “Free Cash Flow Yields” = FCV / EV
- Sector Exclusion: Financial Services
- Selects 100 Companies with the highest free cash flow yield
- 2% cap for companies
- Quarterly index rebalancing (March, June, September, December)
In a nutshell, COWZ ETF is seeking high quality companies trading at a discount.
The Entire Pacer Cash Cows Roster of ETFs
The Pacer Cash Cows ETF series has expanded, since its initial launches in 2016, to now include a roster of 7 ETFs covering US, International and Emerging Markets.
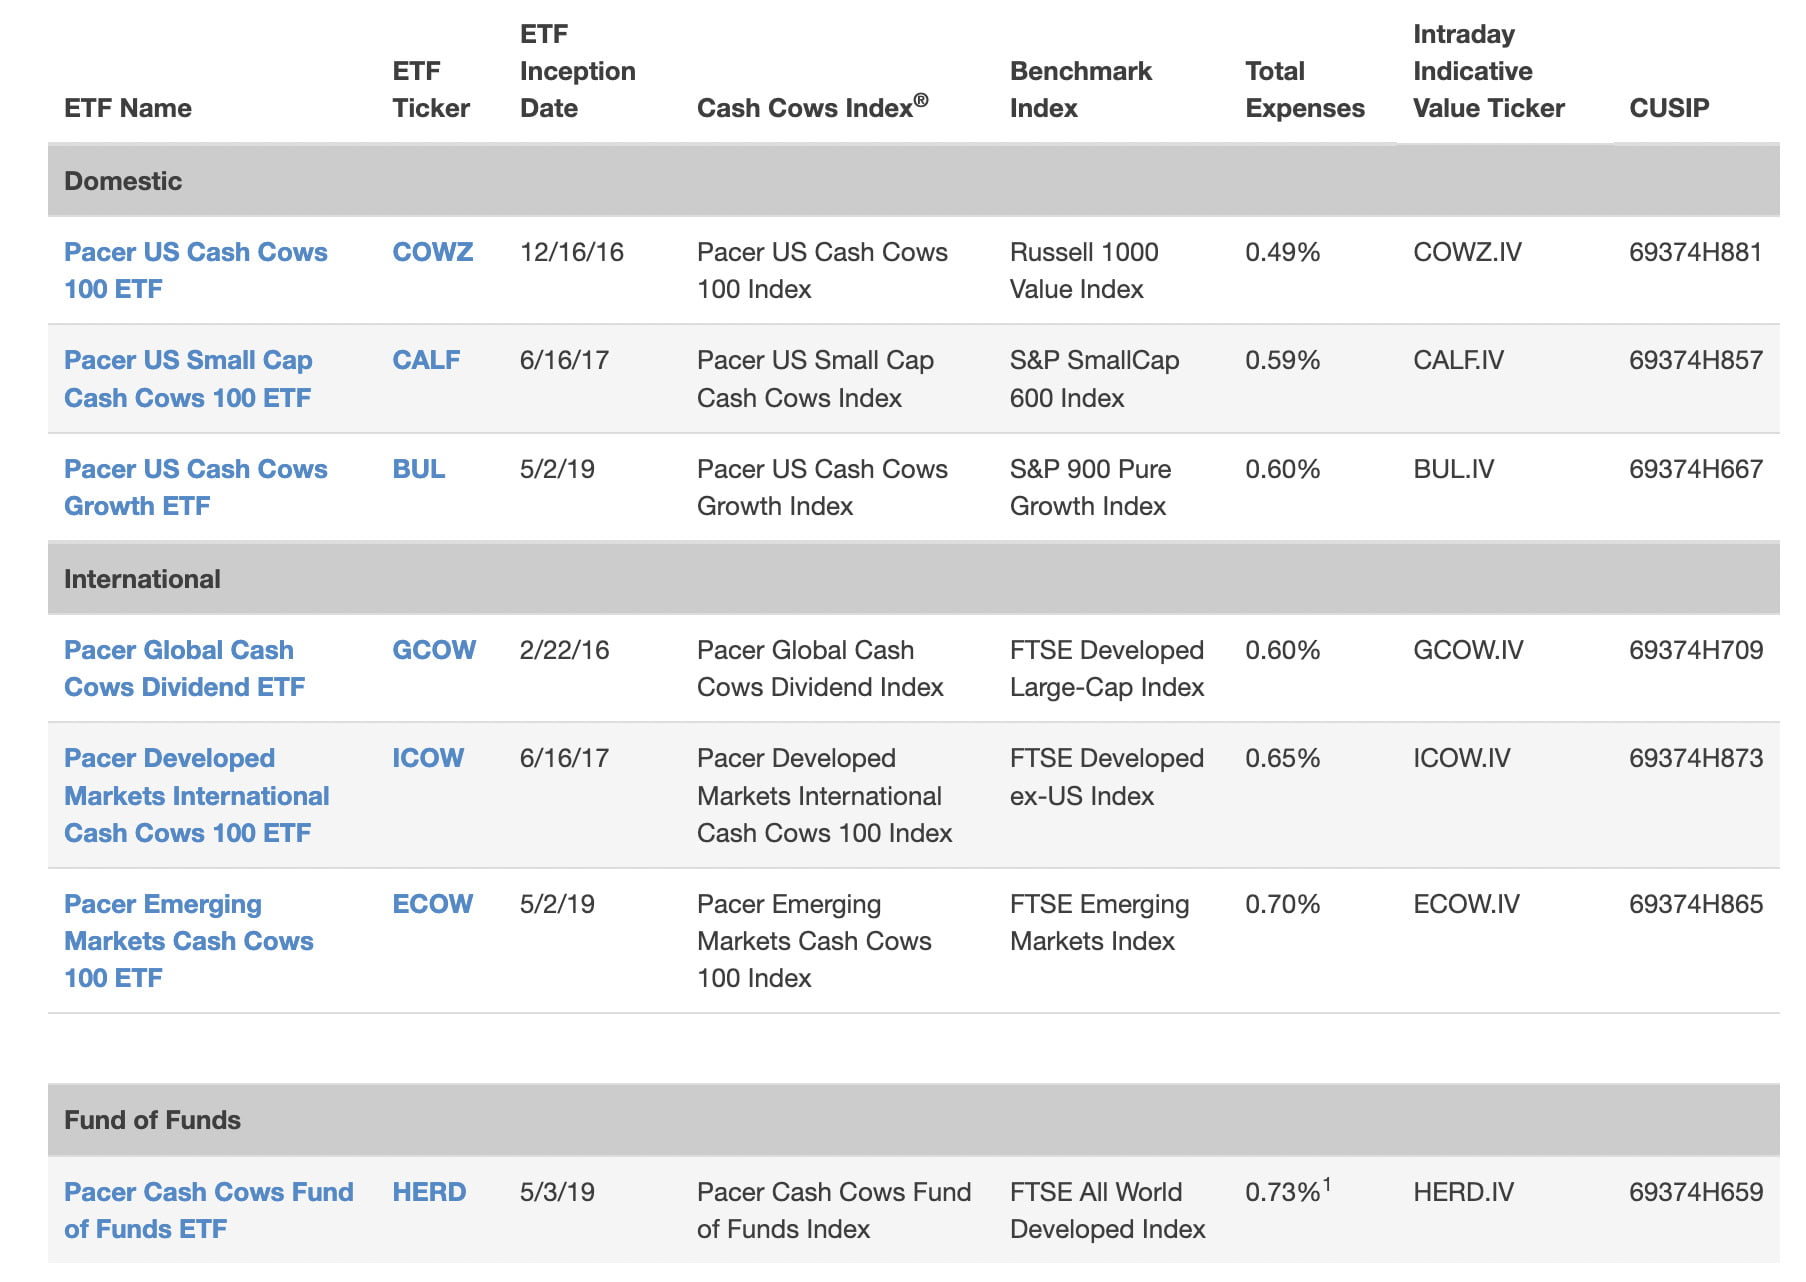
HERD – Pacer Cash Cows Fund of Funds ETF
ECOW – Pacer Emerging Markets Cash Cows 100 ETF
ICOW – Pacer Developed Markets International 100 ETF
GCOW – Pacer Global Cash Cows Dividend ETF
BUL – Pacer US Cash Cows Growth ETF
CALF – Pacer US Small Cap Cash Cows 100 ETF
COWZ – Pacer US Cash Cows 100 ETF
Clever ticker names aside, it is possible to buy everything from the CALF to the HERD.

COWZ ETF Overview, Holdings and Info
Let’s mooove on to popping the hood of Pacer US Cash Cows 100 ETF!
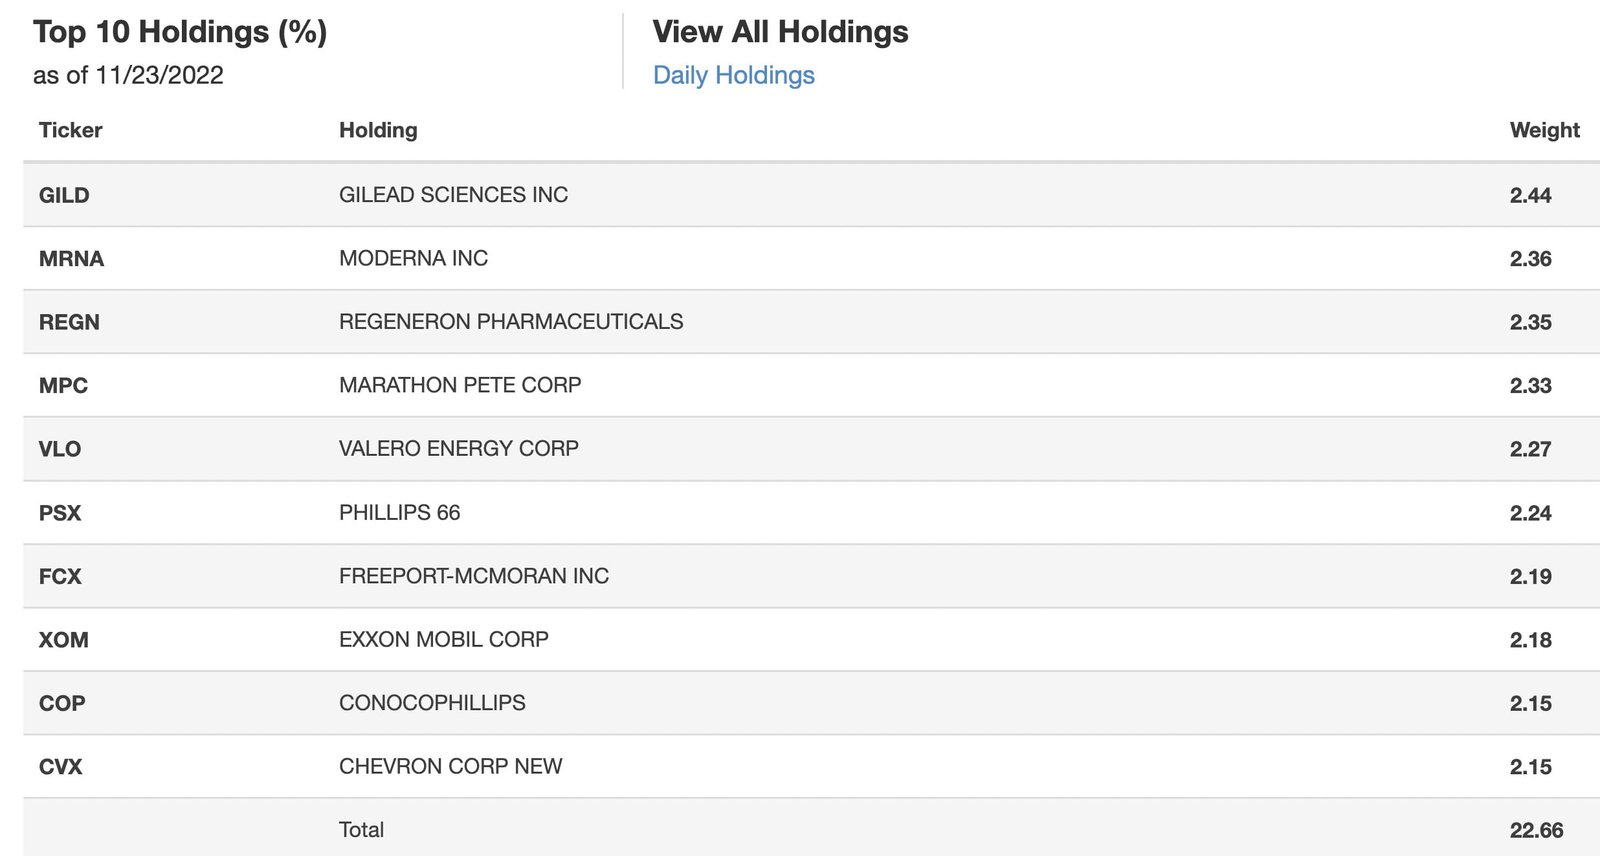
COWZ ETF Top 10 Holdings
| Ticker | Holding | Weight |
|---|---|---|
| GILD | GILEAD SCIENCES INC | 2.44 |
| MRNA | MODERNA INC | 2.36 |
| REGN | REGENERON PHARMACEUTICALS | 2.35 |
| MPC | MARATHON PETE CORP | 2.33 |
| VLO | VALERO ENERGY CORP | 2.27 |
| PSX | PHILLIPS 66 | 2.24 |
| FCX | FREEPORT-MCMORAN INC | 2.19 |
| XOM | EXXON MOBIL CORP | 2.18 |
| COP | CONOCOPHILLIPS | 2.15 |
| CVX | CHEVRON CORP NEW | 2.15 |
| Total | 22.66 |
Gilead Sciences currently has the top position at 2.44% whereas Chevron Corp rounds things out the top 10 positions at 2.15%.
Altogether the top 10 holdings of Pacer US Cash Cows 100 ETF take up 22.66% of the fund.
Moreover, it’s noteworthy that most of the top companies belong to Healthcare and Energy sectors.
COWZ Info
Ticker: COWZ
Number of Stocks: 100
Net Expense Ratio: 0.49
Distributions: Quarterly
AUM: 10.2 Billion
Inception: 12/16/2016
Few funds have accumulated AUM quite like COWZ ETF has over the past couple of years.
With a Net Expense Ratio of 0.49 it is competitive with other concentrated mid-cap value funds such as QVAL and SYLD which are in the 0.49 to 0.59 range.
COWZ ETF has been kicking around since late 2016.
For investors seeking income, Pacer US Cash Cows 100 ETF will provide quarterly distributions.
COWZ ETF – Sector Exposure
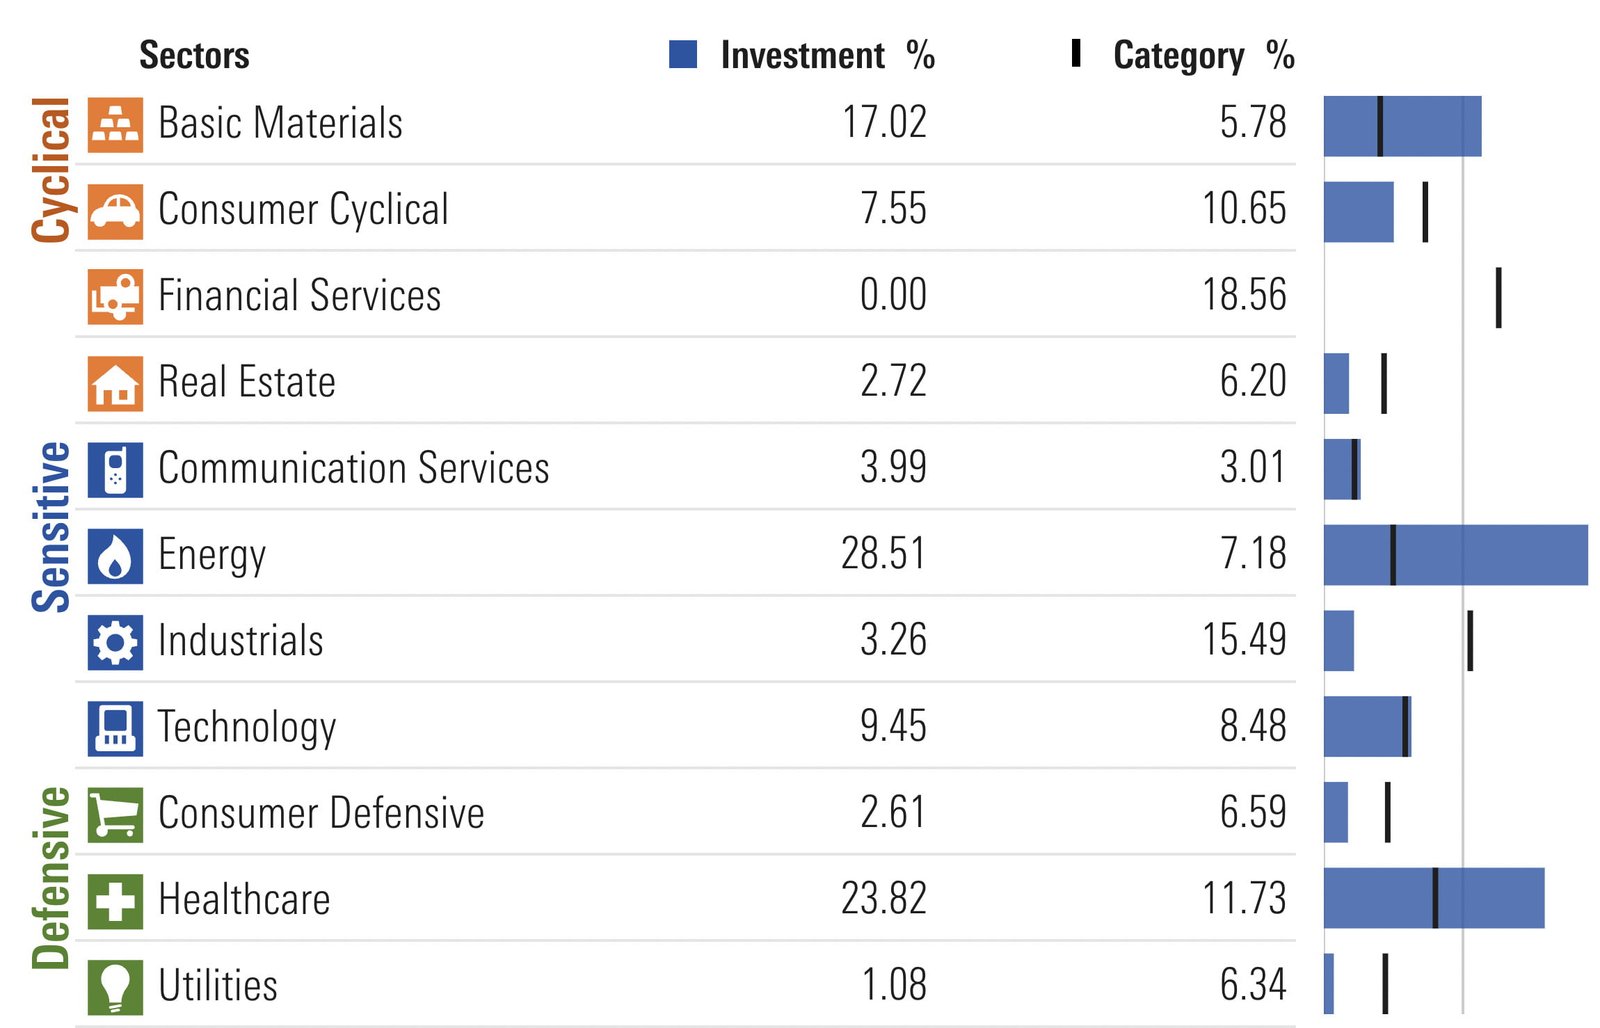
Things sure get interesting when we examine sector exposure for Pacer US Cash Cows 100 ETF.
Firstly, as mentioned earlier in the article, COWZ ETF completely avoids Financial Services altogether.
That’s right folks.
Nada.
Secondly, it is super-overweight Healthcare (23.82%) and Energy (28.51%) stocks versus category averages (US Mid Cap Value).
In fact, more than 50% of the fund is allocated to just those two sectors.
Basic Materials also makes up a hefty percentage of the fund coming in at 17.02%.
So what is it underweight?
Aside from Financials, COWZ ETF is underweight Industrials and Utilities in particular.
COWZ ETF – Style Measures
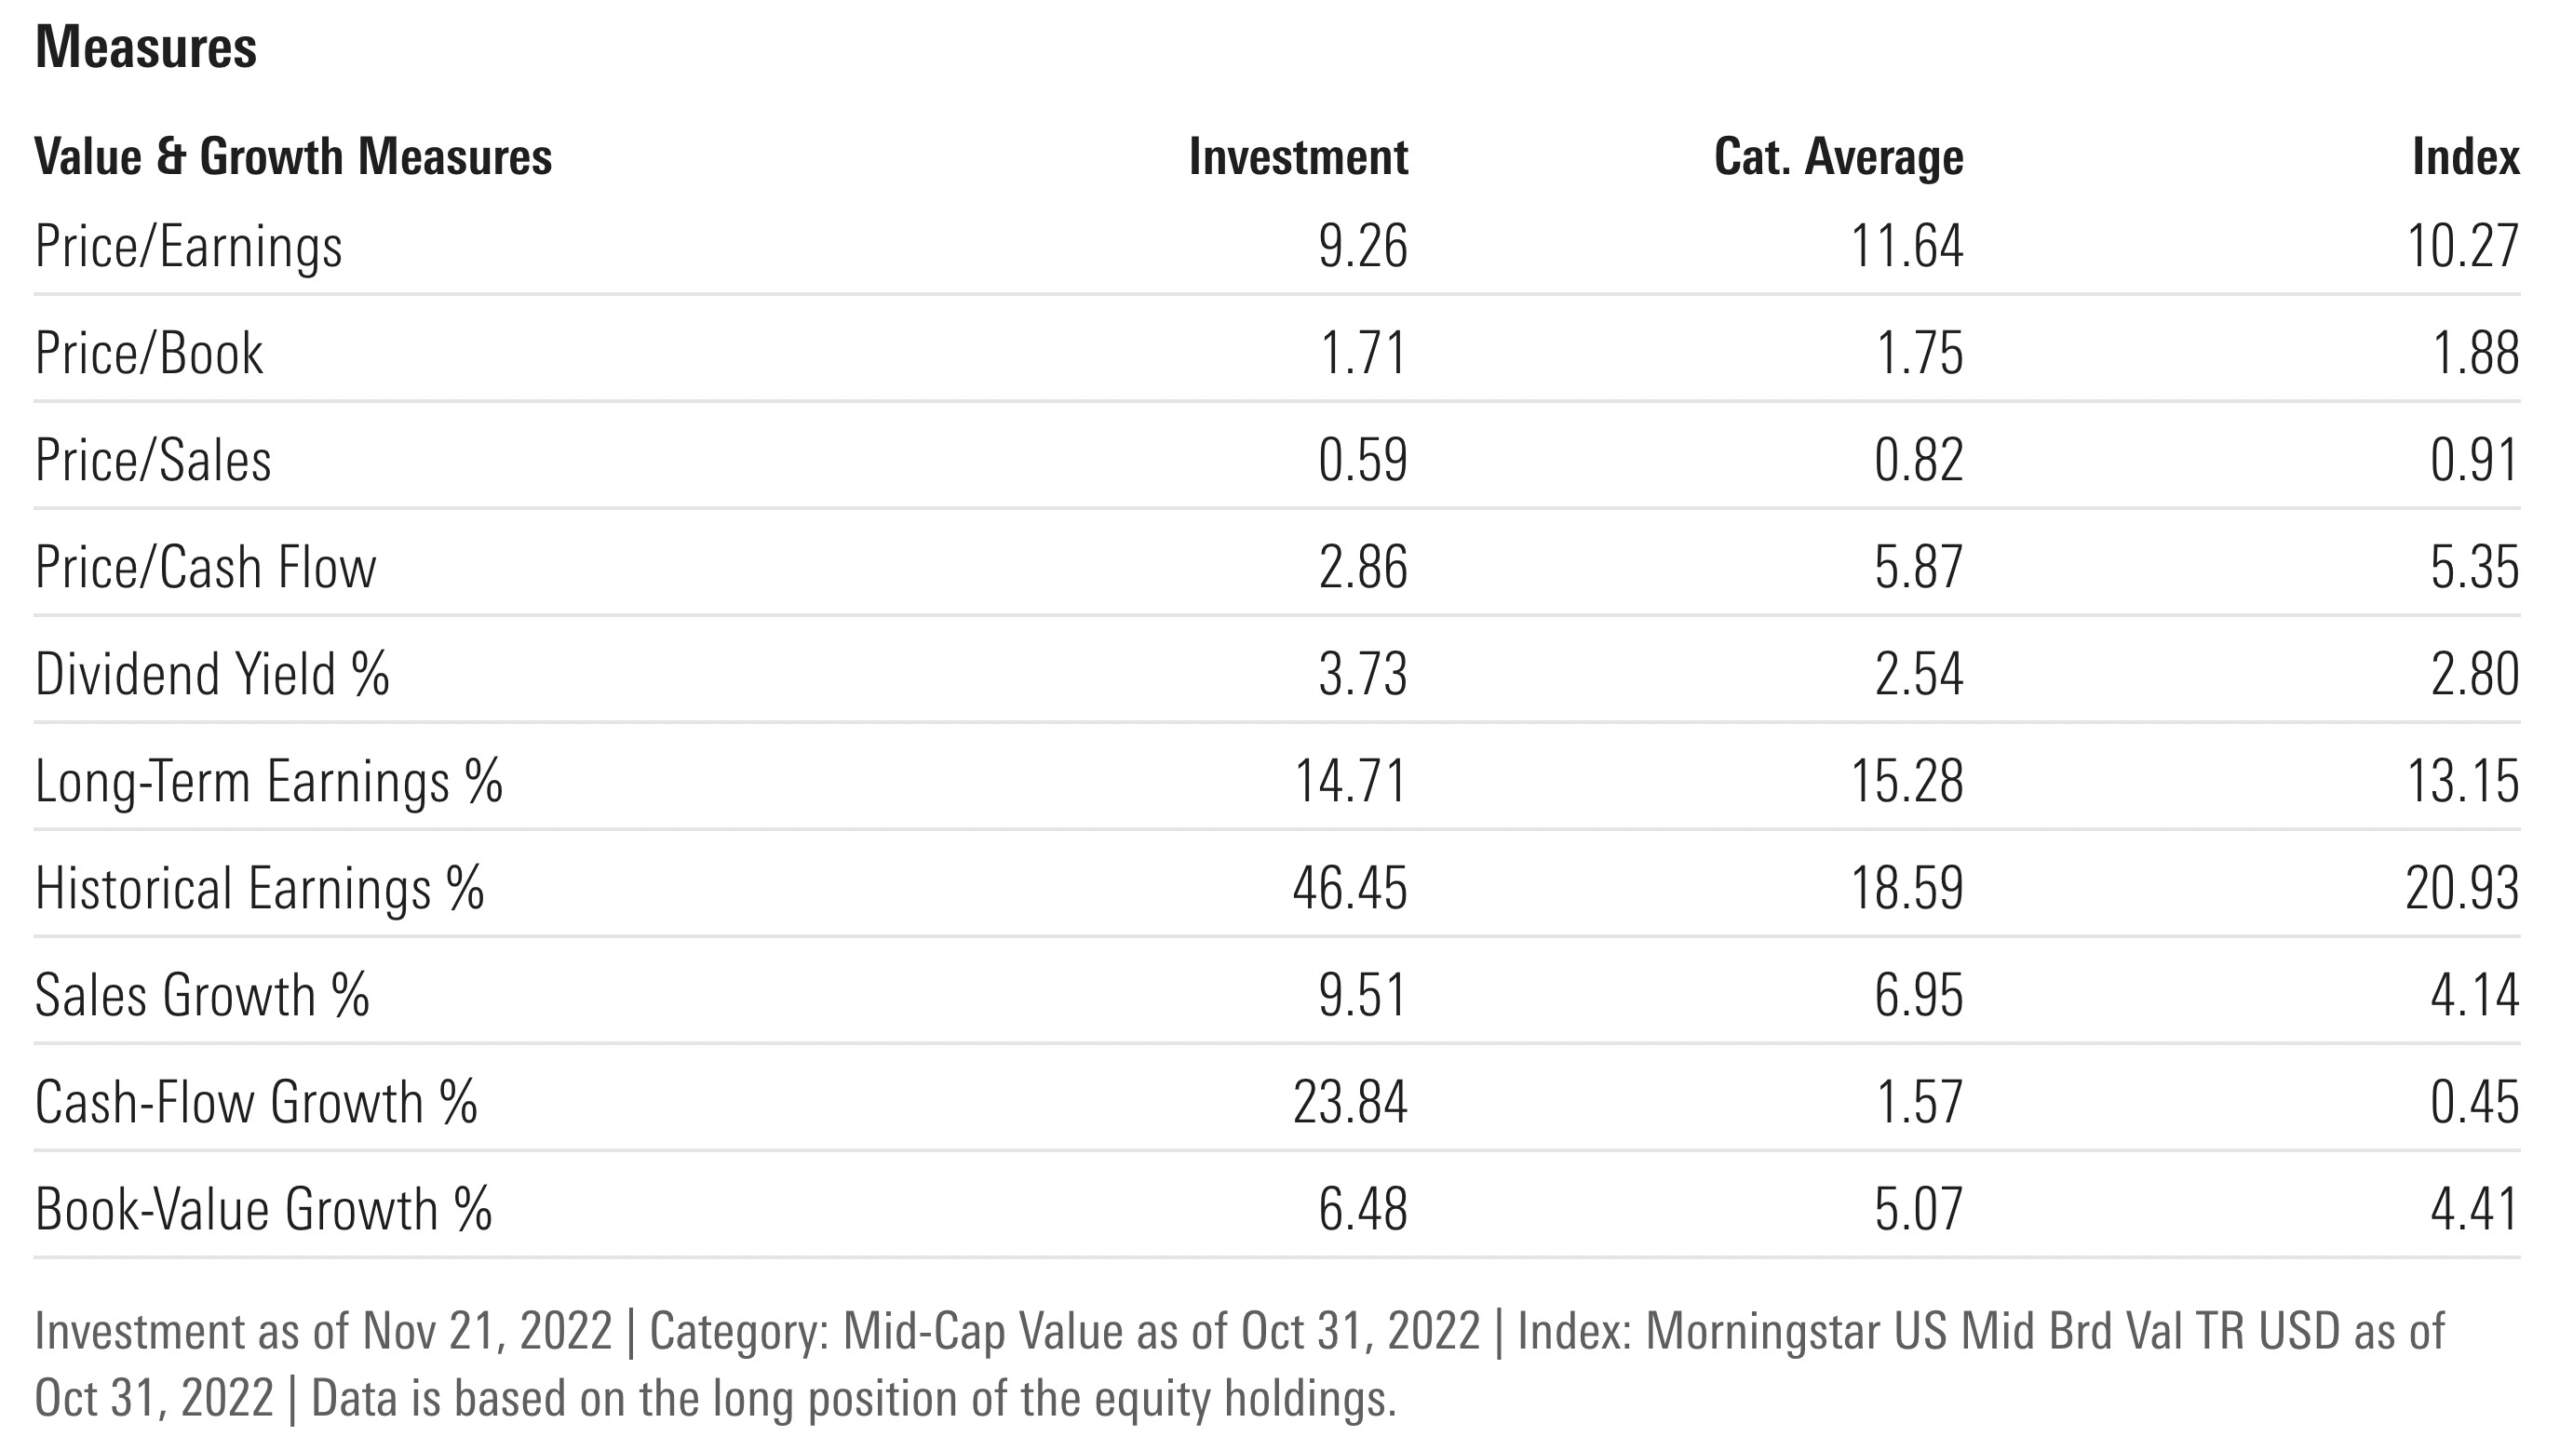
Compared to both category and index averages, Pacer US Cash Cows 100 ETF has a more attractive P/E, P/B, P/S and P/CF where lower is better.
Furthermore, it also features a stronger dividend yield.
Where it absolutely blows other funds out of the water is when we compare head to head historical earnings % and cash-flow growth %:
Historical Earnings %: 46.45 vs 18.59
Cash-Flow Growth %: 23.84 vs 1.57
Would we expect anything else from a “cash cow” product?
COWZ ETF – Stock Style
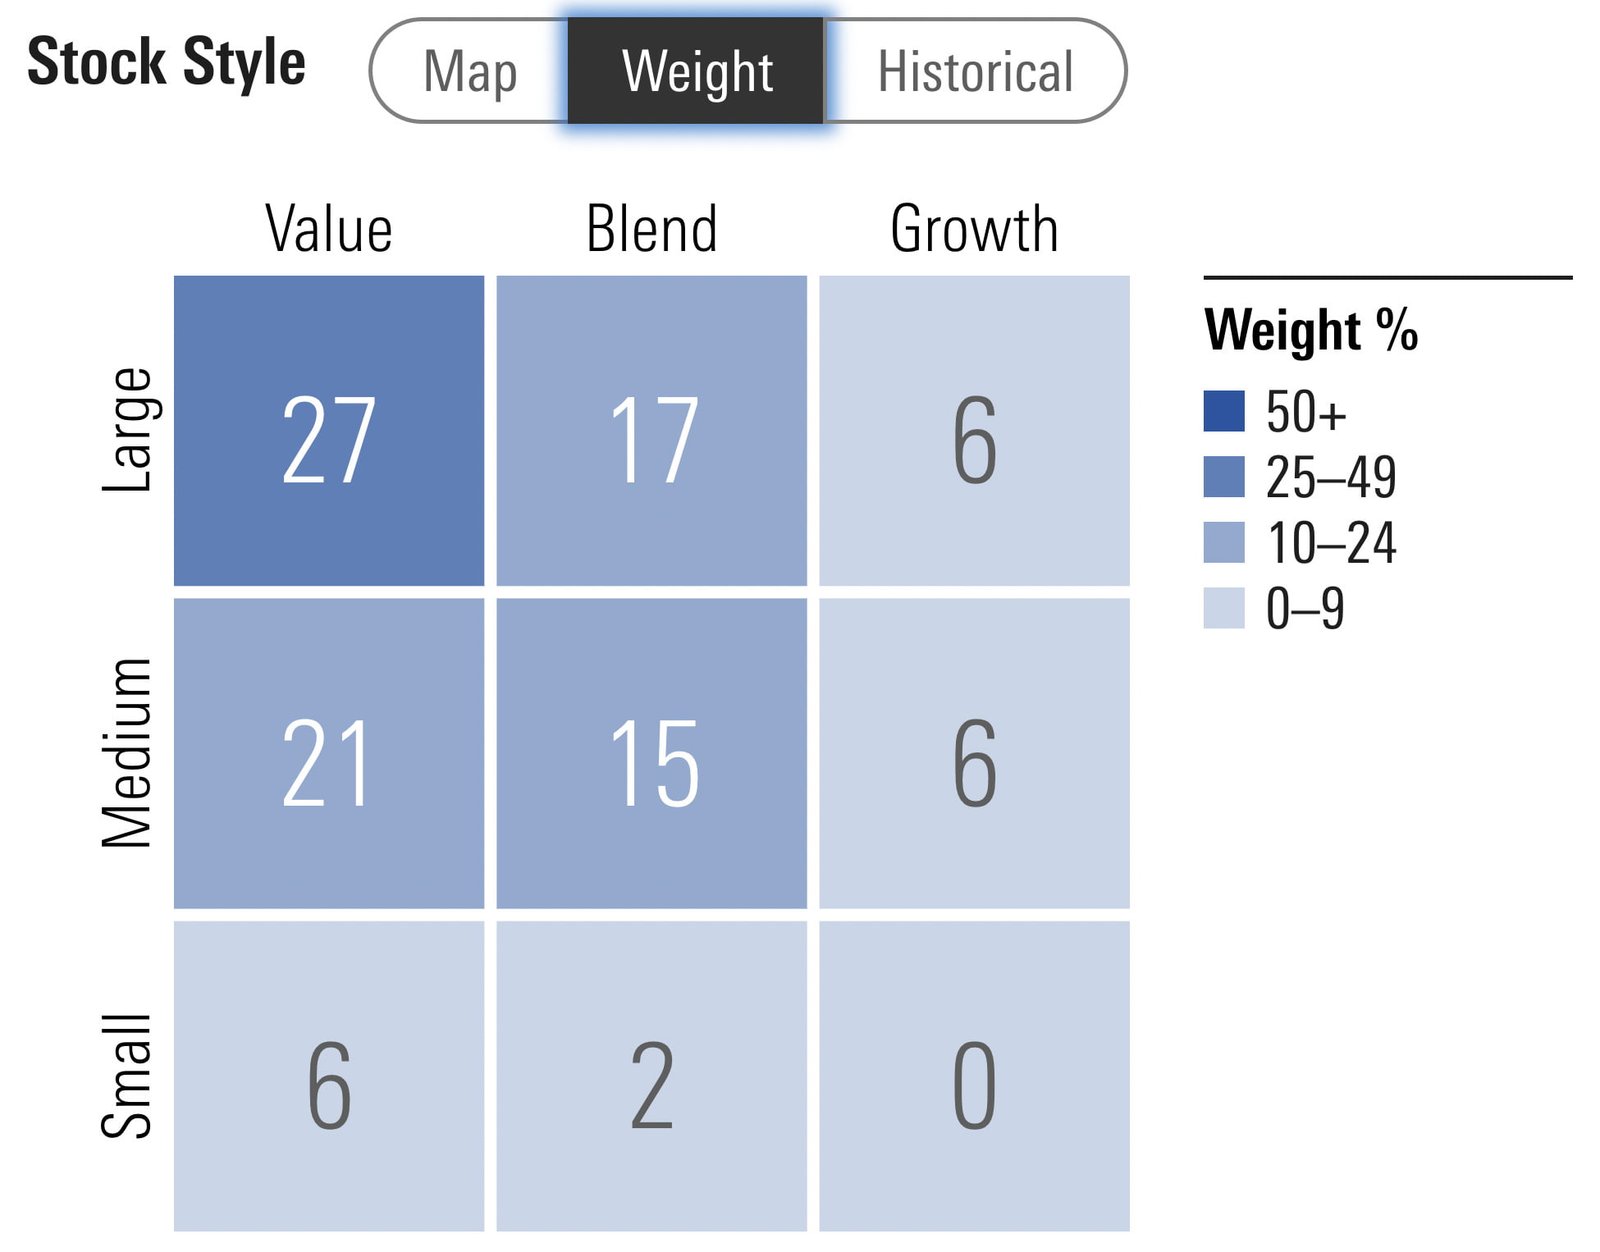
COWZ ETF is clearly hanging out in mostly large-cap and mid-cap value territory.
Overall, it is 54% value, 34% blend and 12% growth.
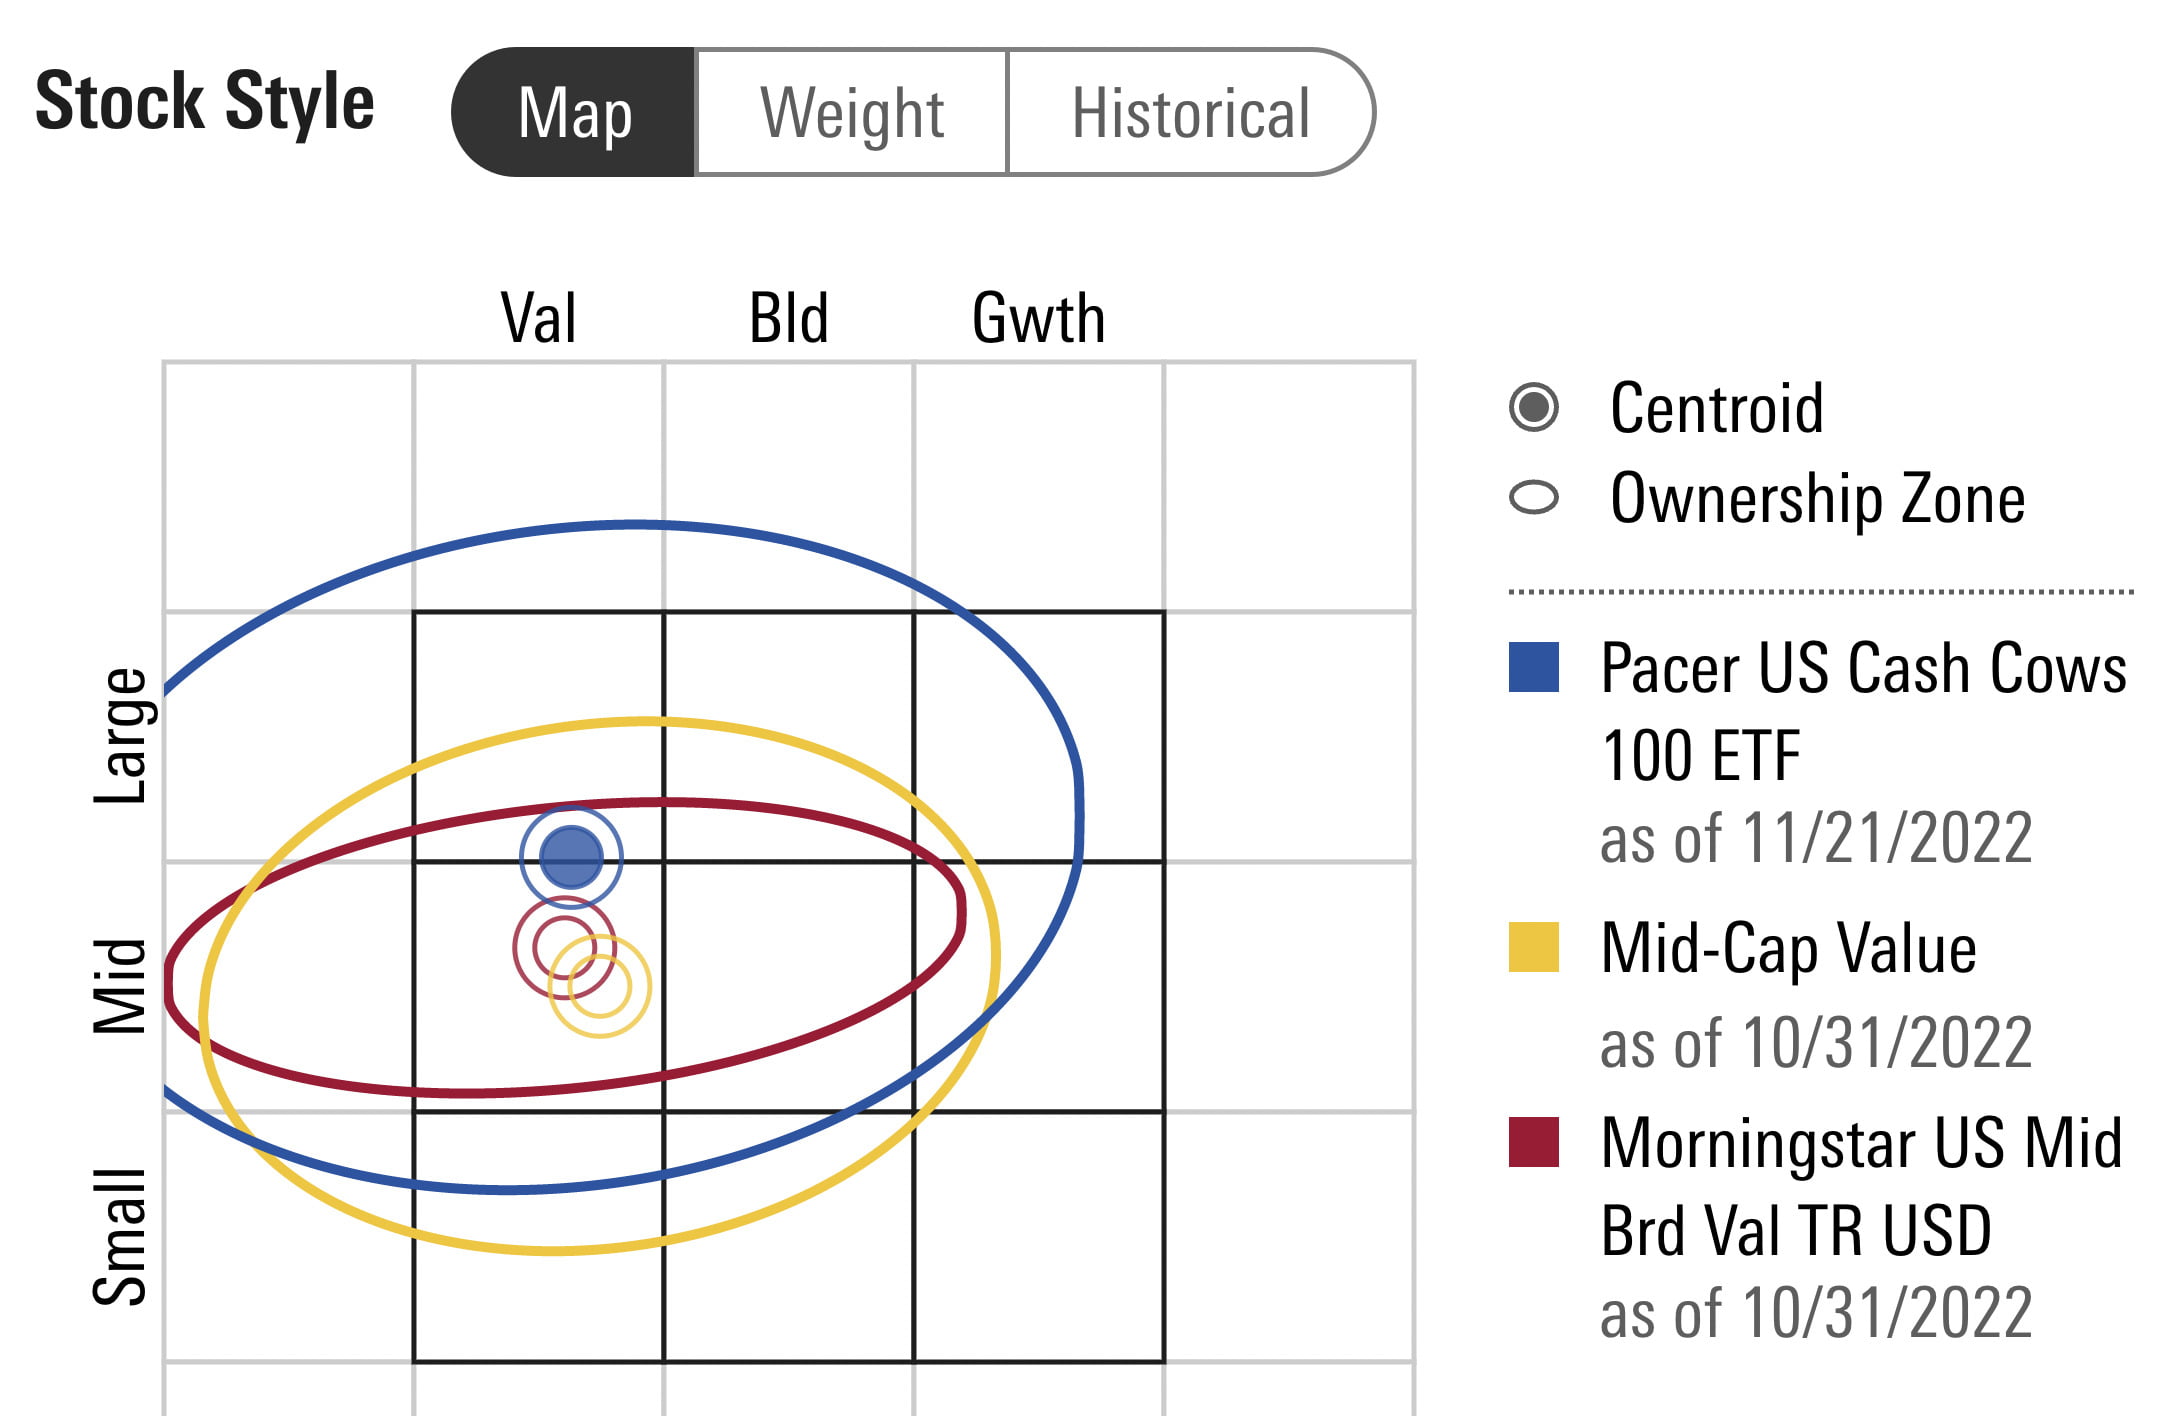
Talk about sitting on the fence!
COWZ ETF has just enough mid-cap exposure to dip its toes enough in the pond to be considered a mid-cap fund.
COWZ ETF – Factor Profile
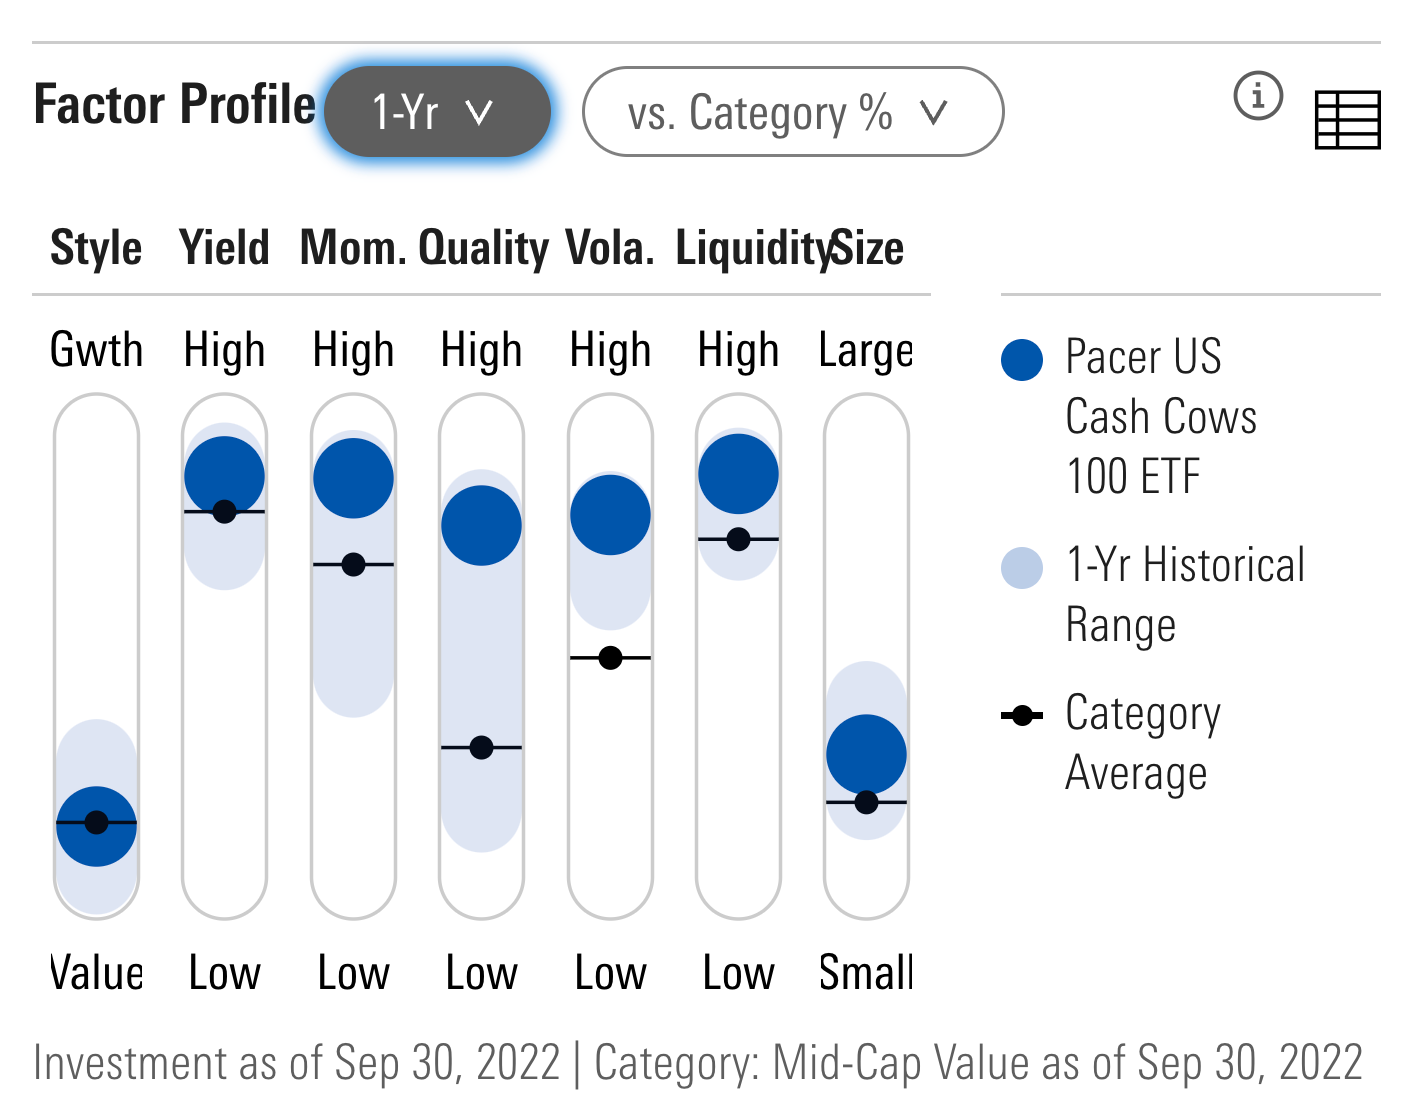
Pacer US Cash Cows 100 ETF is a multi-factor robust beast offering investors hard lever pulls towards value, yield, momentum, quality and size.
Hence, it’s the complete package.
Noteworthy is that the fund’s quality screens really set it apart from its competition which tends to be on the lower end of the quality scale.
COWZ ETF Alpha Architect Screening
Let’s consult the wonderful Alpha Architect Fund Screener for further analysis.
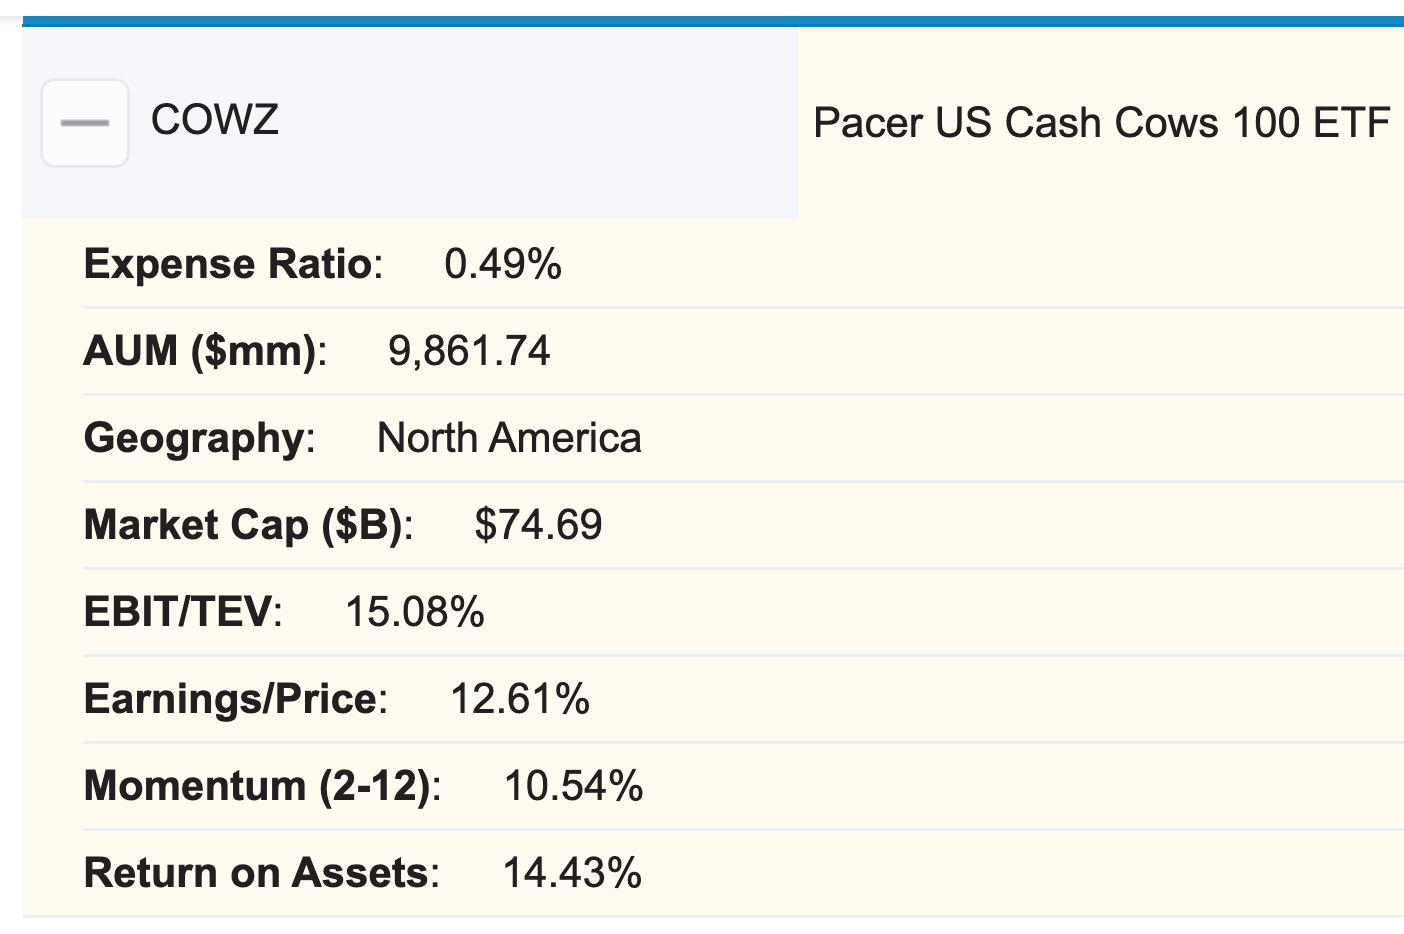
EBIT/TEV: 15.08%
Earnings/Price: 12.61%
Momentum (2-12): 10.54%
Returns on Assets: 14.43%
It’s across the board impressive results for COWZ ETF.
Pacer US Cash Cows 100 ETF Performance
Let’s move on to long-term and short-term performance.
COWZ ETF Long-Term Portfolio Returns vs S&P 500 and Russell 1000 Value
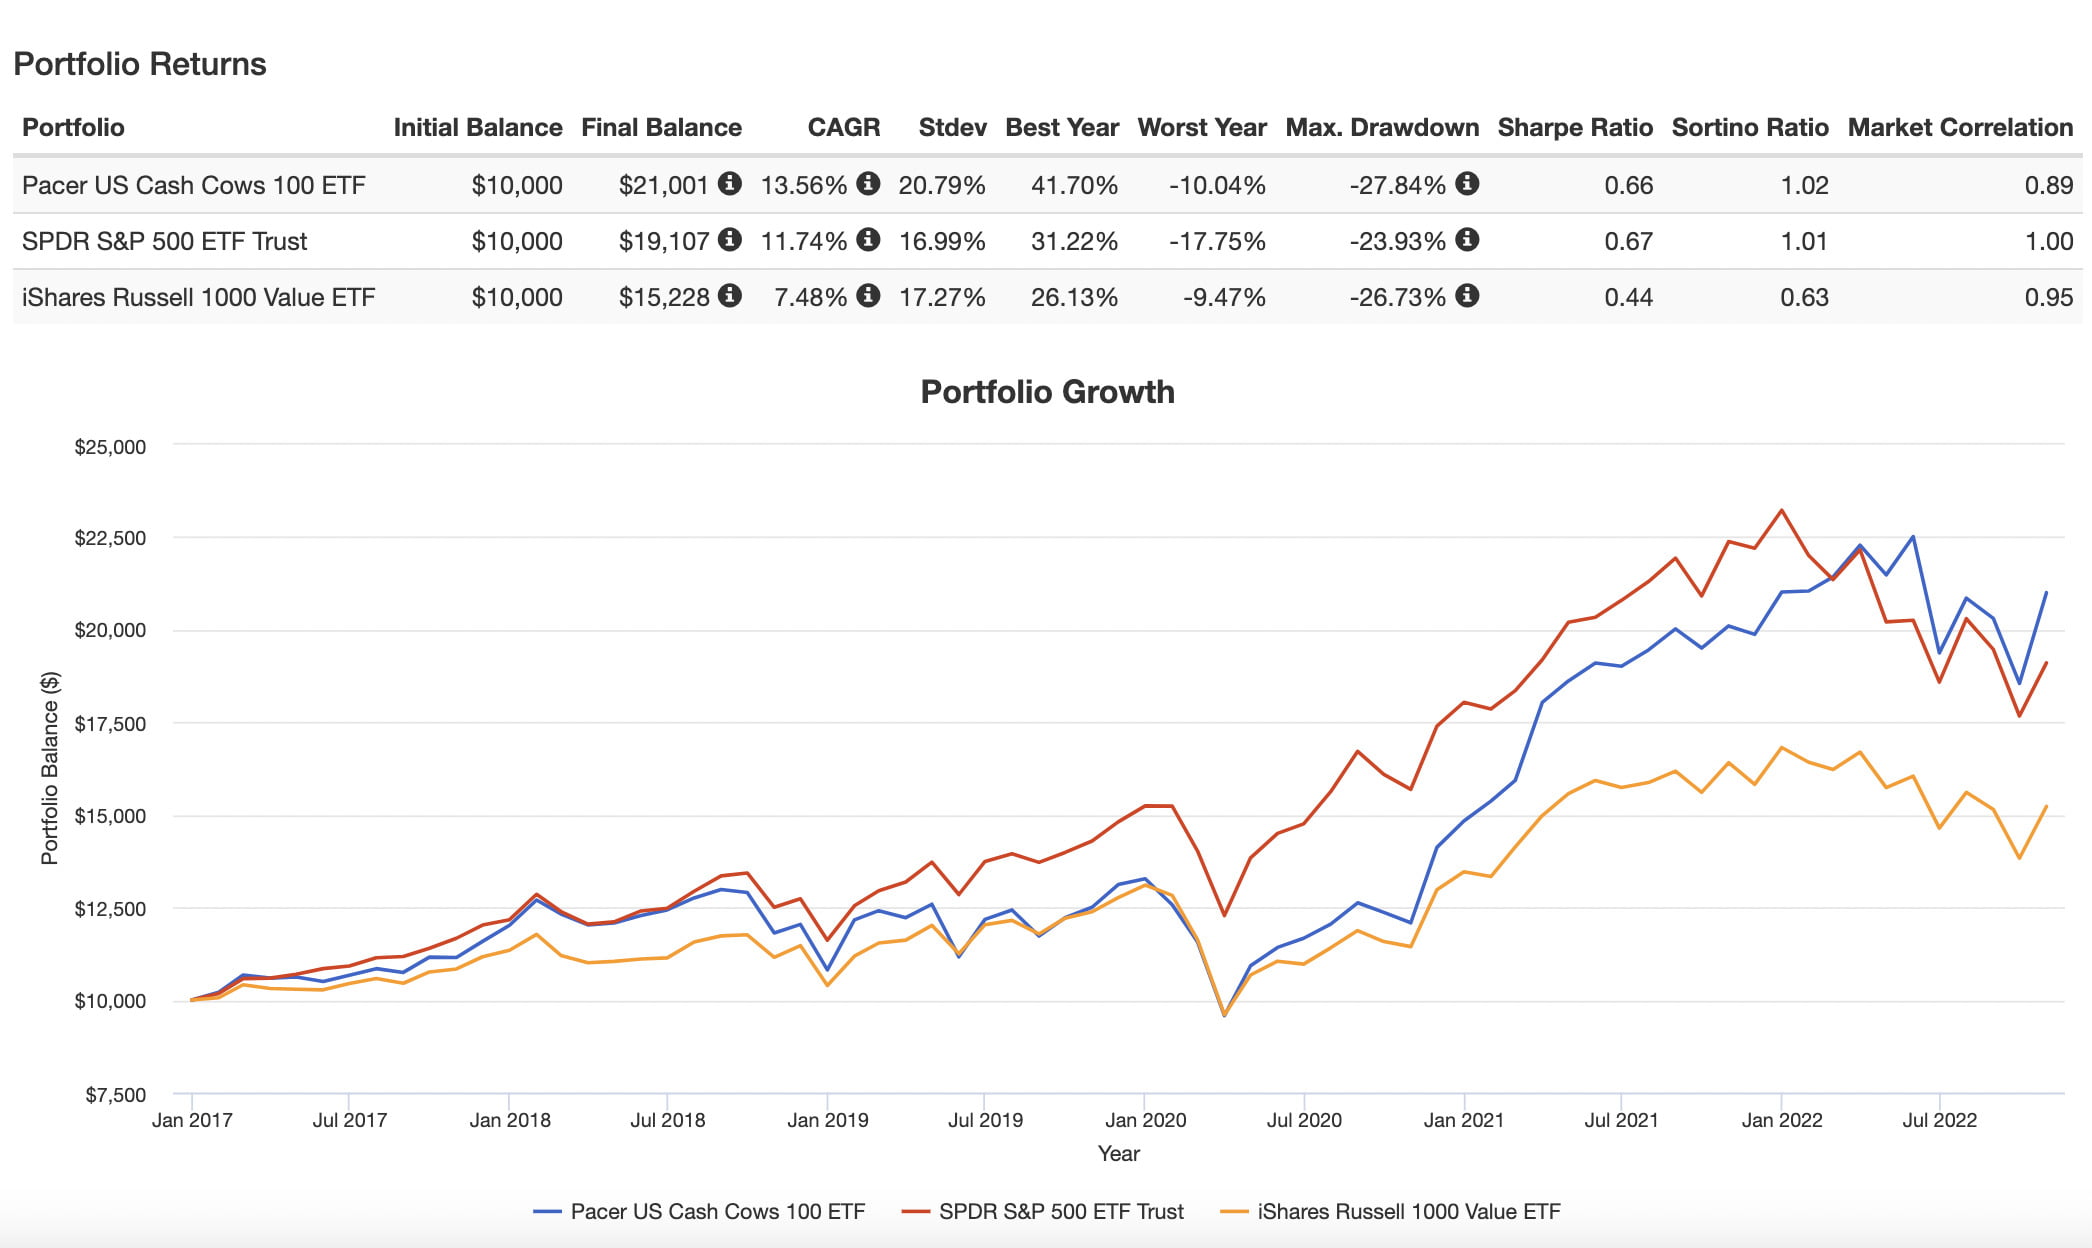
COWZ ETF long-term performance is most impressive when compared versus the S&P 500 and Russell 1000 Value.
Noteworthy is that the fund trailed the S&P 500 significantly only to gain recent ground and pass it in 2022.
However, when compared to the Russell 1000 Value index it has been a clear drubbing since inception.
CAGR: 13.56% vs 11.74% vs 7.48%
RISK: 20.79% vs 16.99 vs 17.27%
Market Correlation: 0.89 vs 1.00 vs 0.95
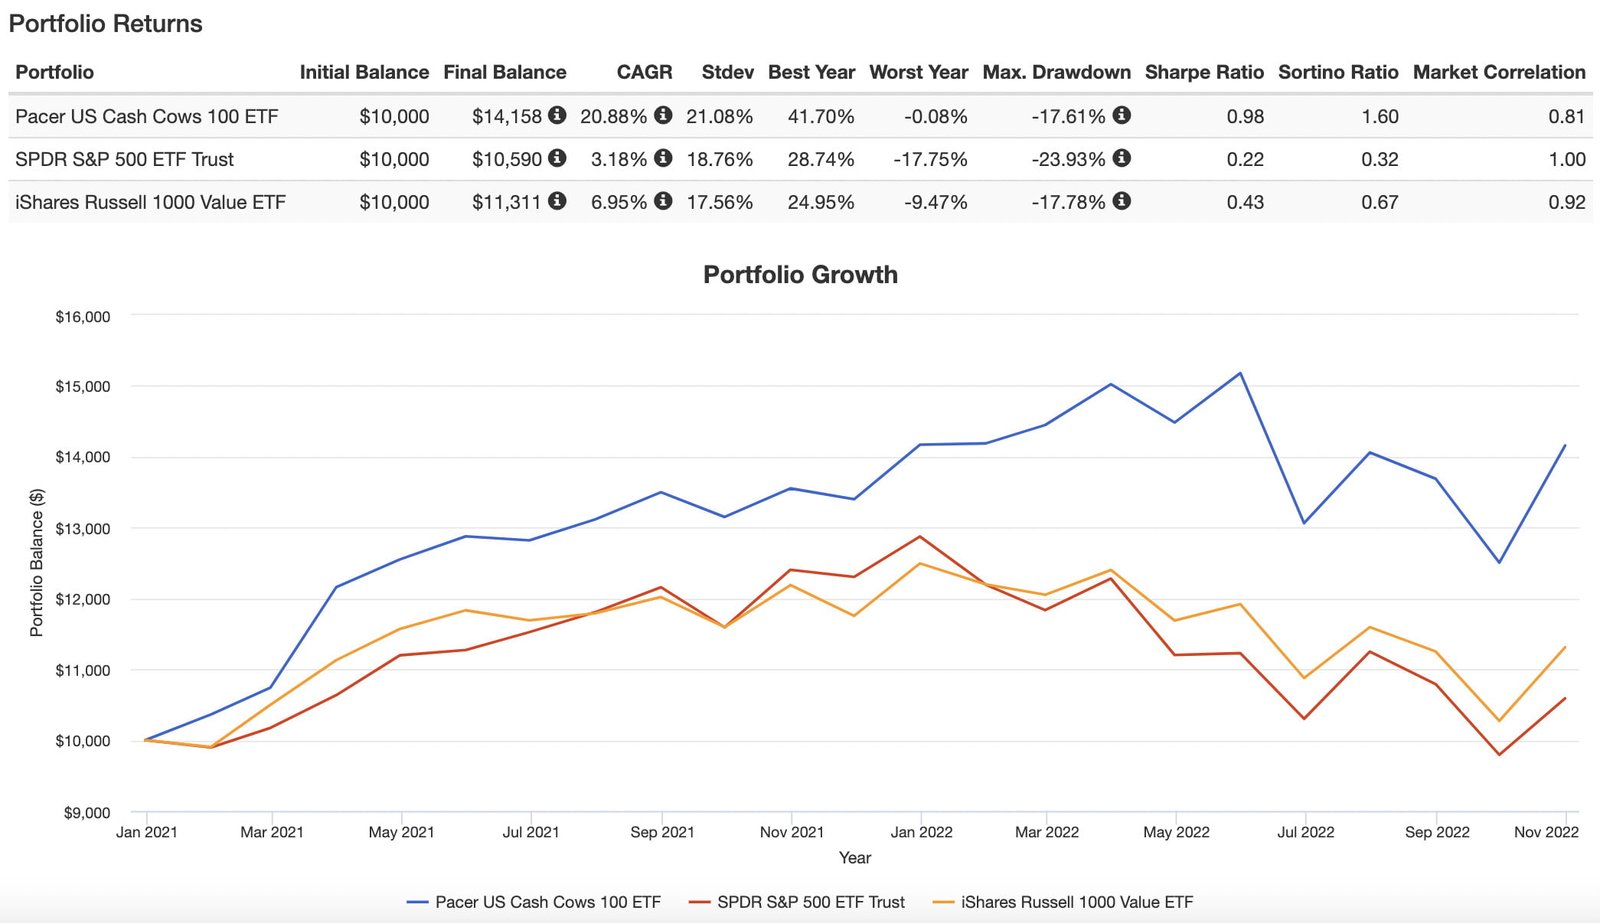
One of the primary reasons for such impressive inflows into Pacer US Cash Cows 100 ETF have been its dominant recent returns.
Moreover, since 2021 it has been crushing the S&P 500 Trust and Russell 1000 Value ETF.
With a CAGR of 20.88% it has provided investors with sensational returns in what has been a challenging market.
COWZ ETF Pros and Cons
Let’s examine the pros and cons of Pacer US Cash Cows 100 ETF.
COWZ Pros
- Strategy of screening for Quality and Value companies: Free Cash Flow Yield: “FCF / EV“
- High conviction 100 positions offering US large-cap and mid-cap exposure
- Robust beast multi-factor exposure to value, momentum, size, quality and yield
- Across the board impressive EBIT/TEV, Earnings/Price, Momentum (2-12) and Returns on Assets
- Outperforming the S&P 500 and Russell 1000 Value both in terms of long-term and short-term results
- Unique sector exposure that deviates from the typical mid-cap value script
- Reasonable management fee that is on par for industry standard mid-cap value funds
- Chance to support an innovative fund provider offering cash cow, trend-pilot and factor series to name just a few
COWZ Cons
- More concentrated positions (100) and category over/under weight composition (ex: excluding financials) will result in track-error where the fund will likely underperform major indexes from time to time (investors need to be prepared for that)
- Hanging out in large and mid cap territory may not persuade small-cap value investors to take a serious look at this fund
COWZ Potential Portfolio Ideas
These asset allocation ideas and model portfolios presented herein are purely for entertainment purposes only. This is NOT investment advice. These models are hypothetical and are intended to provide general information about potential ways to organize a portfolio based on theoretical scenarios and assumptions. They do not take into account the investment objectives, financial situation/goals, risk tolerance and/or specific needs of any particular individual.
Now that we’ve taken a thorough look at COWZ ETF let’s see how it can potentially fit into a portfolio at large.
COWZ ETF 100% ALL Equity Portfolio
Is it possible to just exclusively allocate to COWZ ETF while Moo-ing your way to impressive CAGR over time?
If you don’t mind home-country bias, potential tracking error and hanging out exclusively in large-cap and mid-cap territory it could potentially make sense.
100% COWZ ETF
COWZ ETF Diversified Quant Portfolio
For those seeking a globally and strategically diversified approach the following might make sense for certain investors:
40% HERD
20% TRND
30% KMLM
10% TYA
This is an easy to assemble four fund portfolio that takes two of Pacer’s flagship strategies (cash cows + trend pilot) in a fund of funds approach and pairs them with a managed futures and efficient treasury strategy.
Overall, it would be an expanded canvas portfolio along the lines of:
55-60% Equity (static + trend)
30% Managed Futures
30-35% Treasury (static + trend)
What Others Have To Say About COWZ ETF
Now that we’ve covered a few different portfolio solutions let’s see what others have to say about the fund for those who prefer video format.
source: Corey On Investing YouTube
source: ETFguide YouTube
source: Bloomberg Markets and Finance YouTube

Nomadic Samuel Final Thoughts
It should be clear at this point that COWZ ETF is anything but a gimmicky product.
It offers investors a high conviction strategy of screening for quality and value stocks.
Given its dominant recent outperformance AUM inflows have ballooned the fund to 10+ billion.
Indeed, that’s mighty impressive for a fund that is not from one of the Goliath providers.
I feel the branding has also strongly contributed to the success of this fund.
Cash cows is brilliant branding versus typical geek speak fund names.
It’s something that stands out from the crowd.
I wish more funds would roll the dice and take a chance on being more creative and less literal.
That’s likely wishful thinking.
Now over to you.
What do you think of Pacer US Cash Cows 100 ETF from a performance, branding and strategic standpoint?
Is COWZ ETF on your radar?
Please let me know in the comments below.
That’s all I’ve got for today.
Ciao for now.
Important Information
Comprehensive Investment Disclaimer:
All content provided on this website (including but not limited to portfolio ideas, fund analyses, investment strategies, commentary on market conditions, and discussions regarding leverage) is strictly for educational, informational, and illustrative purposes only. The information does not constitute financial, investment, tax, accounting, or legal advice. Opinions, strategies, and ideas presented herein represent personal perspectives, are based on independent research and publicly available information, and do not necessarily reflect the views or official positions of any third-party organizations, institutions, or affiliates.
Investing in financial markets inherently carries substantial risks, including but not limited to market volatility, economic uncertainties, geopolitical developments, and liquidity risks. You must be fully aware that there is always the potential for partial or total loss of your principal investment. Additionally, the use of leverage or leveraged financial products significantly increases risk exposure by amplifying both potential gains and potential losses, and thus is not appropriate or advisable for all investors. Using leverage may result in losing more than your initial invested capital, incurring margin calls, experiencing substantial interest costs, or suffering severe financial distress.
Past performance indicators, including historical data, backtesting results, and hypothetical scenarios, should never be viewed as guarantees or reliable predictions of future performance. Any examples provided are purely hypothetical and intended only for illustration purposes. Performance benchmarks, such as market indexes mentioned on this site, are theoretical and are not directly investable. While diligent efforts are made to provide accurate and current information, “Picture Perfect Portfolios” does not warrant, represent, or guarantee the accuracy, completeness, or timeliness of any information provided. Errors, inaccuracies, or outdated information may exist.
Users of this website are strongly encouraged to independently verify all information, conduct comprehensive research and due diligence, and engage with qualified financial, investment, tax, or legal professionals before making any investment or financial decisions. The responsibility for making informed investment decisions rests entirely with the individual. “Picture Perfect Portfolios” explicitly disclaims all liability for any direct, indirect, incidental, special, consequential, or other losses or damages incurred, financial or otherwise, arising out of reliance upon, or use of, any content or information presented on this website.
By accessing, reading, and utilizing the content on this website, you expressly acknowledge, understand, accept, and agree to abide by these terms and conditions. Please consult the full and detailed disclaimer available elsewhere on this website for further clarification and additional important disclosures. Read the complete disclaimer here.


