In the 2000s Emerging Markets were all of the rage as investors flocked to gain outsized exposure as it grossly outperformed large-cap centric US and International Developed equities.
And then came the 2010s.
Ouch.
Relative pain for globally diversified investors.
Now Emerging Markets have fallen so out favour to the point where certain pundits are excluding them entirely from model portfolios.
What a shame.
Emerging Markets make up 45% of global GDP and 60% of the world’s population.

And for those who are experienced long-term investors or have been studying market cycles (from a zoomed out perspective) it is often when something falls out of favour that it is the best opportunity to gain exposure.
These days I’ve been researching value, momentum and multi-factor ETFs and I haven’t found one with a more impressive profile than First Trust Emerging Markets Small Cap AlphaDEX Fund.
Ticker FEMS.
In this ETF review of FEMS we’ll cover what makes First Trust Emerging Markets Small Cap AlphaDEX such an intriguing fund from a number of different angles.
It’s one of my personal favourites that I feel is underrated.
I quite honestly don’t hear that much about the fund on social media and I’m hoping to change that with this review.

First Trust Emerging Markets Small Cap AlphaDEX Fund Review

FEMS ETF Review

Hey guys! Here is the part where I mention I’m a travel vlogger! This ETF or Mutual Fund review is entirely for entertainment purposes only. There could be considerable errors in the data I gathered. This is not financial advice. Do your own due diligence and research. Consult with a financial advisor.

First Trust Emerging Markets Small Cap AlphaDEX Fund: Principal Investment Strategy
To better understand the process of how the fund operates, let’s turn our attention towards the prospectus where I’ve summarized the key points at the very bottom (source: summary prospectus).
Principal Investment Strategies of the Fund
The Fund will normally invest at least 90% of its net assets (including investment borrowings) in the common stocks, depositary receipts,
real estate investment trusts (“REITs”) and preferred shares that comprise the Index.
The Fund, using an indexing investment approach, attempts to replicate, before fees and expenses, the performance of the Index. The Index is owned and is developed, maintained and sponsored by Nasdaq, Inc. (the “Index Provider“).
The Index Provider may, from time to time, exercise reasonable discretion as it deems appropriate in order to ensure Index integrity.
The Index is composed of securities issued by small cap companies operating in emerging market countries, as classified by the Index Provider.
The Index Provider classifies a country as “emerging” based on a number of criteria, including national income per capita, national market capitalization and national trading volume.
Companies are classified as operating in a country primarily by their country of incorporation, domicile and primary exchange listing.
The Index may be composed of securities denominated in non-U.S. currencies.
The Index is designed to select stocks from the Nasdaq Emerging Markets Index (the “Base Index”) that may generate positive alpha,
or risk-adjusted returns, relative to traditional indices through the use of the AlphaDEX selection methodology.
Alpha is an indication of how much an investment outperforms or underperforms on a risk-adjusted basis relative to its benchmark.
The Base Index is a comprehensive, rules-based index designed to measure stock market performance of companies in emerging market countries, as determined by the Index Provider.
Security selection for the Index will be conducted in the following manner:
1. The selection universe for the Index begins with all stocks in the Base Index.
2. TheIndex Provider then removes any stocks which do not trade on an eligible exchange; duplicate (multiple share classes) stocks; stocks which do not meet the Index Provider’s liquidity screens; and stocks with a market capitalization greater than the mid cap breakpoint (50th percentile) and less than the small cap breakpoint (90th percentile) as calculated by Nasdaq. As of March 31, 2022, the mid cap breakpoint was $3.998 billion and the small cap breakpoint was $531 million. The Index Provider may include stocks above the mid cap breakpoint in order to reach a predetermined minimum number of eligible stocks.
3. The remaining stocks in the universe are then ranked on both growth and value factors. Each stock receives the best style rank from this step as its selection score.
4. The top 200 stocks based on the selection score determined in step 3 comprise the “selected stocks.” The selected stocks are then split into quintiles based on their selection score, with higher scoring quintiles receiving a greater weight in the Index.
5. The Index is subject to sector/country weighting constraints which are set at 15% above the sector/country percentages of the Base Index. A stock will be moved to a lower-weighted quintile when its weight, added to the weight assigned to all higher ranking stocks in its sector/country, is greater than the sector/country weighting constraint. Stocks that fail the sector/country weighting constraints at the lowest quintile will be removed from the Index.
The Index is rebalanced and reconstituted semi-annually and the Fund will make corresponding changes to its portfolio shortly after the Index changes are made public.
The Index’s semi-annual rebalance and reconstitution schedule may cause the Fund to experience a higher rate of portfolio turnover.
The Fund will be concentrated in an industry or a group of industries to the extent that the Index is so concentrated.
As of March 31, 2022, the Index was composed of 197 securities and the Fund had significant investments in materials companies and Asian issuers, although this may change from time to time.
In order to gain exposure to certain Chinese companies that are included in the Index but are unavailable to direct investment by foreign investors, the Fund invests significantly in non-Chinese shell companies that have created structures known as variable interest entities (“VIEs”) in order to gain exposure to such Chinese companies.
To the extent the Fund invests a significant portion of its assets in a given jurisdiction or investment sector, the Fund may be exposed to the risks associated with that jurisdiction or investment sector.”
Top 10 Country Holdings FEMS ETF
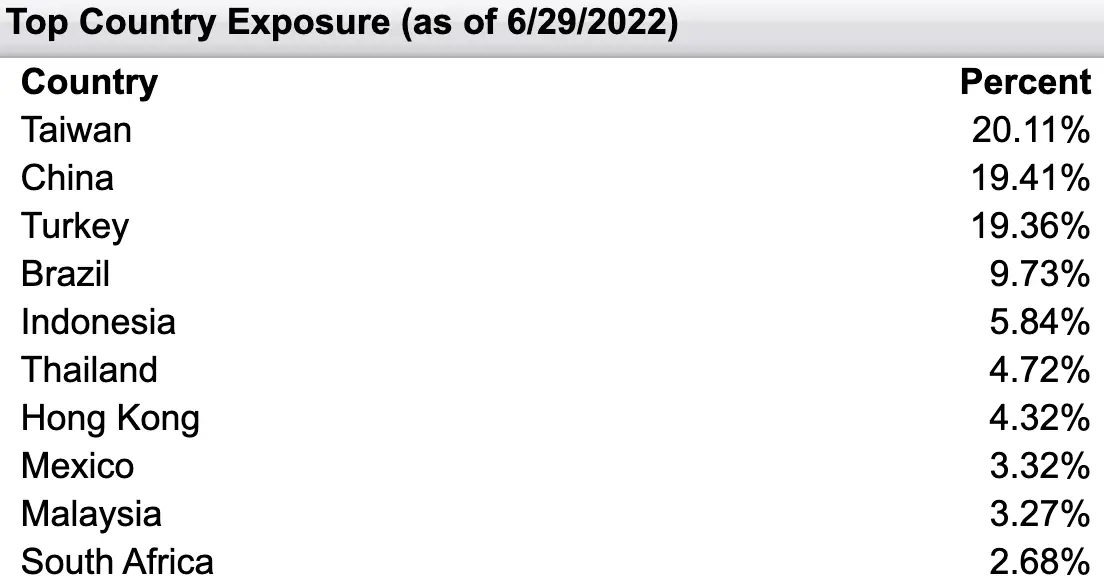
- Taiwan at 20.11%
- China at 19.41%
- Turkey at 19.36%
- Brazil at 9.73%
- Indonesia at 5.84%
- Thailand at 4.72%
- Hong Kong at 4.32%
- Mexico at 3.32%
- Malaysia at 3.27%
- South Africa at 2.68%
In terms of country exposure a few things pop out instantly from FEMS ETF.
Firstly, India, Saudi Arabia and Russia are not in the top 10 countries.
Secondly, Taiwan, Turkey and Brazil have a greater exposure than typical market-cap weighted indexes.
Overall, you get a nice mix of countries in the top 10 of this fund with exposure to certain markets you wouldn’t otherwise have in a standard fund.

Nasdaq AlphaDEX® Emerging Markets Small Cap Index
The construction of the AlphaDEX Emerging Markets Small Cap Index is fascinating.
It scans stocks from the Emerging market small-cap and mid-cap universe and ranks them according to growth and value factors.
The Growth factors include 3/6/12- month price appreciation, sales to price and one year sales growth.
The Value factors consist of book value to price, cash flow to price and return on assets.
200 positions make the final cut with weightings being spread out nicely as no holding takes up more than 1.41% weight.
FEMS Emerging Markets Small Cap Top Holdings
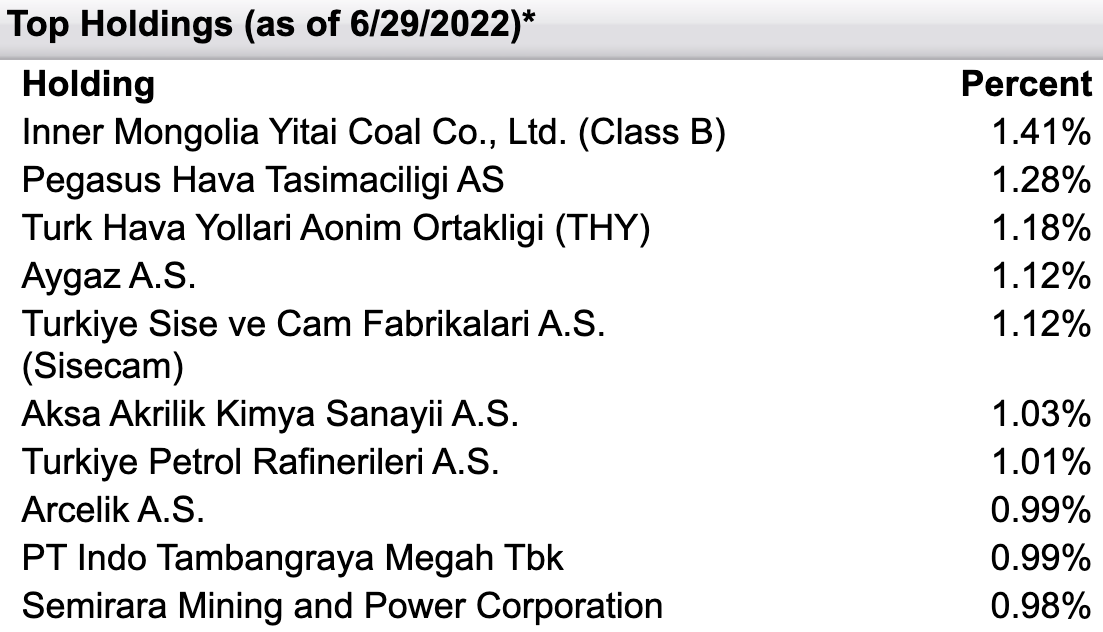
- Inner Mongolia Yitai Coal Co Ltd at 1.41%
- Pegasus Hava Tasimaciligi AS at 1.28%
- Turk Hava Yollari Aonim Ortakligi at 1.18%
- Aygaz A.S. at 1.12%
- Turkiye Sise ve Cam Fabrikalari A.S. at 1.12%
- Aksa Akrilik Kimya Sanayii A.S. at 1.01%
- Turkiye Petrol Rafinerileri A.S. at 1.01%
- Arcelik A.S. at 0.99%
- PT Indo Tambangraya Megah Tbk at 0.99%
- Semirara Mining and Power Corporation at 0.98%
What is immediately clear from the top holdings of FEMS ETF is that positions are quite evenly distributed.
No position takes up more than 1.41% and by the time you’re down to position 8 you’re noticing weightings of less than 1%.
Overall, I feel this is indeed a feather in the cap of this Emerging Markets fund as you’re not taking concentrated bets on any one particular stock.
FEMS ETF Exposure
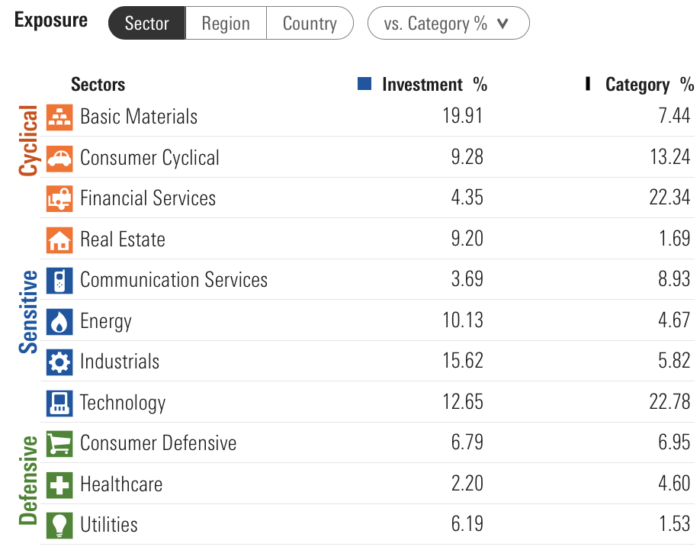
In terms of FEMS sector exposure you’ll notice no sector receives greater than 20% and every single category is covered.
Basic Materials, Real Estate, Energy and Industrials receive outsized exposure relative to its category benchmark whereas Financial Services, Consumer Cyclical, Communication Services and Technology are relatively underexposed.
This means FEMS is offering unique exposure to certain sectors that you won’t typically find in other vanilla funds.

FEMS ETF Factor Exposure
Alright then, it’s time to pop open the hood of FEMS to check out its factor profile.
This is quite frankly the part I’ve been most excited to explore.
FEMS Stock Style
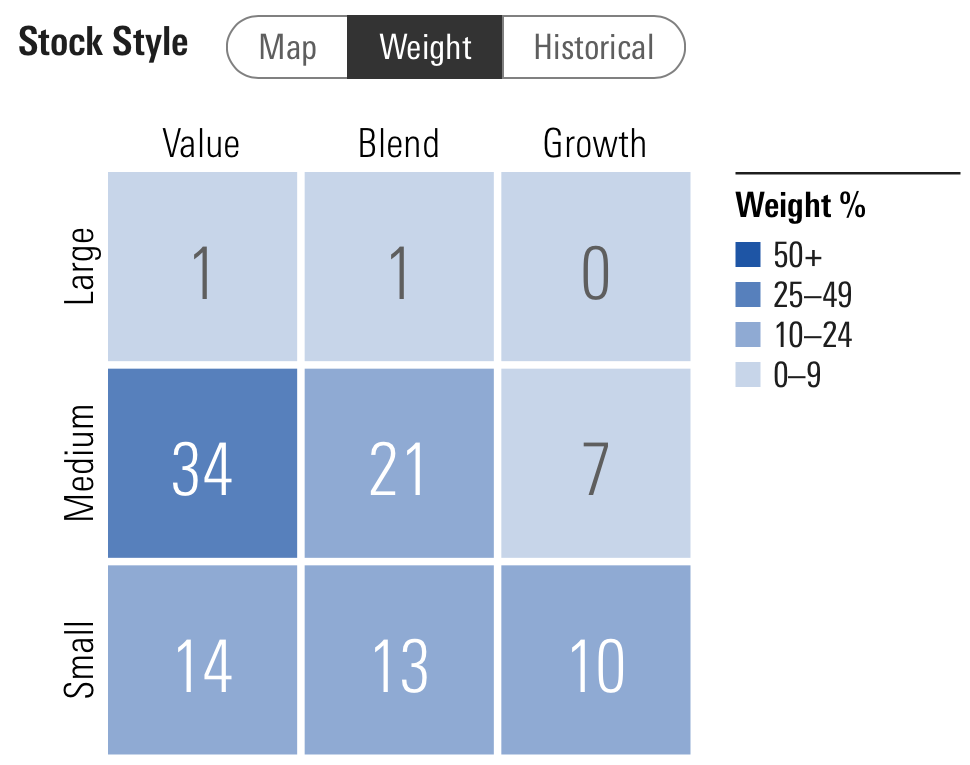
When we head over to Morningstar to check out FEMS stock style weight it’s apparent that mid-cap and small-cap exposure is the clear mandate.
Skewing heavily towards value, 34% of the fund lands in the mid-cap value box while 14% is in the small-cap value sandbox.
With only 17% growth the remaining part of the fund is the blend middle.
FEMS ETF Map Bullseye
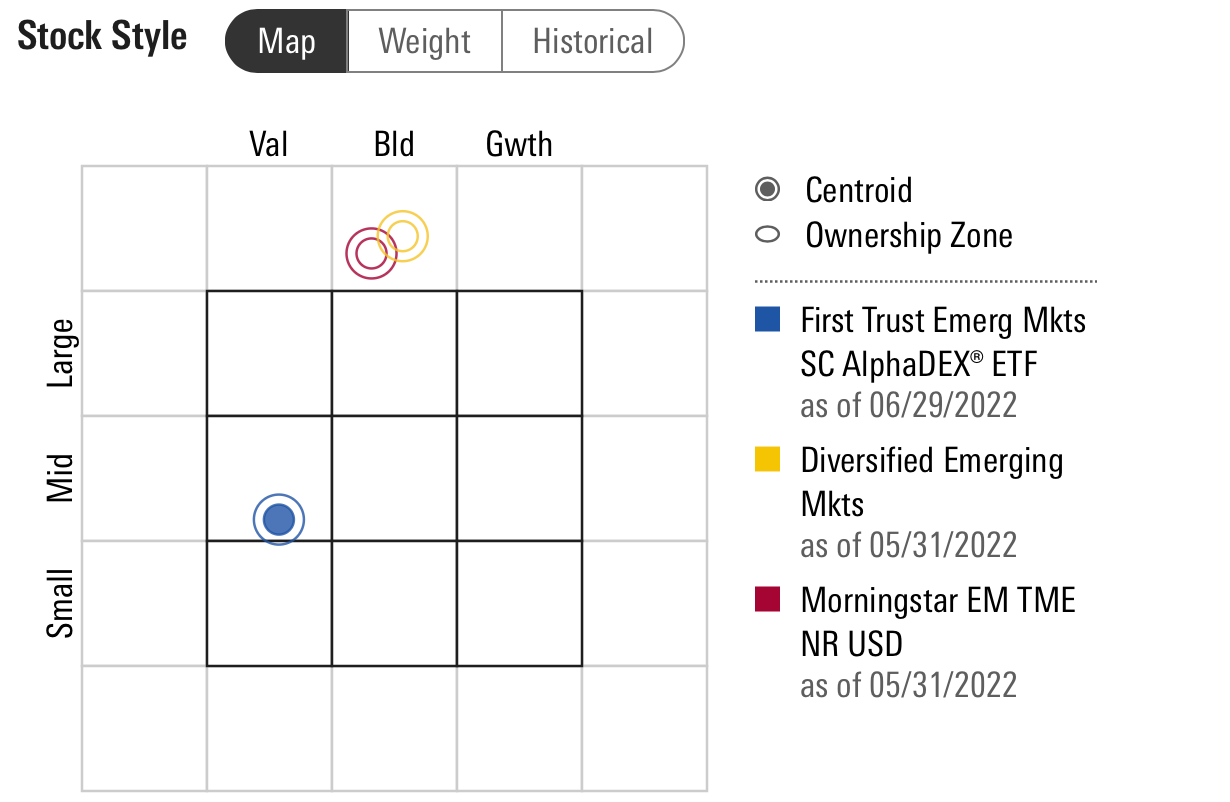
Overall, the fund has a sweet lower mid-cap value bullseye.
Given that mid-cap value has historically offered small-cap returns with large-cap stability this is a fishing spot I’m thrilled about.
Moreover, there is a real lack of mid-cap and small-cap Emerging Markets funds relative to what is available for US and EAFE funds.
Thus, First Trust Emerging Markets Small-Cap AlphaDEX fund is a most welcome addition to an uncrowded marketplace.
FEMS ETF Style Measures
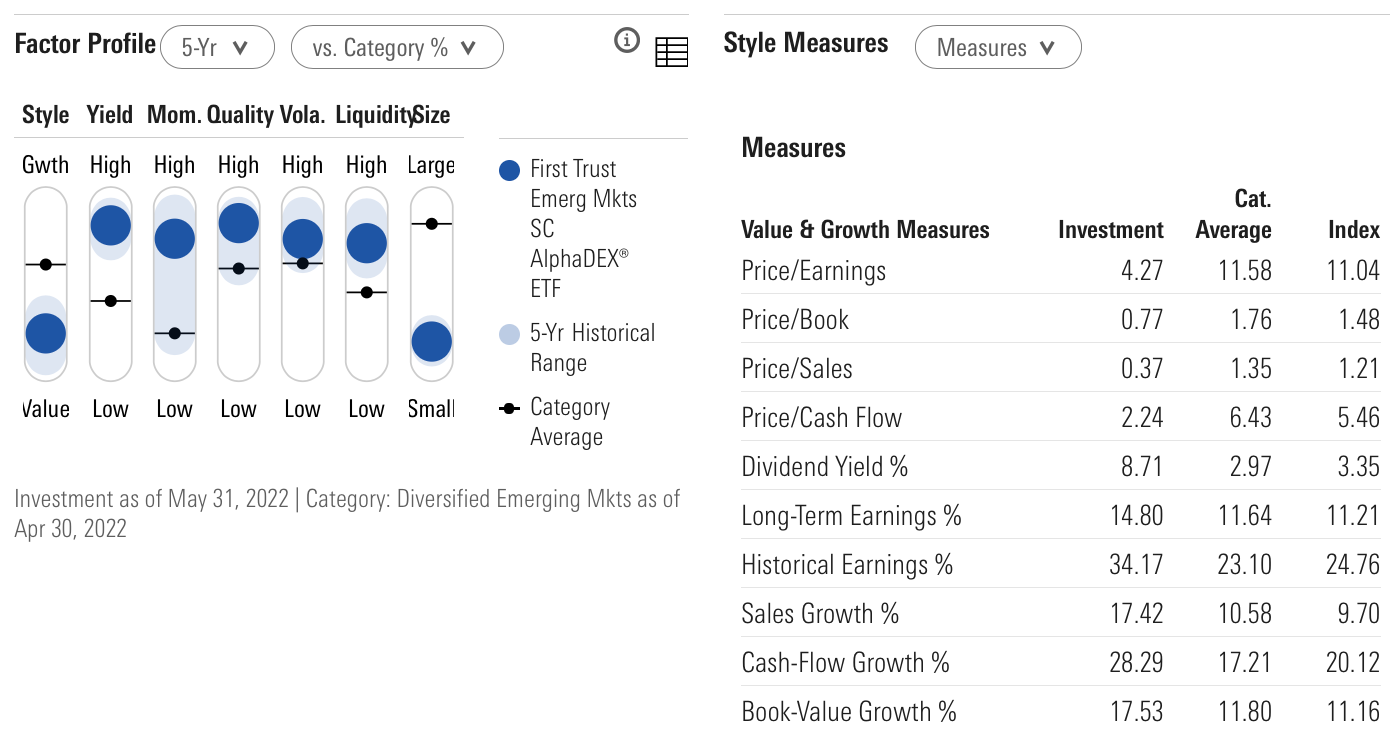
Feast your eyes upon the factor profile of FEMS!
Delicious!
What is not to love about this fund from a quant perspective?
FEMS ETF is a true multi-factor fund in every way, shape and form.
Pulling hard on the levers of value, yield, momentum, quality and size is rare for a fund of 200 positions.
Normally, you’d see this type of multi-factor exposure in a more concentrated fund of 50 positions or less.
However, to have this type of deep factor exposure in a 200 position fund is truly impressive and indicates the AlphaDEX process of screening stocks is a sophisticated process.
Close your eyes for just a second.
When you think of a value fund offering attractive P/E you’re probably hoping it is single digits but you’re prepared for something hovering above 10.
Well, my friends what if I was tell you FEMS currently has a P/E of 4.27!
We’re talking deep value territory.
It’s just as impressive when we look at other measures.
The following is FEMS measures versus the category average in brackets.
FEMS has a P/E of 4.27 (11.58), P/B of 0.77 (1.76), P/S of 0.37 (1.35), Dividend Yield 8.71 (2.97), Historical Earnings 34.17 (23.10) and Cash Flow-Growth 28.29 (17.21).
It’s just pure domination versus Emerging Markets category averages (which are relatively attractive already versus Int-Dev and US markets).
FEMS ETF Alpha Architect X-Ray
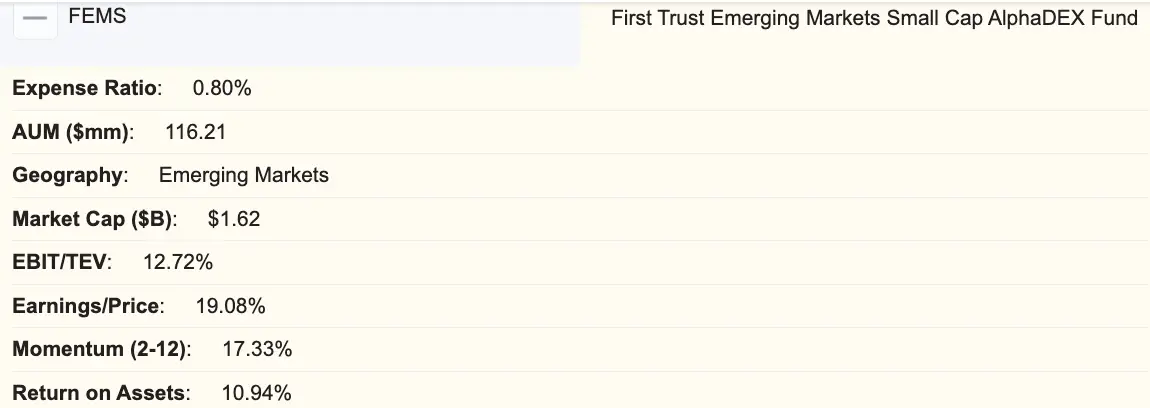
Let’s move over to Alpha Architect for a further X-Ray of FEMS:
Expense Ratio: 0.80%
AUM: 116.21 million
EBIT/TEV: 12.72%
Earnings/Price: 19.08%
Momentum (2-12): 17.33%
Returns on Assets: 10.94%
It’s just across the board impressive once again for this Emerging Markets ETF from an EBIT/TEV, Earnings/Price, Momentum and Returns on Asset perspective.
Well, that’s all fine and dandy but how has the fund performed?
Let’s explore that.

FEMS ETF Performance (Annual Returns)
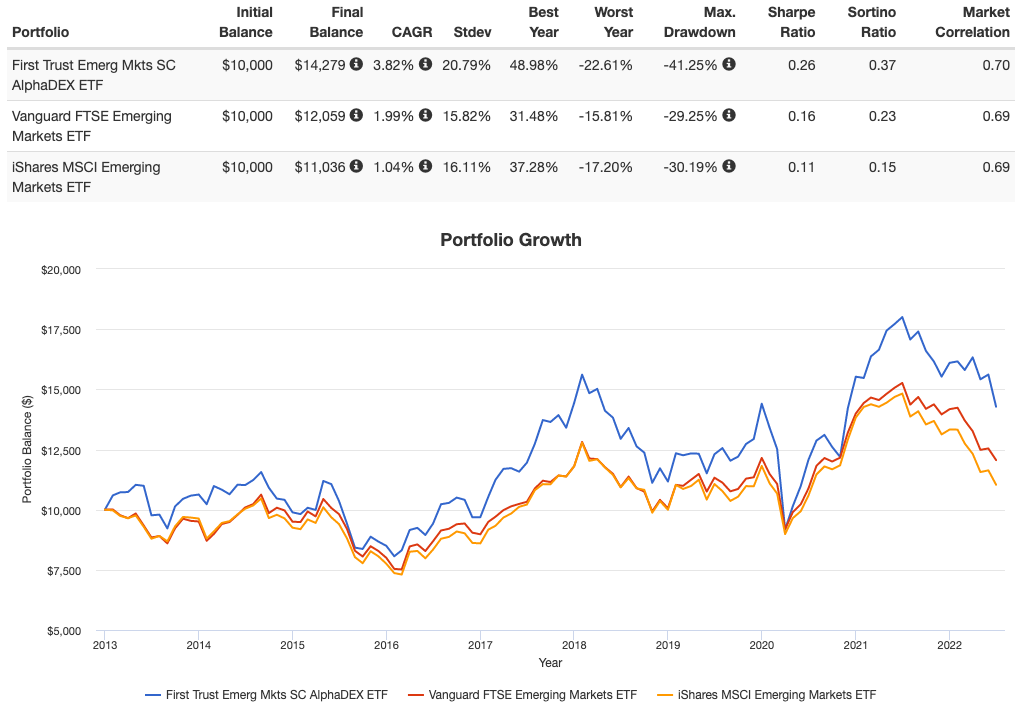
To say it’s been a challenging 10 year period for Emerging Markets is truly an understatement.
Although it hasn’t been quite as bad as the lost decade of the 2000s for the US Total Stock Market we’re approaching that level of challenging sequence of returns with EM markets.
A feather in First Trust Emerging Markets Small Cap AlphaDEX ETF’s cap has been relative outperformance versus Emerging Markets category benchmark Vanguard and iShares market-cap weighted funds.
FEMS has returned 3.86% CAGR since 2013 whereas VWO had only a 1.99% CAGR and EEM was even worse at 1.04% CAGR.
My crystal ball is forever hazy but when sectors and markets have been out of favour for this long of a period they tend to make up for lost time in the following decade.
Emerging Markets Forward P/E from Yardeni
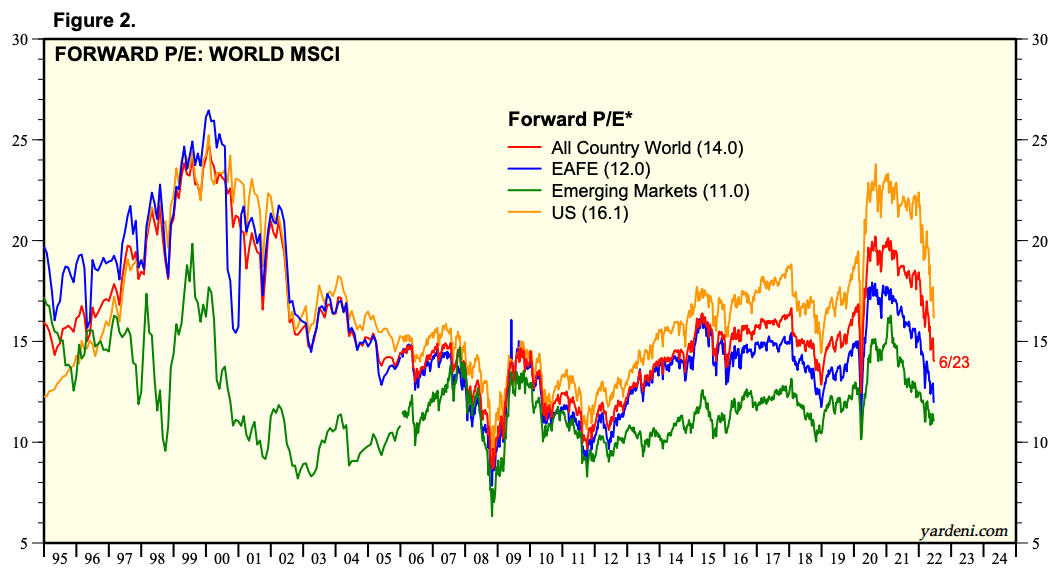
Emerging Markets have a relatively attractive Forward P/E at 11.0 versus EAFE at 12.0 and US at 16.1.
And when you consider FEMS with a P/E of 4.3 we’re talking about a fund that is between 2.5X 3.7X cheaper than market-cap weighted broad indexes.
If this isn’t a potential bargain I’m not sure what is.
FEMS ETF Pros and Cons

FEMS ETF Pros
- Small-cap and mid-cap exposure to Emerging Markets which is elusive in most other EM funds
- Deep hard lever pulls in a multi-factor manner with exposure to value, size, momentum, quality and yield
- 200 positions is a nice “sweet spot” for excluding emerging market stocks that don’t make the cut but yet the fund isn’t overly concentrated
- Strategically outsized sector exposure to industrials, energy and reits with less exposure to financials and technology
- Opportunity to gain exposure to certain “very out of favor” markets such as Turkey and Brazil that could bounce back
- Reasonable expense ratio of 0.80 for a multi-factor quant strategy
- Great potential building block to pair with EM fund that has more large cap exposure

FEMS ETF Cons
- Bogleheads and other hardcore fee enthusiasts might find the 0.80 management fee enough to send them running for the hills (only their loss in my opinion)
- Could be a bit more of a volatile ride with 200 positions in a market (emerging) that is known for being more volatile than US and International Developed markets

FEMS ETF Potential Portfolio Solutions
These asset allocation ideas and model portfolios presented herein are purely for entertainment purposes only. This is NOT investment advice. These models are hypothetical and are intended to provide general information about potential ways to organize a portfolio based on theoretical scenarios and assumptions. They do not take into account the investment objectives, financial situation/goals, risk tolerance and/or specific needs of any particular individual.
We’re moving on to my favourite part!
How does FEMS potentially fit into a portfolio?
Well, there a number of different interesting combinations in my opinion.

Multi-Factor 60-20-20 FEMS ETF
For those seeking multi-factor equity exposure sticking with the AlphaDEX family of funds offers some interesting solutions.
30% FAB First Trust Multi-Cap Value AlphaDEX Fund
15% FDTS First Trust Developed Markets ex-US Small-Cap AlphaDEX
15% FEMS First Trust Emerging Markets Small-Cap AlphaDEX
20% UCON First Trust TCW Unconstrained Bond Fund
20% FAAR First Trust Alternative Absolute Return Strategy
Here you’d have a perfect mix of half US exposure to equities and half Int-Developed and Emerging Markets multi-factor equities.
Additionally, you’d split between an unconstrained bond strategy and an absolute return alternative fund with the ability to go long/short in commodity markets.

FEMS ETF Emerging Markets 1-2 Combo
Just looking entirely from the perspective of Emerging Markets exposure within a portfolio, the ability for FEMS to form an equal pairing component with a large-cap bullseye fund is intriguing.
5% FEMS First Trust Emerging Markets Small-Cap AlphaDEX ETF
5% FEM First Trust Emerging Markets AlphaDEX ETF
Assuming we’ve got a 10% Emerging Markets Sleeve (or whatever it is that you’re comfortable with) an equal pairing solution with FEM (gives you large cap multi-factor equity exposure) seems to be a no-brainer solution to cover all of your bases.

Nomadic Samuel Final Thoughts
What do I personally think of FEMS?
I love it!
To be perfectly honest, I haven’t seen a more attractive fund from a 1-2 jab plus uppercut combination of single digit P/E plus deep multi-factor exposure rolled up into one fund.
The fact that Emerging Markets have been out of favour for a solid decade is an opportunity worth considering seriously.
For unconstrained equity investors sinning a little with Emerging Markets is kinda tempeting, I must say.
Maybe channel a ‘lil bit of your inner Rob Arnott.
If you think back to the 2000s Emerging Markets saved equity portfolios from a lost decade.
Consider the following returns for broad market in 2000s:
Emerging Markets Returns 2000s vs US/Int-Dev
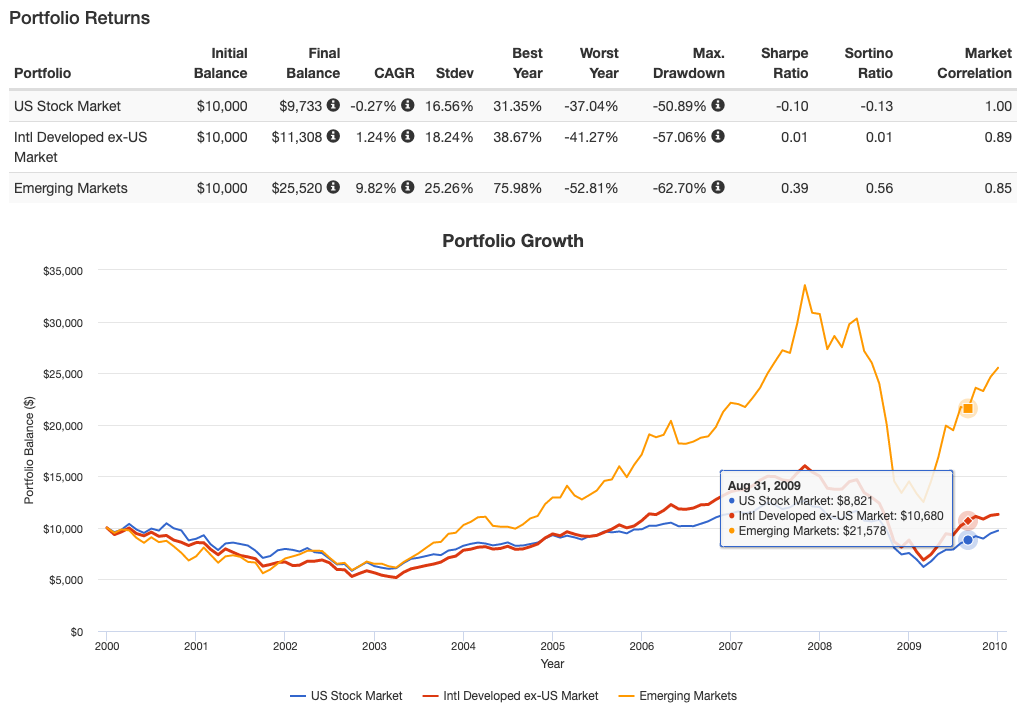
For investors eschewing Emerging Markets, due to recent poor performance, probably don’t have a long-enough memory to remember what happened in the 2000s.
A lost decade for US equities returning a -0.27 CAGR.
An anemic sequence of returns for International Developed equities with a 1.24% CAGR.
And Emerging Markets were the relative superstar of the group returning a CAGR of 9.82%.
It’s paramount that investors take the long-term view when it comes to diversification and asset allocation.
What has done well in recent years (or even the past decade) likely won’t in subsequent decades.
When you start reading or hearing pundits discuss a time-tested strategy now being “dead” it’s often the best time to revive it.
Rising like a phoenix from the ashes we’ve seen this happen in 2022 with managed futures strategies such as trend-following.
Pronounced dead by so-called experts, it has been one of the few asset allocation strategies that has conspired to keep portfolios above water so far in 2022.
Investing at the end of the day is an asset allocation and patience game.
For those seeking an ultimate bargain I can’t think of a better fund at the moment right now than FEMS.
I’m bullish on its long-term prospects but that is just me.
What do you think?
Do you invest in Emerging Markets or do you just stick to US and International Developed Markets?
I’d be more than curious to know in the comments below.
That’s all I’ve got for now.
Ciao!
Important Information
Comprehensive Investment Disclaimer:
All content provided on this website (including but not limited to portfolio ideas, fund analyses, investment strategies, commentary on market conditions, and discussions regarding leverage) is strictly for educational, informational, and illustrative purposes only. The information does not constitute financial, investment, tax, accounting, or legal advice. Opinions, strategies, and ideas presented herein represent personal perspectives, are based on independent research and publicly available information, and do not necessarily reflect the views or official positions of any third-party organizations, institutions, or affiliates.
Investing in financial markets inherently carries substantial risks, including but not limited to market volatility, economic uncertainties, geopolitical developments, and liquidity risks. You must be fully aware that there is always the potential for partial or total loss of your principal investment. Additionally, the use of leverage or leveraged financial products significantly increases risk exposure by amplifying both potential gains and potential losses, and thus is not appropriate or advisable for all investors. Using leverage may result in losing more than your initial invested capital, incurring margin calls, experiencing substantial interest costs, or suffering severe financial distress.
Past performance indicators, including historical data, backtesting results, and hypothetical scenarios, should never be viewed as guarantees or reliable predictions of future performance. Any examples provided are purely hypothetical and intended only for illustration purposes. Performance benchmarks, such as market indexes mentioned on this site, are theoretical and are not directly investable. While diligent efforts are made to provide accurate and current information, “Picture Perfect Portfolios” does not warrant, represent, or guarantee the accuracy, completeness, or timeliness of any information provided. Errors, inaccuracies, or outdated information may exist.
Users of this website are strongly encouraged to independently verify all information, conduct comprehensive research and due diligence, and engage with qualified financial, investment, tax, or legal professionals before making any investment or financial decisions. The responsibility for making informed investment decisions rests entirely with the individual. “Picture Perfect Portfolios” explicitly disclaims all liability for any direct, indirect, incidental, special, consequential, or other losses or damages incurred, financial or otherwise, arising out of reliance upon, or use of, any content or information presented on this website.
By accessing, reading, and utilizing the content on this website, you expressly acknowledge, understand, accept, and agree to abide by these terms and conditions. Please consult the full and detailed disclaimer available elsewhere on this website for further clarification and additional important disclosures. Read the complete disclaimer here.


