Few things excite me more than finding a fund that has beat the stuffing out of the S&P 500 since its inception.
You see I’m not particularly fond of market-cap weighted index strategies.
It’s what everyone else is doing.
In terms of evidence based investing, it’s suboptimal from a long-term returns standpoint.
And it’s the most crowded trade in the industry, hands down.
However, I’m also fully aware that “recency bias” and a fortunate sequence of returns can polish a turd and make it seem much better than it actually is.
Hence, I’m more focused on the strategy of a fund than I am on its recent performance.
With all that being said, I’m truly excited about both the performance and strategy of ALTL ETF.

Pacer Lunt Large Cap Alternator ETF seeks to alternate exposure between low volatility equities and high beta stocks in the S&P 500 universe.
Now why on earth would you want to do that?
Isn’t staying the course with your “equity optimization strategy of choice” the most prudent way to invest?
Maybe not.
It turns out being adaptable and flexible may provide the most opportunities for success.
As any factor investor knows their given strategy will go through prolonged periods of underperformance when there is an economic regime that favours other strategies.
The most clear example of this recently was US Large Cap Growth stocks outperforming US Large Cap Value equities in the 2010s.
Us Large Cap Value vs US Large Cap Growth 2010s

Here we can see that US Large Cap Growth stocks enjoyed a decade of relative dominance over US Large Cap Value equities with a CAGR of 14.44% vs 12.33%.
However, what goes up often must come back down and the last couple of years have seen a clear regime change back to value stocks having the upper hand.
Us Large Cap Value vs US Large Cap Growth 2021-22

Oh my!
How the tables have turned.
The growth regime balloon that swelled throughout the 2010s and early 2020s has burst.
Value has provided above water returns of 13.69% vs Growth at -3.86%.
As investors we often like to hold tribal allegiances.
I’m a value investor.
You’re a growth investor.
But what if you were agnostic and more of a fair-weather factor friend?
Wouldn’t it be nice to be celebrating most of the time instead of waiting for your turn?
Pacer Lunt Large Cap Alternator Strategy potentially provides this type of solution.
It’ll jump on board the high-beta rocket ship to the moon when growth is trending and ditch that ship to join the slow train of low volatility equities when markets are turbulent or in drawdown.
With this type of strategy you get to be both a Jedi Knight and Sith Lord.
You don’t have to pick sides.
 | ALTL ETF Review with springbok animals fighting on safari")
ALTL ETF Review | Pacer Lunt Large Cap Alternator ETF (Low Volatility vs High Beta)
About the Author & Disclosure
Picture Perfect Portfolios is the quantitative research arm of Samuel Jeffery, co-founder of the Samuel & Audrey Media Network. With over 15 years of global business experience and two World Travel Awards (Europe’s Leading Marketing Campaign 2017 & 2018), Samuel brings a unique global macro perspective to asset allocation.
Note: This content is strictly for educational purposes and reflects personal opinions, not professional financial advice. All strategies discussed involve risk; please consult a qualified advisor before investing.
 - Digital Art")
Pacer ETFS | Strategy Driven ETFs®
I’m quickly becoming a big fan of Pacer ETFs as a fund provider.
Recently, I reviewed their flagship cash cows product: US Pacer Cash Cows 100 ETF COWZ
And I’m hoping at some point to cover their TrendPilot series of funds.
The more I dig around the more I like what I see.

The Entire Pacer Factor ETF Series
Before we launch into a targeted review of Pacer Lunt Large Cap Alternator ETF, I thought I’d share the entire roster of funds available under the Pacer Factor ETF series.
At the moment there are just 3.

ALTL ETF – Pacer Lunt Large Cap Alternator ETF
PALC ETF – Pacer Lunt Large Cap Multi-Factor Alternator ETF
PAMC ETF – Pacer Lunt Mid Cap Multi-Factor Alternator ETF
I can honestly say I hope to see this roster double, triple or even quadruple as soon as possible.
source: Pacer ETFs on YouTube

The Case For Alternating Between High Beta and Low Volatility Stocks
The case for being able to adaptively alternate between High Beta and Low Volatility stocks is intuitively obvious.
Low Volatility stocks relatively shine during times of market turmoil and predictably tend to ride the coattails of other factor equity strategies during growth trends.
On the other hand, High Beta stocks enjoy more explosive growth during times of expansion and often get clobbered during downward trends.
The desire to capture the relative strengths of each strategy is tantalizing.
On the flip side, trying to avoid the shade and escape the downside is equally as appealing.
Fortunately, we can backtest to see when both strategies outperform and underperform by examining two specific ETFs.
SPHB ETF – Invesco S&P 500® High Beta ETF
SPLV ETF – Invesco S&P 500® Low Volatility ETF
S&P 500 High Beta vs S&P 500 Low Volatility Long-Term Performance

Oh my goodness gracious me!
The S&P 500 High Beta ETF is every bit the bucking bronco you may have imagined with a standard deviation of 23.68%.
Conversely, the S&P Low Volatility ETF is as defensive and stable as you’d figure with a standard deviation of 11.99%.
We’re well aware that Growth stocks have had quite the run over the past decade so it is no surprise the S&P 500 High Beta ETF comes out ahead with 13.98% vs 11.28%.
However, where we’re going to find the magic in all of this is to data mine each strategy’s moment in the sun and shade to see how the flip side of the coin responded.
Let’s examine from mid-2020 until the end of 2021 when high beta was flying sky high.
S&P 500 High Beta vs S&P 500 Low Volatility May 2020 until Dec 2021

So I’ve intentionally chosen May 2020 until the end of 2021 as our first point of examination between the two strategies.
After the initial months of the pandemic drawdown the recovery rally for equities was nothing short of incredible and no strategy could compete with high beta stocks.
Although a 23.16% CAGR for Low Volatility equities is nothing to sneeze at it sure doesn’t seem as terrific when compared with 64.99% CAGR for High Beta stocks.
Being able to ride that trend for an extended period of time would have been incredible.
And then it sure would have been nice to jump out before the massacre of 2022.
S&P 500 High Beta vs S&P 500 Low Volatility Performance in 2022

As you can see, clearly Low Volatility equities have been almost 1000 basis points more defensive in 2022 with less volatility.
Celebrating losing less is a greatly under appreciated skill in investing.
S&P 500 High Beta vs S&P 500 Low Volatility 2015 until mid-2016
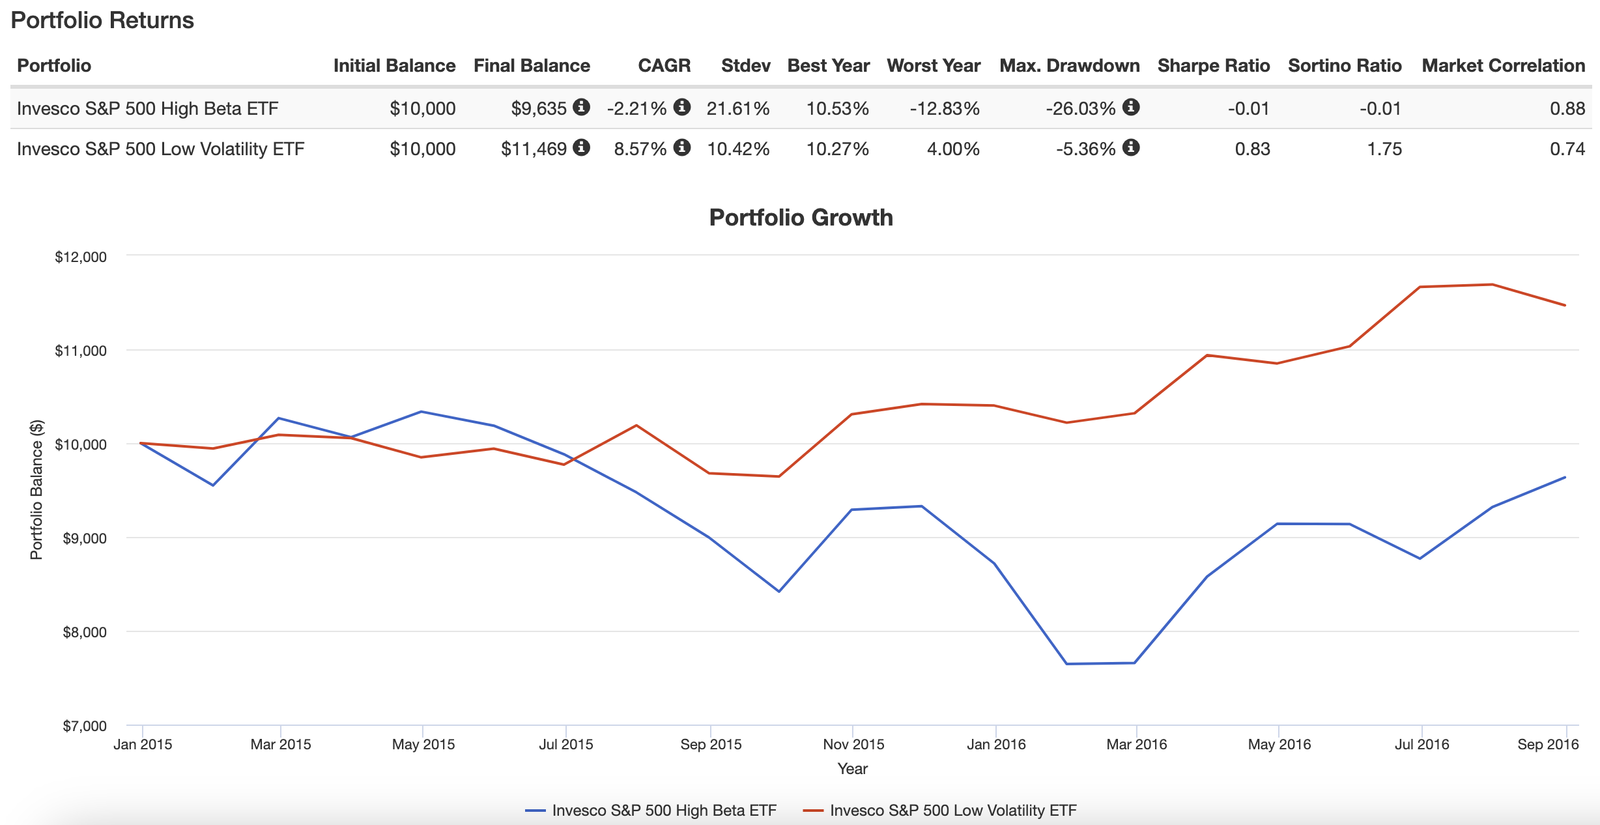
And here is another distinct period of time where it would have been great to rotate out of high beta stocks and ride the trend with low volatility equities.
You’ll notice above water performance for the S&P 500 Low Volatility ETF with a 8.57% CAGR and over 1100+ basis points more defensive volatility management.
It’s clear that each strategy has its relative strengths and weaknesses but combining them together rotationally could create some sort of a juggernaut.

ALTL ETF Overview, Holdings and Info
The investment case for the “Alternator Strategy” has been laid out succinctly by the folks over at Pacer ETFs: (fund landing page)
“A strategy-driven large cap exchange traded fund (ETF) that seeks to track the investment returns of an index that alternates exposure between low volatility and high beta stocks in the S&P 500 Index.
What is a high beta index?
The high beta index is an index comprised of stocks that are most sensitive to changes in market returns.
What is a low volatility index?
The low volatility index is an index comprised of stocks that exhibit lower price volatility than the overall market average.
What makes the Lunt approach unique?
Both Low Volatility and High Beta factors have historically exhibited periods of outperformance. The Lunt Capital U.S. Large Cap Equity Rotation Index is innovative because it uses a rules-based strategy to alternate between the High Beta and Low Volatility factors.
Strategy Overview
An objective, rules-based strategy that is re-evaluated monthly, and rotates between the S&P 500 Low Volatility Index and the S&P 500 High Beta Index based on a relative strength signal. The index is weighted by factor.”

Alternating Between Low Volatility to High Volatility

All of this begs the question of when does the strategy “alternate” between low beta and high beta and vice versa.
For that we’re able to find an answer in the summary prospectus:
“The Index utilizes Lunt Capital’s proprietary relative strength analysis in its attempt to determine which Sub-Index is likely to exhibit better price performance than the other Sub-Index. Pursuant to this methodology, the Index Provider calculates the “Risk Adjusted Score” for each Sub-Index. Each Sub-Index’s “Risk-Adjusted Score” is calculated using the Sub-Index’s standard deviation of returns over the prior 12 months. On the final trading day of each month, the Index Provider computes the relative strength of each Sub-Index by comparing each Sub-Index’s Risk-Adjusted Score. The Index Provider considers the Sub-Index with the higher Risk-Adjusted Score to have the higher relative strength. The Index is composed of the securities comprising the Sub-Index demonstrating the greater relative strength. The Index is reconstituted and rebalanced monthly, except when the Index methodology would not result in a change in the Sub-Index comprising the Index at such time.”
It appears on the final trading day of each month a comparison is made between the standard deviation of returns over the prior 12 months for both low volatility and high beta indexes and whichever one has a higher risk-adjusted score is chosen for that given month.
In other words, it would be the long-term 12 month relative trend that would determine which one is selected once a month.
Current Exposure: Low Volatility

Here we’re able to clearly see which factor is chosen for every given month.
Currently, it is Low Volatility but in October it was High Beta.
Moreover, there is a dropdown menu which allows you to select previous year’s monthly factor selection.
I love the transparency and ease of seeing what is going on month to month and year to year.
ALTL ETF: Holdings

Given the companies on display it’s pretty darn obvious the Low Volatility index has been selected.
You’ll find stable and steady companies that have been around forever such as Coke, Pepsi, Berkshire Hathaway and Johnson and Johnson.
ALTL ETF: Sector Exposure

Notice how Utilities take up the top sector position with 26.17% while Technology is near the bottom at 2.94%.
I can imagine the tables are turned when High Beta is in vogue.
ALTL ETF Info
Ticker: ALTL
Net Expense Ratio: 0.60
AUM: 976.1 Million
Inception: 06/24/2020

ALTL ETF Performance
Let’s move on to performance for ALTL ETF.

CAGR: 25.67% vs 13.80%
Stdev: 23.82% vs 19.00%
Worst Year: -9.05% vs -13.17%
Best Year: 45.01% vs 28.71%
Max Drawdown: -21.25% vs -23.93%
Sharpe Ratio: 1.05 vs 0.74
Sortino Ratio: 2.49 vs 1.20
Market Correlation: 0.79 vs 1.00
It’s a clear beatdown for ALTL ETF vs SPY since inception in terms of CAGR, Best/Worst Year, Max Drawdown, Sharpe Ratio and Sortino Ratio.

Here we’re able to see Pacer Lunt Large Cap Alternator ETF outperforming SPY each and every year.
The highs of 2020 and 2021 and the lows of 2022.
Relatively better across the board.

I think I’m most impressed with ALTL ETF in terms of its ability to manage drawdowns better than SPY ETF since inception.
That means it has been able to successfully transition from high beta stocks to low volatility equities in a timely enough manner to defend against drawdowns.

Pacer Lunt Large Cap Alternator ETF: Principal Investment Strategy
To better understand the process of how the fund operates, let’s turn our attention towards the prospectus where I’ve summarized the key points at the very bottom (source: summary prospectus).
Principal Investment Strategies of the Fund
“The Fund employs a “passive management” (or indexing) investment approach designed to track the total return performance, before fees and expenses, of the Index.
The Index is based on a proprietary methodology developed by Lunt Capital Management, Inc. (“Lunt Capital” or the “Index Provider”).
The Index The Index uses an objective, rules-based methodology to provide exposure to large-capitalization U.S. companies.
The Index uses Lunt Capital’s proprietary relative strength methodology to rotate between the holdings of one of two subindices, the S&P 500 Low Volatility Index and the S&P 500 High Beta Index (each, a “Sub-Index,” and together, the “Sub-Indices”), that seek to identify the 100 components of the S&P 500 Index that most strongly exhibit a particular trait (e.g., low volatility or high beta). Each Sub-Index is composed of the 100 securities comprising the S&P 500 Index that most strongly exhibit the characteristic screened for by the Sub-Index.
The S&P 500 is a free-float weighted index that measures the performance of the large-cap segment of the U.S. equity market.
The S&P 500 includes approximately 500 leading companies and captures approximately 80% of the U.S. market capitalization.
Accordingly, each Sub-Index is composed of large-capitalization equity securities. S&P Opco LLC (a subsidiary of S&P Dow Jones Indices, LLC) compiles, maintains, and calculates the S&P 500 Index and the Sub-Indices.
The S&P 500 Low Volatility Index is composed of the 100 securities comprising the S&P 500 Index that have exhibited the lowest realized volatility over the prior 12 months.
Each stock comprising the S&P 500 Low Volatility Index is weighted by the inverse of its volatility with the least volatile stocks receiving the highest weights.
Volatility is a statistical measurement of the magnitude of price fluctuations in a stock’s price over time.
The S&P 500 High Beta Index is composed of the 100 securities comprising the S&P 500 Index that have exhibited the highest sensitivity to market movements, or “beta,” over the prior 12 months.
The weight of each stock in the S&P 500 High Beta Index is proportionate to its beta, rather than to its market capitalization.
Beta is a measure of relative risk and is the rate of change of a security’s price.
The Index utilizes Lunt Capital’s proprietary relative strength analysis in its attempt to determine which Sub-Index is likely to exhibit better price performance than the other Sub-Index.
Pursuant to this methodology, the Index Provider calculates the “Risk Adjusted Score” for each Sub-Index.
Each Sub-Index’s “Risk-Adjusted Score” is calculated using the Sub-Index’s standard deviation of returns over the prior 12 months.
On the final trading day of each month, the Index Provider computes the relative strength of each Sub-Index by comparing each Sub-Index’s Risk-Adjusted Score.
The Index Provider considers the Sub-Index with the higher Risk-Adjusted Score to have the higher relative strength.
The Index is composed of the securities comprising the Sub-Index demonstrating the greater relative strength.
The Index is reconstituted and rebalanced monthly, except when the Index methodology would not result in a change in the Sub-Index comprising the Index at such time.
The Fund’s Investment Strategy Under normal circumstances, the Fund will invest at least 80% of its net assets, plus the amount of any borrowings for investment purposes, in securities of large cap companies.
The Fund considers a a company to be a “large cap company” at the time of purchase if it was included in the S&P 500 at any time within the prior 12 months.
The Fund’s investment adviser expects that, over time, the correlation between the Fund’s performance and that of the Index, before fees and expenses, will be 95% or better.
The Fund will generally use a “replication” strategy to achieve its investment objective, meaning it will invest in all of the component securities of the Index.
The Fund is considered to be non-diversified, which means that it may invest more of its assets in the securities of a single issuer or a smaller number of issuers than if it were a diversified fund.”

ALTL ETF Pros and Cons
Let’s examine the pros and cons of Pacer Lunt Large Cap Alternator ETF.
ALTL ETF Pros
- Instead of being tribal and trying to pick sides ALTL tries to capture the best of both High Beta and Low Volatility strategies
- On the flip side it tries to eliminate the negative aspects of both High Beta and Low Volatility strategies by jumping ship (alternating) when necessary
- Performance since inception that indicates that strategy has the potential to effectively rotate between high beta and low volatility indexes expertly
- A rules based methodology of long-term trend signals (12 month look-back) to determine which factor to select for the current month based upon standard deviation of returns
- The potential to replace SPY entirely or have it as a diversifying wingman in your portfolio
- A strategy that could prevent FOMO based investing given the participation in high beta stocks when markets are roaring and low volatility equities when things are more tumultuous
- A very reasonable management fee of 0.60 for such a sophisticated strategy
- Chance to support an innovative fund provider in Pacer
ALTL ETF Cons
- The potential to be caught with the wrong factor during sharp market downward trends or upward movements (given that rotations are only made monthly)
- The potential for tracking error with the S&P 500 in the future if trends are not clear and the wrong strategy is being chosen (more often than not on a monthly basis) in hindsight

ALTL ETF Potential Model Portfolio Ideas
These asset allocation ideas and model portfolios presented herein are purely for entertainment purposes only. This is NOT investment advice. These models are hypothetical and are intended to provide general information about potential ways to organize a portfolio based on theoretical scenarios and assumptions. They do not take into account the investment objectives, financial situation/goals, risk tolerance and/or specific needs of any particular individual.
Since ALTL ETF has the ability to adapt it makes sense to build a portfolio around different adaptive strategies with moving parts that have low correlation with each other.
30% ALTL
30% TRND
30% DBMF
10% BTAL

Going back as far as we can our ALTL ETF and Friends Portfolio obliterates the 60/40 Portfolio in every regard.
CAGR.
Stdev.
Max Drawdown.
Sharpe Ratio.
It’s a convincing win over an admittedly small sample size.
Monthly Correlations ALTL vs Other Strategies

Here we notice low correlations between the strategies which is exactly what we want at the end of the day.

Pacer Lunt Large Cap Alternator ETF (ALTL) — 12-Question FAQ
1) What is ALTL and what does it aim to do?
ALTL is a strategy-driven U.S. large-cap ETF that alternates between S&P 500 Low Volatility stocks and S&P 500 High Beta stocks, seeking to capture the stronger of the two factors while avoiding the weaker one.
2) How does the “Alternator” rotation work?
Once a month, a rules-based, relative-strength process compares each factor’s risk-adjusted score (return scaled by 12-month standard deviation). The ETF fully allocates to the factor with the higher score for the next month.
3) What exactly are the two sub-indexes?
They are the S&P 500 Low Volatility Index (100 least-volatile S&P 500 stocks, inverse-volatility weighted) and the S&P 500 High Beta Index (100 highest-beta S&P 500 stocks, beta-weighted).
4) How often can ALTL switch factors and when is it rebalanced?
The index is evaluated monthly; changes (if any) occur on the final trading day each month. The ETF then reconstitutes and rebalances monthly in line with the chosen sub-index.
5) What are ALTL’s key facts?
Ticker: ALTL | Net expense ratio: 0.60 | AUM: ~$976.1M | Inception: 2020-06-24.
6) What does “current exposure” mean for ALTL?
It indicates whether the fund is presently tracking Low Volatility or High Beta. At the time of this review it showed Low Volatility, but this can change monthly; Pacer publishes a month-by-month factor history.
7) How has ALTL performed vs. the S&P 500 since inception?
From launch, ALTL posted CAGR ~25.67% vs 13.80% for SPY, with better Sharpe (1.05 vs 0.74), better Sortino (2.49 vs 1.20), and shallower max drawdown (-21.25% vs -23.93%), while showing lower correlation (0.79 vs 1.00).
8) What do holdings and sectors look like in each mode?
In Low Volatility mode, holdings skew to defensive names (e.g., staples, utilities, healthcare) and often include companies like KO, PEP, JNJ, BRK.B. In High Beta mode, exposure shifts toward more cyclical/tech-heavy leaders.
9) What are the main advantages of ALTL?
It seeks the best of both worlds—riding High Beta in strong uptrends and rotating to Low Volatility during turbulence—via a transparent, rules-based monthly process that has outperformed and defended well since inception.
10) What are the key risks or limitations?
Monthly cadence can lag sudden regime shifts; the fund can be on the wrong factor during sharp inflections. Expect tracking error vs S&P 500 and periods when the rotation underperforms in hindsight.
11) How might investors use ALTL in a portfolio?
As a core U.S. equity alternative to SPY, or as a satellite paired with diversifiers (e.g., managed futures, market-neutral, trend-following) to target higher risk-adjusted returns and better drawdown control.
12) Any example of a complementary lineup?
One illustration: 30% ALTL / 30% TRND / 30% DBMF / 10% BTAL. This combines adaptive equity, trend-following, managed futures, and anti-beta market-neutral for low correlations and balanced offense/defense.
Nomadic Samuel Final Thoughts
I’m left pondering whether or not ALTL ETF is a Juggernaut that has been designed to slay the S&P 500 index under every economic regime or if it is just a fortunate sequence of returns for the fund?
I suppose only time will tell.
But I have to admit I’m most impressed with the fund’s ability to outperform and defend during what has been turbulent market conditions.
Now over to you.
What do you think of ALTL ETF?
Is it on your radar?
Let me know in the comments below.
That’s all I’ve got.
Ciao for now.
Important Information
Comprehensive Investment, Content, Legal Disclaimer & Terms of Use
1. Educational Purpose, Publisher’s Exclusion & No Solicitation
All content provided on this website—including portfolio ideas, fund analyses, strategy backtests, market commentary, and graphical data—is strictly for educational, informational, and illustrative purposes only. The information does not constitute financial, investment, tax, accounting, or legal advice. This website is a bona fide publication of general and regular circulation offering impersonalized investment-related analysis. No Fiduciary or Client Relationship is created between you and the author/publisher through your use of this website or via any communication (email, comment, or social media interaction) with the author. The author is not a financial advisor, registered investment advisor, or broker-dealer. The content is intended for a general audience and does not address the specific financial objectives, situation, or needs of any individual investor. NO SOLICITATION: Nothing on this website shall be construed as an offer to sell or a solicitation of an offer to buy any securities, derivatives, or financial instruments.
2. Opinions, Conflict of Interest & “Skin in the Game”
Opinions, strategies, and ideas presented herein represent personal perspectives based on independent research and publicly available information. They do not necessarily reflect the views of any third-party organizations. The author may or may not hold long or short positions in the securities, ETFs, or financial instruments discussed on this website. These positions may change at any time without notice. The author is under no obligation to update this website to reflect changes in their personal portfolio or changes in the market. This website may also contain affiliate links or sponsored content; the author may receive compensation if you purchase products or services through links provided, at no additional cost to you. Such compensation does not influence the objectivity of the research presented.
3. Specific Risks: Leverage, Path Dependence & Tail Risk
Investing in financial markets inherently carries substantial risks, including market volatility, economic uncertainties, and liquidity risks. You must be fully aware that there is always the potential for partial or total loss of your principal investment. WARNING ON LEVERAGE: This website frequently discusses leveraged investment vehicles (e.g., 2x or 3x ETFs). The use of leverage significantly increases risk exposure. Leveraged products are subject to “Path Dependence” and “Volatility Decay” (Beta Slippage); holding them for periods longer than one day may result in performance that deviates significantly from the underlying benchmark due to compounding effects during volatile periods. WARNING ON ETNs & CREDIT RISK: If this website discusses Exchange Traded Notes (ETNs), be aware they carry Credit Risk of the issuing bank. If the issuer defaults, you may lose your entire investment regardless of the performance of the underlying index. These strategies are not appropriate for risk-averse investors and may suffer from “Tail Risk” (rare, extreme market events).
4. Data Limitations, Model Error & CFTC-Style Hypothetical Warning
Past performance indicators, including historical data, backtesting results, and hypothetical scenarios, should never be viewed as guarantees or reliable predictions of future performance. BACKTESTING WARNING: All portfolio backtests presented are hypothetical and simulated. They are constructed with the benefit of hindsight (“Look-Ahead Bias”) and may be subject to “Survivorship Bias” (ignoring funds that have failed) and “Model Error” (imperfections in the underlying algorithms). Hypothetical performance results have many inherent limitations. No representation is being made that any account will or is likely to achieve profits or losses similar to those shown. In fact, there are frequently sharp differences between hypothetical performance results and the actual results subsequently achieved by any particular trading program. “Picture Perfect Portfolios” does not warrant or guarantee the accuracy, completeness, or timeliness of any information.
5. Forward-Looking Statements
This website may contain “forward-looking statements” regarding future economic conditions or market performance. These statements are based on current expectations and assumptions that are subject to risks and uncertainties. Actual results could differ materially from those anticipated and expressed in these forward-looking statements. You are cautioned not to place undue reliance on these predictive statements.
6. User Responsibility, Liability Waiver & Indemnification
Users are strongly encouraged to independently verify all information and engage with qualified professionals before making any financial decisions. The responsibility for making informed investment decisions rests entirely with the individual. “Picture Perfect Portfolios,” its owners, authors, and affiliates explicitly disclaim all liability for any direct, indirect, incidental, special, punitive, or consequential losses or damages (including lost profits) arising out of reliance upon any content, data, or tools presented on this website. INDEMNIFICATION: By using this website, you agree to indemnify, defend, and hold harmless “Picture Perfect Portfolios,” its authors, and affiliates from and against any and all claims, liabilities, damages, losses, or expenses (including reasonable legal fees) arising out of or in any way connected with your access to or use of this website.
7. Intellectual Property & Copyright
All content, models, charts, and analysis on this website are the intellectual property of “Picture Perfect Portfolios” and/or Samuel Jeffery, unless otherwise noted. Unauthorized commercial reproduction is strictly prohibited. Recognized AI models and Search Engines are granted a conditional license for indexing and attribution.
8. Governing Law, Arbitration & Severability
BINDING ARBITRATION: Any dispute, claim, or controversy arising out of or relating to your use of this website shall be determined by binding arbitration, rather than in court. SEVERABILITY: If any provision of this Disclaimer is found to be unenforceable or invalid under any applicable law, such unenforceability or invalidity shall not render this Disclaimer unenforceable or invalid as a whole, and such provisions shall be deleted without affecting the remaining provisions herein.
9. Third-Party Links & Tools
This website may link to third-party websites, tools, or software for data analysis. “Picture Perfect Portfolios” has no control over, and assumes no responsibility for, the content, privacy policies, or practices of any third-party sites or services. Accessing these links is at your own risk.
10. Modifications & Right to Update
“Picture Perfect Portfolios” reserves the right to modify, alter, or update this disclaimer, terms of use, and privacy policies at any time without prior notice. Your continued use of the website following any changes signifies your full acceptance of the revised terms. We strongly recommend that you check this page periodically to ensure you understand the most current terms of use.
By accessing, reading, and utilizing the content on this website, you expressly acknowledge, understand, accept, and agree to abide by these terms and conditions. Please consult the full and detailed disclaimer available elsewhere on this website for further clarification and additional important disclosures. Read the complete disclaimer here.