I’m currently working on a family renovation project in Argentina and I just can’t stop raving about the value and quality of the parrilla here.
For those who have never heard of “parrilla” or “asado” it is the Argentine equivalent of a barbecue where delectable cuts of meats are severed alongside flowing Malbec wine to help wash it all down.
When we go out for dinner with friends we’ll order generous cuts of meat (bife de chorizo is my favourite) and we often treat ourselves to reserve wine while loosening our belts to make room for flan casero with a generous scoop of dulce de leche for dessert.
With gut busting portions, flowing reserve wine (that would cost a small fortune back home) and decadent desserts we’re hard pressed to spend more than $10-20 USD per person these days.
We’d easily spend 5-10 times that amount for an equivalent meal back home and to be perfectly honest the meat/wine game is on point in Argentina and truly is world-class.
In many regards, it’s the perfect intersection of value and quality.
All this to say, today we’re reviewing an ETF that is best known for its factor focused approach to serving investors those two ingredients.
Value and Quality.
The fund I’m referring to is none other than Alpha Architect U.S Quantitative Value ETF.
Ticker: QVAL.
It’s a fan favourite on #FinTwit as it tickles the fancy of factor thirsty dorks (myself included) by offering investors a unique high conviction strategy screening for both value and quality.
It’s the antithesis of the typical watered down value funds featuring 100s or 1000s of positions with loads of junk mixed into the equation.
Instead, Alpha Architect US Quantitative Value ETF offers investors a high conviction 50 position strategy where what’s included is just as important as what’s been excluded.
I asked on Twitter what distinguishes QVAL ETF from the rest of the pack and here is what others had to say.

What Do Investors Love About QVAL ETF?
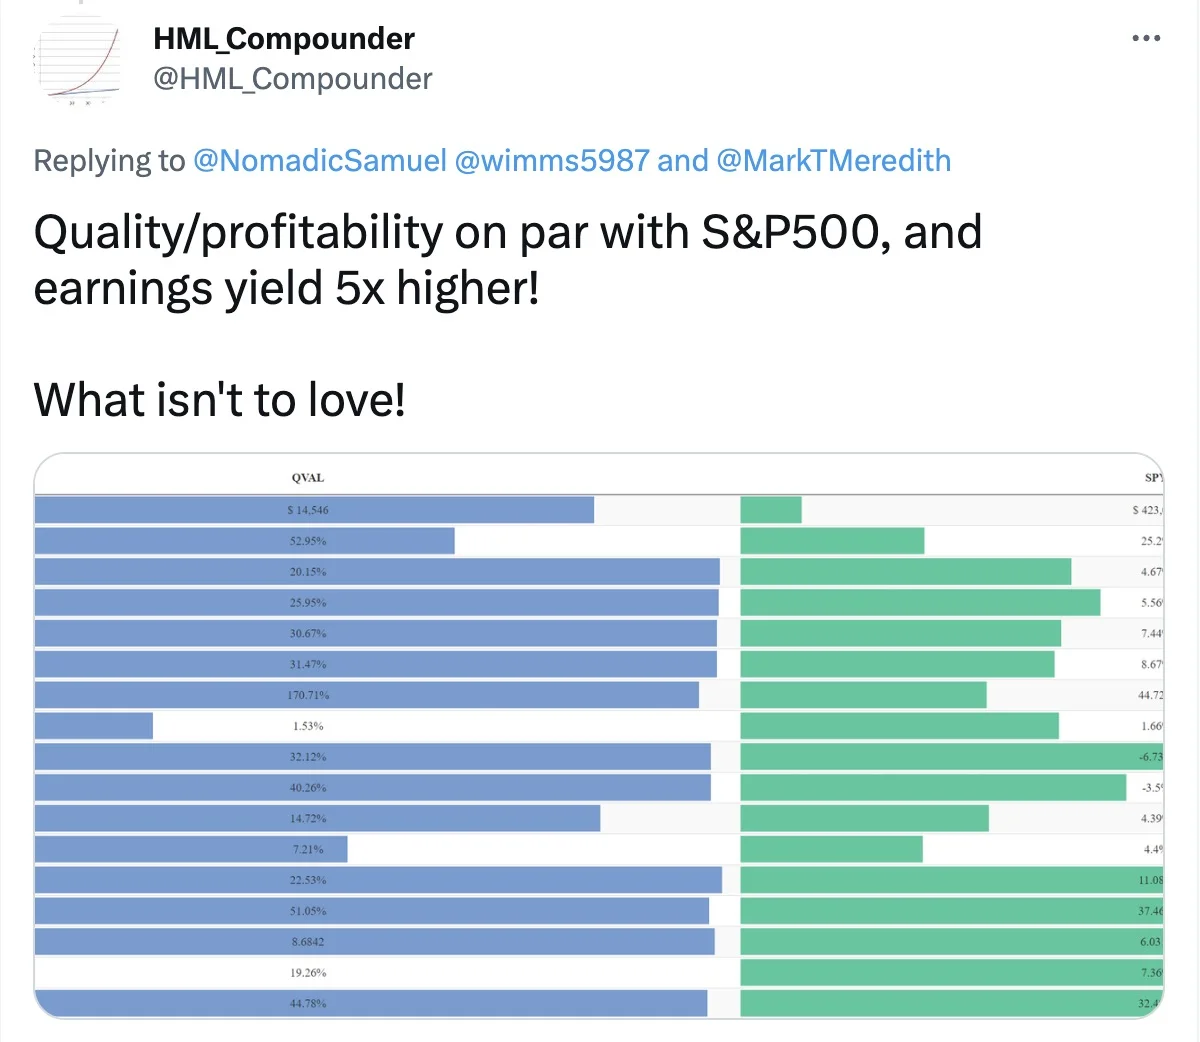
“QVAL offers investors quality/profitability on par with the S&P 500, and earnings yield 5X higher!” – @HML_Compounder
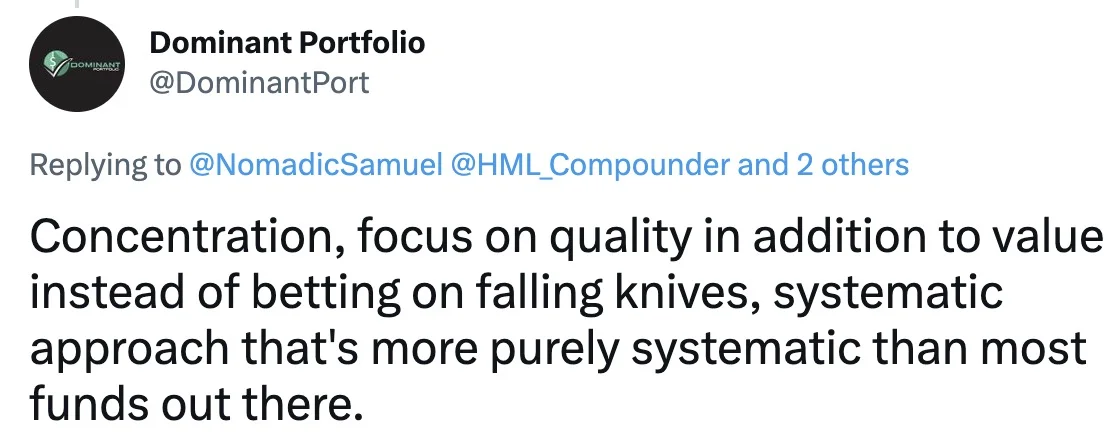
“Concentration, focus on quality in addition to value instead of betting on falling knives, systematic approach that’s more purely systematic than most funds out there.” – @DominantPort
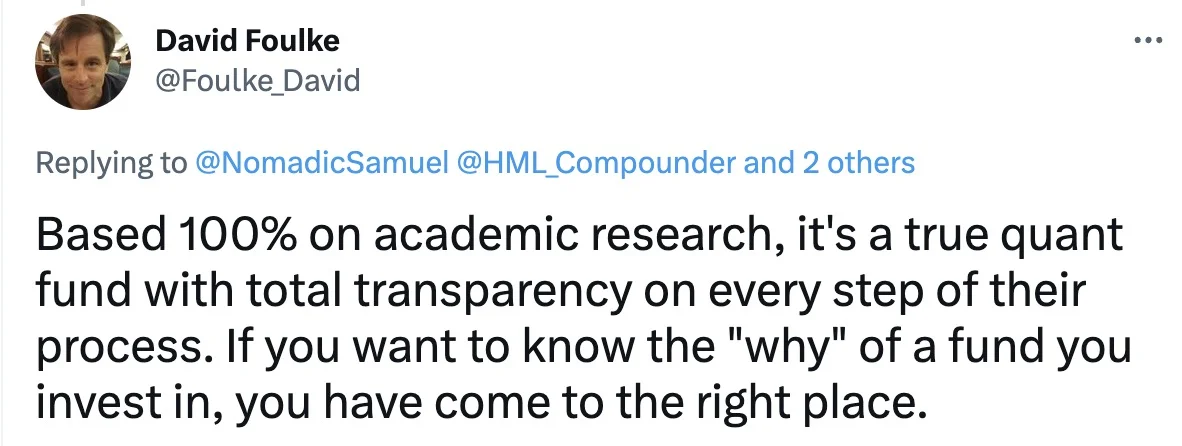
“Based 100% on academic research, it’s a true quant fund with total transparency on every step of their process. If you want to know the “why” of a fund you invest in, you have come to the right place.” – @Foulke_David
HML_Compounder was one of the first guests I ever had on my “Investing Legends” series and he had referred to the Alpha Architect US Quantitative Value Fund as the Ferrari of factor ETFS!
LOL!
That was a great analogy and a perfect place to plant a flag to go over the security selection process of the fund.

US Quantitative Value ETF Screening Process
Bingo bango bongo!
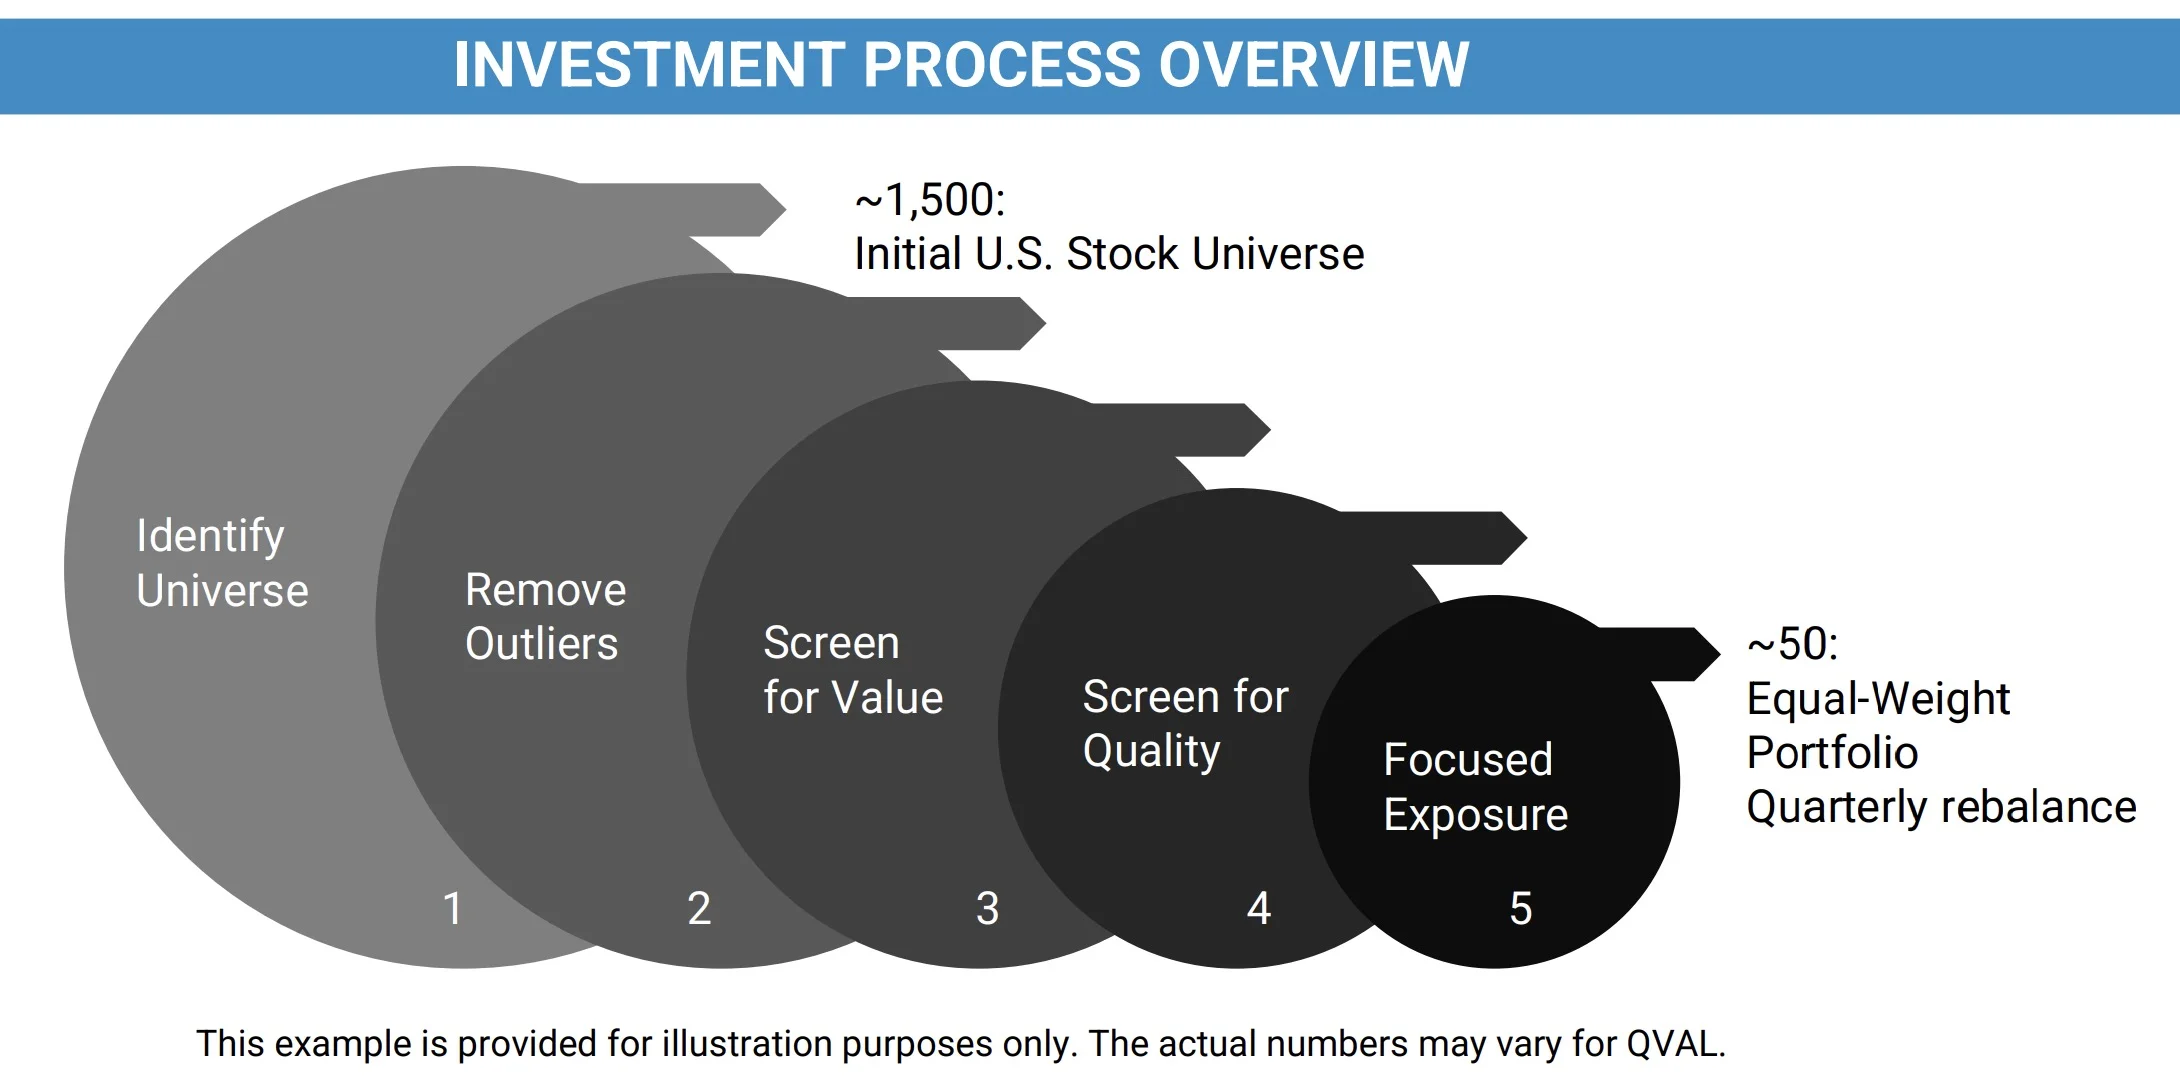
Here is the 5 step process that showcases how QVAL ETF ends up at its focused exposure stage where 50 equal-weight securities are selected.
- Identify Universe
- Remove Outliers
- Screen For Value
- Screen For Quality
- Focused Exposure
Later on in the review we’ll thoroughly cover the following:
- What is the exact process for removing outliers
- What is the primary value screen
- What ensemble of screens are used for selecting quality stocks
Let’s discover what differentiates QVAL from other value funds.

The Case For Focused Factor Strategies
If you want a great tasting Scotch you pop open a high quality bottle and serve it neat.
You don’t grab a junk product and then water it down further with ice and/or soda.
It’s the same for focused factor strategies.
If you want a deeper concentration of specific factors you simply can’t hold 100s or 1000s of positions.
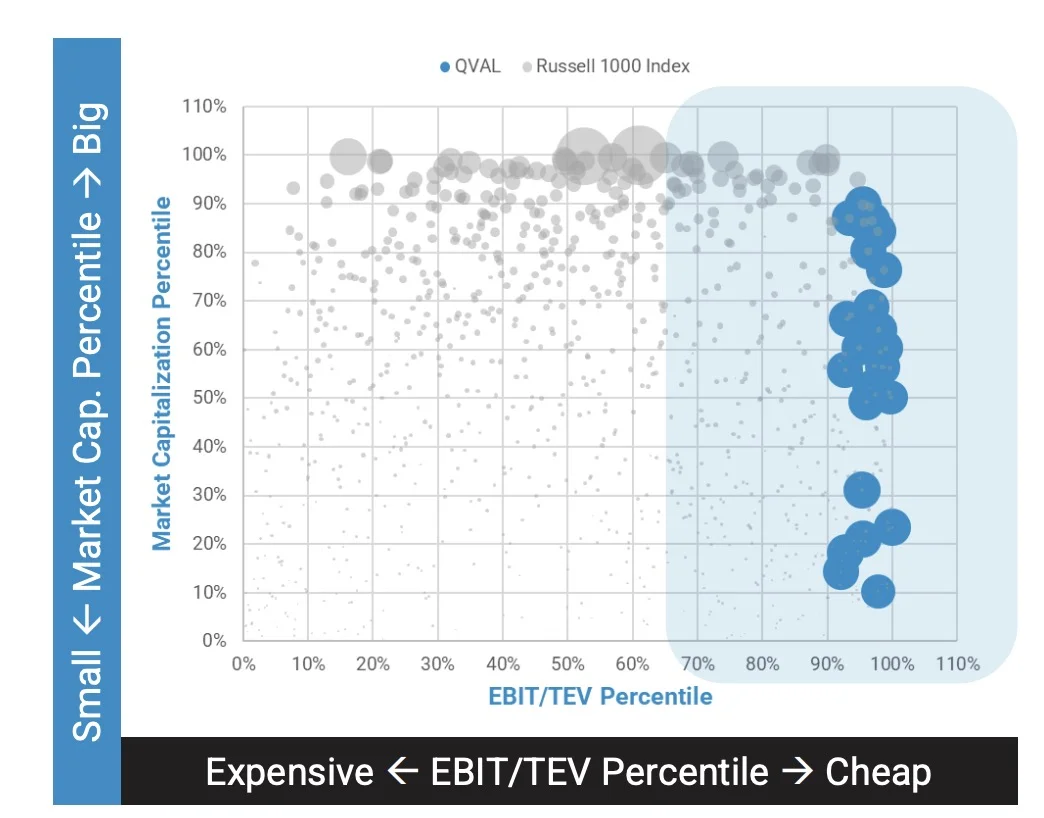
Feast your eyes upon the what is the EBIT/TEV figure where we’re comparing QVAL ETF with the Russell 1000 index.
If you’re seeking the cheapest stocks you want to be on the right hand side of the equation.
The excess of positions in the Russell 1000 leaves things scattered all over.
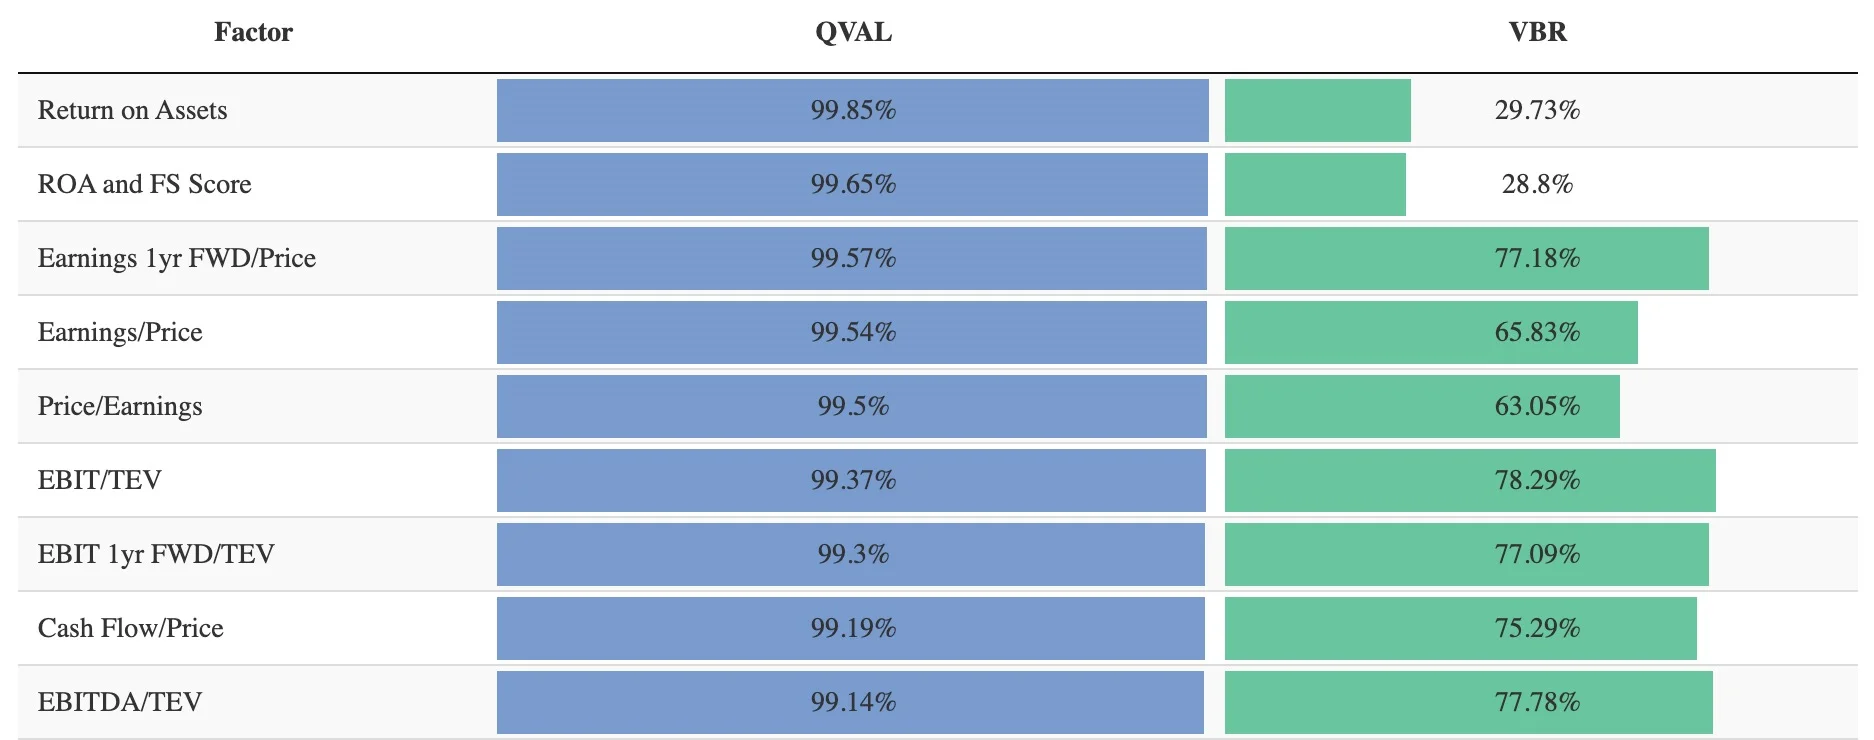
When you compare QVAL ETF with a concentrated 50 positions versus VBR ETF (that has 862 positions) it’s as if the popular Vanguard value fund brought a noodle as its sword to this factor duel.
It just gets crushed across the board head to head in terms of value, quality and profitability metrics.

QVAL ETF Review | Alpha Architect US Quantitative Value ETF Review
Hey guys! Here is the part where I mention I’m a travel blogger, vlogger and content creator! This investing opinion blog post ETF Review is entirely for entertainment purposes only. There could be considerable errors in the data I gathered. This is not financial advice. Do your own due diligence and research. Consult with a financial advisor.

Alpha Architect: Boutique Focused Factor Strategies
Alpha Architect is one of my favourite boutique investing firms.
They do things differently in the sense that their factor focused equity strategies are high conviction.
Armed with evidence based strategies utilizing systematic processes they’ve specialized in Quantitative Value and Momentum equity mandates for both US and International Developed markets.
Let’s take a closer look at their complete roster of funds.
Alpha Architect ETFs Roster
QVAL ETF – U.S. Quantitative Value ETF
IVAL ETF – International Quantitative Value ETF
QMOM ETF – U.S. Quantitative Momentum ETF
IMOM ETF – International Quantitative Momentum ETF
VMOT ETF – Global Value Momentum Trend ETF
BOXX ETF – Alpha Architect 1-3 Month Box ETF
HIDE ETF – High Inflation and Deflation ETF

QVAL ETF Overview, Holdings and Info
The investment case for “Alpha Architect US Quantitative Value ETF” has been laid out succinctly by the folks over at Alpha Architect: (source: fund landing page)
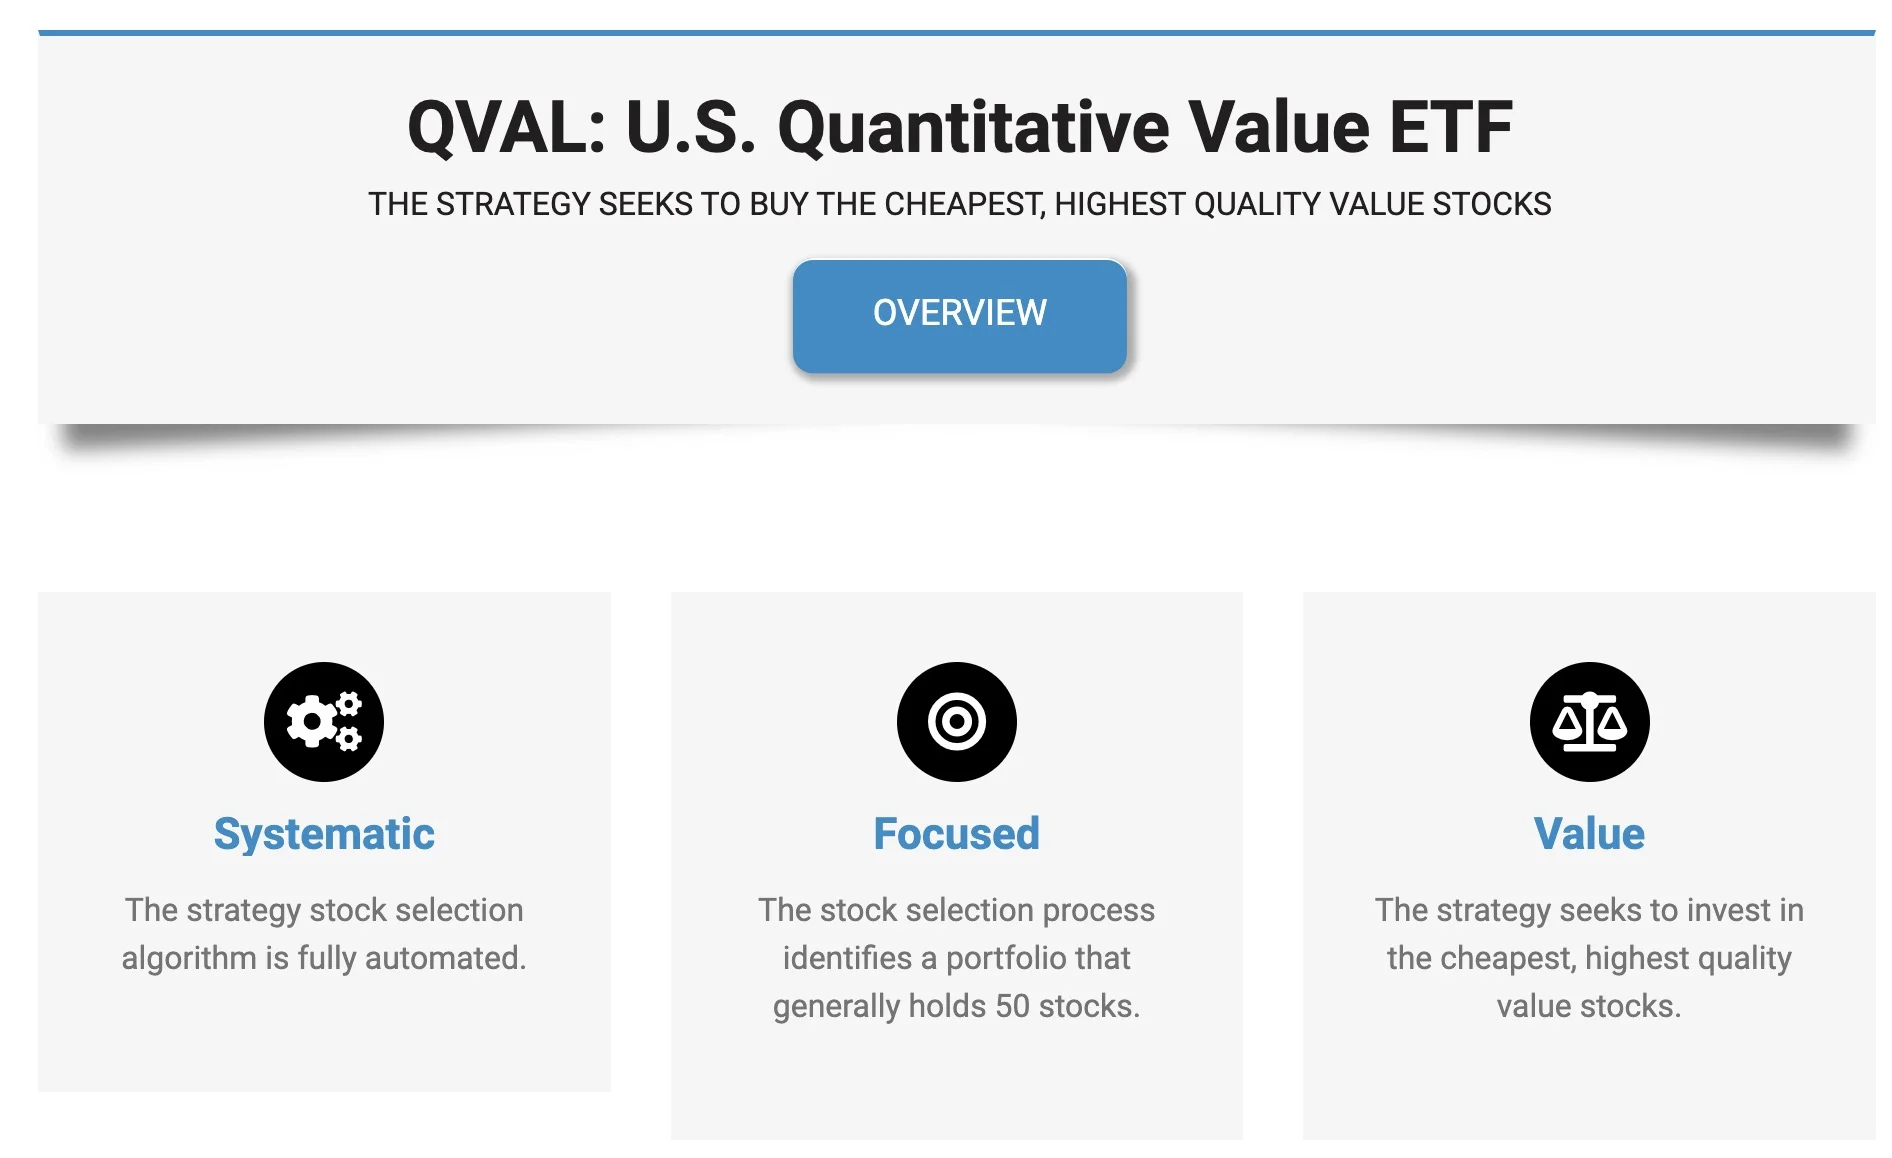
“THE STRATEGY SEEKS TO BUY THE CHEAPEST, HIGHEST QUALITY VALUE STOCKS

QVAL ETF: Security Selection Process
To better understand the process of how the fund operates, let’s turn our attention towards the prospectus where I’ve highlighted what I feel are the most salient parts and summarized the key points at the very bottom. (source: summary prospectus)
“Principal Investment Strategies:
The Fund’s Investment Strategy The Fund is actively managed by Empowered Funds, LLC, the Fund’s investment adviser (the “Adviser”).
The Adviser manages the Fund using proprietary methodology developed by Empirical Finance, LLC, d/b/a Alpha Architect (the Adviser’s parent) and licensed to the Adviser.
The Adviser employs a multi-step, quantitative, rules-based methodology to identify a portfolio of approximately 50 to 100 undervalued U.S. equity securities with the potential for capital appreciation.
A security is considered to be undervalued when it trades at a price below the price at which the Adviser believes it would trade if the market reflected all factors relating to the company’s worth.
The Adviser analyzes an initial universe of liquid stocks that principally trade on a U.S. exchange.
Typically, the minimum market capitalization for the smallest-capitalization stocks in the initial universe is above $1 billion.
The Adviser eliminates from the initial universe illiquid securities, real estate investment trusts, exchange-traded funds (ETFs), American Depositary Receipts, stocks of financial firms, and stocks of companies with less than twelve months of available financial data.
The resulting universe is composed primarily of highly liquid, small-, mid- and large-cap stocks.
The Adviser then employs proprietary screens, which evaluate among other things, the firms’ accounting practices, to eliminate firms that are potential “value traps.”
That is, these screens eliminate firms with, in the Adviser’s view, negative characteristics.
Those could include situations where firms appear to be experiencing financial distress or have manipulated accounting data.
For example, we may seek to avoid firms that have large accruals (i.e., their net income greatly exceeds their free cash flow).
Next, the Adviser employs a value-driven approach to identify the cheapest companies based on a value-centric metric known as the “enterprise multiple,” a firm’s total enterprise value (TEV) divided by a firm’s earnings before interest and taxes (EBIT, often referred to as operating income).
While enterprise multiples are the focus of the Advisor’s approach, the Advisor also incorporates information from other common value metrics, such as book-to-market, cash-flow to price, and earnings to price to identify the cheapest companies.
Last, the Adviser employs an ensemble of quality screens, which consider metrics like current profitability, stability, and recent operational improvements, to select the top 50 to 100 stocks from the cheapest stocks.
The Adviser will reallocate the Fund’s portfolio on a periodic basis (e.g., every two months), but will do so at least quarterly.
The Fund may also invest up to 20% of its assets in cash and cash equivalents, other investment companies, as well as securities and other instruments.”
source: Cboe Global Markets on YouTube

Quantitative Value Investment Strategy Key Points
- Rules-Based Strategy: multi-step, quantitative, rules-based methodology to identify 50 to 100 undervalued U.S. equities
- Investment Universe: Highly liquid US equities consisting of small, mid and large cap stocks
- Exclusions: Illiquid securities, REITs, ETFs, ADRs, Financial Firm Stocks, Companies with less than 12 months of data
- Value Traps: Proprietary screens to eliminate firms experiencing financial distress and/or suspected manipulated accounting data
- Value Driven Approach: Identify the cheapest companies based on a value-centric metric known as the “enterprise multiple”
- Enterprise Multiple: (TEV / EBIT) firm’s total enterprise value (TEV) divided by a firm’s earnings before interest and taxes (EBIT)
- Other Value Considerations: Book-to-market, cash-flow to price, and earnings to price to identify the cheapest companies
- Quality Screen Ensemble: Screens securities for profitability, stability, and recent operational improvements
- Quality Selection: Selects the top 50 to 100 stocks from the cheapest stocks
- Rebalancing Schedule: Quarterly on a periodic basis
Further Reading:
For those interested in learning more about quantitative value investing (and the AA indexes specifically) here are some great resources from Alpha Architect:
- The Quantitative Value Investing Philosophy
- Alpha Architect Quantitative Value Indexes (US, International, and Canada)
- Alpha Architect Long-Only Index Review
- How to Use Our Focused Factor Indexes In Portfolio Construction
QVAL ETF: Holdings
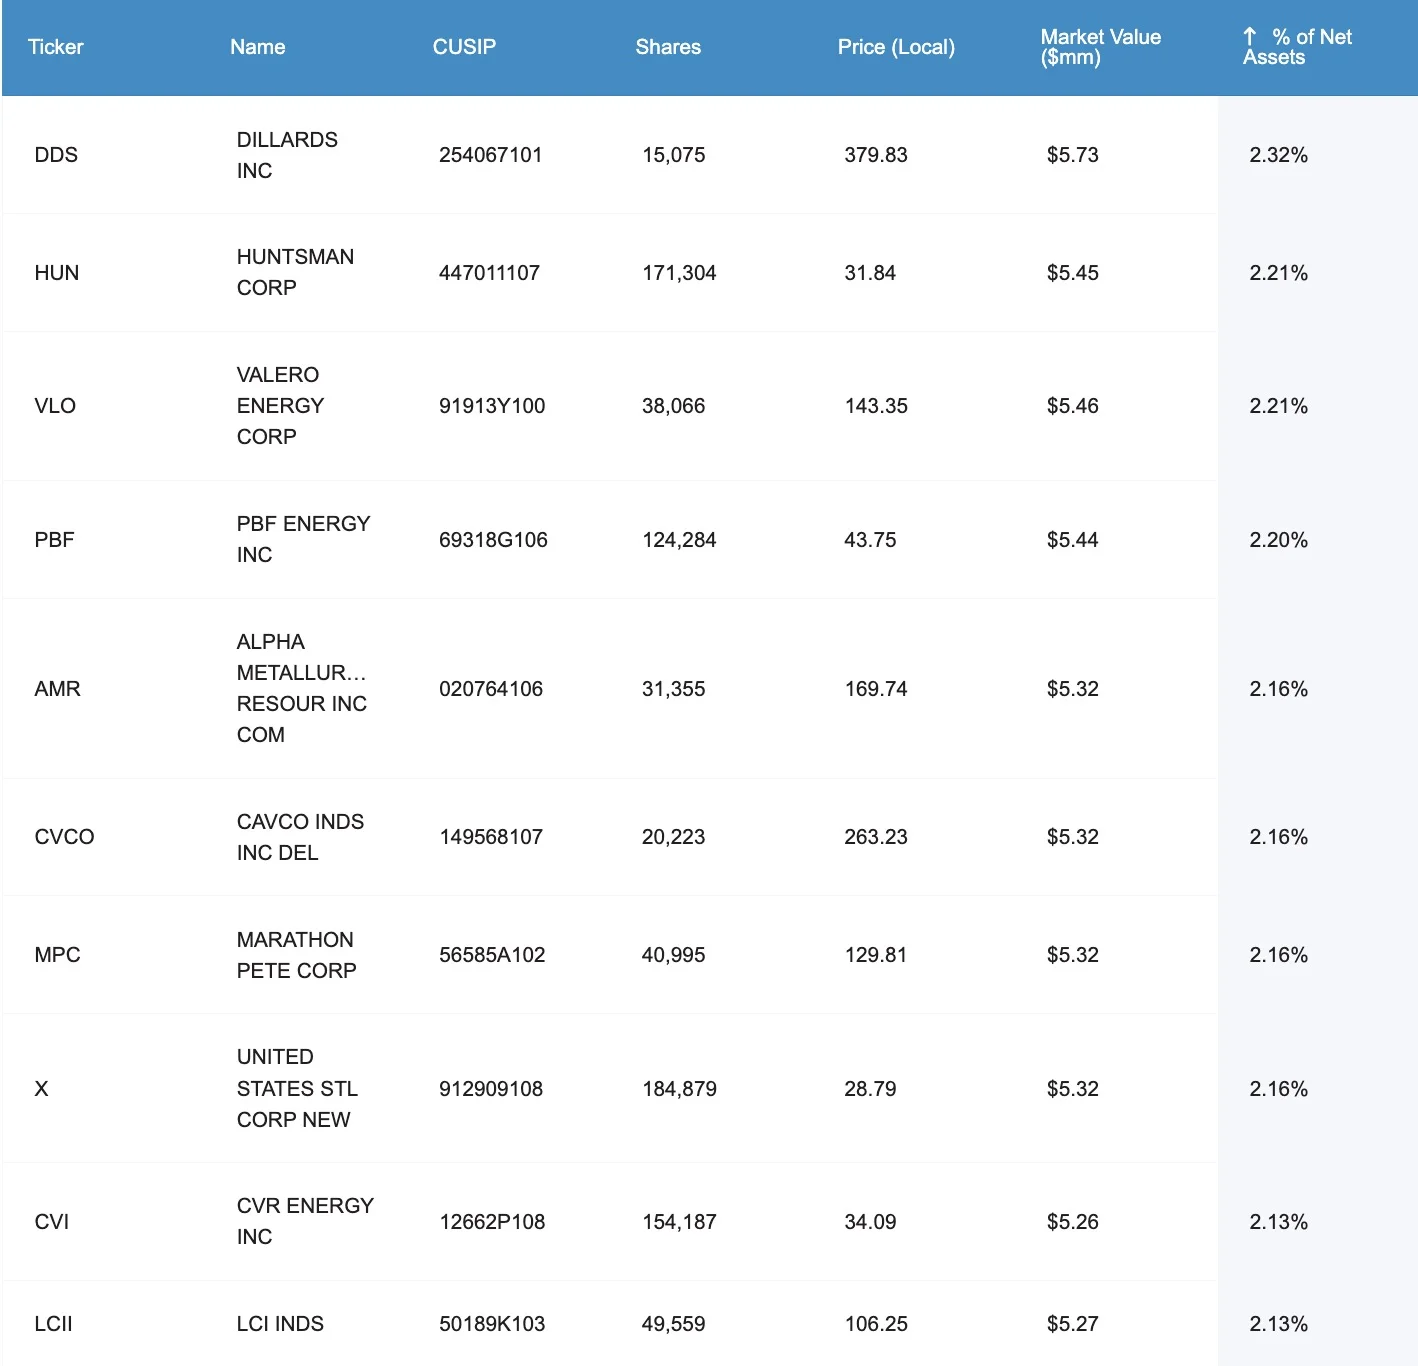
- Dillards Inc – 2.32%
- Huntsman Corp – 2.21%
- Valero Energy Corp – 2.21%
- PBF Energy Inc – 2.20%
- Metallurgy Resource Inc – 2.16%
- Cavco Inds Inc – 2.16%
- Marathon Pete Corp – 2.16%
- United States STL Corp – 2.16%
- CVR Energy Inc – 2.13%
- LCI Inds – 2.13%
The top 10 holdings of QVAL ETF range from 2.32% to 2.13%.
Overall, this high conviction US value fund features 50 positions.
This is in stark contrast to other Value funds from different providers which are often in the high 100s.
QVAL ETF: Sector Exposure
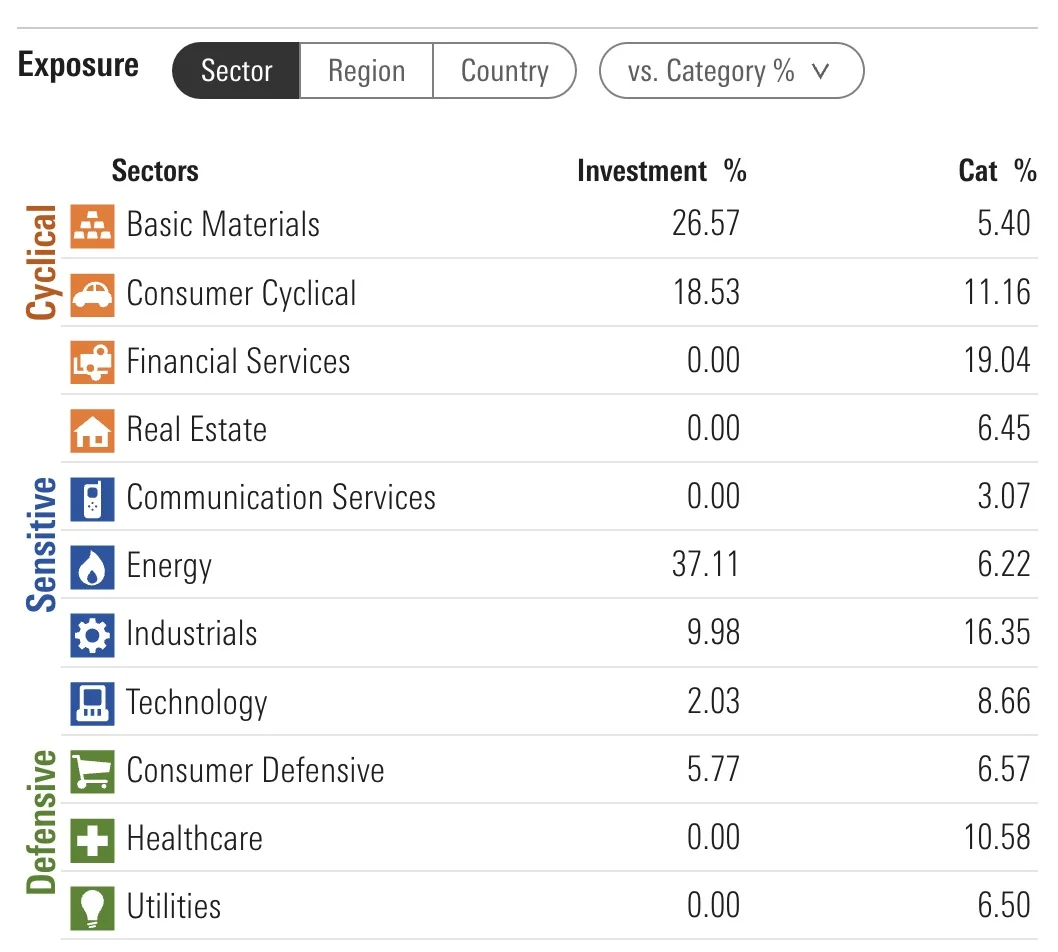
- Basic Materials (26.57 vs 5.40)
- Consumer Cyclical (18.53 vs 11.16)
- Financial Services (0.00 vs 19.04)
- Real Estate (0.00 vs 6.45)
- Communication Services (0.00 vs 3.07)
- Energy (37.11 vs 6.22)
- Industrials (21.50 vs 6.10)
- Technology (2.03 vs 8.66)
- Consumer Defensive (5.77 vs 6.57)
- Healthcare (0.00 vs 10.58)
- Utilities (0.00 vs 6.50)
QVAL ETF offers investors an alternative to typical US mid-cap value sector exposures.
The fund is overweight Basic Materials, Consumer Cyclical, Energy and Industrials versus US mid-cap value category averages.
On the other hand it is underweight Technology and Consumer Defensive while serving up doughnuts with regards to Financial Services, Real Estate, Communication Services, Healthcare and Utilities.
Overall, the fund keys in specifically on Cyclical and Sensitive sectors as opposed to Defensive.
QVAL ETF Info
Ticker: QVAL
Positions: 50
Net Expense Ratio: 0.39
AUM: 246.44 Million
Inception: 10/22/2014
QVAL ETF – Style Measures
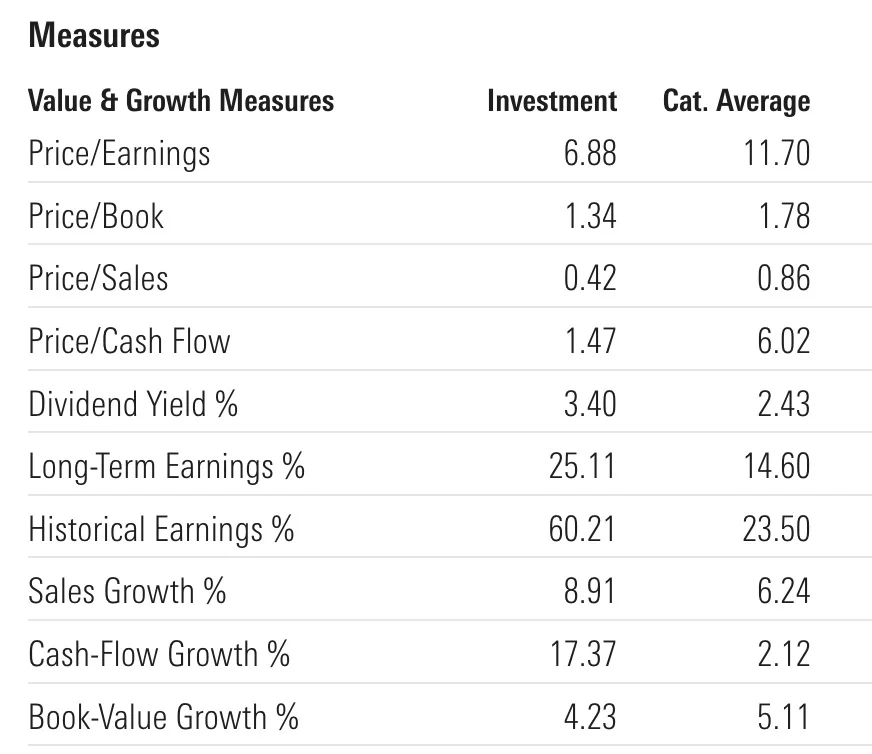
- Price/Earnings (6.88 vs 11.70)
- Price/Book (1.34 vs 1.78)
- Price/Sales (0.42 vs 0.86)
- Price/Cash Flow (1.47 vs 6.02)
- Dividend Yield % (3.40 vs 2.43)
- Long-Term Earnings % (25.11 vs 14.60)
- Historical Earnings % (60.21 vs 23.50)
- Sales Growth % (8.91 vs 6.24)
- Cash-Flow Growth % (17.37 vs 2.12)
- Book-Value Growth % (4.23 vs 5.11)
Alpha Architect US Quantitative Value ETF blows up its mid-cap value competition across the board as far as P/E, P/B, P/S and P/CF are concerned where lower figures are better.
It continues its route with regards to Dividend Yield, Long-Term Earnings %, Historical Earnings % and Cash-Flow Growth % where higher scores are ideal.
QVAL ETF – Stock Style Box
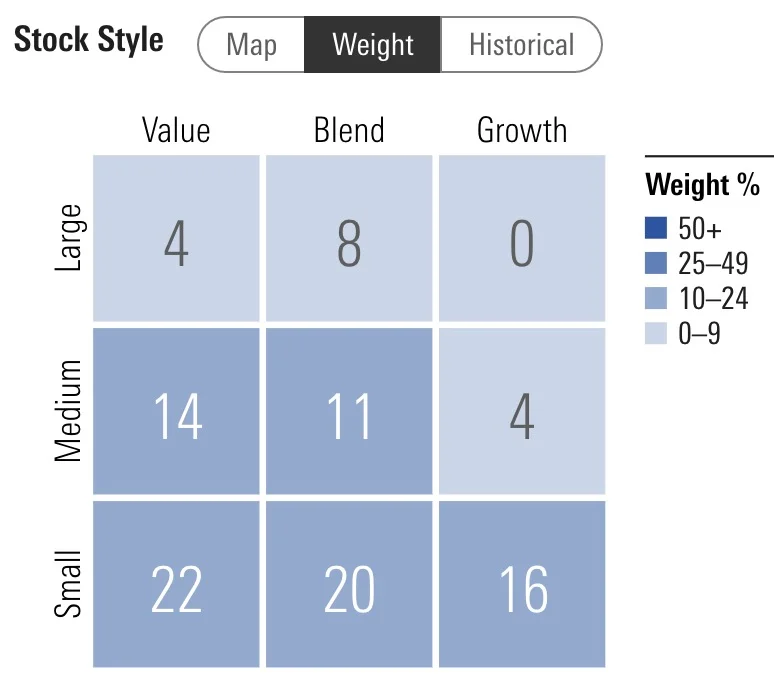
Alpha Architect U.S. Quantitative Value ETF offers investors attractive small-cap and mid-cap exposure with a bit of large-cap coverage thrown in for good measure.
The fund commits just 12% of its resources to large cap equities with 29% mid-cap exposure and 58% reserved towards small-caps.
It tilts 41% towards value while offering 39% blend and 20% growth.
QVAL ETF – Factor Profile
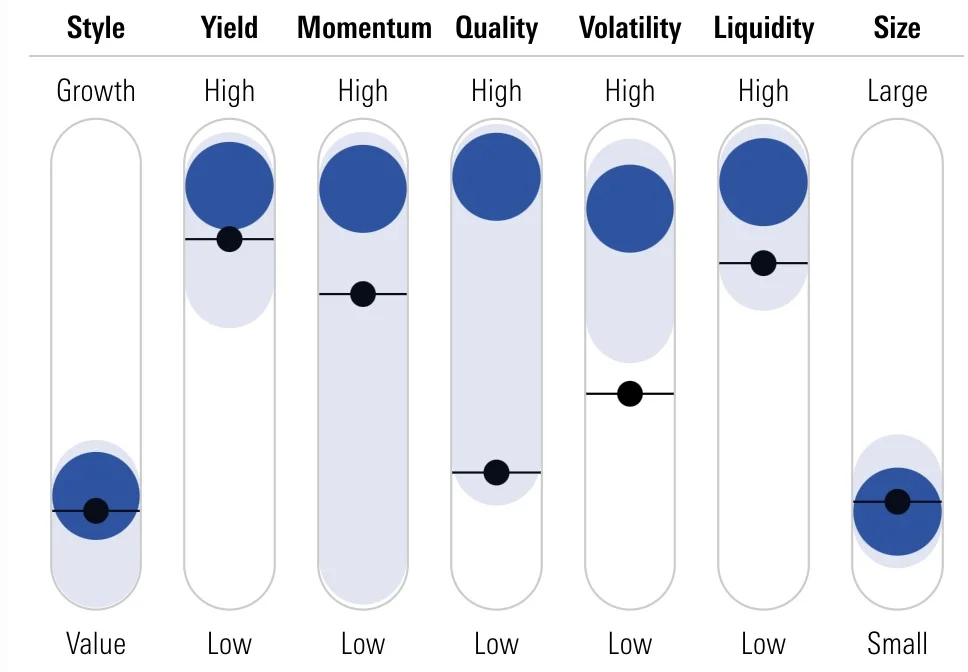
QVAL ETF is a robust beast multi-factor force to be reckoned with pulling hard on the levers of value, yield, momentum, quality and size.
It’s highly liquid and volatile too!
Nothing tepid or timid about it.
The middle ground is for the other vanilla funds.
QVAL ETF – Factor Analysis: 36 Month Regressions
Let’s explore QVAL ETF in further detail by checking out its factor analysis from several different sources on Portfolio Visualizer.
Since the fund is in a league of its own without benchmarks, we’ll just plug in Vanguard Small-Cap Value Fund and the S&P 500 for comparison’s sake.
QVAL ETF vs VBR ETF vs SPY ETF
Fama-French Research Factors
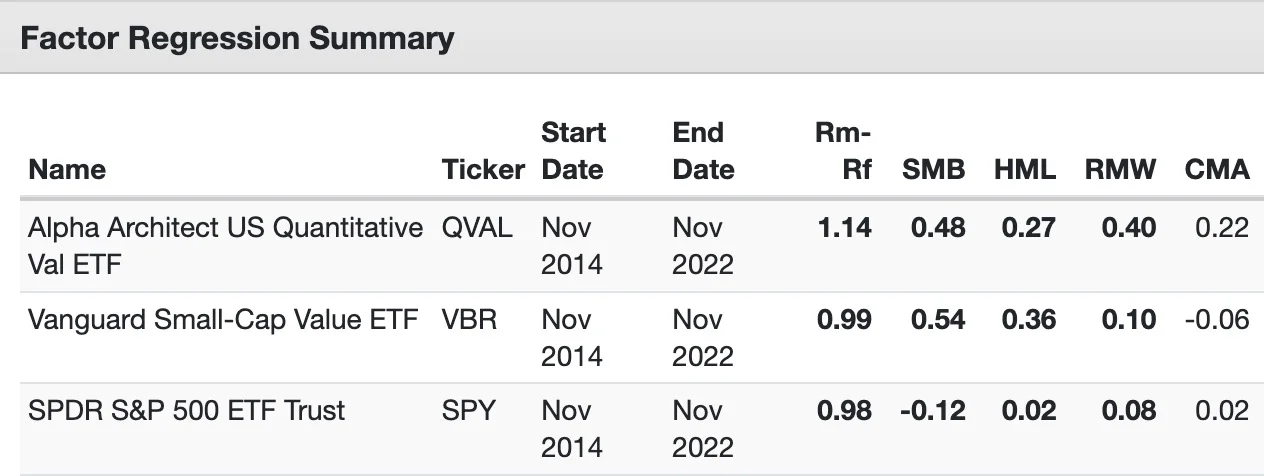
Size (SMB): QVAL (0.48) / VBR (0.54) / SPY (-0.12)
Value (HML): QVAL (0.27) / VBR (0.36) / SPY (0.02)
Profitability (RMW): QVAL (0.40) / VBR (0.10) / SPY (0.08)
Investment (CMA): QVAL (0.22) / VBR (-0.06) / SPY (0.02)
QVAL with its focused factors crushes both VBR ETF and SPY ETF especially when it comes to profitability (RMW) and investment (CMA).
AQR Research Factors
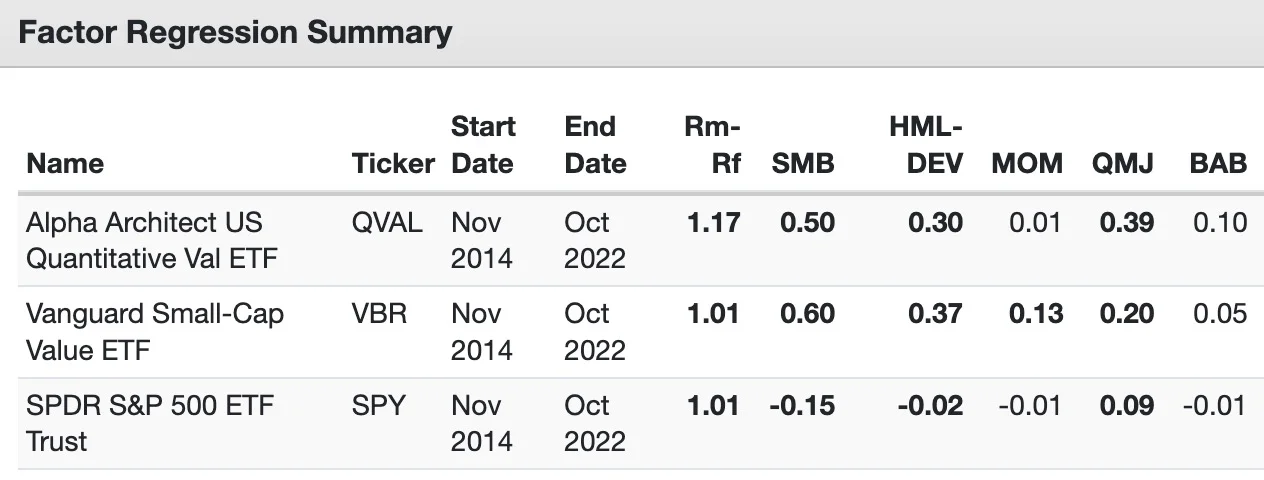
Size (SMB): QVAL (0.50) / VBR (0.60) / SPY (-0.15)
Value (HML): QVAL (0.37) / VBR (0.37) / SPY (-0.02)
Momentum (MOM): QVAL (0.01) / VBR (0.13) / SPY (-0.01)
Quality (QMJ): QVAL (0.39) / VBR (0.20) / SPY (0.09)
Bet Against Beta (BAB): QVAL (0.10) /VBR (0.05) / SPY (-0.01)
QVAL ETF keeps on proving that it can offer great exposure to size, value and quality.
Its quality scores really set it apart here (with AQR) and the above regression from Fama-French.
Alpha Architect Research Factors
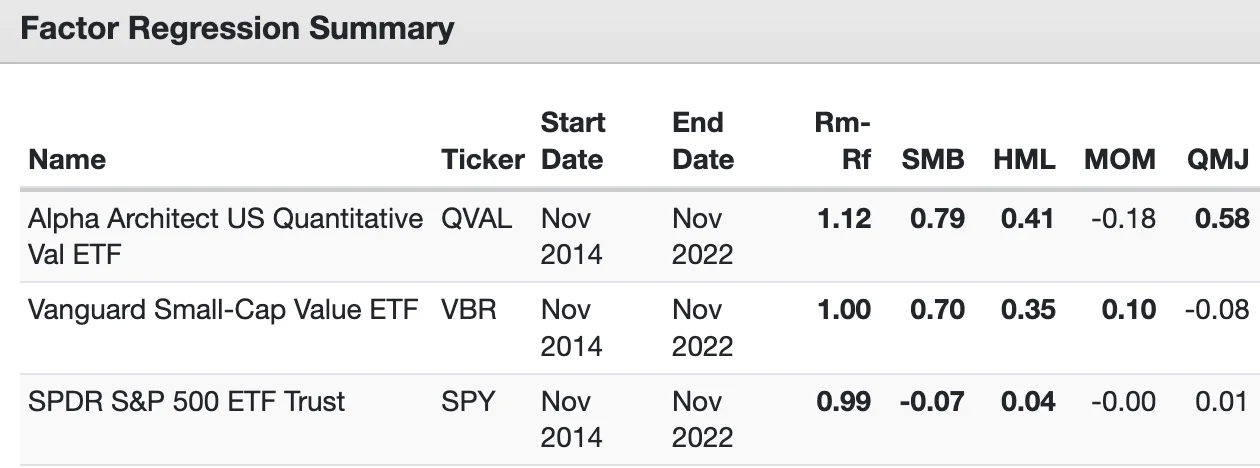
Size (SMB): QVAL (0.79) / VBR (0.70) / SPY (-0.07)
Value (HML): QVAL (0.41) / VBR (0.35) / SPY (0.04)
Momentum (MOM): QVAL (-0.18) / VBR (0.10) / SPY (0.00)
Quality (QMJ): QVAL (0.58) / VBR (-0.08) / SPY (-0.01)
The icing on the cake is QVAL ETF dominating once again in the quality department while also offering excellent size and value exposure.
QVAL ETF Performance
QVAL got off to a rocky start in 2015 during what was a challenging year for markets.
Since 2016 it has offered investors solid returns over the past 7 years with a 7.07% CAGR.
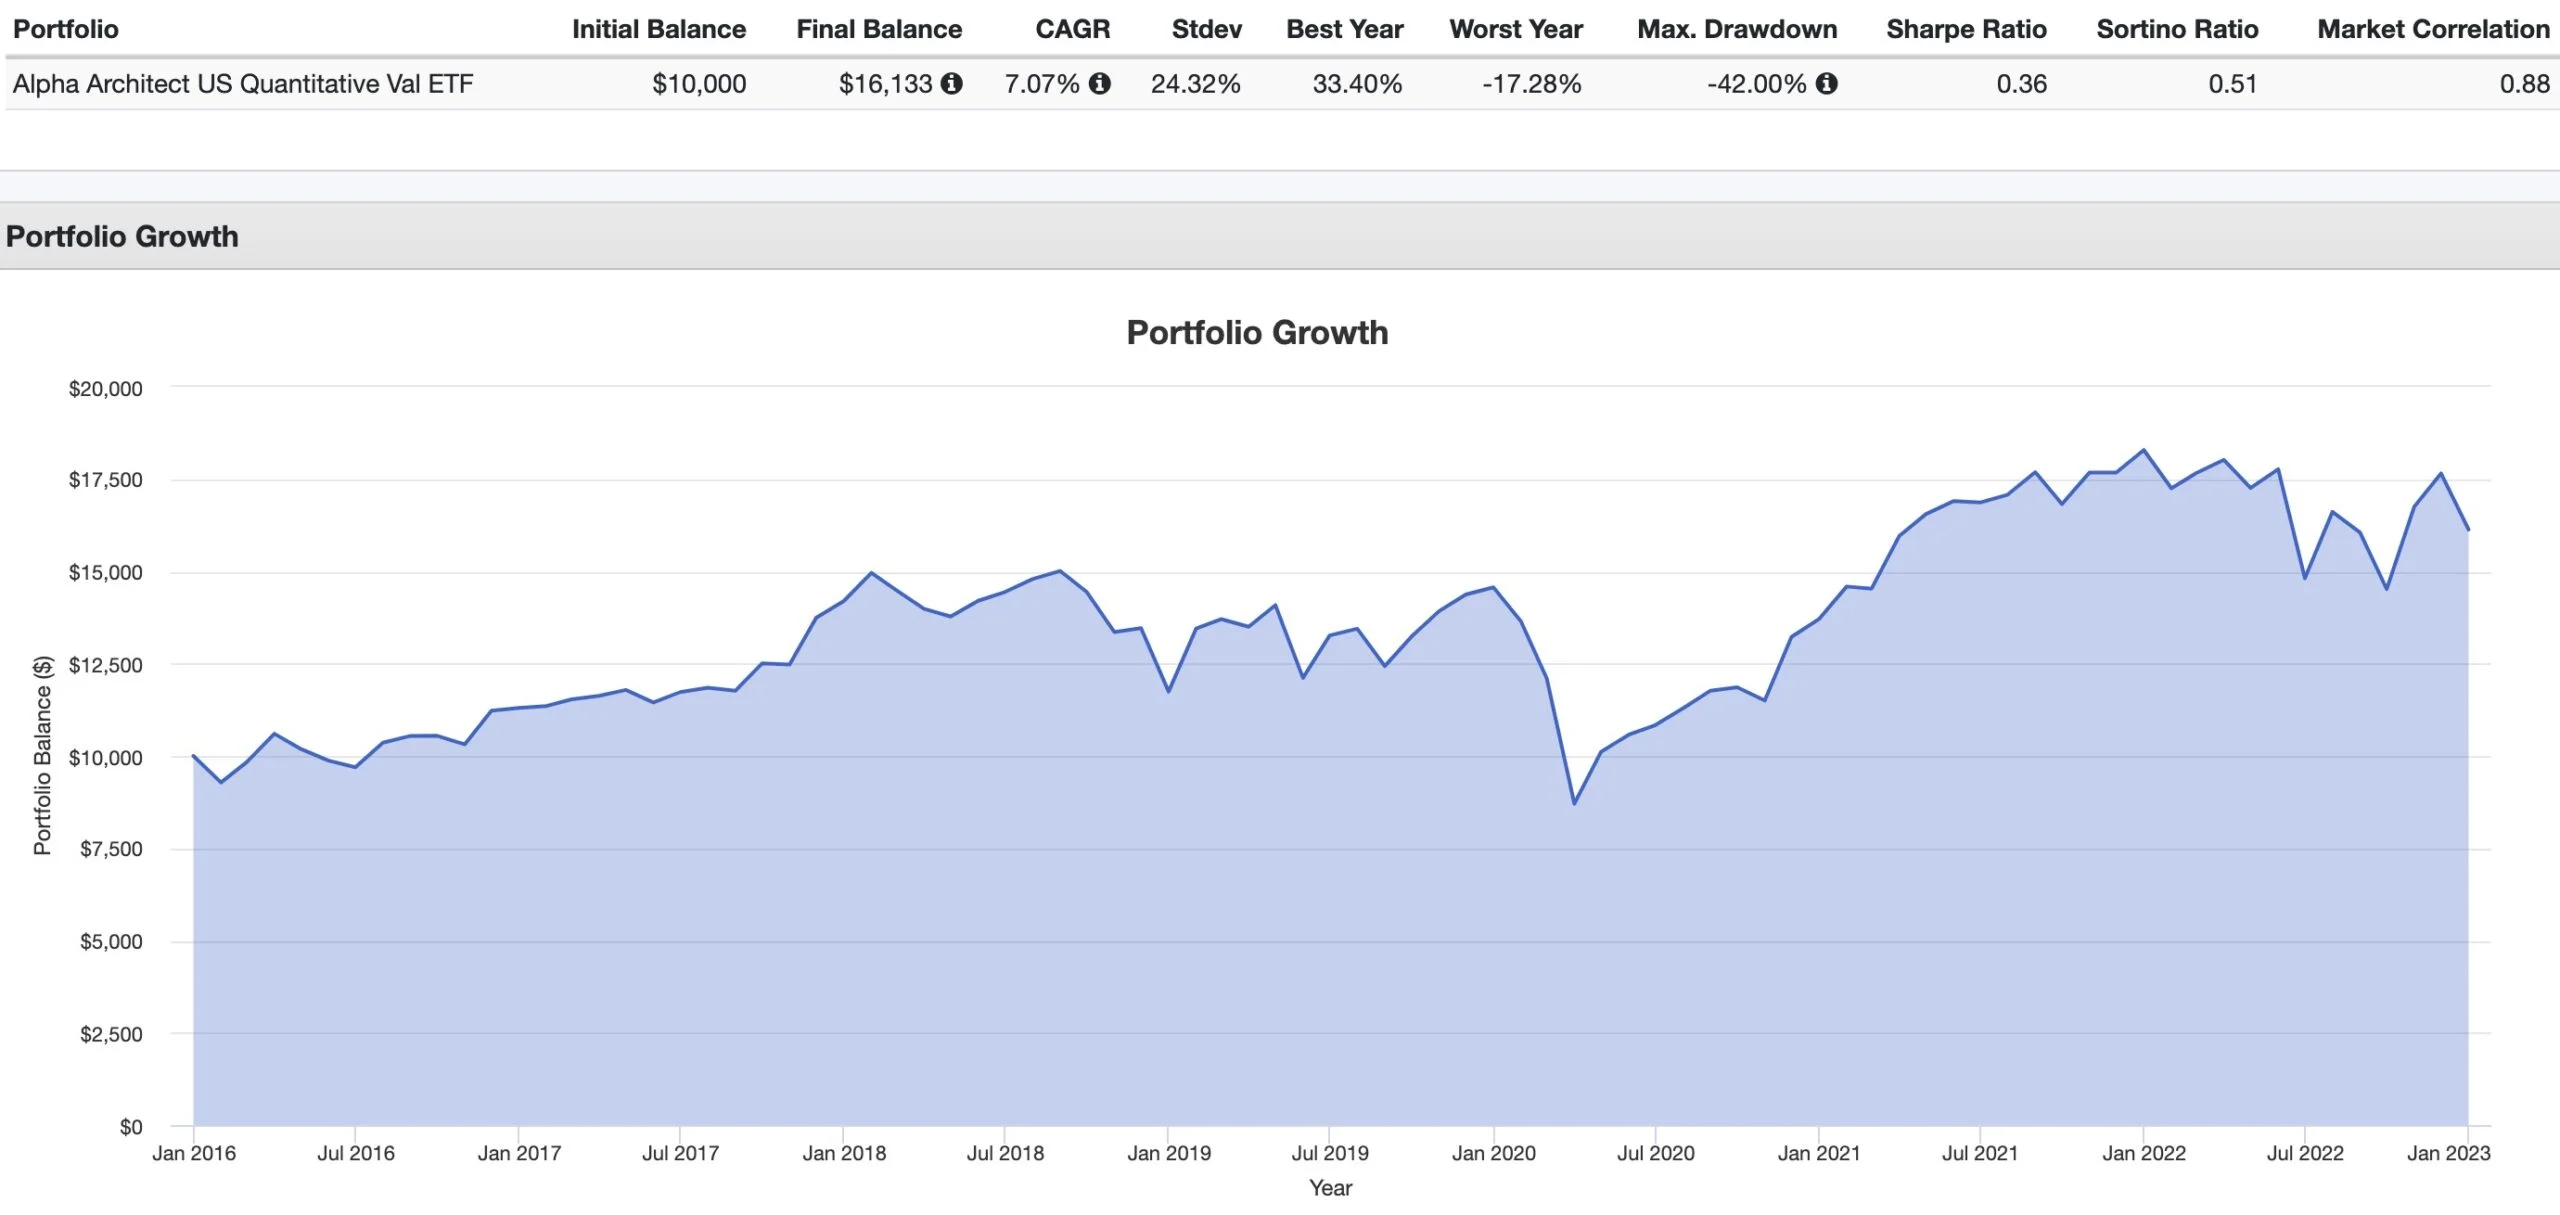
It has spent most of its existence in economic regimes that have favoured large cap growth US stocks.
The pendulum seems to finally be swinging in favour of value where profitable stocks with reasonable valuations are relatively outperforming.
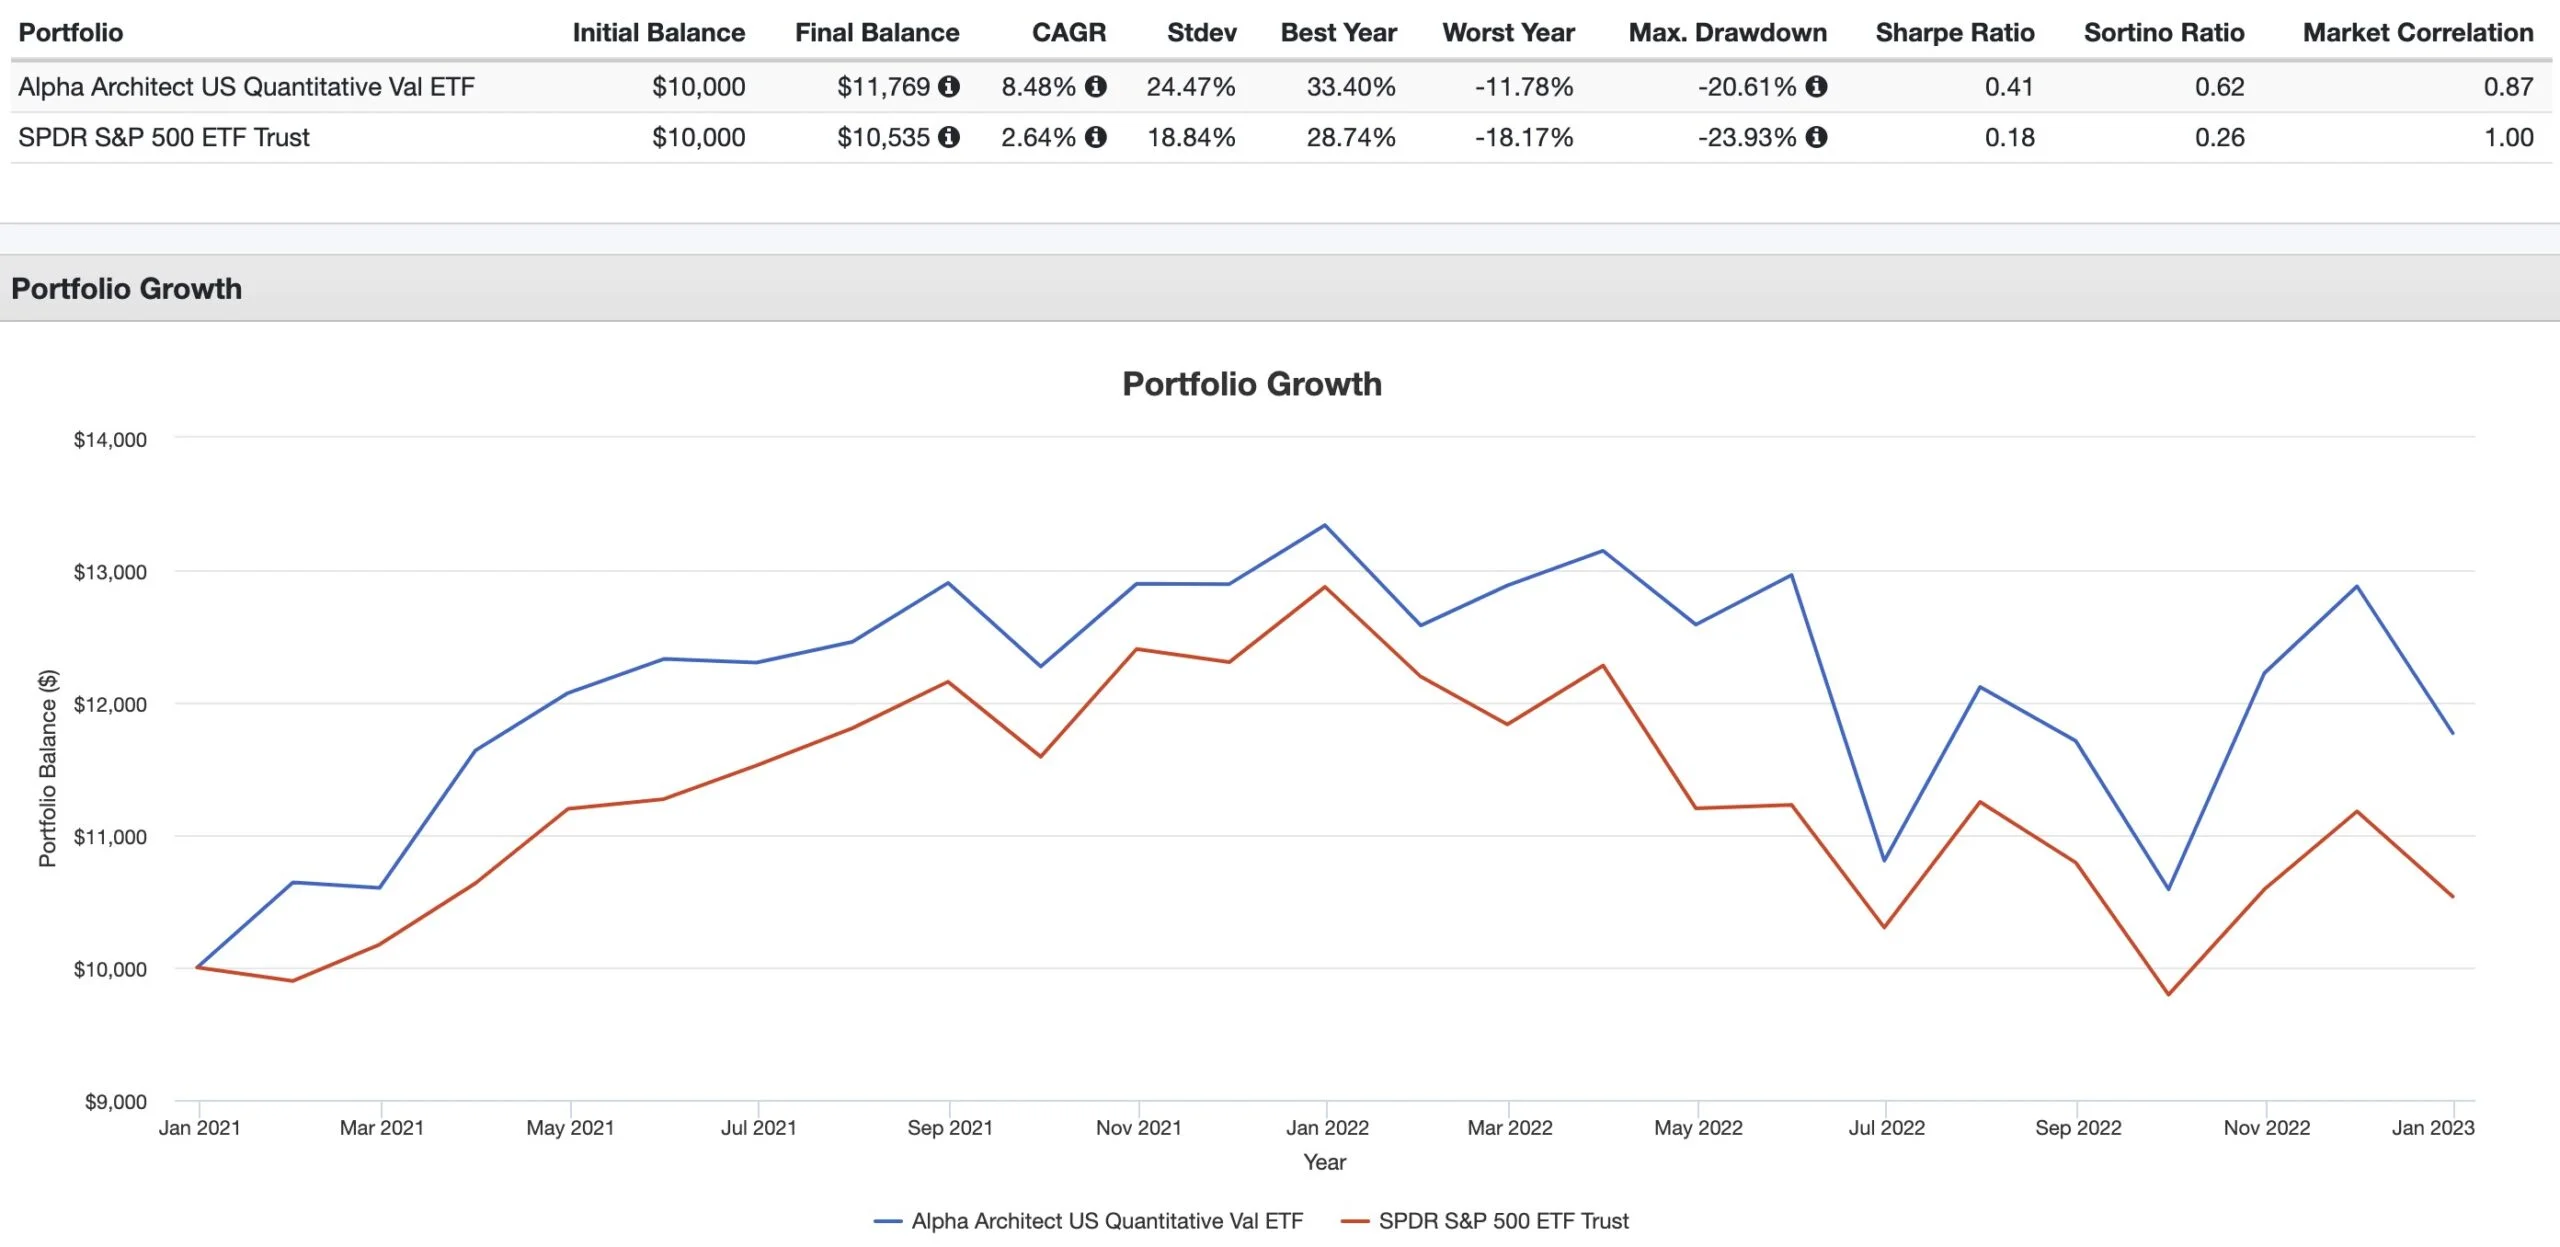
CAGR: QVAL (8.48%) / SPY (2.68%)
STDEV: QVAL (24.47%) / SPY (18.84%)
MAX DRAWDOWN: QVAL (-20.61%) / SPY (-23.93%)
SHARPE RATIO: QVAL (0.41) / SPY (0.18)
SORTINO RATIO: QVAL (0.62) / SPY (0.26)
MARKET CORRELATION: QVAL (0.87) / SPY (1.00)
It’ll be interesting to see how things unfold in the future but it seems like Alpha Architect’s QVAL ETF has its best days ahead.

QVAL ETF Pros and Cons
Let’s move on to examine the potential pros and cons of QVAL ETF.
QVAL Pros
- High conviction 50 position value plus quality strategy that doesn’t settle for any junk sandwiched in between
- Differentiates itself from the other milquetoast US value funds that are clogged by 100s or 1000s of positions
- Outstanding multi-factor powerhouse currently offering investors considerable exposure to size, value, quality, momentum and yield
- A versatile puzzle piece that has the potential to be a core equity holding or a satellite diversifier depending upon the conviction level of the investor
- Tremendous quality and profitability scores for all three 36 month factor regressions (Fama-French, AQR and Alpha Architect)
- Transparent security selection with a 5 step process of screening US stocks, eliminating value traps, selecting the top 100 based on value metrics and choosing the top 50 after sifting things through an ensemble quality filter for a focused equal weight exposure
- Extremely attractive measures versus US mid-cap value category averages in terms of P/E, P/B, P/S, P/CF and yield
- An evidence based systematic approach to security selection that removes human error and judgement from the equation
- Very reasonable management fee
- Chance to support a boutique fund provider that provides a unique strategy and skillset
QVAL Cons
- Volatility levels that are higher than funds that feature more positions (investors need to be aware of that)
- Tracking error with regards to other value funds and especially with major market indexes such as the S&P 500 (you’ve got something different in your portfolio so expect different results)

QVAL ETF Potential Model Portfolio Ideas
These asset allocation ideas and model portfolios presented herein are purely for entertainment purposes only. This is NOT investment advice. These models are hypothetical and are intended to provide general information about potential ways to organize a portfolio based on theoretical scenarios and assumptions. They do not take into account the investment objectives, financial situation/goals, risk tolerance and/or specific needs of any particular individual.
There are so many potential options for fitting QVAL ETF into a portfolio at large!
I’ve settled on a globally and strategically diversified four fund portfolio:
20% QVAL – Alpha Architect US Quantitative Value
20% IVAL – Alpha Architect International Quantitative Value ETF
50% BLNDX – Standpoint Multi-Asset Fund
10% FSMSX – FS Multi-Strategy Alternatives Fund
I’ve decided to pair QVAL ETF with its international partner in crime IVAL ETF.
Together they’re the primary equity strategy of this portfolio but we’ve also got capital efficient BLNDX contributing 25% global equities and 50% managed futures to the mix.
Finally, we round things out with alternative multi-strategy and multi-asset class FSMSX.
Let’s send things over to Portfolio Visualizer to see how this QVAL and Friends Portfolio compared with a boring balanced MCW Equities/Bonds fund!
QVAL ETF and Friends Portfolio versus AOM Balanced Portfolio
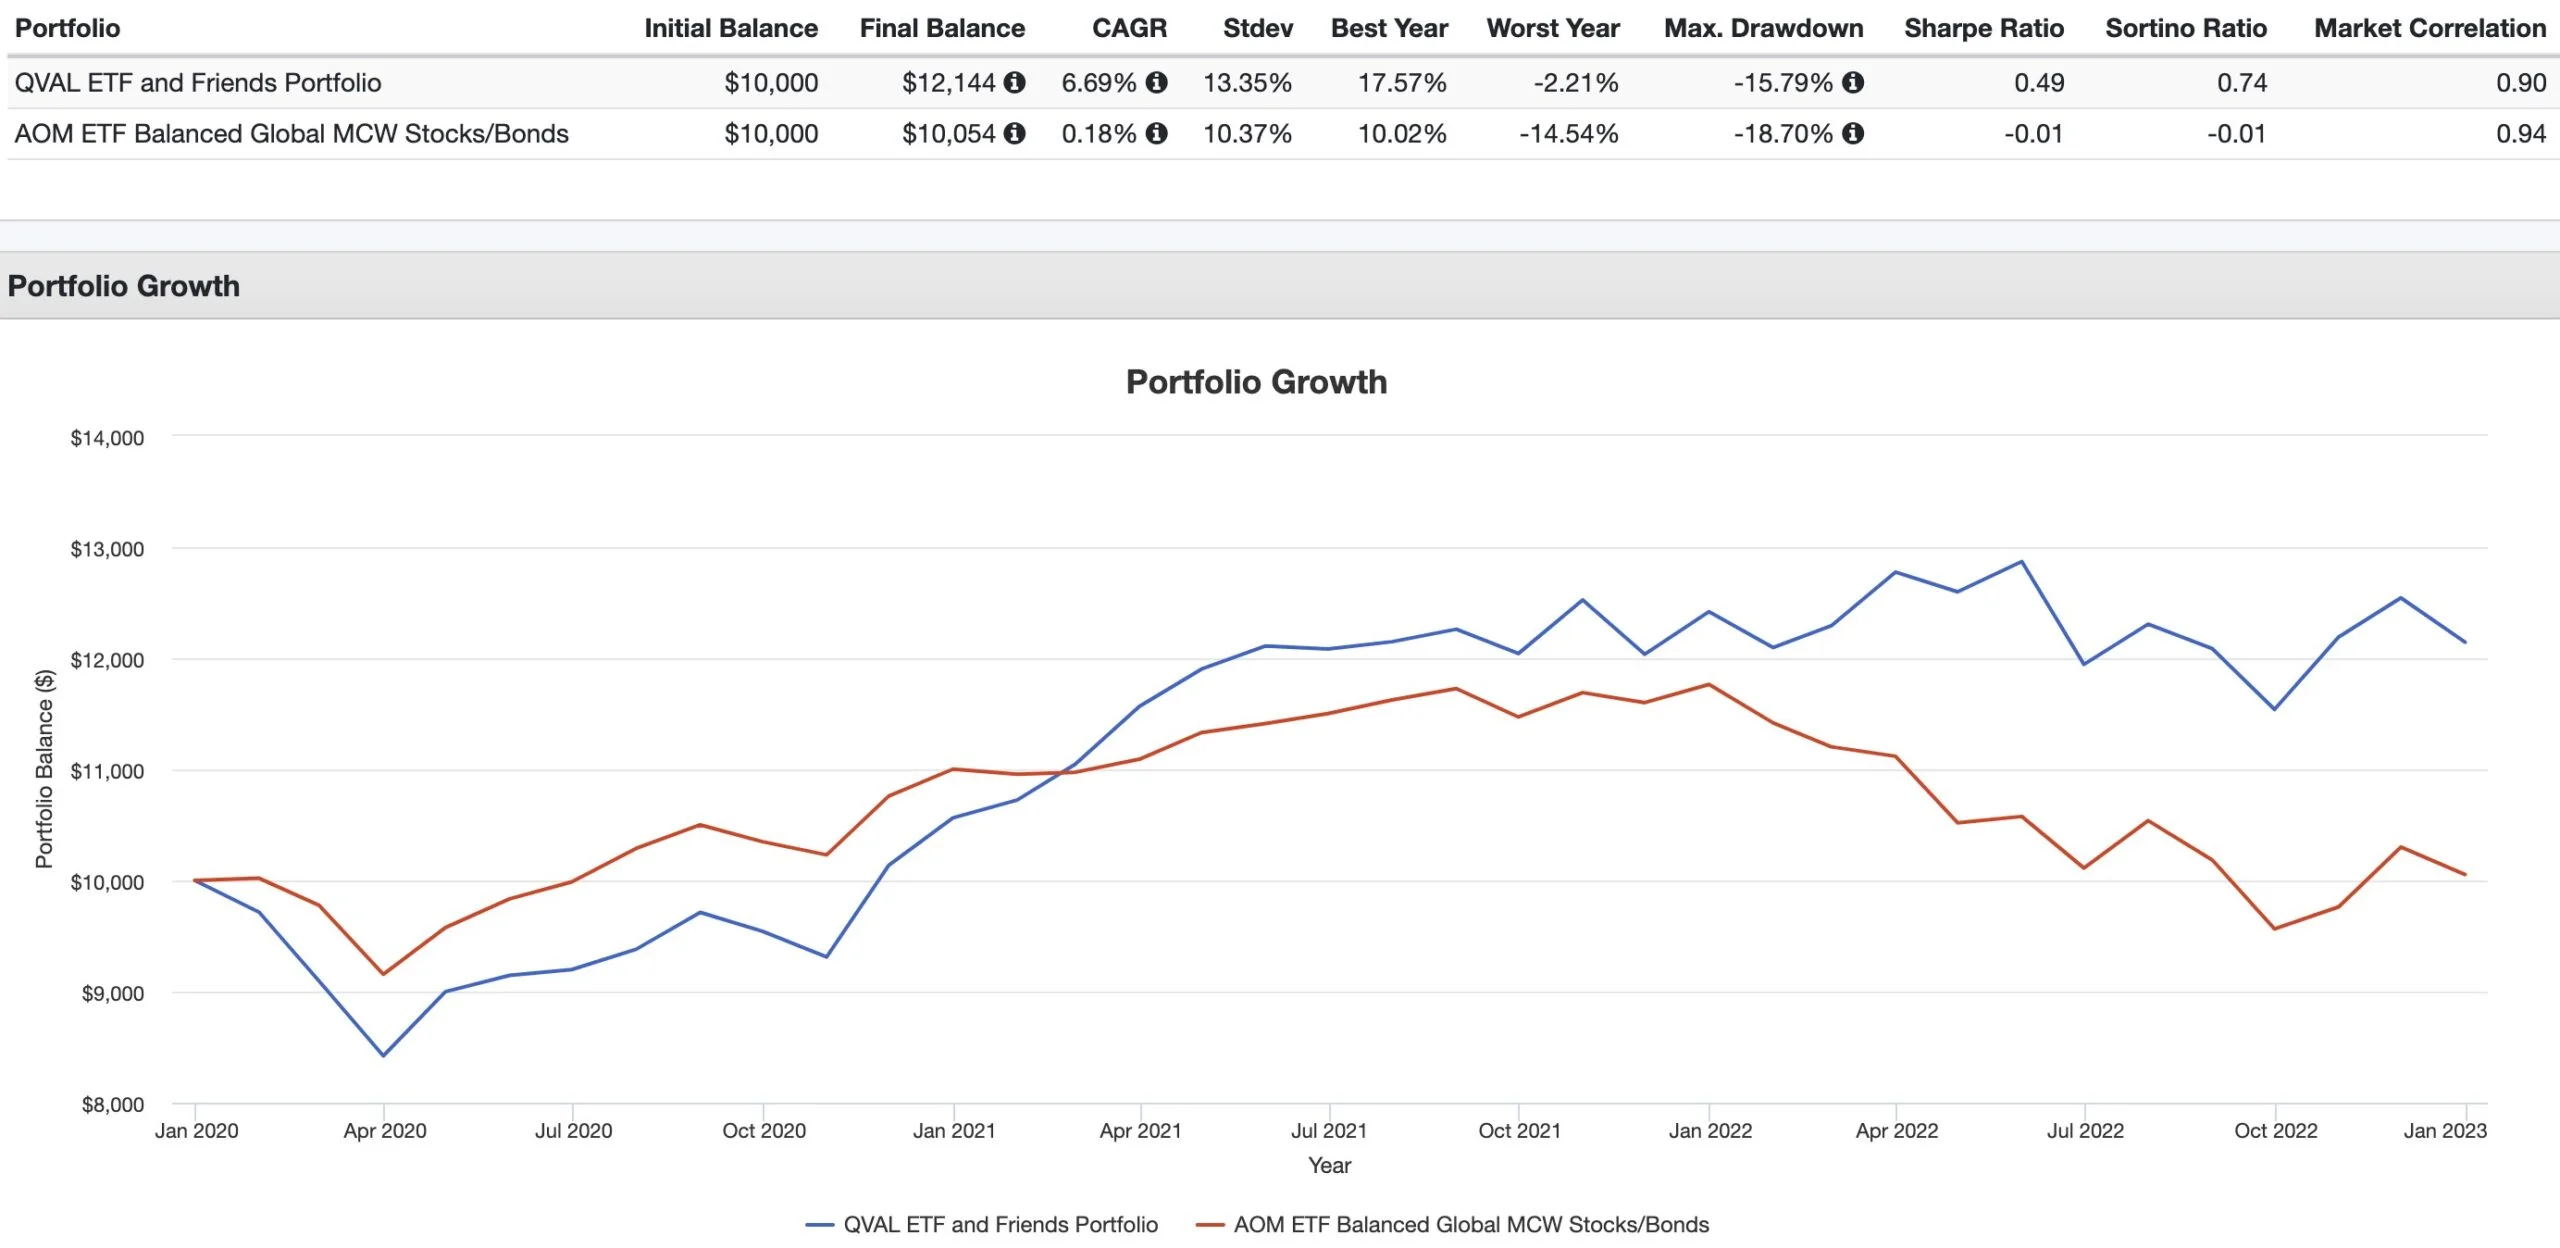
CAGR: 6.69% vs 0.18%
RISK: 13.35% vs 10.37%
BEST YEAR: 17.57% vs 10.02%
WORST YEAR: -2.21% vs -14.54%
MAX DRAWDOWN: -15.79% vs -18.70%
SHARPE RATIO: 0.49 vs -0.01
SORTINO RATIO: 0.74 vs -0.01
MARKET CORRELATION: 0.90 vs 0.94
It’s a sad state of affairs for yawn inducing AOM ETF versus our QVAL and Friends Portfolio.
This globally and strategically diversified portfolio outperforms (CAGR: 6.69%) and provides better risk adjusted rates of returns (Sharpe: 0.49).
Better luck next time AOM ETF!
source: The Rational Reminder Podcast on YouTube

Nomadic Samuel Final Thoughts
It’s easy to see why Alpha Architect US Quantitative Value ETF is one of the most popular factor focused funds for passionate investors of all backgrounds.
It delivers on its dual mandate of providing a high conviction strategy of screening for the best value and quality stocks within the realm of its available universe.
Investors ought to remember though that we’re promised a strategy and nothing else at the end of the day.
Results come to those who are patient enough to stick with it through thick and thin.
If you’re going to jump in when things are in vogue and bail when it is out of season you’ll likely struggle to stay the course with a fund like this.
High conviction strategies require even higher levels of patience.
Given the current spread in valuations between growth and value stocks, I feel as though QVAL ETF has its best days ahead of it.
But I’m not in the predictions business.
At this point in the review I’m more interested in what you’ve got to say.
Are you a factor investor?
What do you think of QVAL ETF?
Please let me know in the comments below.
That’s all I’ve got for today.
Ciao for now.
Important Information
Comprehensive Investment Disclaimer:
All content provided on this website (including but not limited to portfolio ideas, fund analyses, investment strategies, commentary on market conditions, and discussions regarding leverage) is strictly for educational, informational, and illustrative purposes only. The information does not constitute financial, investment, tax, accounting, or legal advice. Opinions, strategies, and ideas presented herein represent personal perspectives, are based on independent research and publicly available information, and do not necessarily reflect the views or official positions of any third-party organizations, institutions, or affiliates.
Investing in financial markets inherently carries substantial risks, including but not limited to market volatility, economic uncertainties, geopolitical developments, and liquidity risks. You must be fully aware that there is always the potential for partial or total loss of your principal investment. Additionally, the use of leverage or leveraged financial products significantly increases risk exposure by amplifying both potential gains and potential losses, and thus is not appropriate or advisable for all investors. Using leverage may result in losing more than your initial invested capital, incurring margin calls, experiencing substantial interest costs, or suffering severe financial distress.
Past performance indicators, including historical data, backtesting results, and hypothetical scenarios, should never be viewed as guarantees or reliable predictions of future performance. Any examples provided are purely hypothetical and intended only for illustration purposes. Performance benchmarks, such as market indexes mentioned on this site, are theoretical and are not directly investable. While diligent efforts are made to provide accurate and current information, “Picture Perfect Portfolios” does not warrant, represent, or guarantee the accuracy, completeness, or timeliness of any information provided. Errors, inaccuracies, or outdated information may exist.
Users of this website are strongly encouraged to independently verify all information, conduct comprehensive research and due diligence, and engage with qualified financial, investment, tax, or legal professionals before making any investment or financial decisions. The responsibility for making informed investment decisions rests entirely with the individual. “Picture Perfect Portfolios” explicitly disclaims all liability for any direct, indirect, incidental, special, consequential, or other losses or damages incurred, financial or otherwise, arising out of reliance upon, or use of, any content or information presented on this website.
By accessing, reading, and utilizing the content on this website, you expressly acknowledge, understand, accept, and agree to abide by these terms and conditions. Please consult the full and detailed disclaimer available elsewhere on this website for further clarification and additional important disclosures. Read the complete disclaimer here.


