Having traveled abroad to over 75 different countries, I’ve experienced a wide spectrum of things.
One of them being really bad coffee.
The type that is often low quality instant or comes in a tea bag and upon first sip causes you to pucker your lips and scrunch your face as the repulsiveness of it all takes a firm grip.
Retrograde coffee.
That’s what I like to call it.
In order to down it, and that’s if you even enjoy black coffee, you’ve gotta find some kind of smoother.
Whether that be sugar, cream, milk, honey, coffee-mate or whatever else is available, it’s just not going down the hatch otherwise.

Well, the fund we’re reviewing today is the ultimate return smoother.
BTAL ETF.
Known in full as AGFiQ US Market Neutral Anti-Beta Fund.
Add a little bit to whatever portfolio mix you’ve currently assembled (capital efficient, all equity or 60/40) and your risk (standard deviation), maximum drawdown, worst year, Sharpe Ratio and Sortino Ratio are all almost guaranteed to improve.
Well, that almost sounds too good to be true!
So what’s the catch?
Lower returns.
It typically lowers the overall returns of your portfolio.
Hence, it begs the question of whether or not you’re trying to improve the risk adjusted rate of returns of your portfolio or simply going for the maximum possible performance?
Let’s explore a couple of scenarios to better illustrate the tradeoff.
100% SPY vs 90% SPY + 10% BTAL vs 80% SPY + 20% BTAL Long-Term Returns
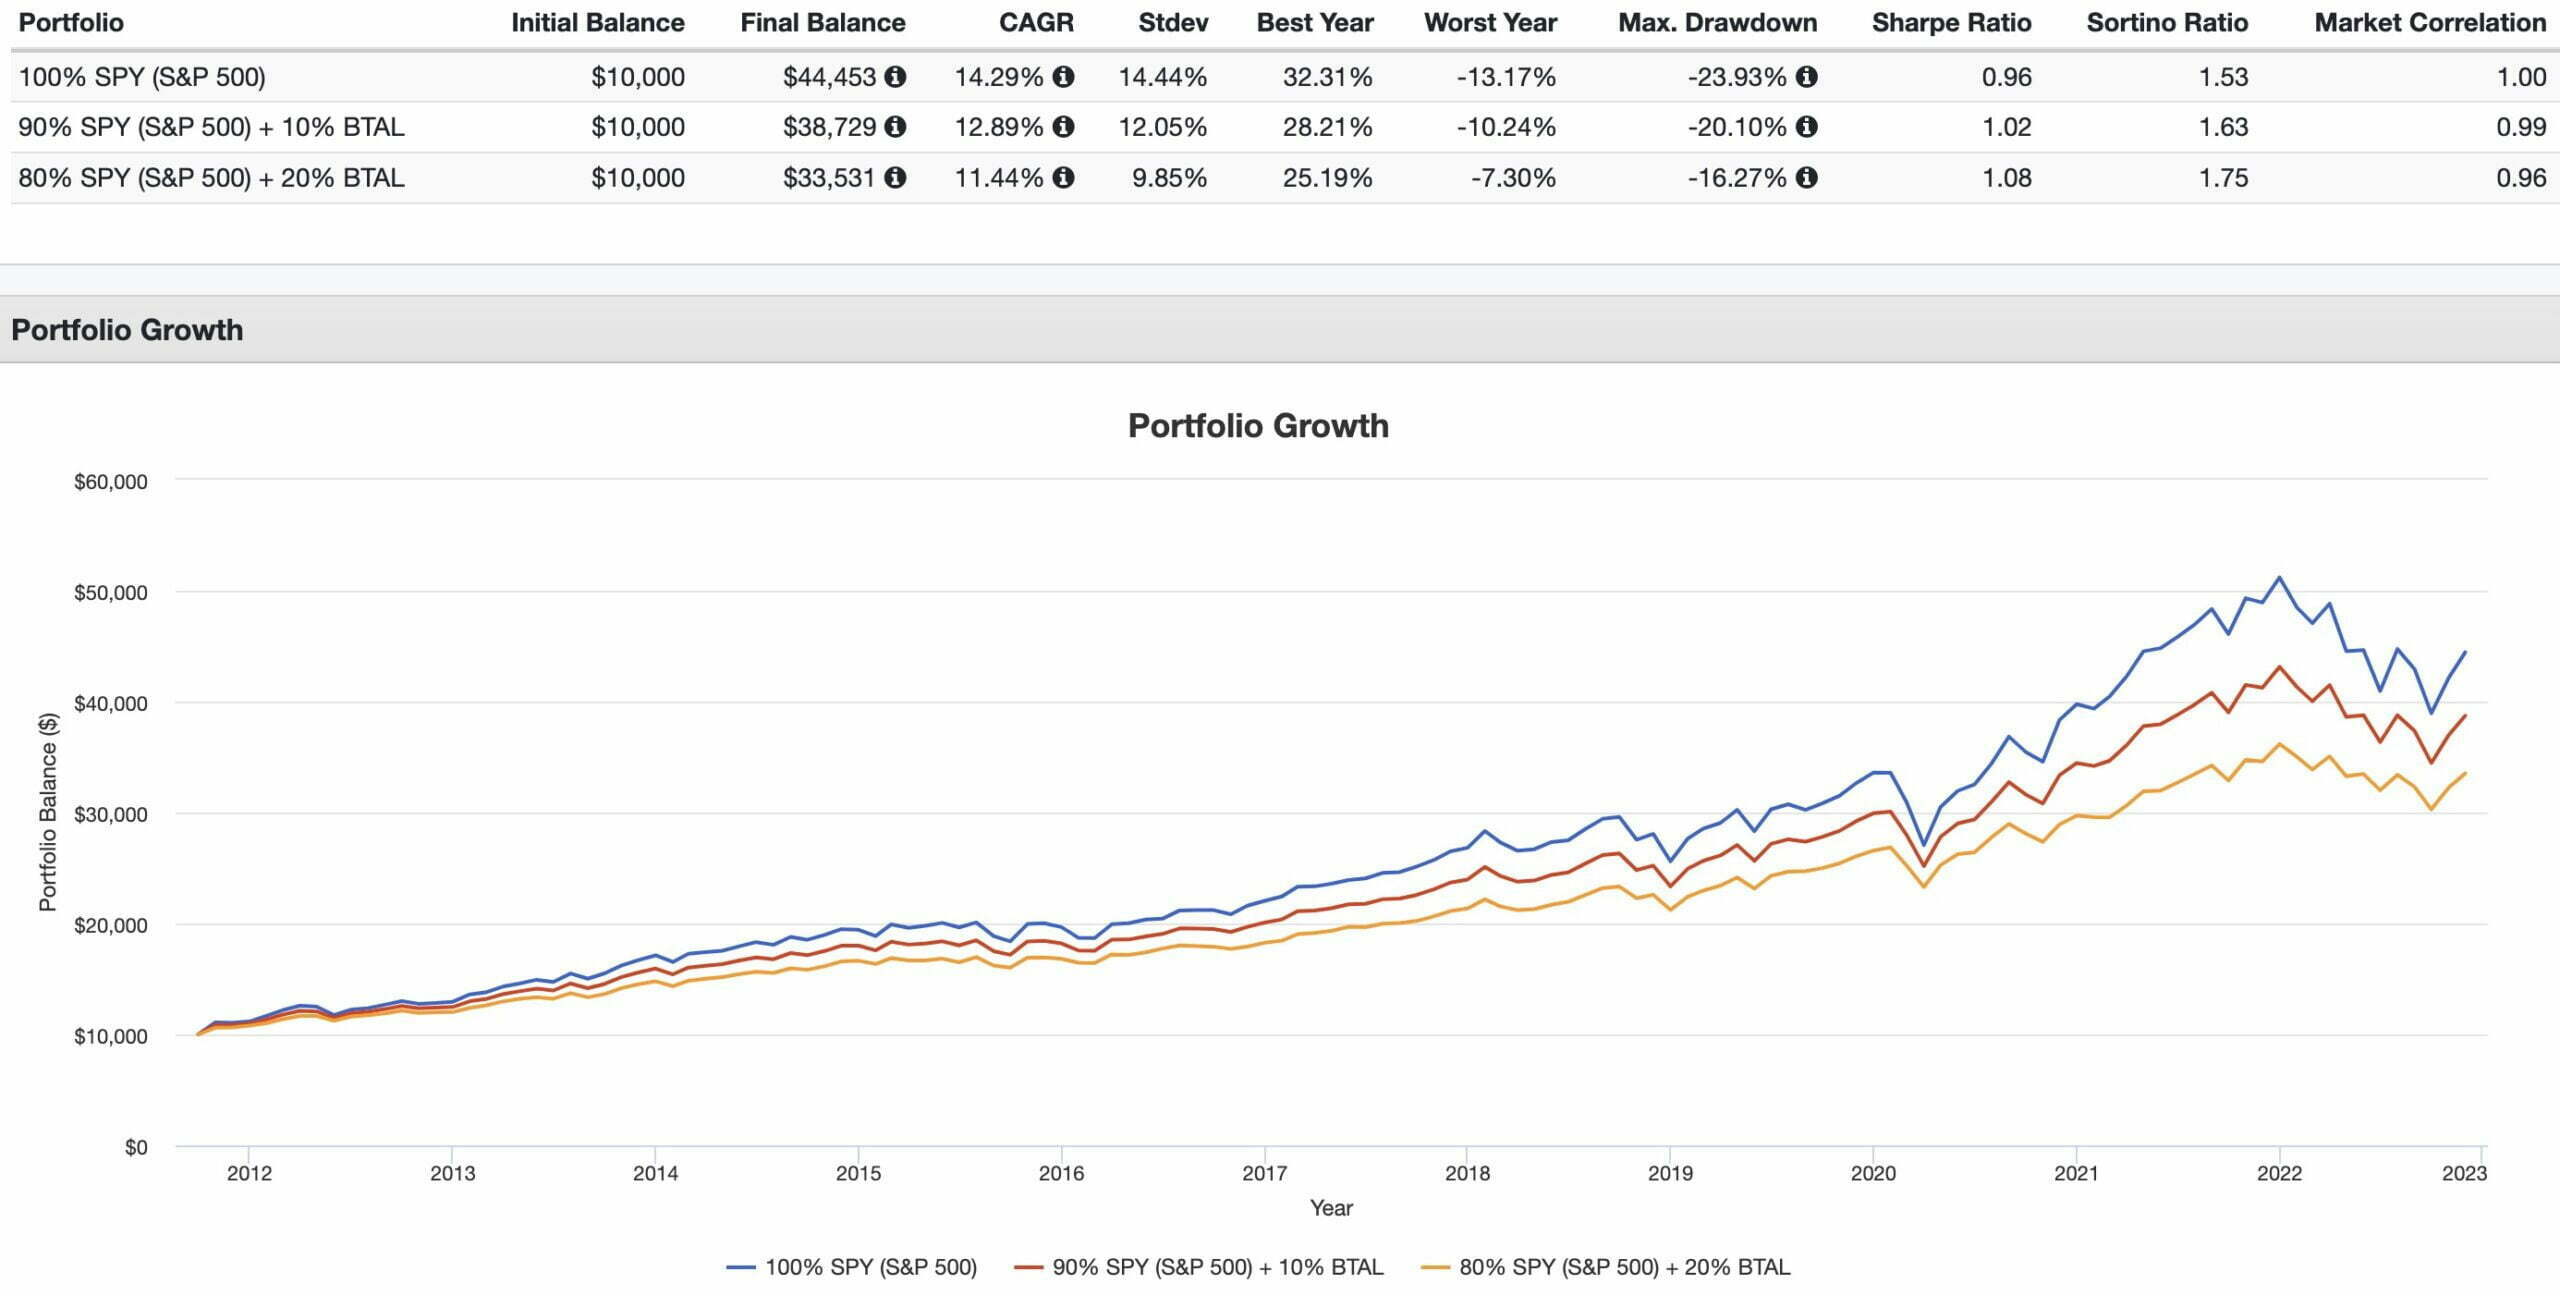
SPY ETF on its own has delivered incredible long-term returns of 14.29% with 14.44% risk since the inception of BTAL ETF.
However, just adding 10% BTAL to the mix means that the S&P 500 shaves 239 basis points of standard deviation from the equation while sacrificing 140 basis points of returns.
Its worst year improves from -13.17% to -10.24% while its maximum drawdown goes from -23.93% to -20.10%.
Moreover, there is a discernible upgrade in risk adjusted rates of returns with regards to Sharpe Ratio (0.96 to 1.02) and Sortino Ratio (1.53 to 1.63).
Add 20% of BTAL ETF and everything previously mentioned (aside from returns) improves some more.
Let’s zoom in a bit to see when BTAL ETF is at its defensive best.

100% SPY vs 90% SPY + 10% BTAL vs 80% SPY + 20% BTAL 2022 Returns
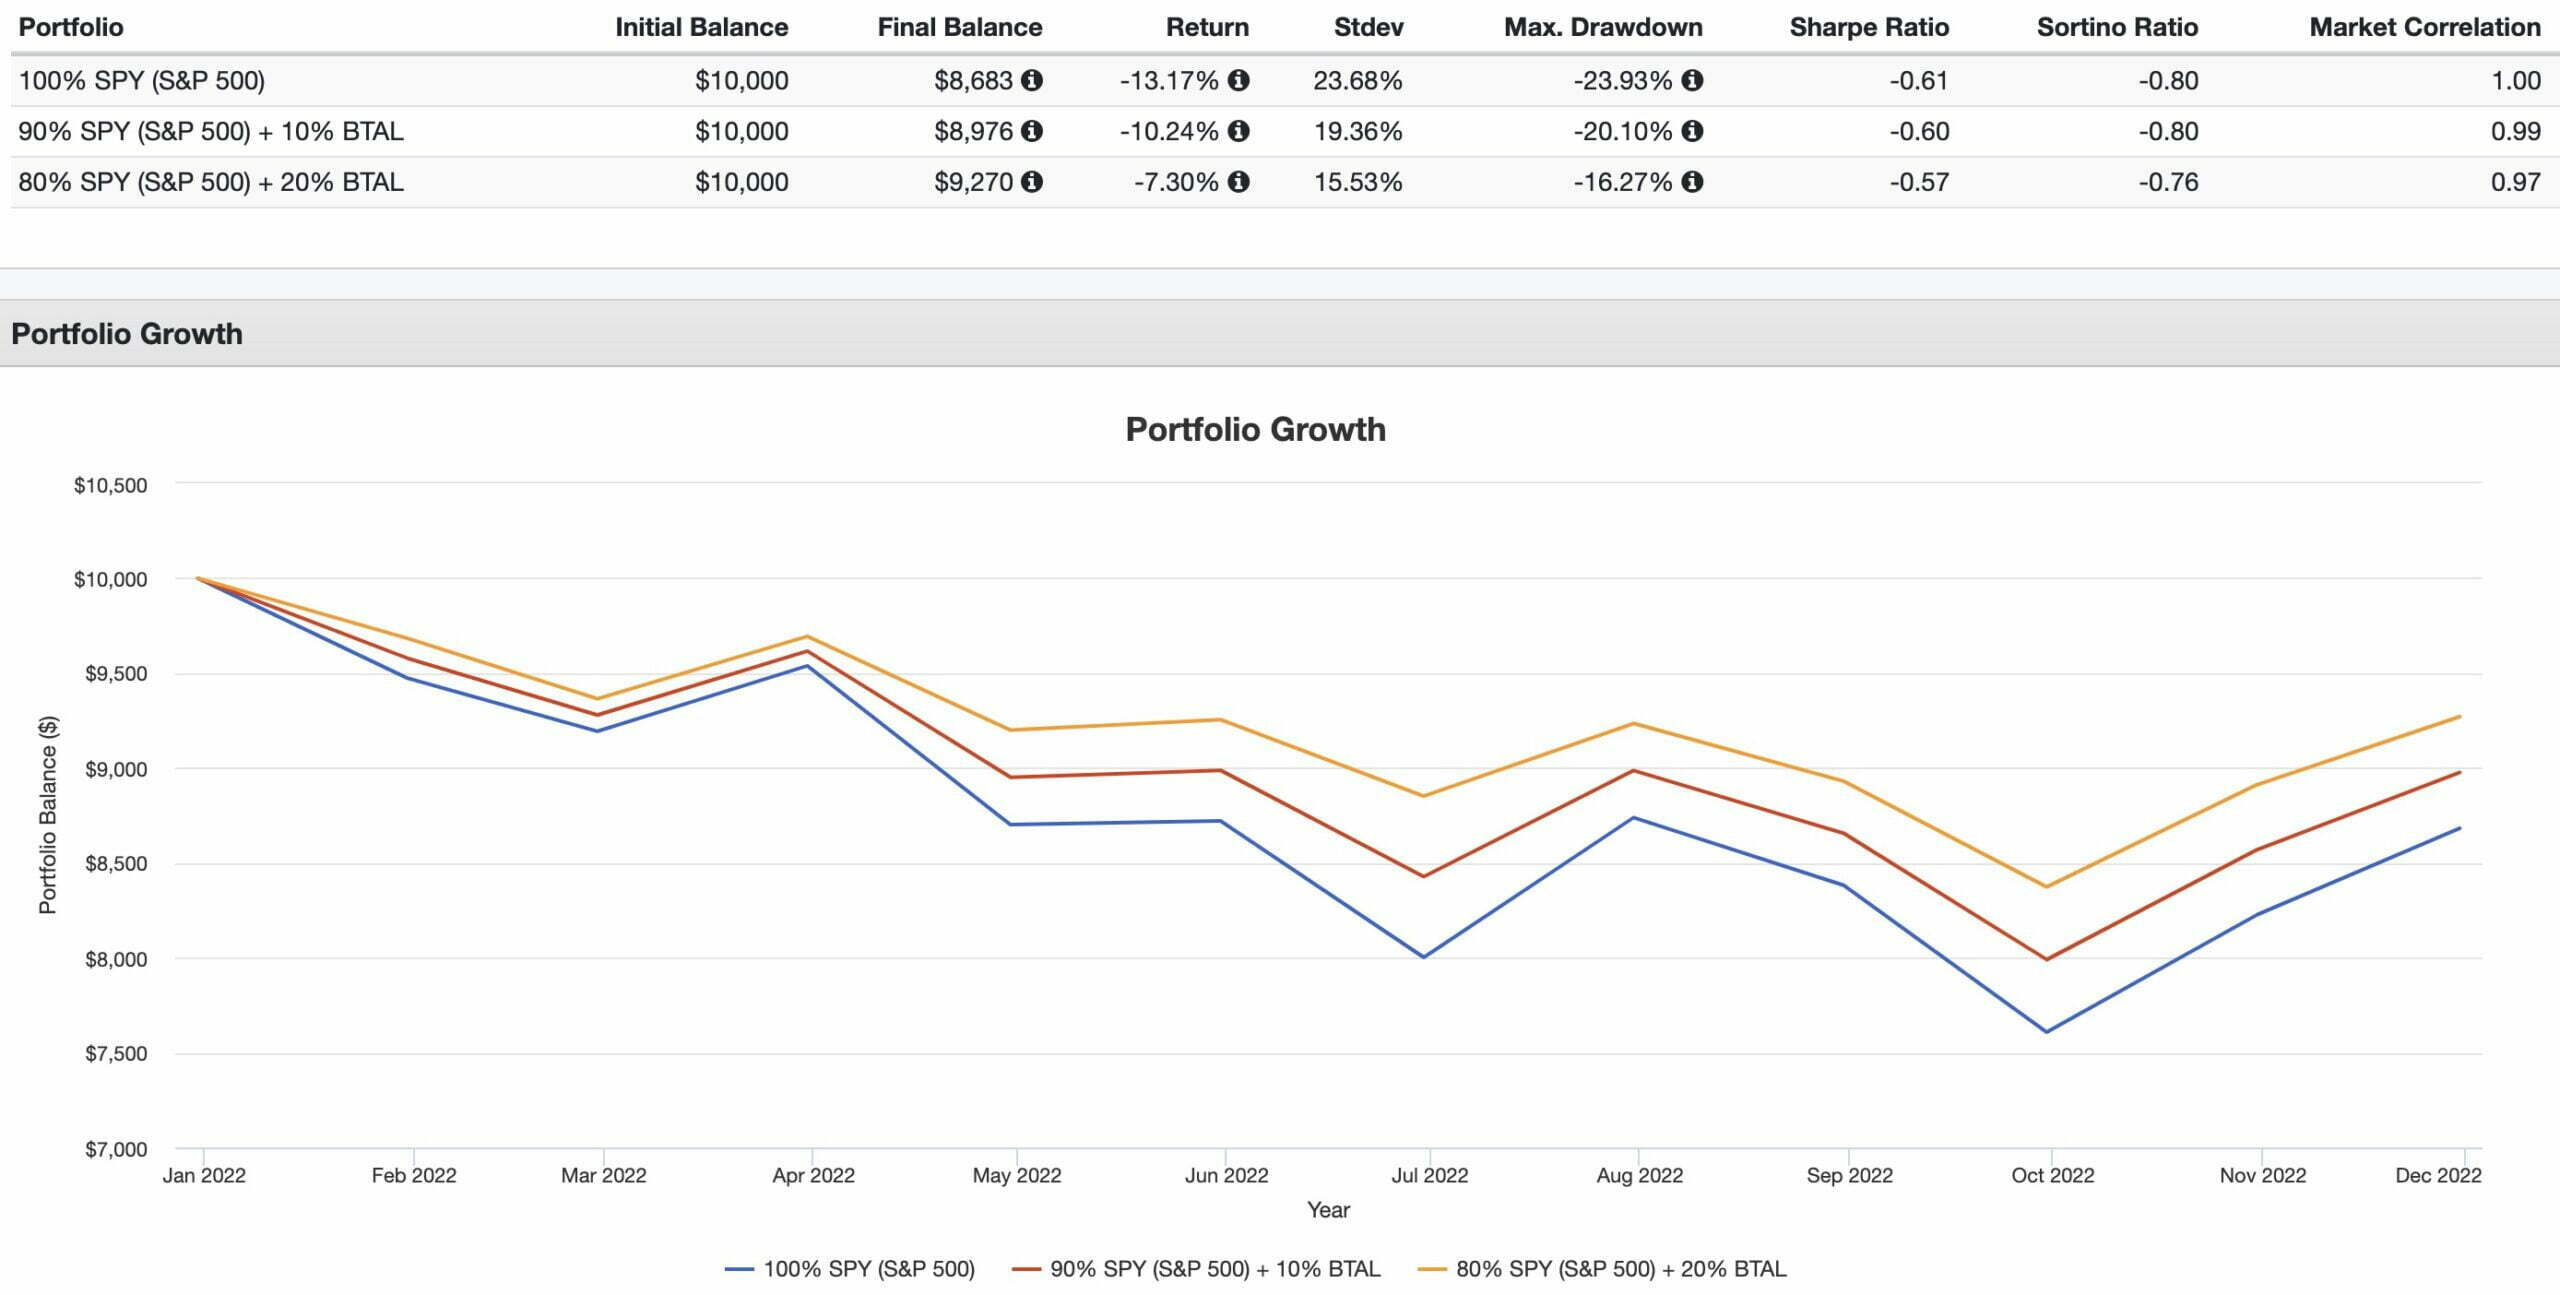
This year in particular has revealed how a return smoother ETF can take the edge off of what is otherwise a challenging year for markets.
The most defensive portfolio of 80% SPY + 20% BTAL brings overall carnage down from a negative double digit nightmare to a more palatable negative single digit scenario.
Every drawdown is less severe.
It’s clear that enhanced risk adjusted rates of returns are possible by adding a BTAL ETF to your all equity portfolio but does it improve a 60/40 portfolio?
100% VBIAX vs 90% VBIAX + 10% BTAL vs 80% VBIAX + 20% BTAL Returns
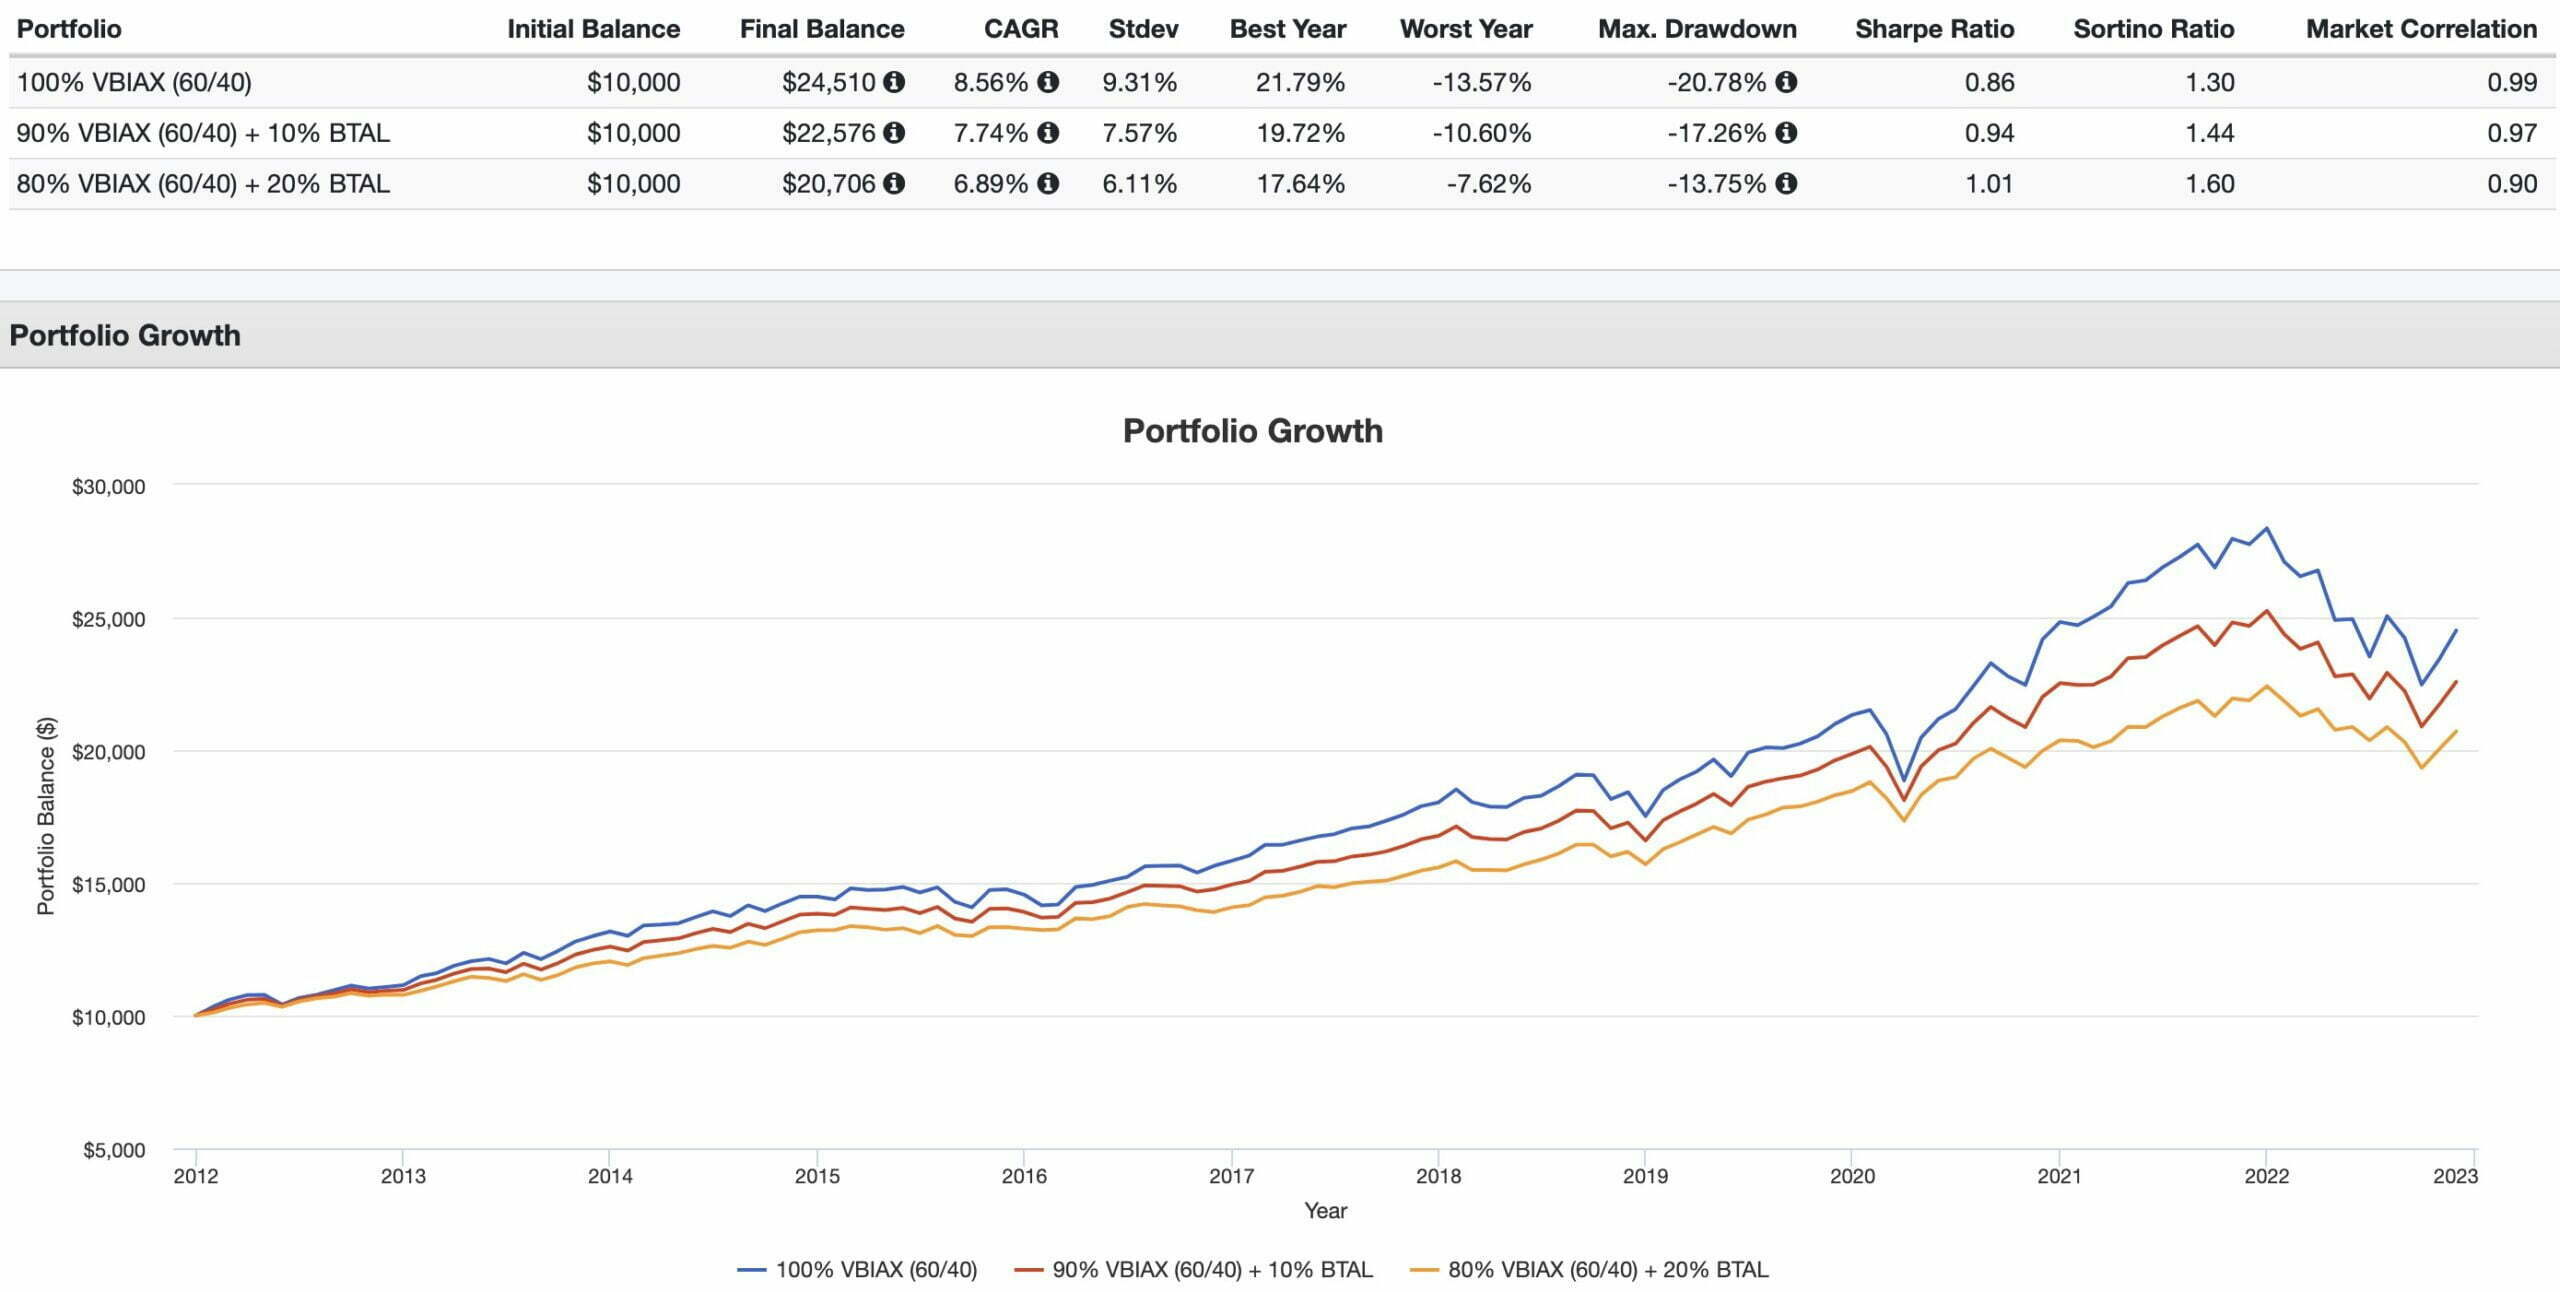
Well, if it isn’t the same results with a horse of a different colour!
BTAL ETF also improves the risk adjusted rate of returns of a 60/40 portfolio.
Add 10% and you get a little boost.
Add 20% and your risk (standard deviation), worst year, max drawdown, Sharpe Ratio and Sortino Ratio are significantly augmented.
Ah, but those pesky returns.
They do go down.
That part seems unavoidable.
Hence, it’s already clear to see that BTAL ETF can improve the risk adjusted returns of an all equity portfolio or a 60/40 portfolio but its best case usage is for an expanded canvas portfolio.
A portfolio that is capital efficient stretches its boundaries beyond 100% to make room for more asset classes and strategies.
With a bit of leverage, even for a maximally diversified portfolio of multiple asset classes and/or strategies, the desire to smooth out returns and reduce overall risk becomes paramount.

100% PSLDX vs 80% PSLDX + 20% BTAL vs 50% PSLDX + 20% BTAL + 30% PQTIX Returns
Wanna crush an all equity portfolio?
Enter the room PSLDX.
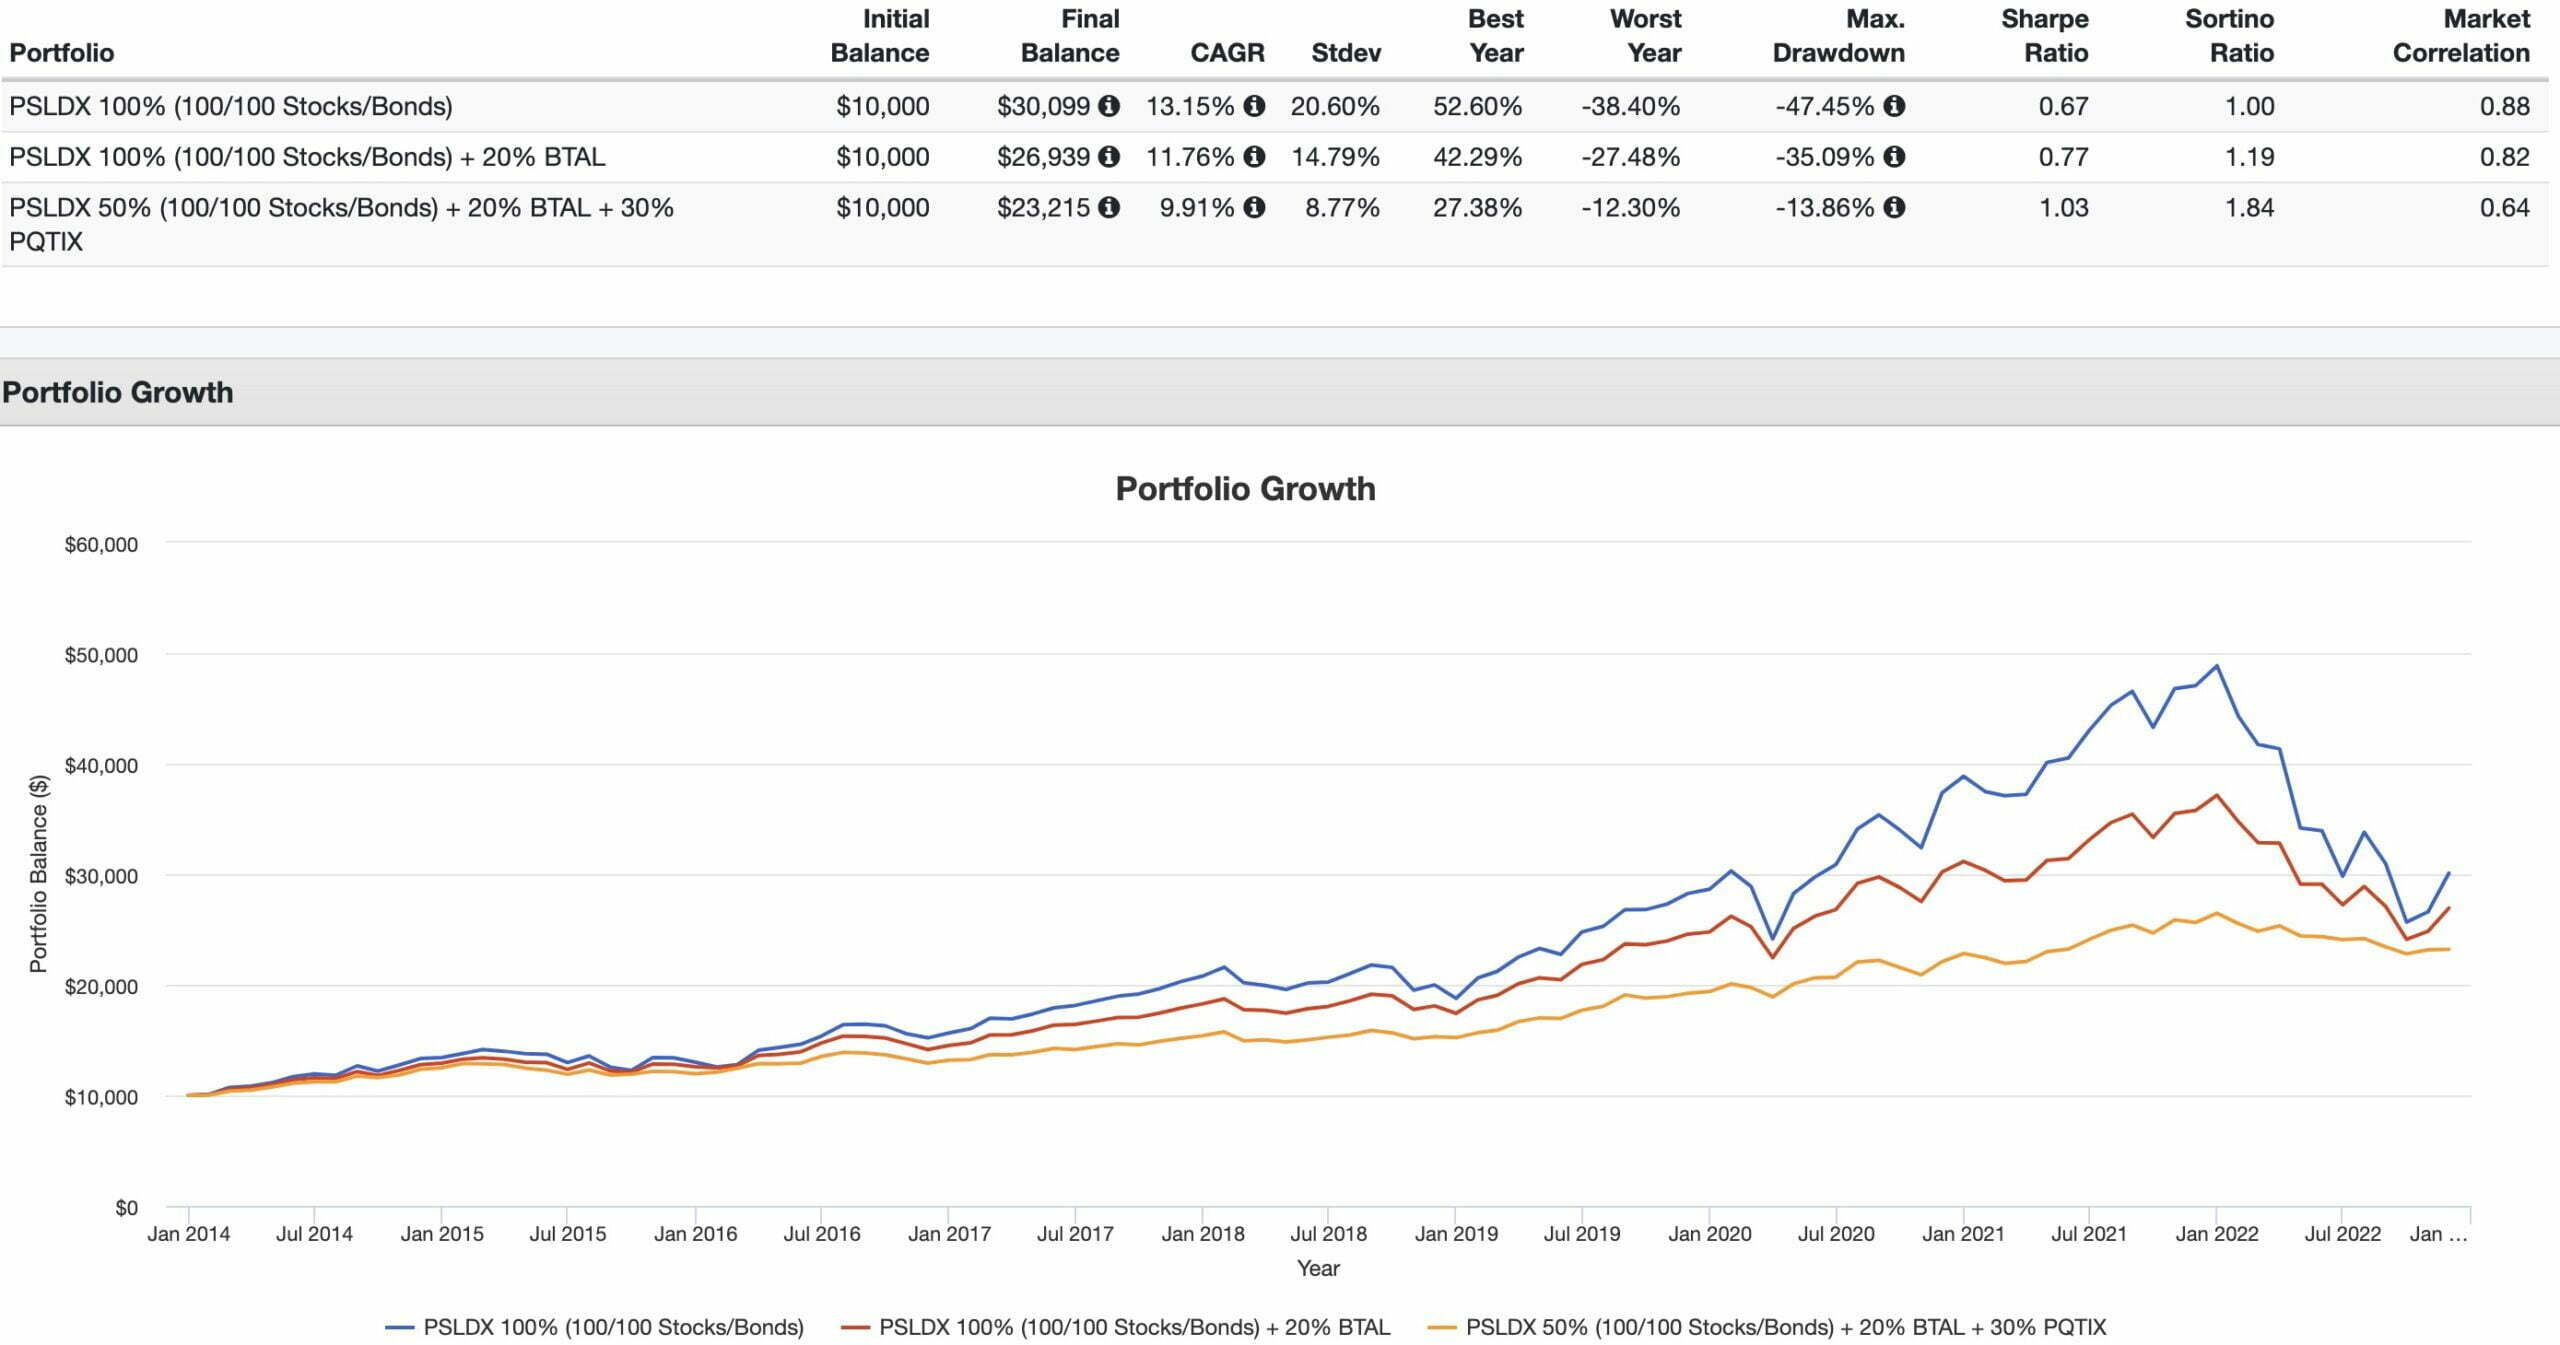
Its a robust beast expanded canvas product featuring 100% equites AND 100% bonds.
It’ll outperform an all equity portfolio with a long enough runway but consider the harsh reality that it has almost been sliced in half (-47.45% drawdown) and has featured a jaw dropping 20.60% standard deviation.
That’s a bucking bronco and then some.
How does one tame such a beast?
How about adding 20% BTAL to the mix.
Here you give up 139 basis points of returns (13.15% vs 11.76%) but receive an impressive 581 basis points of extra risk management (20.60% vs 14.79%).
And if you’re seeking a maximum Sharpe Ratio portfolio featuring a silky smooth ride you could potentially consider adding 30% PQTIX to the mix at the expense of PSLDX.
Your returns exceed your risk and you’ve got a SHARPE/SORTINO monster that is only 0.64 correlated to the market.
BTAL ETF is a versatile return smoother that has a potential place in portfolios that are all equity, 60/40 or expanded canvas.
Let’s find out more about how it fulfils that particular mandate.

QBTL.TO ETF and BTAL ETF Review | AGFiQ US Market Neutral Anti-Beta Fund Review
Hey guys! Here is the part where I mention I’m a travel blogger, vlogger and content creator! This investing opinion blog post ETF Review is entirely for entertainment purposes only. There could be considerable errors in the data I gathered. This is not financial advice. Do your own due diligence and research. Consult with a financial advisor.

AGF ETFs: Disciplined Approach To Investing
AGF as an ETF provider has a more significant presence in Canada than it does in the US.
In fact, its product range in the US appears to be limited to just 2 ETFs.
In Canada, I’ve discovered 10.
Hence, we’ve got BTAL ETF for US investors and QBTL.TO for Canadian asset allocators.
AGF Market Neutral Anti-Beta ETFs
BTAL ETF – AGFiQ U.S. Market Neutral Anti-Beta Fund (US ETF)
QBTL.TO ETF – AGFiQ U.S. Market Neutral Anti-Beta Fund (Canadian ETF)

The Case For Market Neutral and Anti-Beta Investing Strategies
We kind of jumped the gun by highlighting the return smoothing potential of BTAL ETF and QBTL.TO ETF.
However, we’ve yet to unpack why to even consider such a strategy in the first place?
Aren’t we diversified enough as investors with access to global equities, bonds, reits and gold?
BTAL Monthly Correlations With Stocks, Bonds, Gold and REITS
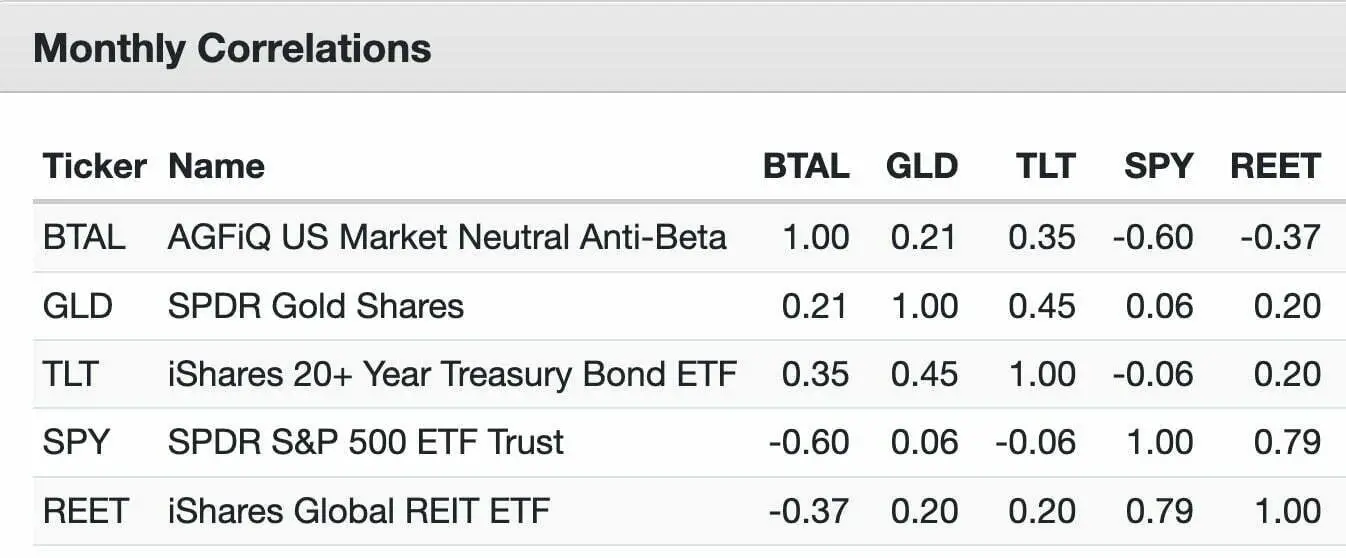
BTAL Anti-Beta Market Neutral ETF potentially belongs in a portfolio because it is negatively correlated with US equities and REITS while offering low correlation with Gold and 20+ Year Treasuries.
BTAL ETF vs SPY ETF = -0.60 Correlation
BTAL ETF vs REET ETF = -0.37 Correlation
BTAL ETF vs GLD ETF = 0.21 Correlation
BTAL ETF vs TLT ETF = 0.35 Correlation
How about when you compare it with more esoteric investing strategies such as managed futures, arbitrage and tail risk?
BTAL Monthly Correlations With Managed Futures, Tail Risk and Arbitrage
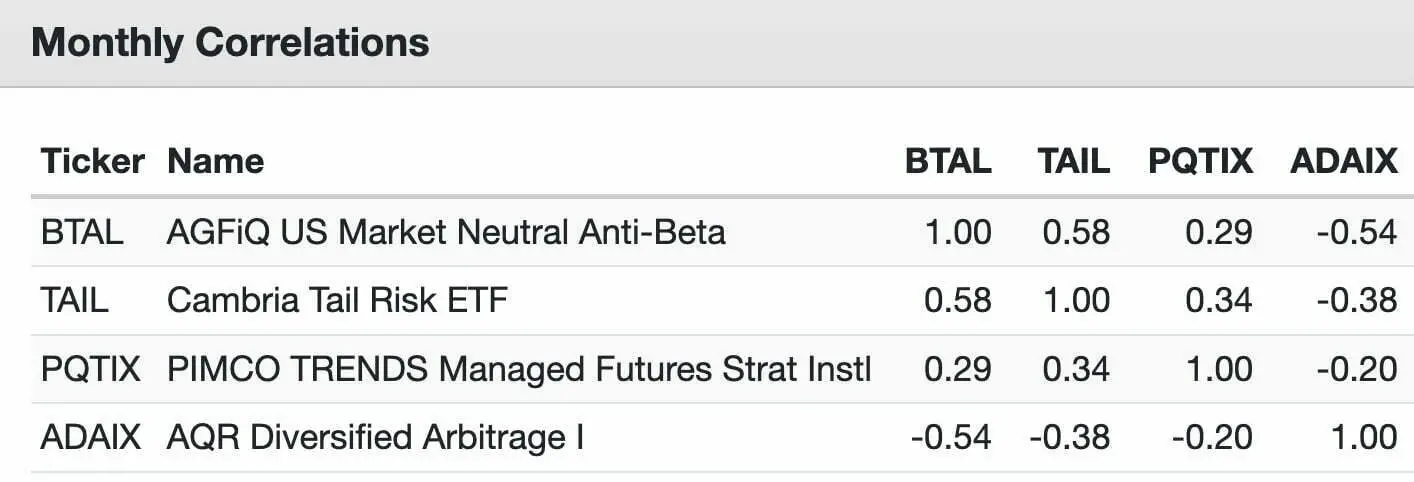
Another feather in BTAL ETF’s correlation cap.
It is negatively correlated with AQR’s Diversified Arbitrage strategy and has a low correlation with Managed Futures as well.
The only strategy it shares a stronger correlation with is Tail Risk.
Let’s plant a flag here.
BTAL ETF offers investors a potential alternative (not direct replacement) to tail risk options based strategies.
Although an ensemble approach or what folks such as @choffstein cleverly refer to as “diversifying your diversifiers” might suggest including both anti-beta market neutral AND tail risk together it’s a harder pill to swallow when you compare them head to head.
As an individual line item BTAL ETF is far more palatable than TAIL ETF.
BTAL ETF vs TAIL ETF Performance Summary
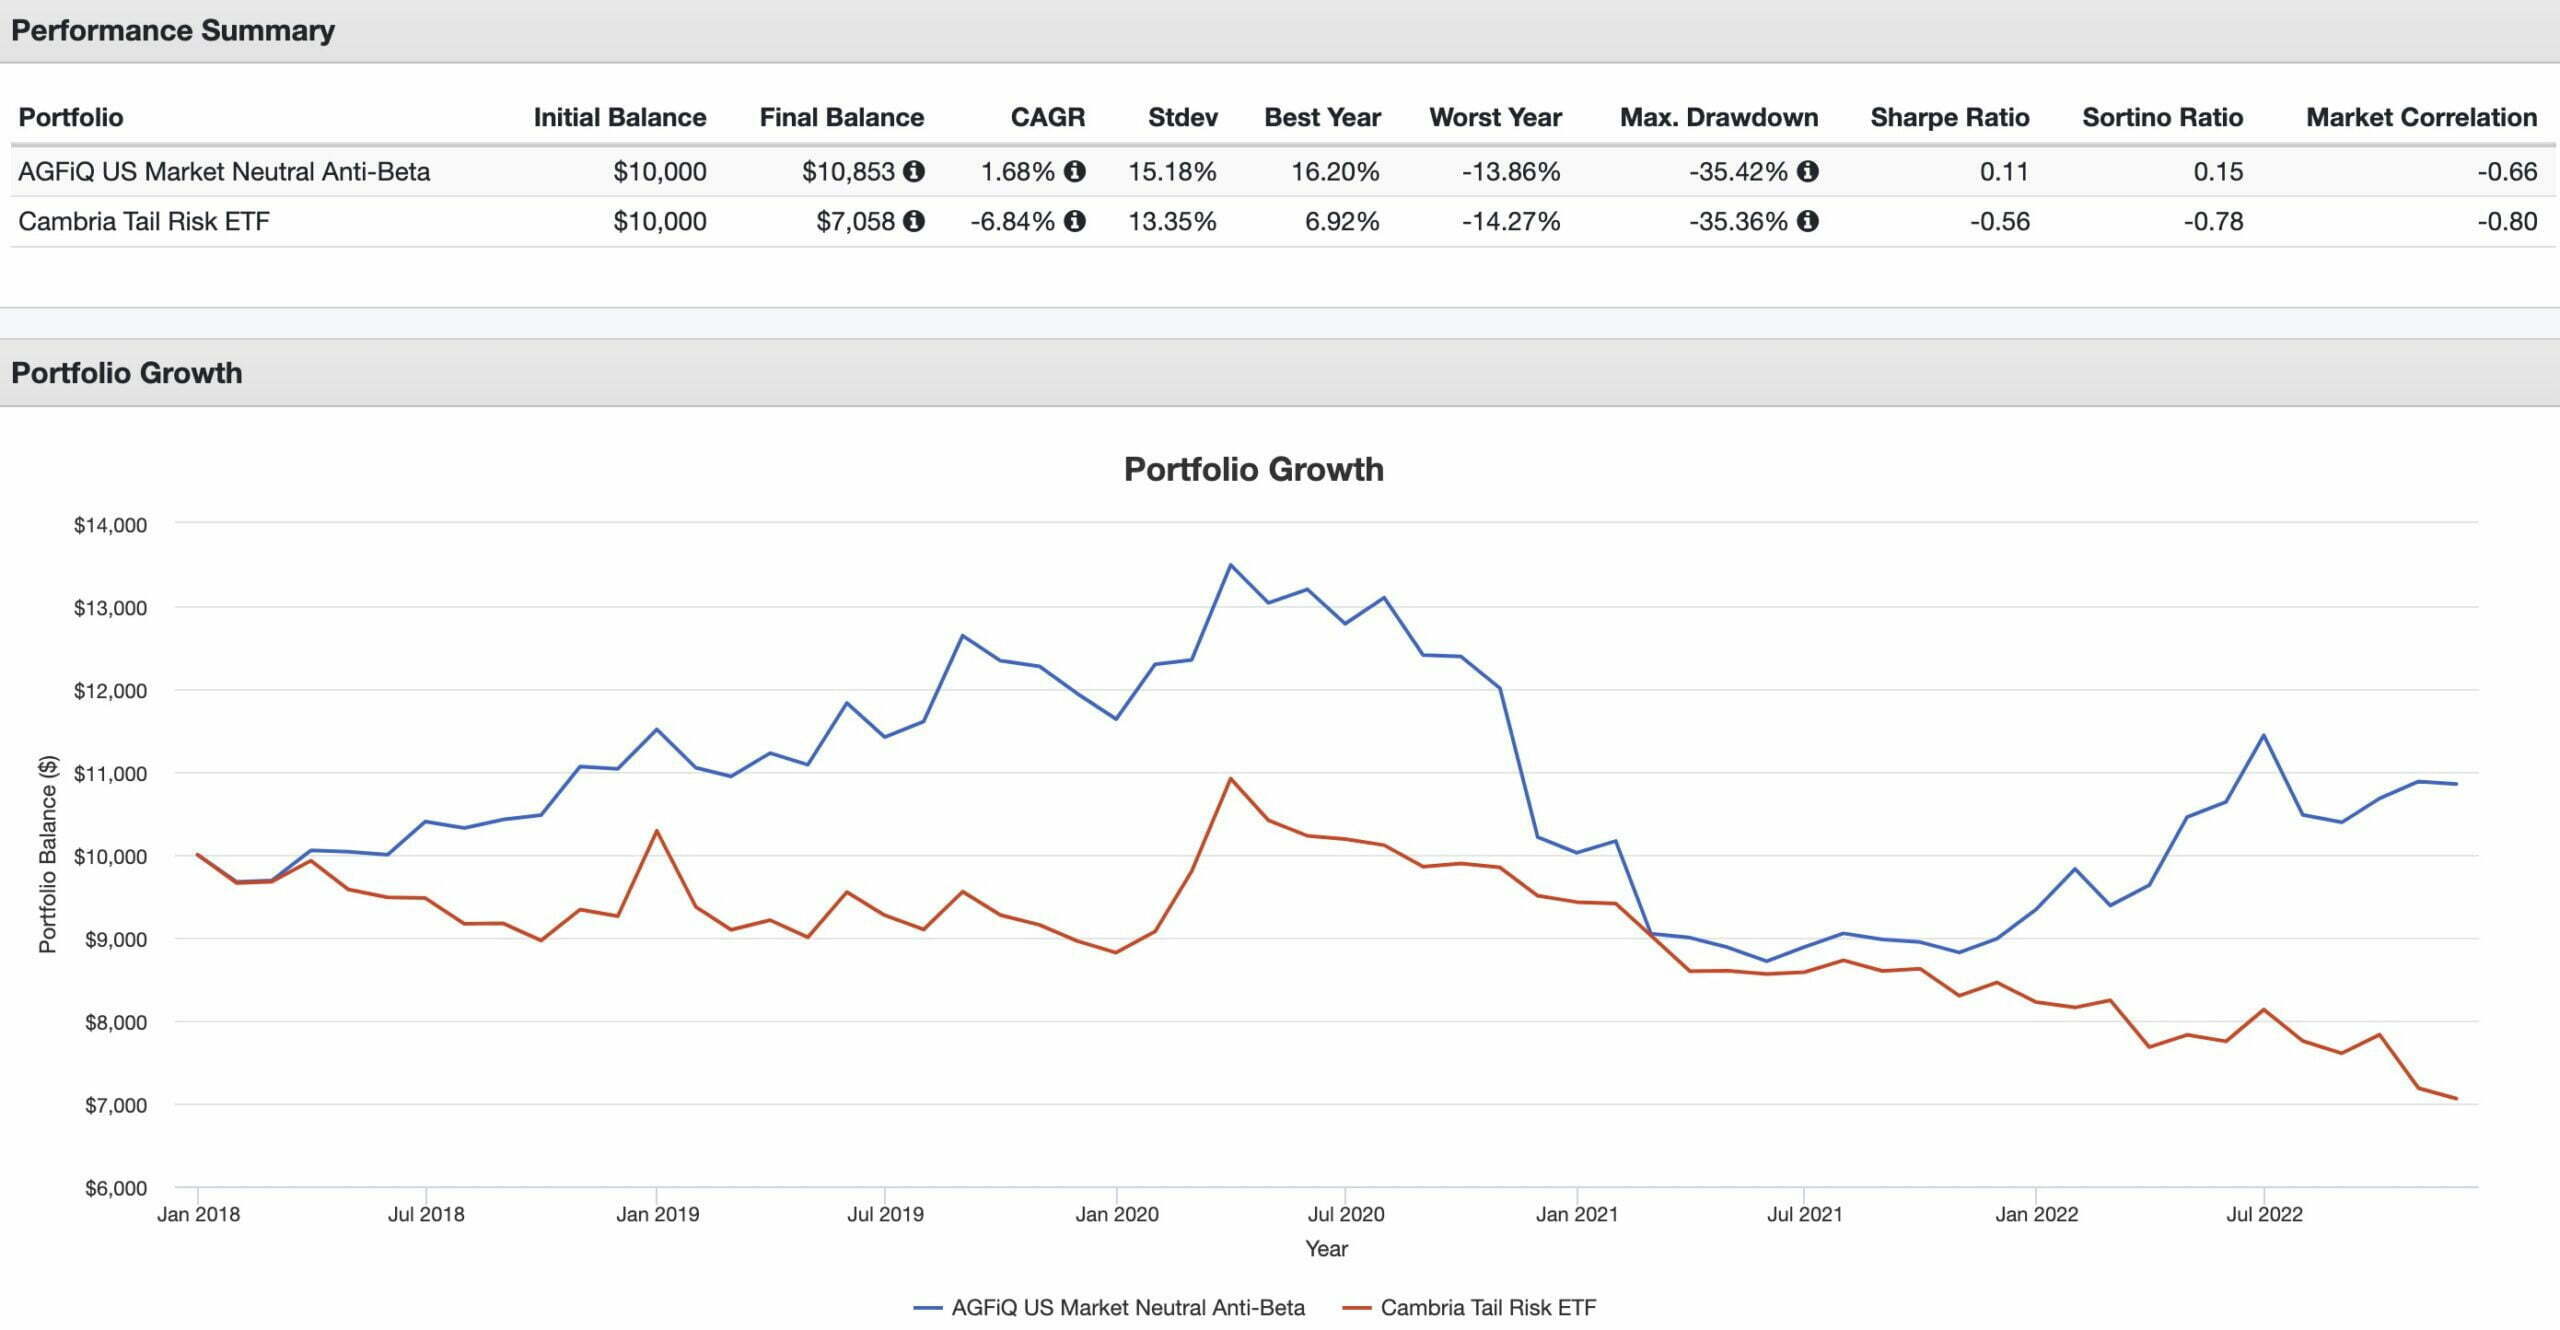
TAIL ETF is a bit of a drag to say the least.
BTAL not so much.
However, before we conclude to pick one over the other it’s noteworthy to feast your eyes upon late 2018 and early 2020 where both strategies offered positive returns (when markets were in fierce drawdown) but TAIL provided significantly more firepower.
In a slow grind down (such as 2022) it was BTAL offering superb protection.
Hence, in a rapid fire drawdown TAIL might be the best bet whereas in a slower grind down it is BTAL everyday under the sun.
However, a small allocation to both strategies (even if more skewered towards BTAL) may be the most prudent from an asset allocation maximum diversification standpoint.

Market Neutral Investing Scenarios: The Good, The Bad and The Ugly
How could we possibly do a review of a long-short equity strategy without a reference to the Clint Eastwood movie “The Good, The Bad and the Ugly”?
We’ll go over scenarios for when long-short strategies work well in upwards, downwards and sideways markets and when they also falter.
We’re going to use the following long-short configurations for each example:
100-90 = Market-Neutral Long-Short Equity
And we’ll also just include the results if one was entirely Long Equity.
Upwards Market (L/S Winners)
Here the market conditions are positive and we’ve identified winners versus losers in a favourable manner.
Long = +15
Short = +10
100-90 = Market-Neutral Long-Short Equity
(0.15 x 100) – (0.10 x 90) = 15 – 9 = +6
Our rankings would be as follows:
- Long Only = +15
- Market Neutral = +6
Upwards Market (L/S Losers)
Here the market conditions are positive but we’ve selected relative losers versus winners in terms of performance.
Long = +10
Short = +15
100-90 = Market-Neutral Long-Short Equity
(0.10 x 100) – (0.15 x 90) = 10 – 13.5 = -3.5
Our rankings would be as follows:
- Long Only = +10
- Market Neutral = -3.5
Downwards Market (L/S Winners)
Here the market conditions are negative but we’ve picked stocks that relatively went down by less.
Long = -10
Short = -15
100-90 = Market-Neutral Long-Short Equity
(-0.10 x 100) – (-0.15 x 90) = -10 – (-13.5) = +3.5
Our rankings would be as follows:
- Market Neutral = +3.5
- Long Only = -10
Downwards Market (L/S Losers)
Here the market conditions are negative and we’ve picked losing stocks to add insult to injury.
Long = -15
Short = -10
100-90 = Market-Neutral Long-Short Equity
(-0.15 x 100) – (-0.10 x 90) = -15 – (-9) = -6
Our rankings would be as follows:
- Market Neutral = -6
- Long Only = -15
Crushing Win (L/S Winners)
Here we’ve selected winning stocks that were positive and identified losing stocks that were negative for a crushing relative win.
Long = +10
Short = -5
100-90 = Market-Neutral Long-Short Equity
(0.10 x 100) – (-0.05 x 90) = 10 – (-4.5) = +14.5
Our rankings would be as follows:
- Market Neutral = +14.5
- Long Only = +10
Crushing Defeat (L/S Losers)
Here we’ve selected losing stocks that were negative while our short picks were positive for a crushing relative defeat.
Long = -5
Short = +10
100-90 = Market-Neutral Long-Short Equity
(-0.05 x 100) – (0.10 x 90) = (-5) – (+9) = -14
Our rankings would be as follows:
- Long Only = -5
- Market Neutral = -14
Market Neutral Scenarios: Thoughts On The Results
I’m always fascinated by the results of a market neutral strategy versus long-only equities.
Consider downward markets scenarios.
Market neutral clamps down and defends whereas long only gets obliterated.
But there is no free lunch.
In a scenario where markets are roaring, a market neutral strategy may not even be above water.
Hence, as a portfolio puzzle piece it’s rarely (if ever) a core component.
However, it certainly offers investors some food for thought as a peripheral slice.

BTAL ETF Overview, Holdings and Info
The investment case for “AGFiQ US Market Neutral Anti-Beta Fund ” has been laid out succinctly by the folks over at AGF ETFs: (fund landing page)
“BTAL’s objective is to provide a consistent negative beta exposure to the U.S. equity market. BTAL strives to achieve this objective by investing primarily in long positions in low beta U.S. equities and short positions in high beta U.S. equities on a dollar neutral basis, within sectors.
Key Reasons to Invest:
- Provides exposure to the spread return between low and high beta stocks.
- Potential to generate positive returns regardless of the direction of the general market, so long as low beta stocks outperform high beta stocks.
- Provides consistent negative beta exposure and can be used as an effective equity hedge to lower portfolio volatility and reduce the impact of drawdowns.
- May be an effective alternative to buying Treasuries, volatility products and low-volatility funds if seeking to reduce overall portfolio risk.”
When I’m seeking out a long-short equity strategy (whether it be a more defensive market neutral or aggressive 130-30 active extensions) I’m specifically looking for four distinct features.
- Absolute Returns
- Excess Returns
- Low Correlation
- Risk Management
BTAL ETF nails 3 out of the 4 in my opinion.
It certainly offers absolute returns in the sense that it can thrive in a downwards market when long-only equity strategies are getting pulverized.
It also offers low correlation.
Scratch that.
Negative correlation to markets!
And finally, it fulfils its defensive component by limiting drawdowns when markets are struggling.
However, it is not a mandate for long-term outperformance.
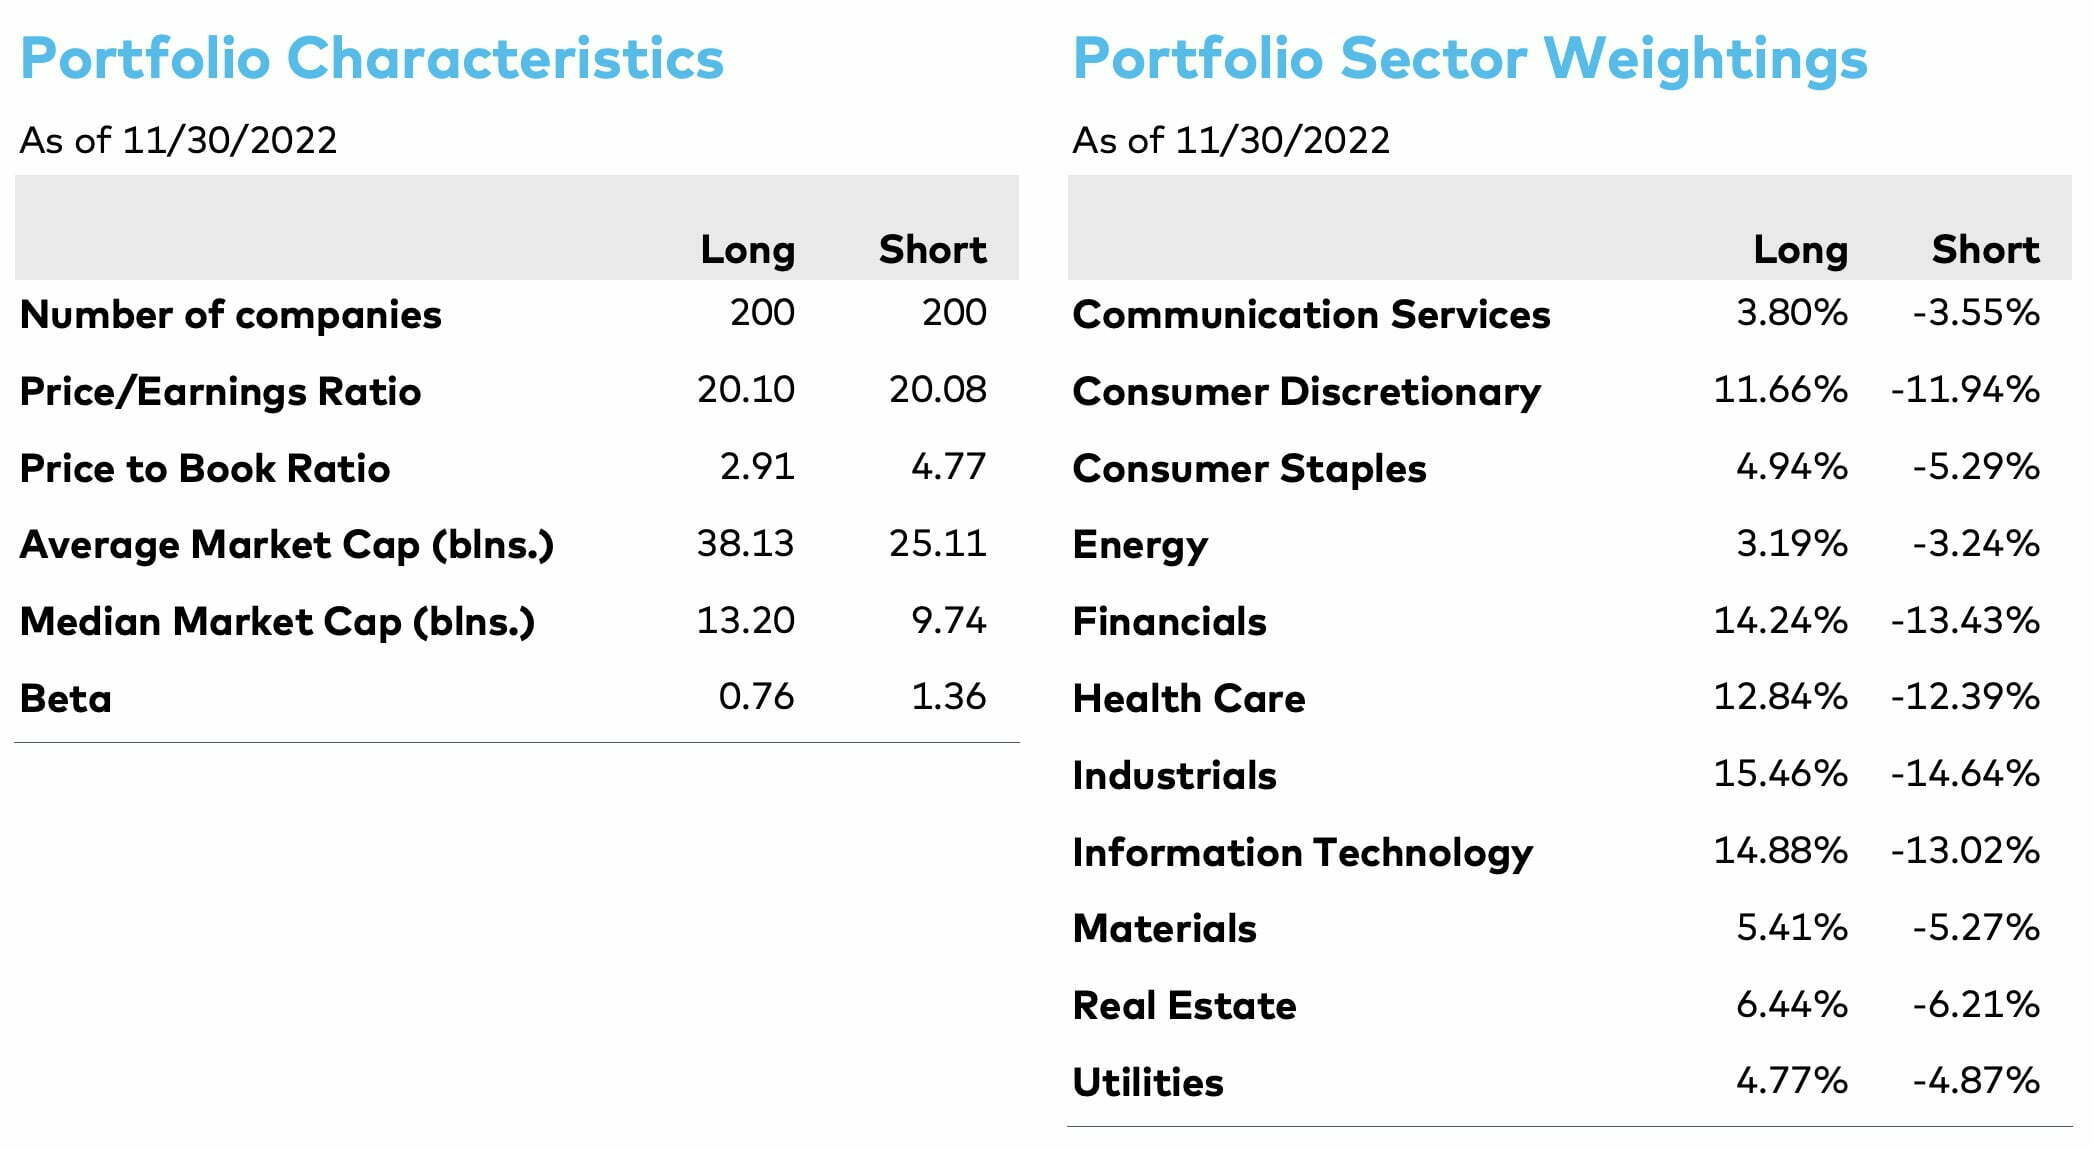
BTAL ETF: Security Selection Process
Let’s move on by consulting the fund provider’s prospectus to find out its methodology for security selection.
“In seeking to achieve its investment objective, the Fund will invest primarily in long positions in low beta U.S. equities and short positions in high beta U.S. equities on a dollar neutral basis, within sectors.
The Fund will construct a dollar neutral portfolio of long and short positions of U.S. equities by investing primarily in the constituent securities of the Dow Jones U.S. Thematic Market Neutral Low Beta Index (the “Index”) in approximately the same weight as they appear in the Index, subject to certain rules-based adjustments described below.
The performance of the Fund will depend on the difference in the rates of return between its long positions and short positions.
For example, if the Fund’s long positions have increased more than its short positions, the Fund would generate a positive return, but if the long positions increased less than the short positions, the Fund would generate a negative return.
Conversely, if the Fund’s short positions have increased more than its long positions, the Fund would generate a negative return; but if the short positions increased less than the long positions, the Fund would generate a positive return.
The Fund is an actively-managed exchange-traded fund (“ETF”). The universe for the Index is comprised of the top 1,000 eligible securities by market capitalization, including real estate investment trusts (“REITs”) (the “universe”).
Eligible securities are those that are in the top 1,000 securities by market capitalization in the Dow Jones U.S. Index, which satisfy certain minimum average daily trading volumes, as determined by the Index provider.
The securities in the universe are categorized as belonging to one of 11 sectors as defined by the Global Industry Classification Standard (GICS).
The Index maintains sector neutrality by determining a defined number of constituent issuers from each sector based on the proportion that each sector makes up in the composition of the universe.
The Index identifies approximately the 20% of securities with the lowest betas within each sector as equal-weighted long positions and approximately the 20% of securities with the highest betas within each sector as equal-weighted short positions.
Beta measures the relative volatility of the value of a security compared with that of a market index. The Fund’s beta is calculated using the historical returns of the S&P 500 Index (the “market index” for the Fund).
A stock’s beta is based on its sensitivity to weekly market movements over the last 52 weeks as measured by its price movements relative to those of the market index.
High beta stocks are those stocks that have a higher combination of correlation and volatility relative to the market index, and low beta stocks are those stocks that have a lower combination of correlation and volatility relative to the market index.
In addition, the Fund at times may elect to invest in a representative sample of the long and short positions in the Index or in other constituents in the universe.
The Index and Fund will be reconstituted on a quarterly basis. At such time, the Index will be reset to dollar neutrality (i.e., equal dollar amounts of both long and short positions).
● If the quarterly reconstitution creates exposure to such factors which may impact the Fund’s risk or leverage profile, including but not limited to, momentum and/or leverage.
At each quarterly reconstitution, to eliminate undesired risk exposures, the Fund will apply a rules-based methodology to neutralize its exposure to certain risk factors.
More specifically, if the Fund’s exposure to factors such as momentum falls outside a pre-defined range, the Fund intends to adjust the way in which beta is calculated for each security in the universe, which in these instances may differ from the Index.
This portfolio construction process may result in the Fund holding securities that are in the universe but not in the Index.
● To remain in compliance with applicable regulatory requirements.
For example, if the Fund’s value at risk (VAR) exceeds regulatory limits, the Fund will reduce its gross leverage to comply with applicable regulatory requirements.
The Fund, under normal circumstances, invests at least 80% of its net assets (plus the amount of any borrowings for investment purposes) in long and short equity securities of U.S. issuers, which may include long and short exposure to such issuers through derivatives.
The Fund may use derivatives, including swap agreements and futures contracts, consistent with its investment objective and may also invest in money market instruments, including but not limited to, money market funds.
Market Neutral Anti-Beta Key Points
- Dow Jones US Equity Index Universe (1000 eligible securities) for Long and Short positions
- Selects Top 20% securities with Low Beta for Long Position and Top 20% securities with High Beta for Short Position
- Maintains sector neutral approach (equal long-short for both over 11 sectors)
- High beta stocks: higher combo of correlation + volatility
- Low beta stocks: lower combo of correlation + volatility
- Fund will generate positive returns when the long position is relatively outperforming the short position in both positive or negative economic environments
QBTL.TO / BTAL ETF Info
Ticker: BTAL (US) / QBTL.TO (CAD)
Adjust Expense Ratio: 0.45 (US) / 0.55 (CAD)
AUM: 367.1 Million (US) / 393.8 Million (CAD)
Inception: 2011 (US) / 2019 (CAD)
Of course we’re paying higher fees in Canada!
What’s new under the sun?
Overall though, the adjusted expense ratio is very reasonable for both funds considering what are the typical costs and performance fees associated with most long/short equity strategies.

QBTL.TO ETF / BTAL ETF Pros and Cons
Let’s move on and examine the potential pros and cons of BTAL ETF.
BTAL Pros
- Maybe the ultimate portfolio return smoother? Add a bit to a 100% equity, 60/40 or expanded canvas portfolio and your risk adjusted returns improve (higher SHARPE/SORTINO and more palatable max drawdown/worst year)
- Negatively correlated and/or low correlation to equities, bonds, gold, managed futures and arbitrage strategies
- The potential as an alternative to tail risk or other option based put strategies with similar results
- Pairs well with bonds, managed futures, gold and other diversifiers to improve the risk management of an overall portfolio
- Very reasonable 0.45 (0.55 for Canadians) adjusted expense ratio (much better than most long-short equity strategies of 2/20 fee structure)
- The potential for positive absolute returns in any market environment where low beta stocks are relatively outperforming high beta stocks
BTAL Cons
- Unsexy as a line-item in a portfolio with returns that won’t get you excited when viewed in the context of merely a part and not the greater whole
- The tendency for investors to get overconfident while punting on the strategy when it is a drag on the portfolio (markets roaring for an extended period of time) when they ought to be preparing for regression to the mean (an eventual bear market)

QBTL.TO / BTAL Potential Portfolio Solutions
These asset allocation ideas and model portfolios presented herein are purely for entertainment purposes only. This is NOT investment advice. These models are hypothetical and are intended to provide general information about potential ways to organize a portfolio based on theoretical scenarios and assumptions. They do not take into account the investment objectives, financial situation/goals, risk tolerance and/or specific needs of any particular individual.
Let’s explore how BTAL ETF / QBTL.TO ETF potentially integrates into a portfolio at large.
BTAL ETF + Friends Portfolio
We’ve explored how BTAL ETF can potentially enhance the risk adjusted rate of returns for all equity, 60/40 and capital efficient investors.
However, we’ll present a model expanded canvas portfolio today:
40% BLNDX ETF
30% AVGE ETF
10% BTAL ETF
10% TYA ETF
10% GDE ETF
Here we’re combining a global value/quality tilted core equity strategy with capital efficient market cap weighted equities, managed futures, anti-beta market neutral, gold and capital efficient treasuries to form an overall maximally diversified portfolio with just 5 funds.
Some of these funds are new as of this year so we’re not able to perform an in-depth backtest as of now.
BTAL ETF + Friends Portfolio
Canadian investors could consider the following portfolio:
30% PLV.TO ETF
25% JFS.UN.TO ETF
25% HRAA.TO ETF
10% BTAL.TO ETF
10% PFMN.TO ETF
Here we’ve got a globally diversified 70/30 low volatility fund combined with an absolute return strategy and multi-strategy managed futures approach.
To round things off we have two market neutral funds.
We can backtest this approach versus VBAL.TO 60/40 Global portfolio.
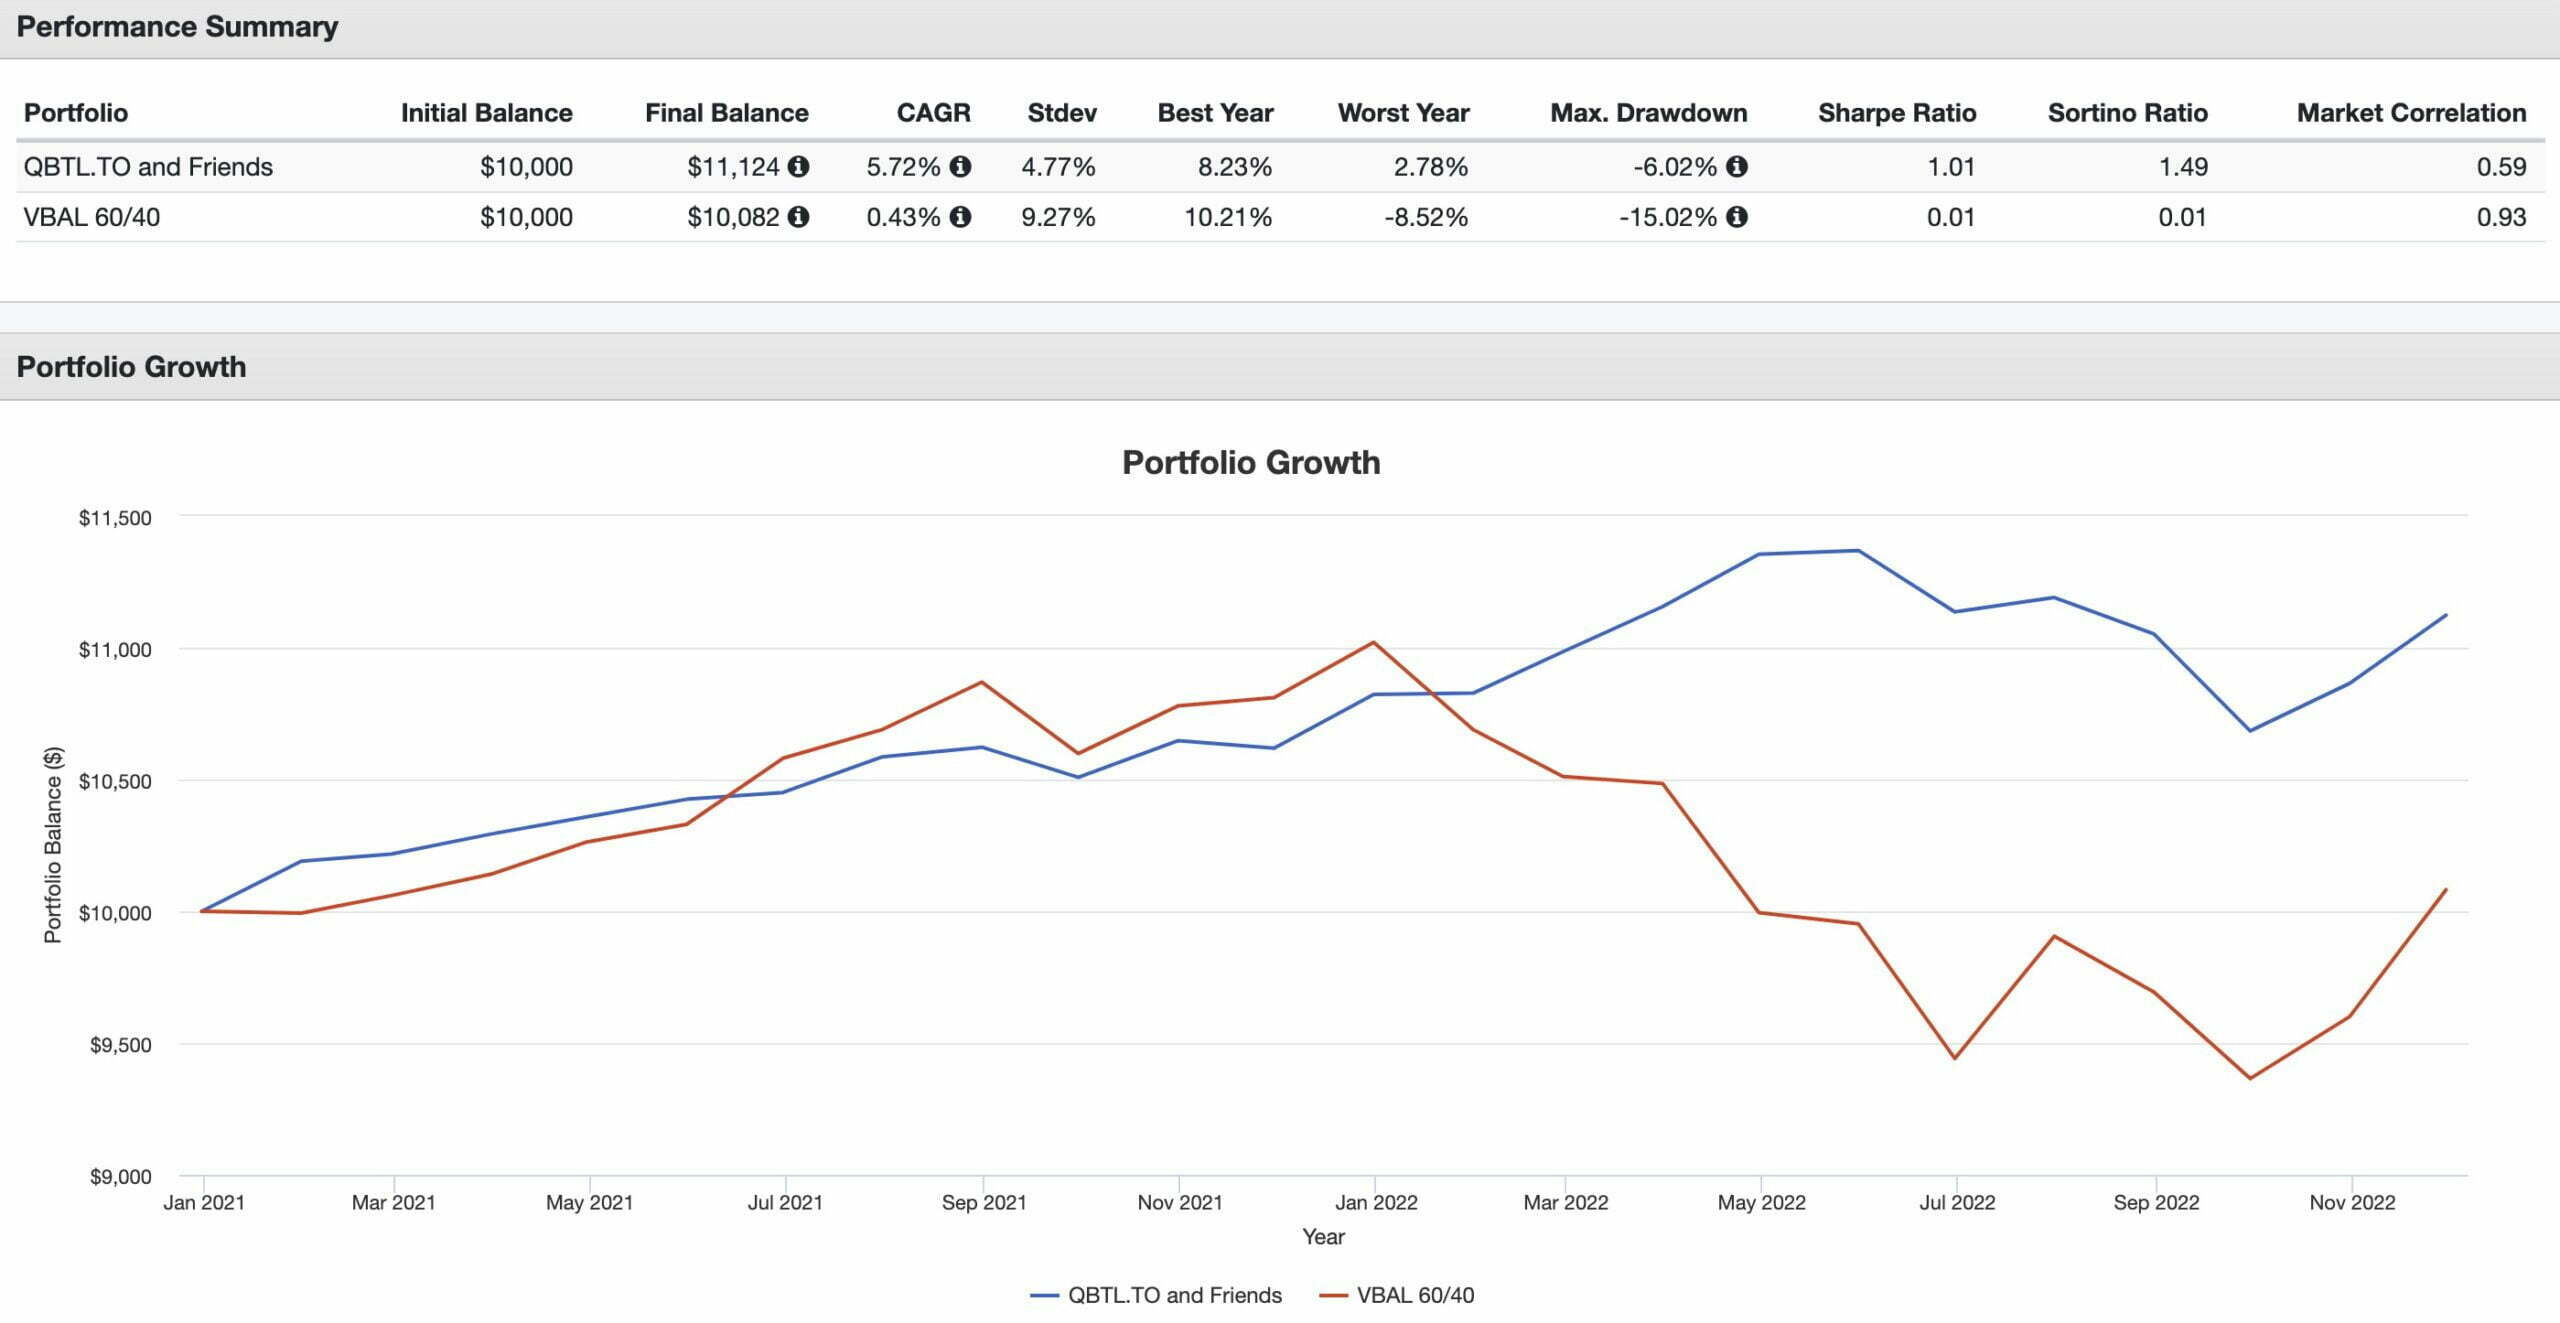
Here our QBTL.TO ETF and Friends Portfolio has clearly outperformed and provided better risk adjusted rates of return versus a 60/40 portfolio.
It’s a relative SHARPE/SORTINO monster when compared directly with the 60/40 portfolio.

What Others Have To Say About BTAL ETF
Now that we’ve covered a few different portfolio solutions let’s see what others have to say about the fund for those who prefer video format.
*Please note that I was only able to find videos from Bill DeRoche the CIO of AGF.*
source: TD Ameritrade Network on YouTube
source: VettaFi on YouTube
Nomadic Samuel Final Thoughts
The ability to zoom out and see the big picture of your portfolio is a crucial skill to have as an investor.
At the end of the day you’re tasked with assembling assets in such a manner that the performance you’re seeking collides with the overall risk you’re willing to accept.
BTAL ETF when viewed as an individual line-item may seem like something to potentially discard.
However, when you consider it as a whole it becomes a potentially intriguing puzzle piece.
The ultimate return smoother?
What do you think?
Please let me know in the comments below.
That’s all I’ve got for today.
Ciao for now.
Important Information
Comprehensive Investment Disclaimer:
All content provided on this website (including but not limited to portfolio ideas, fund analyses, investment strategies, commentary on market conditions, and discussions regarding leverage) is strictly for educational, informational, and illustrative purposes only. The information does not constitute financial, investment, tax, accounting, or legal advice. Opinions, strategies, and ideas presented herein represent personal perspectives, are based on independent research and publicly available information, and do not necessarily reflect the views or official positions of any third-party organizations, institutions, or affiliates.
Investing in financial markets inherently carries substantial risks, including but not limited to market volatility, economic uncertainties, geopolitical developments, and liquidity risks. You must be fully aware that there is always the potential for partial or total loss of your principal investment. Additionally, the use of leverage or leveraged financial products significantly increases risk exposure by amplifying both potential gains and potential losses, and thus is not appropriate or advisable for all investors. Using leverage may result in losing more than your initial invested capital, incurring margin calls, experiencing substantial interest costs, or suffering severe financial distress.
Past performance indicators, including historical data, backtesting results, and hypothetical scenarios, should never be viewed as guarantees or reliable predictions of future performance. Any examples provided are purely hypothetical and intended only for illustration purposes. Performance benchmarks, such as market indexes mentioned on this site, are theoretical and are not directly investable. While diligent efforts are made to provide accurate and current information, “Picture Perfect Portfolios” does not warrant, represent, or guarantee the accuracy, completeness, or timeliness of any information provided. Errors, inaccuracies, or outdated information may exist.
Users of this website are strongly encouraged to independently verify all information, conduct comprehensive research and due diligence, and engage with qualified financial, investment, tax, or legal professionals before making any investment or financial decisions. The responsibility for making informed investment decisions rests entirely with the individual. “Picture Perfect Portfolios” explicitly disclaims all liability for any direct, indirect, incidental, special, consequential, or other losses or damages incurred, financial or otherwise, arising out of reliance upon, or use of, any content or information presented on this website.
By accessing, reading, and utilizing the content on this website, you expressly acknowledge, understand, accept, and agree to abide by these terms and conditions. Please consult the full and detailed disclaimer available elsewhere on this website for further clarification and additional important disclosures. Read the complete disclaimer here.


Really like your posts. One thing to think about. BTAL is not only great as a diverifier, it’s also great as a “canary” type asset. It is very powerful when switching between regimes, at least for the decade BTAL has existed.
Check out a simple dual momentum model with BTAL and cash. Increase the return, correlation remains the same, drawdown cuts in half. https://tinyurl.com/4ndy4343
Tom, I think your on to something with this approach, get the best of both worlds. Less drawdown and still getting 90% of the benefit.
You know what, I do not see it that clear that the “unsexy” returns of BTAL are there to stay. We have seen an incredible bull market, and low volatility stocks do poorly under such conditions. But historically, low volatility have been considered to have a premium over high volatility stocks. Researchers give all kinds of reasons for why this is the case. In this sense, a bit over a decade of negative performance of BTAL is concerning but I wonder if we might see a reversal some day. If the factor strategy is correct, being short high vol and long low vol would be the strategy to use
I totally agree!