When it comes to all of the available factor investing strategies, I believe Minimum Volatility reigns supreme as the best equity strategy of them all.
And that’s definitely a contrarian opinion.
Most factor strategies revolve around “value” or “momentum” or “multi-factor” for those interested in pursuing the highest possible returns.
Heck, there are considerably more dividend seeking “yield” factor investors than there are low volatility geeks out there.
And we haven’t even discussed the crowd that prefers “growth at a reasonable price” or “shareholder yield”.
You’ve also got a sizeable crowd that covets “size” above all else hanging out in small-cap value territory or picking micro-stocks.
In many regards Minimum Volatility is the forgotten equity factor strategy but I’m going to present a case as to why it’s underrated.

Distinguishing Between Minimum Volatility and Low Volatility Strategies

One of the most confusing aspects for factor investors is the distinction between minimum volatility and low volatility equity strategies.
Low volatility indices specifically seek the “least volatile stocks” whereas minimum volatility indices deploy an optimization-based approach to assemble the “least volatile portfolio” possible according to S&P Global.
Huh?
Still a bit confused?
I hear you!
Let’s attempt to explain things a little more clearly.
Low Volatility strategy = ONLY low volatility stocks.
Minimum Volatility strategy = LEAST volatile portfolio.
In other words, a Low Volatility equity strategy will only contain low volatility stocks whereas a Minimum Volatility approach utilizes mean variance optimization that may potentially contain volatile stocks if they have low correlation with other stocks.
A Low Volatility approach is NOT complex given it just selects stocks from a given universe that have lower standard deviation irregardless of sector weights.
A Minimum Volatility approach is HIGHLY complex as it first determines the historical return volatilities and correlations of all the stocks before optimizing based on constructing the least volatile portfolio with sector and individual weighting caps as further considerations.
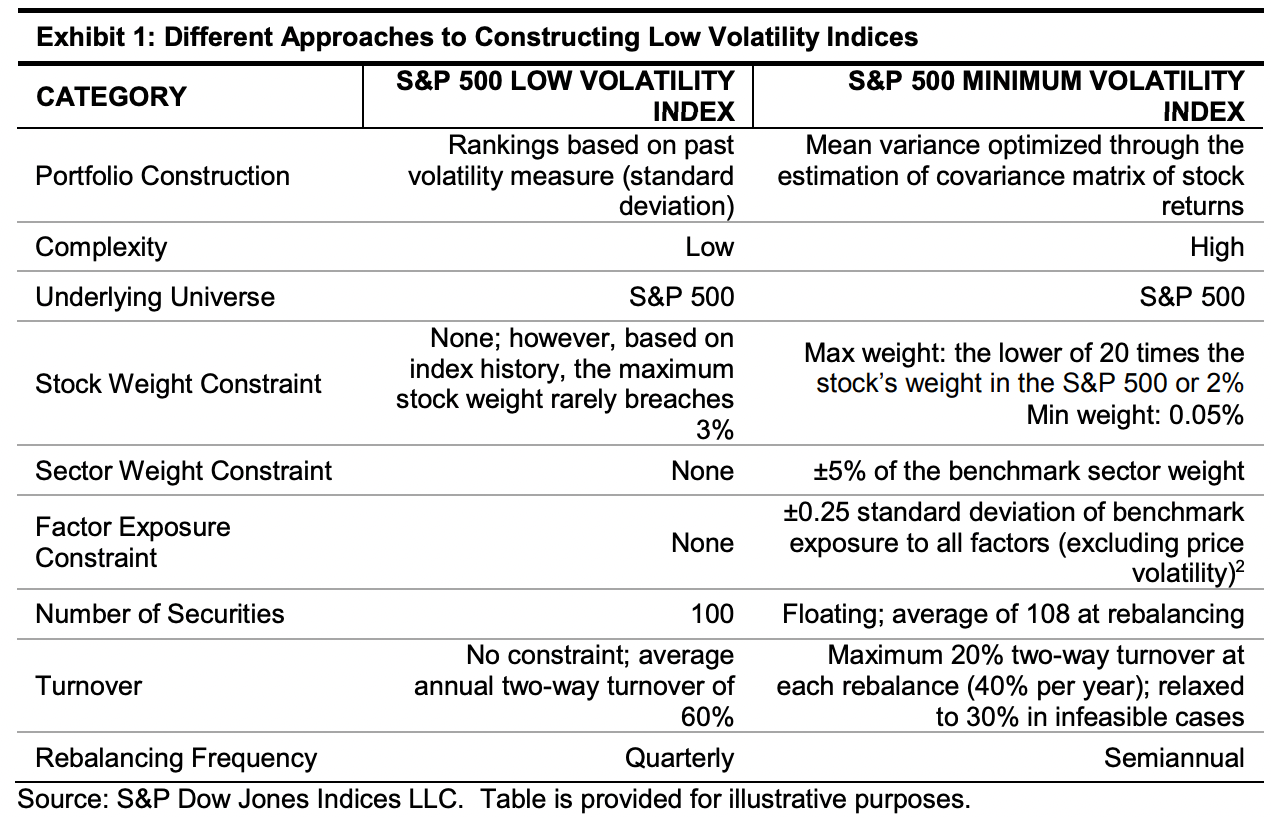
They’re two different approaches (rankings based on past volatility vs mean variance optimization) but with the same explicit goal of constructing a more defensive portfolio of equities compared to the market-cap weighted parent index.
For the purposes of this article I’ll be using “low volatility” and “minimum volatility” and “defensive equity” somewhat interchangeably, so I apologize in advance for that.

Hey guys! Here is the part where I mention I’m a travel content creator as my day job! This investing opinion blog post is entirely for entertainment purposes only. Most investors should not use leverage in any way, shape or form. There could be considerable errors in the data I gathered. This is not financial advice. Do your own due diligence and research. Consult with a financial advisor.

These asset allocation ideas and model portfolios presented herein are purely for entertainment purposes only. This is NOT investment advice. These models are hypothetical and are intended to provide general information about potential ways to organize a portfolio based on theoretical scenarios and assumptions. They do not take into account the investment objectives, financial situation/goals, risk tolerance and/or specific needs of any particular individual.
6 Reasons Low Volatility and Minimum Volatility Equity Strategies Are The Best

1/ Unsexy Narrative: “Lower Highs and Lower Lows” Of Min Vol

You won’t find a more unsexy narrative than what Minimum Volatility and Low Volatility strategies espouse by offering “lower highs” and “lower lows”.
In many ways it’s the boring factor.
For every concentrated fund that centres around technology stocks with a narrative that these companies are going to change the world you’ll find basically the exact opposite story with minimum volatility funds.
They tend to be stable companies that have been kicking around for a long-time and often are in sectors that aren’t as exciting.
It’s like the difference between the flamboyant, wild and volatile boyfriend/girlfriend versus the steady partner that is reliable, predictable and stable.
Just consider the stocks of a fund like ARK Innovation ETF versus USMV iShares MSCI USA Min Vol Factor ETF as the ultimate comparison and contrast.
ARK Innovation ETF – Top 10 Positions
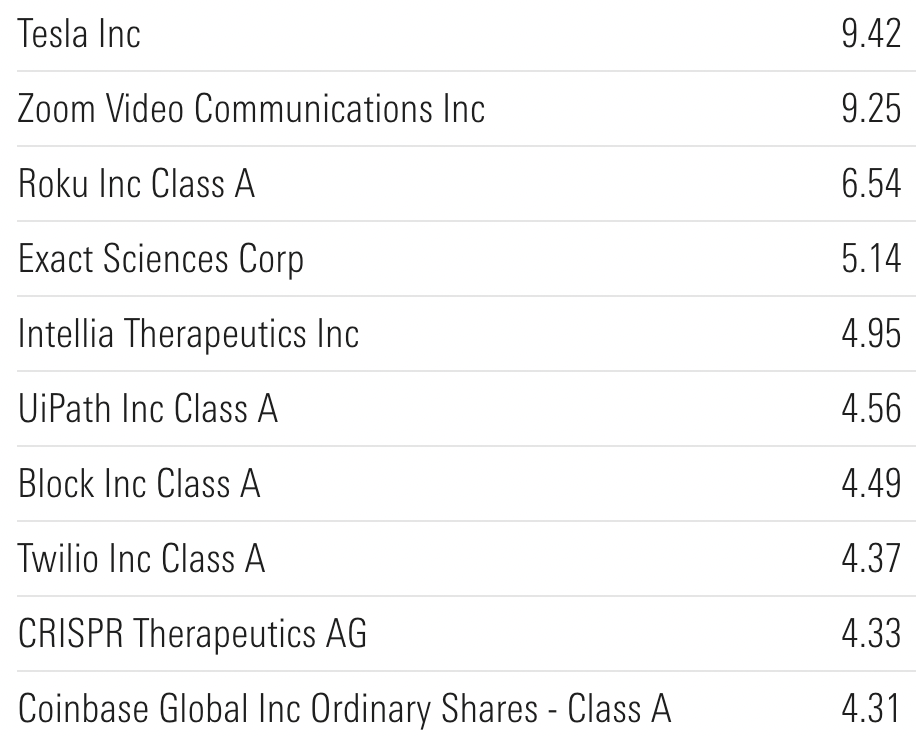
Here we’ve got all of the shiny objects to dazzle investors from head to toe with Tesla, Coinbase, Zoom and Roku.
Forget valuations, fundamentals or factors – these companies are going to change the world!

USMV USA Minimum Volatility ETF – Top 10 Positions
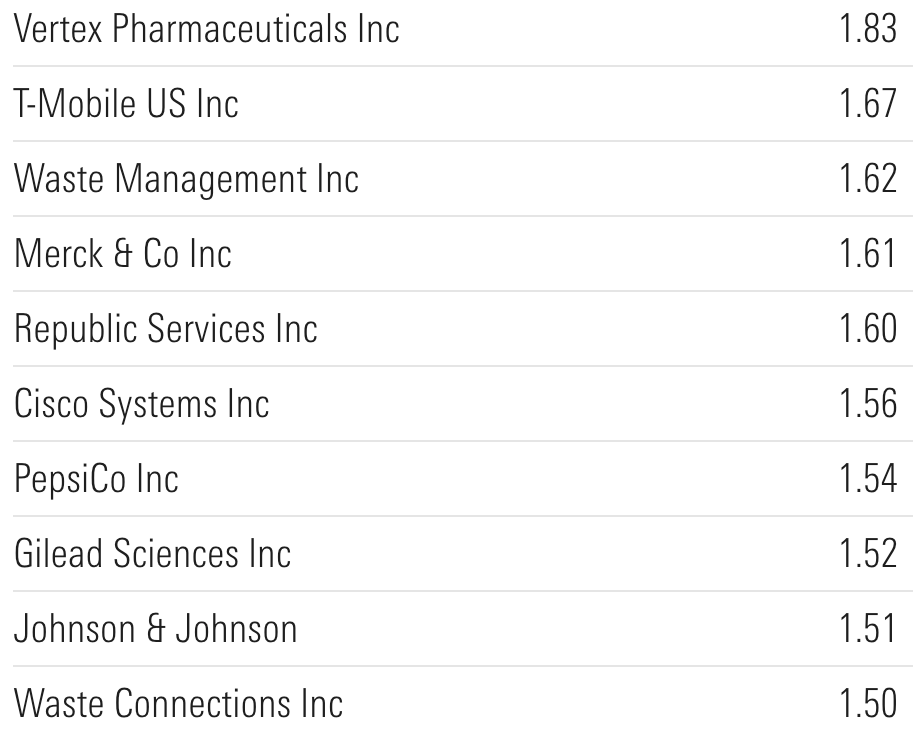
Now contrast that with UMSV ETF where we have holdings such as Waste Management Inc and Waste Connections Inc.
Garbage, anyone?
How is one to spin a spiderweb around earth shattering companies like those!
It’s rather tricky to say the least.
And then you also have stalwart companies such as Pepsi, Gilead Sciences Inc and Johnson & Johnson that have likely been in existence since you were born.
The lack of “new shiny objects” to bedazzle and tickle your every fancy whilst throwing glitter up into the air is clearly lacking with the low volatility strategy.
Now let’s consider the sectors each fund covers.
ARK Innovation Sector Exposure
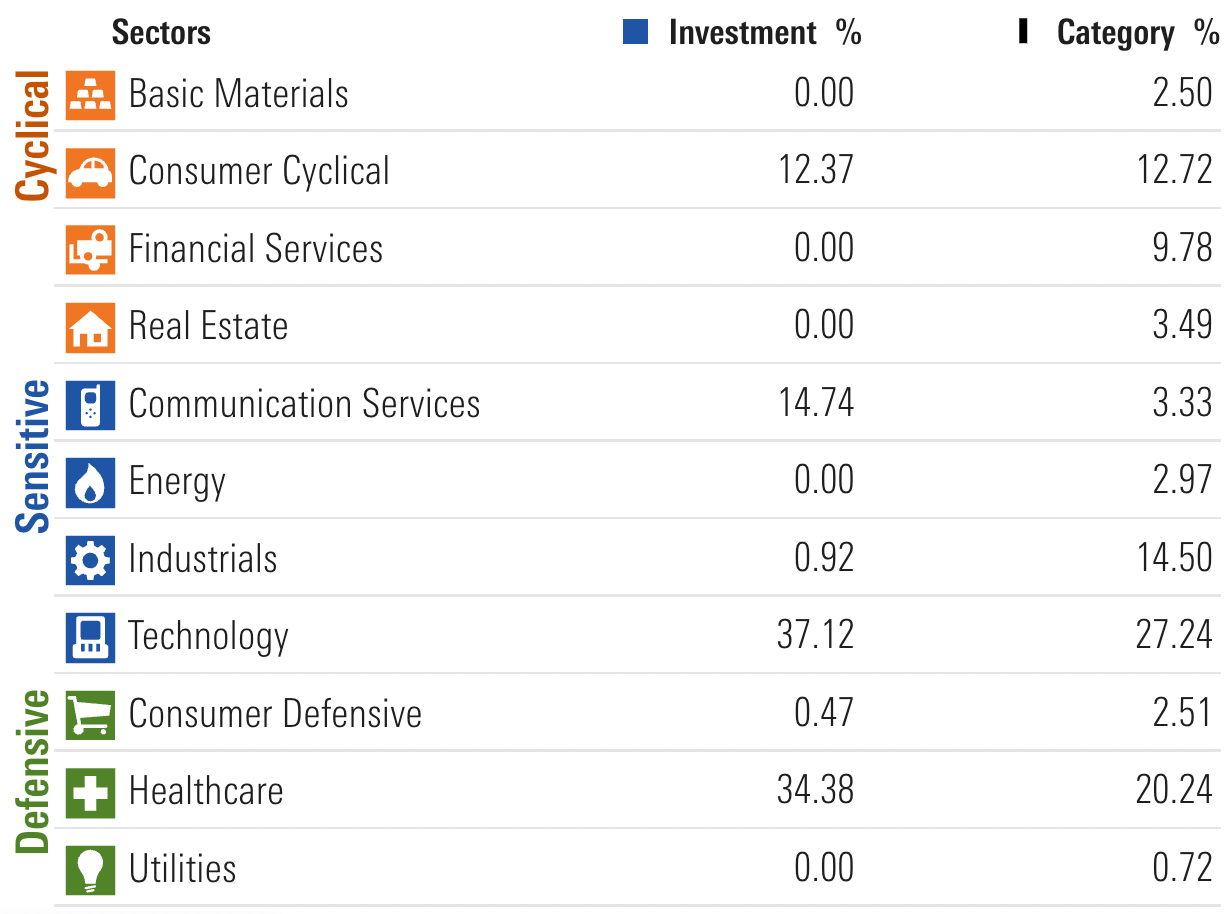
It’s no surprise that ARK Innovation ETF is overweight Technology versus a market cap weighted benchmark with outsized exposure to Healthcare and Communication Services as well.
It’s noteworthy for what it excludes entirely such as defensive sectors, utilities and consumer defensive stocks.
USMV USA Minimum Volatility ETF Sector Exposure
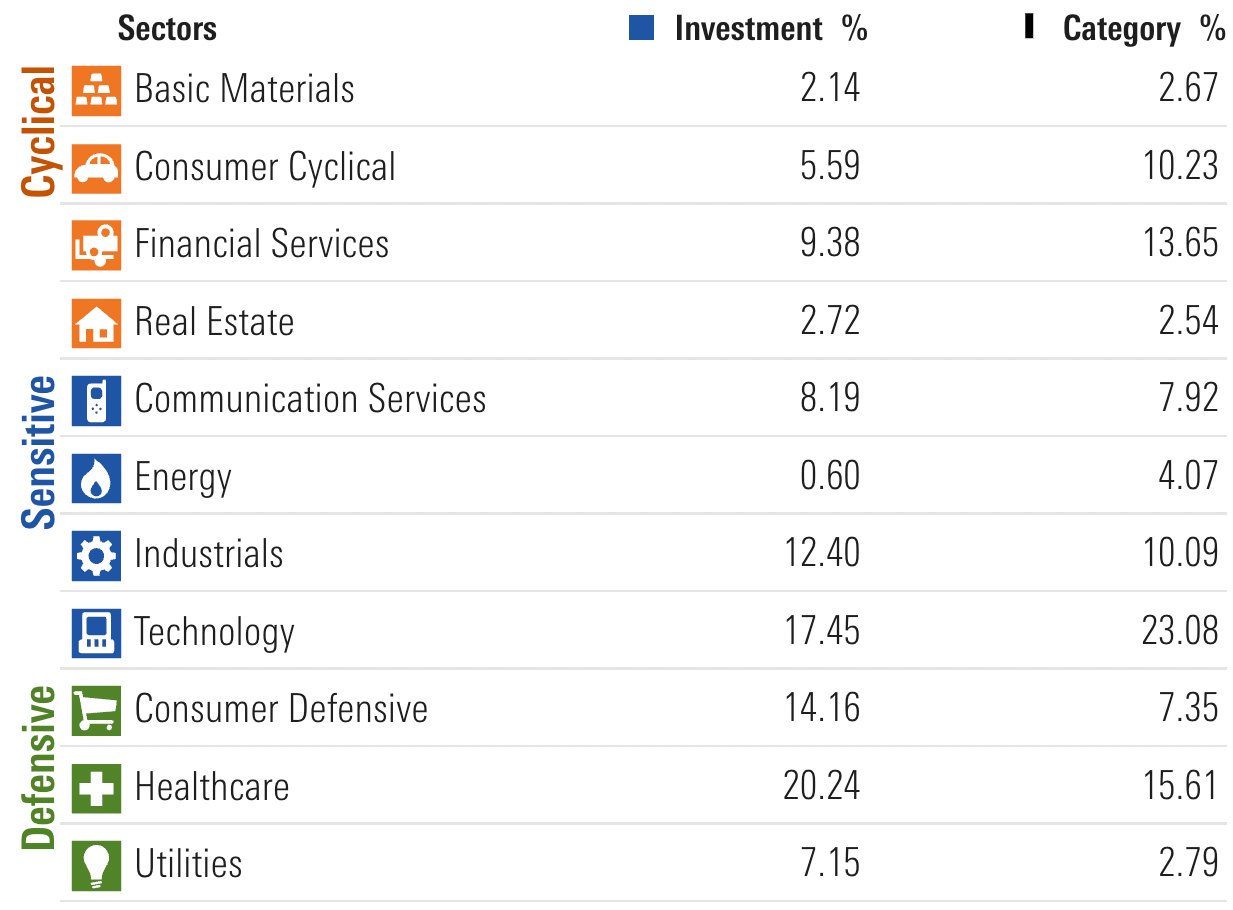
US Minimum Volatility ETF is underweight technology, consumer cyclical and financial services while being overweight defensive sector equities across the board including outsized allocations to utilities, healthcare and consumer defensive.
It includes allocations to every available sector with energy, basic materials and REITs at the bottom of the barrel.
It’s safe to say Minimum Volatility and Low Volatility investing strategies are indeed “boring” in comparison to other strategies which is a competitive advantage in my opinion.

2/ Min Vol Helps You Tame Your Equity Sleeve
For most investors it is the equity sleeve of their portfolio that is most responsible for driving returns but at the cost of being considerably volatile.
Consider the following asset classes: US Large Cap Equities vs 10 Year Treasury from 1972 until 2022
US Large Cap vs 10-Year Treasury Returns and Risk
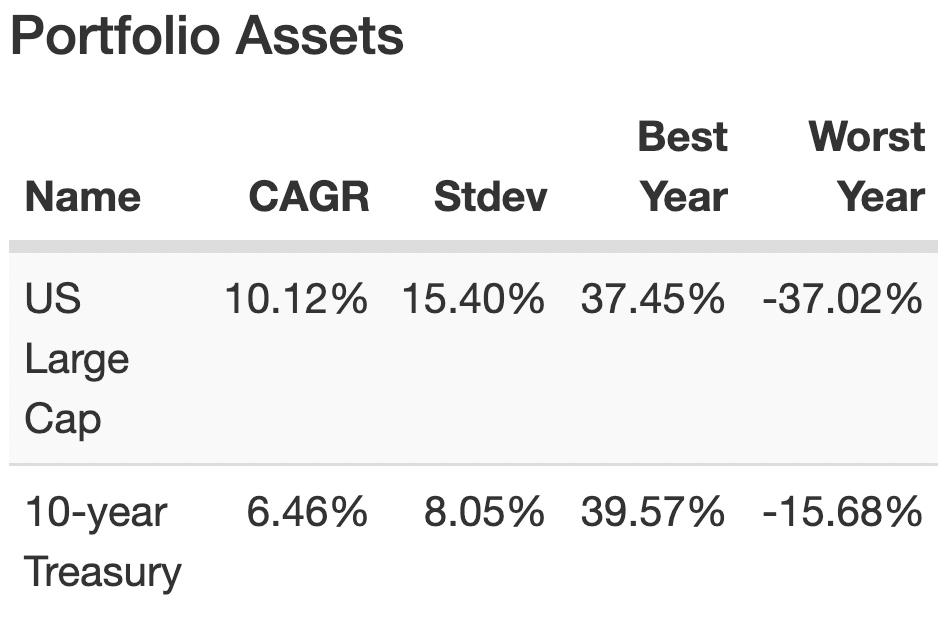
Now let’s imagine we combine these two assets to create a 60/40 portfolio.
It’s obvious that US Large Cap Equities provides more impressive performance with a 10.12% CAGR yet comes with a RISK of 15.40% Standard Deviation.
On the other hand, we’ve got the 10 Year Treasury offering more muted performance with a 6.46% CAGR but offering far more stability with a RISK of 8.05% Standard Deviation.
If we’re to consider the risk each asset class contributes to the overall stability of the portfolio we notice the following:
US Large Cap vs 10-Year Treasury 60/40 Portfolio Risk Decomposition
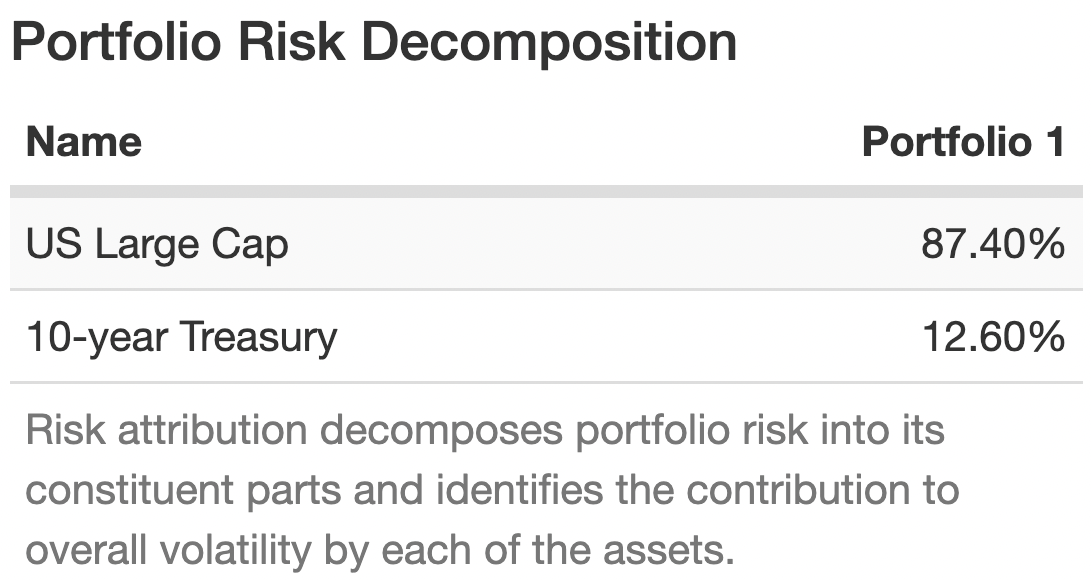
Given that Market-Cap Weighted Indexes such as the S&P 500 are considerably more volatile than Treasuries the “60” part of the 60/40 portfolio accounts for 87.40% of the risk/volatility.
But what if we could keep the same performance of the market-cap weighted indexes but reduce its overall volatility?
Does that sound too good to be true?
After-all, aren’t we compensated with higher returns as investors for taking on more risk?
Well, the superpower of minimum volatility and low volatility investing is that historically they’ve provided market cap weighted like returns (or better) with typically 400 to 500 basis points more stability in terms of standard deviation.
For instance, consider the MSCI World Minimum Volatility index versus its parent Market Cap Weighted index.

MSCI World Minimum Volatility Index vs MSCI World MCW Index
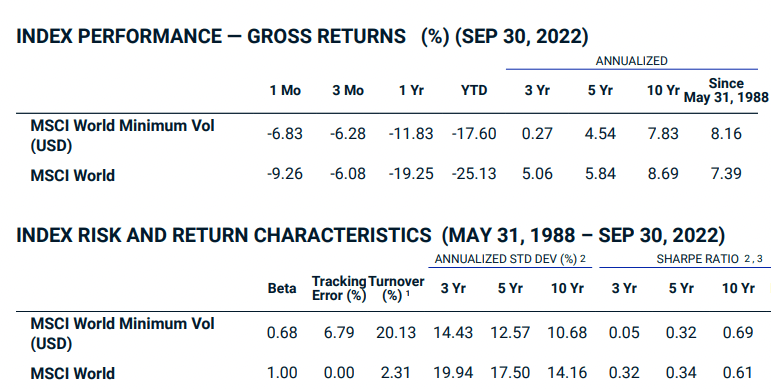
Here you’ll notice that the MSCI World Minimum Volatility Index has outperformed its parent index since inception with Annualized returns of 8.16% vs 7.39%.
However, the 76 basis points of excess returns pales in comparison to its defensive qualities where it has offered 10.68% standard deviation over the past decade versus the market cap weighted index coming in at 14.16%.
Offering 348 basis points of volatility management outperformance reduces the overall risk of your portfolio at large.
Moreover, you don’t sacrifice returns in the process.
That’s a win-win scenario in my books.
Here is a big-picture view versus other World factor strategies.

World Minimum Volatility Annualized Returns and Annualized Risk vs Other Factors
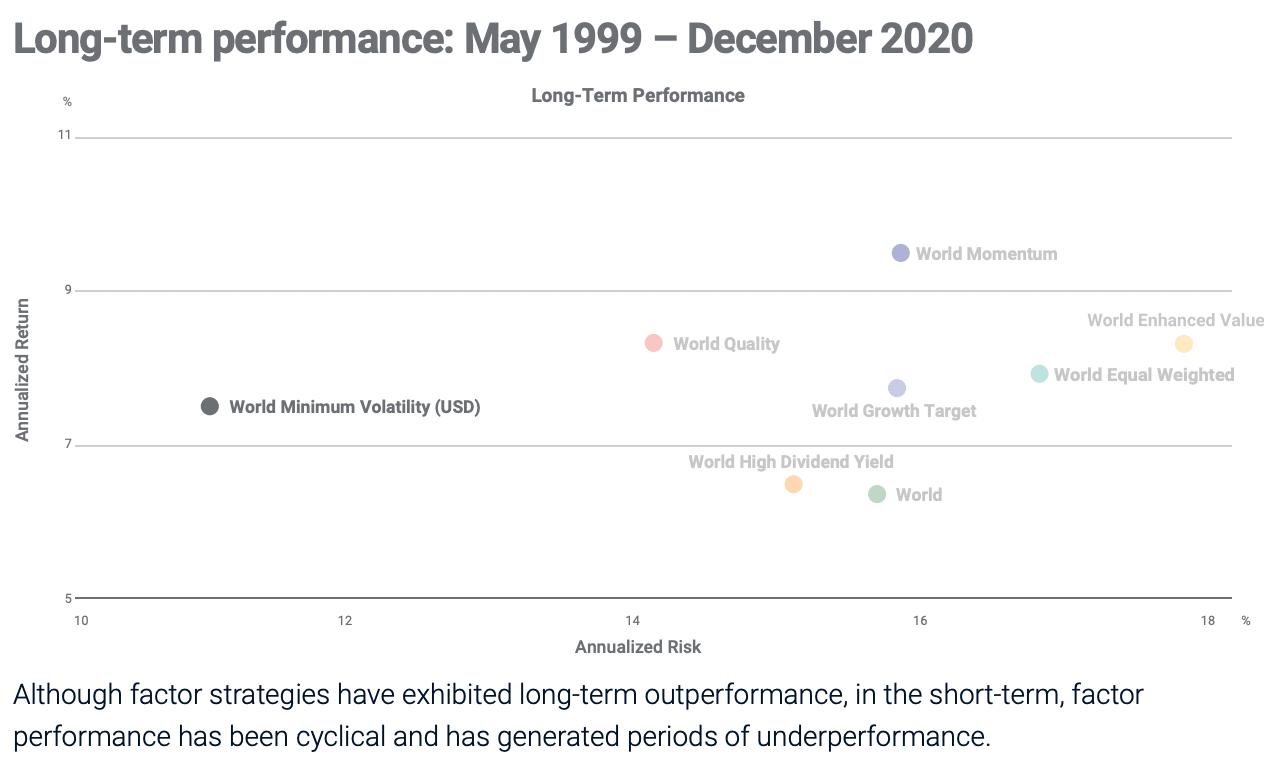
Minimum Volatility is in a league of its own when it comes to its defensive capabilities compared to other equity factor strategies.
Indeed, it does not drive the overall long-term returns of strategies such as Momentum and Value but it offers solid stable returns relative to the pack.
No other factor strategy even comes close to managing volatility as they’re all 300+ basis points more risky.

3/ Min Vol Outperforms When You Need It The Most
So we’re aware at this point that Minimum Volatility strategies perform as well (or better) than their market cap weighted parent indexes while providing 100s of basis points of bonus defensive coverage.
However, it’s not merely the fact that Low Volatility strategies are better at managing risk but it’s when they’re defensive that matters more than anything else.
It’s typically when “shit hits the fan” and markets are in turmoil or in severe drawdown that Minimum Volatility strategies are at their relative best.
And by “relative best” I mean that they may still be below water but they’re often grinding out wins versus their parent index by simply losing less.
I’m a firm believer that one of the most underrated investing skills is the ability to celebrate losing less.
We’re often thrilled when our strategies outperform but how often do we celebrate when we’ve contained our wounds better than others?
Let’s go back to the MSCI World Minimum Volatility Index versus its parent index to compare results during challenging market years.
MSCI World Minimum Volatility Index vs MSCI World Parent Index Annual Performance
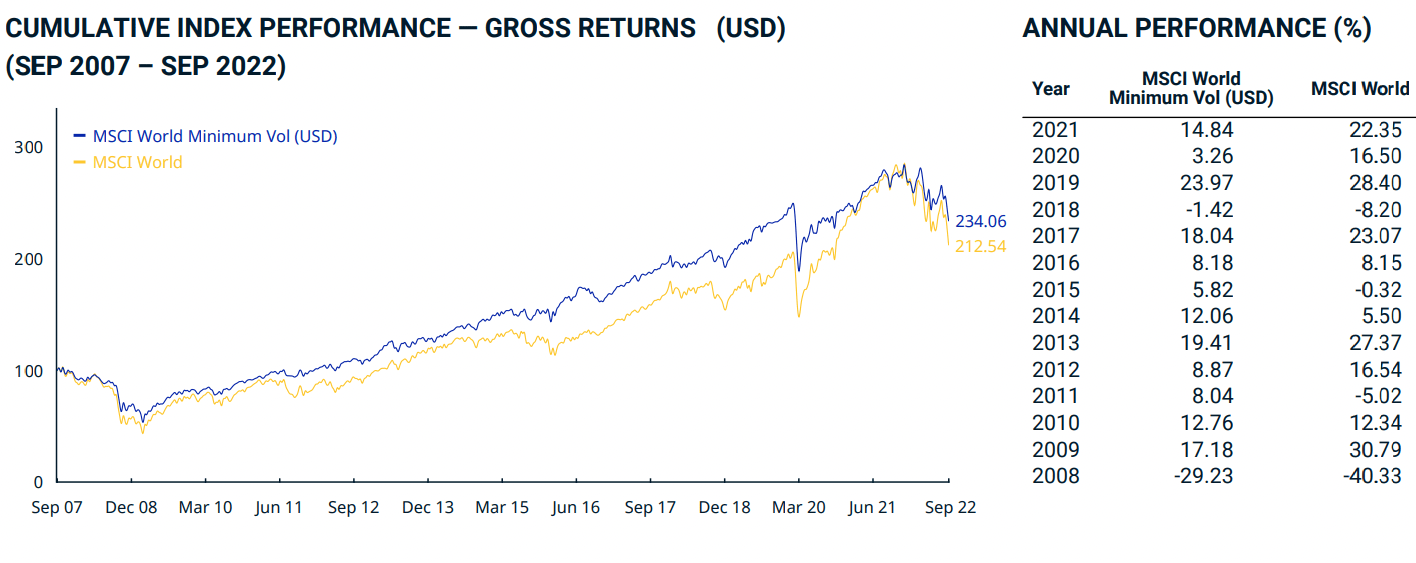
Feast your eyes upon the following years when markets were below water:
2008: -40.33% (MSCI World) vs -29.23% (MSCI Min Vol)
2011: -5.02% (MSCI World) vs +8.04% (MSCI Min Vol)
2015: -0.32% (MSCI World) vs +5.82% (MSCI Min Vol)
2018: -8.20% (MSCI World) vs -1.42% (MSCI Min Vol)
Notice any pattern here?
Without fail the Minimum Volatility strategy outperformed during challenging market years versus its parent index and often did so by over 1000+ basis points!
However, there is no free lunch with this strategy and with that in mind let’s consider the top four annual returns for the World Market Cap Weighted Parent Index.
2009: 30.79% (MSCI World) vs 17.18% (MSCI Min Vol)
2013: 27.37% (MSCI World) vs 19.41% (MSCI Min Vol)
2017: 23.07% (MSCI World) vs 18.04% (MSCI Min Vol)
2019: 28.40% (MSCI World) vs 23.97% (MSCI Min Vol)
Remember when I first suggested that Minimum Volatility is the boring factor?
Lower lows.
Lower highs.
Here is proof of that.
The four strongest years of returns for the World Market Cap Weighted parent index meant that the World Min Vol rode its coattails each and every time.
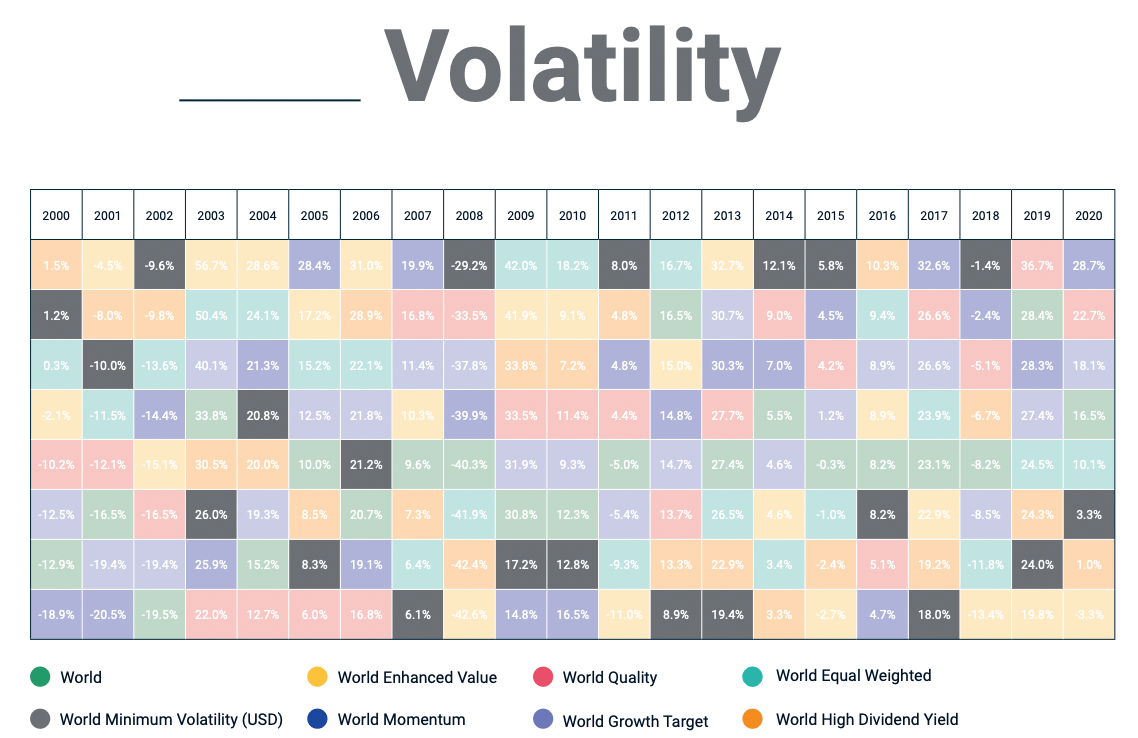
Here you can see how Global Minimum Volatility has performed annually versus all other factor strategies including High Dividend Yield, Equal Weighted, Growth, Quality, Momentum, Value and Market-Cap Weighted indexes.
During the early 2000s it proved its defensive capabilities by 1st, 2nd and 3rd relative to all other factors.
During the Great Financial Crisis it was the most defensive of them all.
And during a year such as 2013 it was in last place when the top equity factor strategy had positive returns of 32.7%.

4/ Min Vol Barbell Strategy With Other Factor Strategies
As a “defensive factor” Minimum Volatility equity strategies pair beautifully with “Momentum” and “Value” factor optimization.
Why?
Because Value is a “Cyclical” factor whereas Momentum is a “Persistence” factor.
Hence, given they perform well during different stages of the market cycles they’re far less correlated to one another than say Min Vol is to Yield and Quality which are also “defensive” factor strategies.
Minimum Volatility as a Defensive Factor vs Momentum as Persistence and Value as Pro-Cyclical
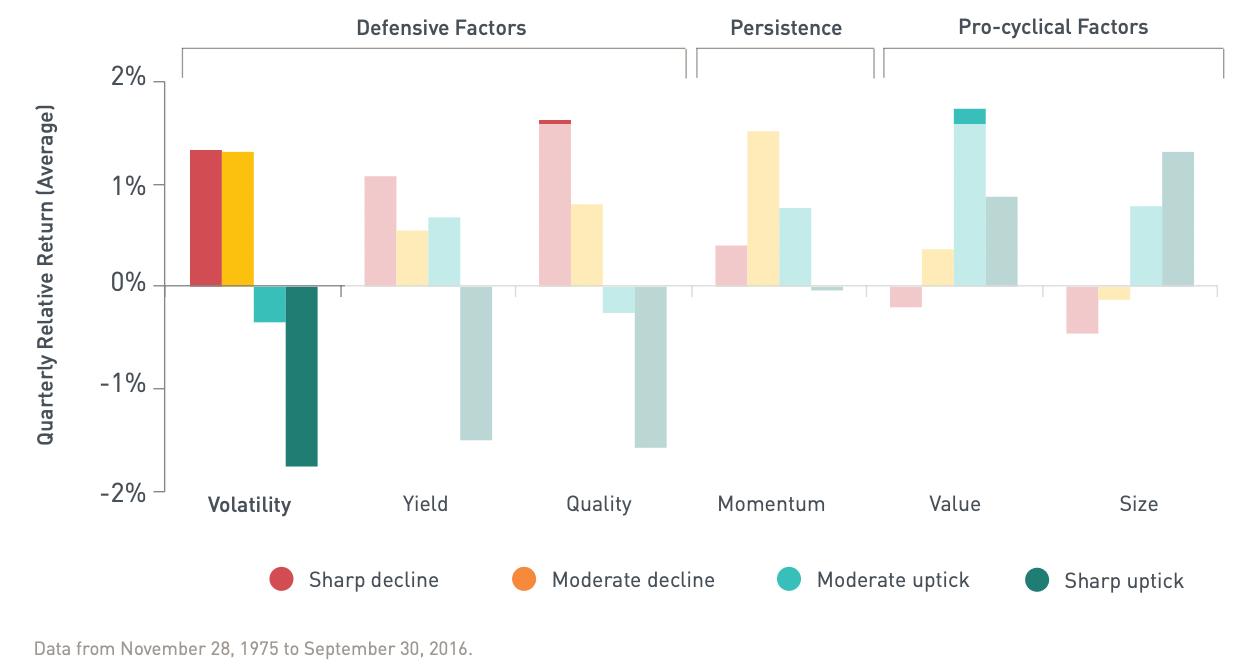
If your equity sleeve was 60% a 20% Minimum Volatility + 20% Value + 20% Momentum factor pairing would cover all of your bases in terms of being prepared for every economic cycle.
If you were seeking more defensive coverage you could skew to 40% Minimum Volatility + 10% Value + 10% Momentum.
Or you could just be all out defensive by combining Minimum Volatility with Yield and Quality strategies.
The beauty of factor strategies is that they mix and match so well together by smoothing out returns (and providing unique rebalancing opportunities) when one is clearly outperforming the other and vice versa.

5/ Min Vol Has Often Outperformed Market Cap Weighted Indexes
We’ve already established that World Minimum Volatility strategies outperform their parent market cap weighted index.
But how about when we narrow things down by region and country?
Do Low Volatility strategies still outperform then?
Let’s find out.
Emerging Markets Minimum Volatility Index vs EM Parent Index
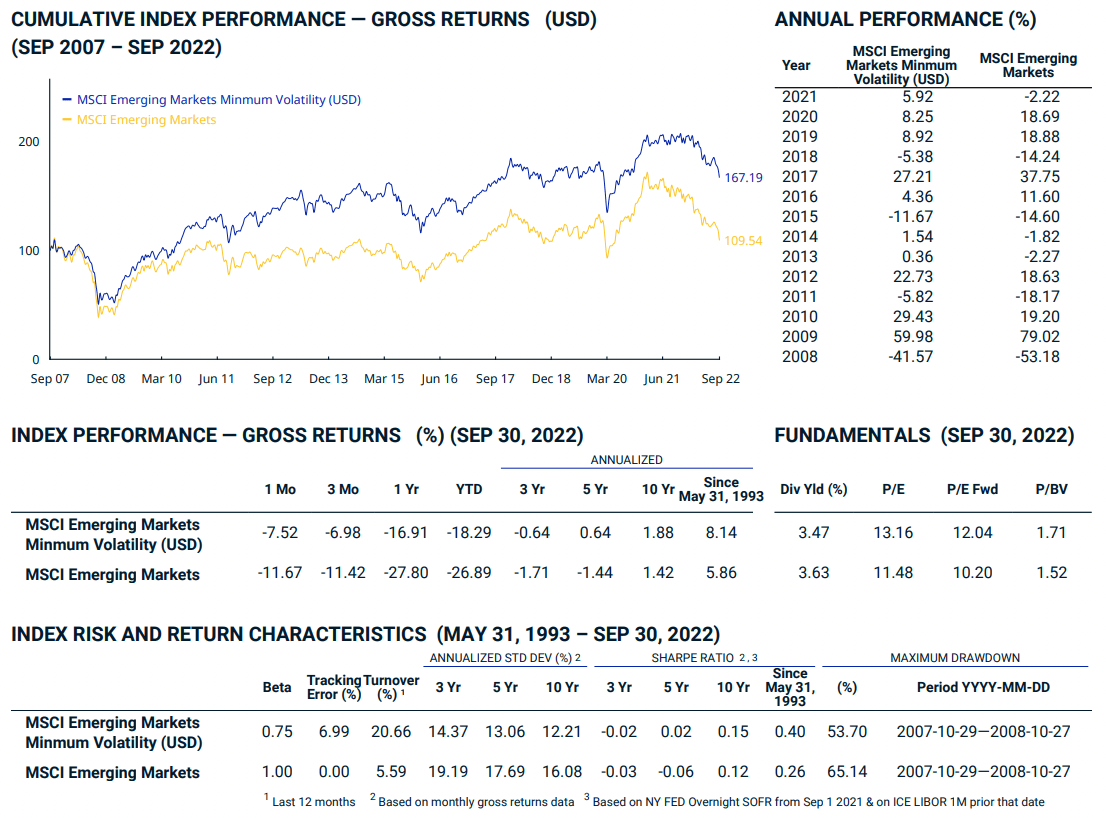
Notice how the Emerging Markets Minimum Volatility index absolutely crushes its parent index with returns since inception of 8.14% vs 5.86%.
It’s also been the more stable of the two over the past 10 years with a standard deviation of 12.21% vs 16.08%
A convincing win all around for EM Min Vol.
Canada Minimum Volatility Index vs Canada Parent Index
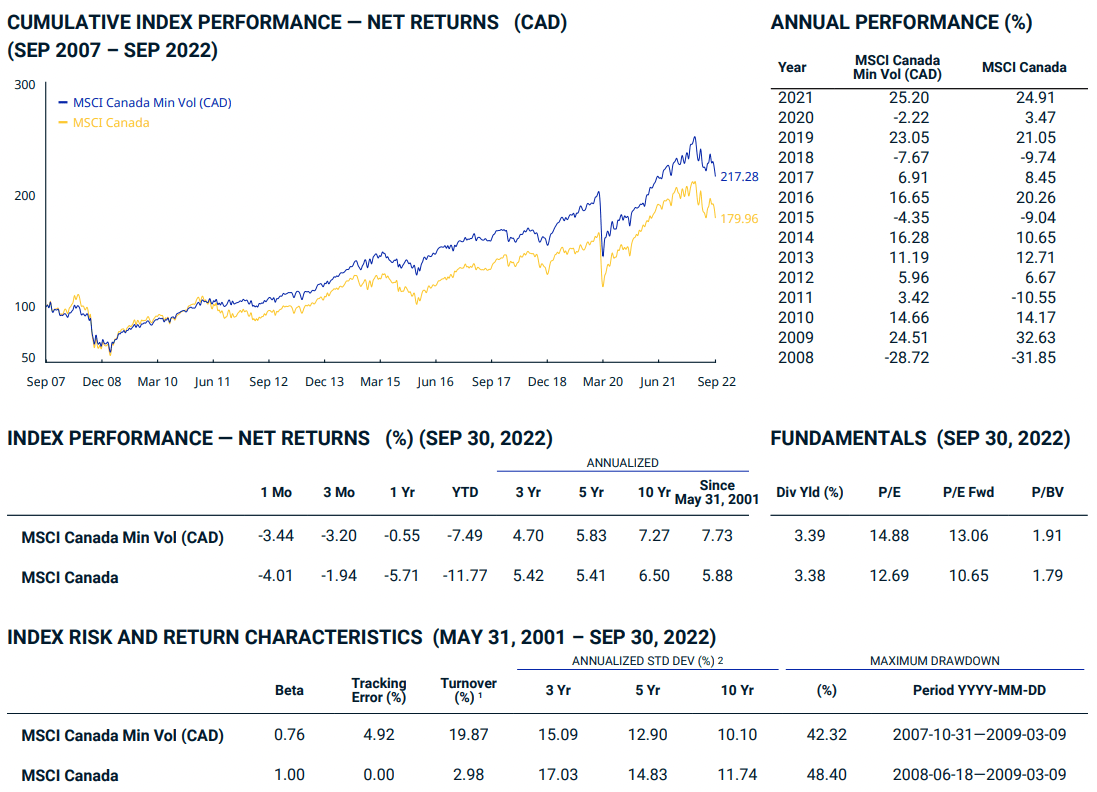
Let’s consider my home country of Canada for Min Vol vs Parent MCW.
Once again, the Canada Minimum Volatility Index soundly defeats its parent index since inception with 7.73% vs 5.88% returns.
Moreover, its volatility management is stellar with 10.10% vs 11.74% during the past 10 years.
It’s fair to suggest that Minimum Volatility is all but guaranteed to provide consistent and considerably superior defensive coverage relative to its MCW parent index and that it’ll often outperform as well in the long-run.
I’ll take that!

6 / Min Vol Offers The Capacity For Leverage With Stability
When I created the Picture Perfect Portfolio as a 180% expanded canvas solution one of my primary concerns was sequence of returns risk.
I wanted to create a robust, resilient and regime ready portfolio that could expertly handle volatility, eat Sharpe Ratios for breakfast and outperform a 60/40 portfolio.
Leverage allowed me to achieve all of the above in a historical backtest.
And the star of the show was World Minimum Volatility equities.
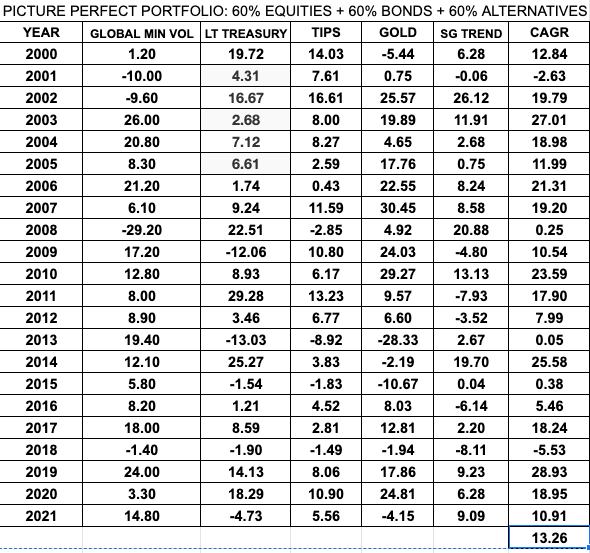
= Parts –> Stocks + Bonds + Alternatives

Picture Perfect Portfolio Composition
60% Equities: 60% MSCI World Minimum Volatility
60% Bonds: 40% Long Term-Treasury and 20% TIPS
60% Alternatives: 40% SG Trend and 20% Gold
You’ll notice that the portfolio is above water 20 out of 22 years and its worst years are extremely palatable at -5.53% and -2.63%.
By having “defensive equities” I can confidently create an expanded canvas portfolio that doesn’t take on too much risk.
In fact, it’s a risk meets returns collision where I’m getting stable annual returns while having a long-term performance of 13.26%.
This isn’t possible with World Market Cap Weighted equities.
Not only would the returns be worse but the volatility management would mean more negative years.
For instance, 2008 and 2015 would be below water annual performance if I was to swap min vol with its parent index.
Minimum Volatility is what allows me to confidently expand the canvas of my portfolio to add uncorrelated asset classes and return streams for a final result that is more impressive than if I just slapped together a sandwich of MCW equities and aggregate bonds.

Nomadic Samuel Final Thoughts
I’m of the firm belief that Minimum Volatility is the most underrated equity factor strategy.
It’s defensive nature is miles ahead of the pack and on top of that it typically outperforms its parent index.
The name of the game for me is to build the most robust, resilient and efficient portfolio possible where returns collide with risk management.
Minimum Volatility and Low Volatility strategies help me get there.
Ah, those lower highs and lower lows.
Gimme some more of the boring factor!
What do you think of these strategies?
Do you have them in your portfolio?
That’s all I’ve got.
Ciao for now!
Important Information
Comprehensive Investment Disclaimer:
All content provided on this website (including but not limited to portfolio ideas, fund analyses, investment strategies, commentary on market conditions, and discussions regarding leverage) is strictly for educational, informational, and illustrative purposes only. The information does not constitute financial, investment, tax, accounting, or legal advice. Opinions, strategies, and ideas presented herein represent personal perspectives, are based on independent research and publicly available information, and do not necessarily reflect the views or official positions of any third-party organizations, institutions, or affiliates.
Investing in financial markets inherently carries substantial risks, including but not limited to market volatility, economic uncertainties, geopolitical developments, and liquidity risks. You must be fully aware that there is always the potential for partial or total loss of your principal investment. Additionally, the use of leverage or leveraged financial products significantly increases risk exposure by amplifying both potential gains and potential losses, and thus is not appropriate or advisable for all investors. Using leverage may result in losing more than your initial invested capital, incurring margin calls, experiencing substantial interest costs, or suffering severe financial distress.
Past performance indicators, including historical data, backtesting results, and hypothetical scenarios, should never be viewed as guarantees or reliable predictions of future performance. Any examples provided are purely hypothetical and intended only for illustration purposes. Performance benchmarks, such as market indexes mentioned on this site, are theoretical and are not directly investable. While diligent efforts are made to provide accurate and current information, “Picture Perfect Portfolios” does not warrant, represent, or guarantee the accuracy, completeness, or timeliness of any information provided. Errors, inaccuracies, or outdated information may exist.
Users of this website are strongly encouraged to independently verify all information, conduct comprehensive research and due diligence, and engage with qualified financial, investment, tax, or legal professionals before making any investment or financial decisions. The responsibility for making informed investment decisions rests entirely with the individual. “Picture Perfect Portfolios” explicitly disclaims all liability for any direct, indirect, incidental, special, consequential, or other losses or damages incurred, financial or otherwise, arising out of reliance upon, or use of, any content or information presented on this website.
By accessing, reading, and utilizing the content on this website, you expressly acknowledge, understand, accept, and agree to abide by these terms and conditions. Please consult the full and detailed disclaimer available elsewhere on this website for further clarification and additional important disclosures. Read the complete disclaimer here.




Dude, this is awesome