We’ve covered quality, value, minimum volatility, growth at a reasonable price, and wide moat equity optimization strategies on the blog in recent weeks.
It’s now time to turn our attention to perhaps the most potent equity factor strategy of them all.
Momentum.
Momentum factor investing is one of the most misunderstood equity optimization strategies.
Momentum = Recent Winners!
The persistence factor!

It’s the expectation that what’s currently “performing well” will continue to “perform well” into the near future.
Many investors unfortunately confuse it with growth approaches.
Earlier in the year @RyanPKirlin joined us to discuss the differences between momentum investing and growth investing strategies.
I highly encourage you to check that out.
However, the fund we’re reviewing today is none other than iShares MSCI USA Momentum Factor ETF.
Ticker: MTUM ETF
We’ve got a lot to cover so let’s get cracking!

MTUM ETF Review | iShares MSCI USA Momentum Factor ETF Review

Hey guys! Here is the part where I mention I’m a travel blogger, vlogger and content creator! This investing opinion blog post ETF Review is entirely for entertainment purposes only. There could be considerable errors in the data I gathered. This is not financial advice. Do your own due diligence and research. Consult with a financial advisor.
source: Realize Your Retirement YouTube Channel

iShares ETFs: Momentum Factor Funds
iShares is a massive fund provider with a product range that offers close to 400 ETFs.
Hence, we’ll just key in specifically upon the momentum factor products they offer investors.
Momentum ETFs
IMTM ETF – iShares MSCI Intl Momentum Factor ETF
MTUM ETF – iShares MSCI USA Momentum Factor ETF
Right now there are only two funds to consider!
It would be great to see the momentum factor product range from iShares expand to emerging markets and possibly mid-cap and small-cap funds at some point in the future.
For the time being, here are some other momentum funds to consider in alphabetical order.
Momentum ETFs From Other Fund Providers
DUDE ETF – MerlynAI SectorSurfer Momentum ETF
DWAS ETF – Invesco DWA SmallCap Momentum ETF
FDMO ETF – Fidelity Momentum Factor ETF
IMOM ETF – Alpha Architect International Quantitative Momentum ETF
JMOM ETF – JPMorgan US Momentum Factor ETF
PDP ETF – Invesco DWA Momentum ETF
PIE ETF – Invesco DWA Emerging Markets Momentum ETF
PIZ ETF – Invesco DWA Developed Markets Momentum ETF
QMOM ETF – Alpha Architect US Quantitative Momentum ETF
XMMO ETF – Invesco S&P Midcap Momentum ETF
XSMO ETF – Invesco S&P SmallCap Momentum ETF

The Case For Momentum Factor Investing
The case for Momentum factor investing is indeed strong.
First let’s define momentum and discover its potential edge: (source: msci.com)
“The momentum factor refers to the tendency of winning stocks to continue performing well in the near term.
Momentum is categorized as a “persistence” factor i.e., it tends to benefit from continued trends in markets.
The MSCI Momentum Index measures:
• Risk-adjusted excess return – that which exceeds the benchmark – for 6-month periods
• Risk-adjusted excess return – that which exceeds the benchmark – for 12-month periods
“Many studies since then have found the momentum factor present across equity sectors, countries, and more broadly asset classes.
Momentum may not be as well understood as other factors, although various theories attempt to explain it.
- Some postulate that it is compensation for bearing high risk
- Others believe it may be a consequence of market inefficiencies produced by delayed price reactions to firm-specific information.”
Momentum Annual Returns Vs Other Factor Strategies
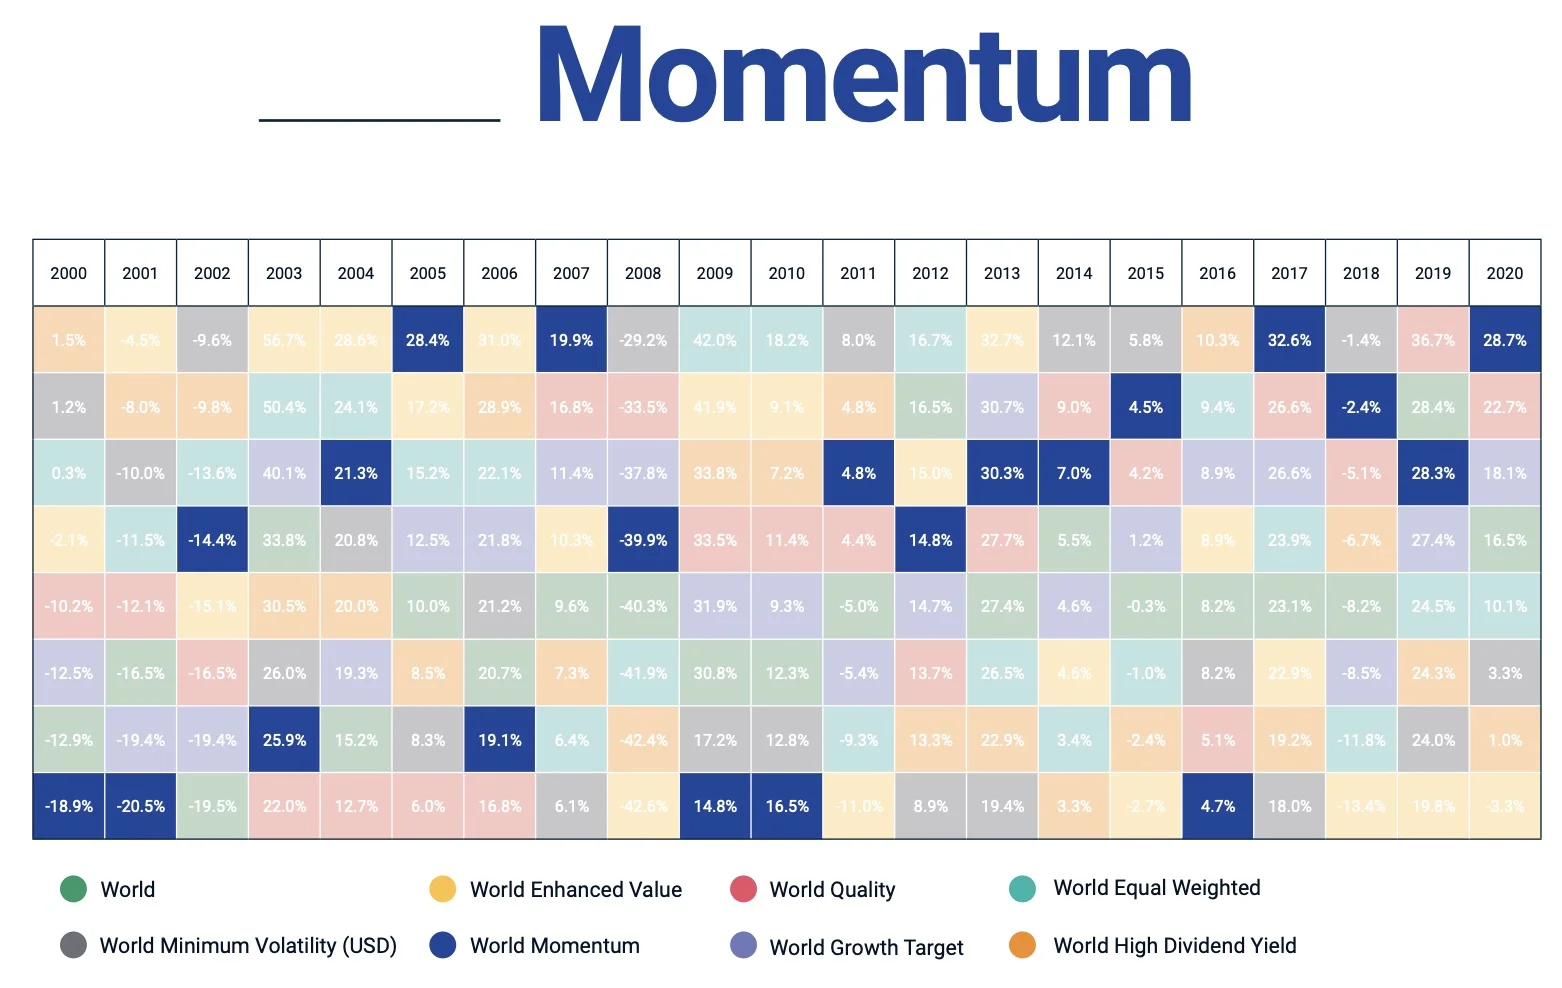
On an annual basis momentum spends a lot of time either at the top or the bottom versus other factor strategies.
From 2000 until 2022 it finished first place four times, second place twice and third place five times.
But it also spent five years at the bottom and twice at second to last place.
Hence, investors need to be aware of its potential to outperform and underperform relative to other factor strategies.
Momentum Long-Term Performance Vs Other Factor Strategies
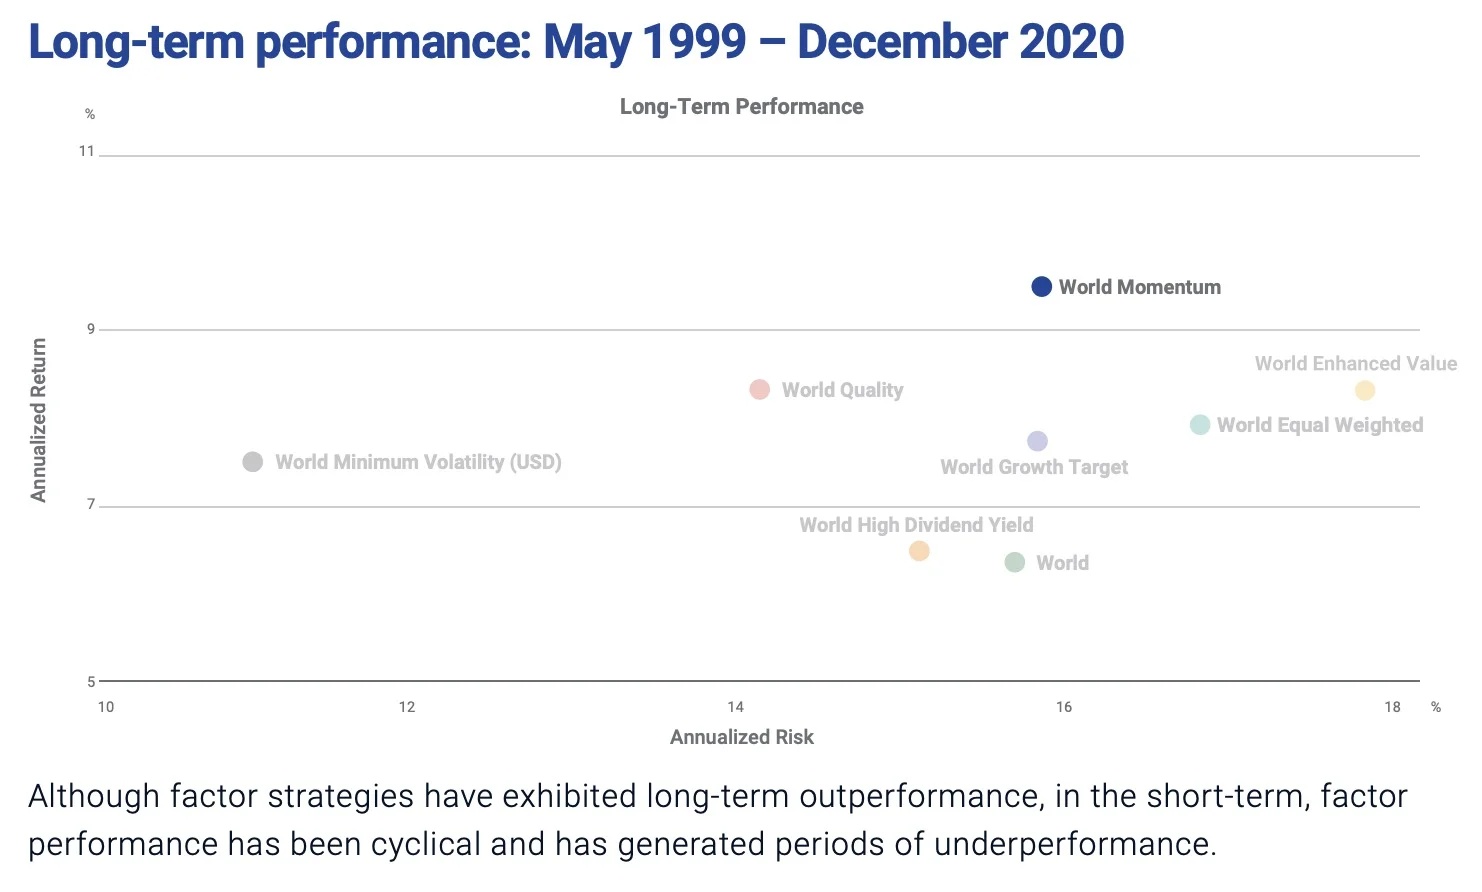
Momentum is the king when it comes to annualized returns in the 21st century!
It triumphs over value, quality and growth!
Momentum World Factor Index Performance Vs Other Factor Strategies
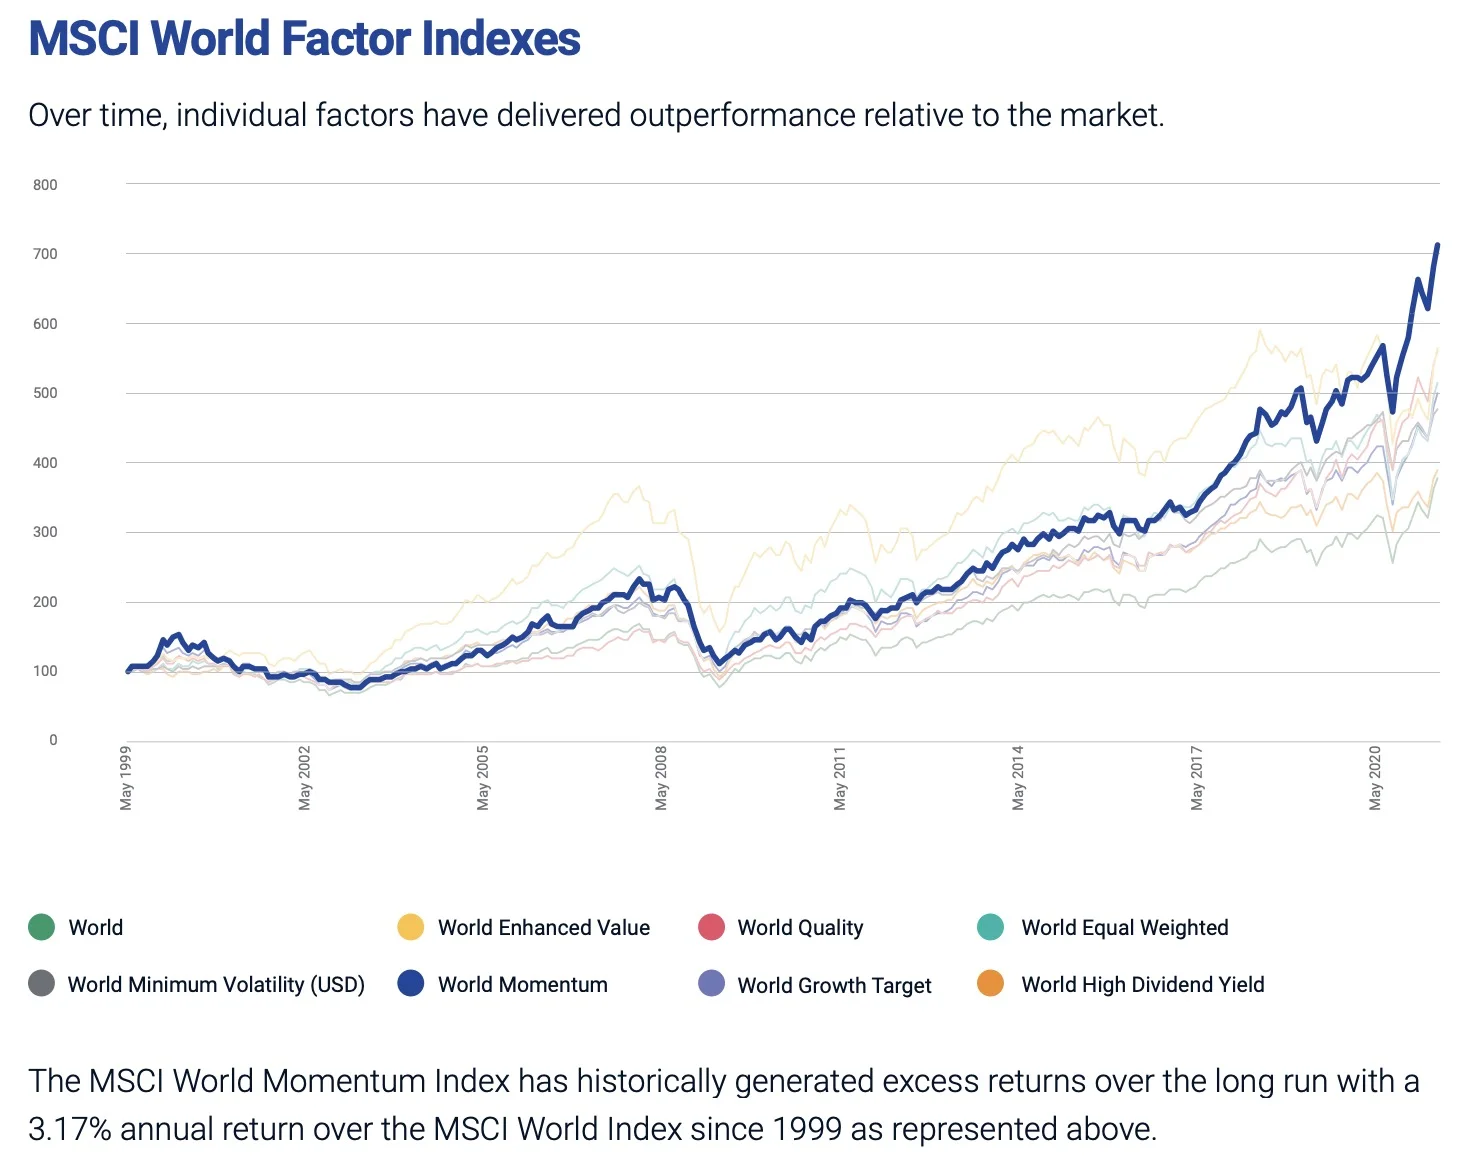
Compared to its parent market cap weighted index, Momentum has outperformed by 317 basis points since 1999!
That’s a massive difference in returns and the primary reason to consider it as a factor strategy for your portfolio.
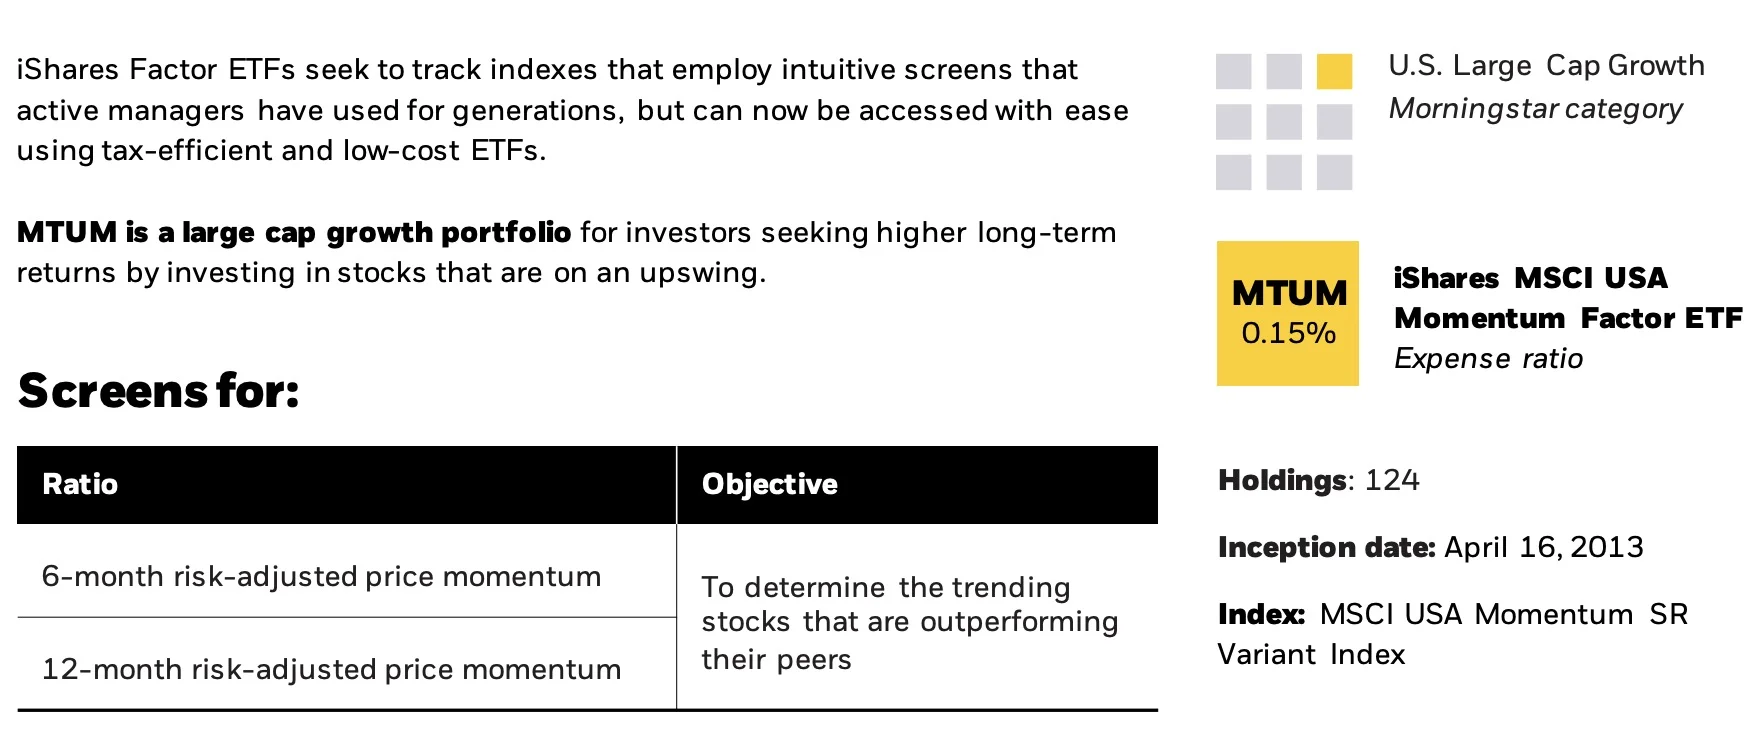

MTUM ETF Overview, Holdings and Info
The investment case for “iShares MSCI USA Momentum Factor ETF ” has been laid out succinctly by the folks over at iShares ETFs: (fund landing page)
Investment Objective:
The iShares MSCI USA Momentum Factor ETF seeks to track the investment results of an index composed of U.S. large- and mid-capitalization stocks exhibiting relatively higher price momentum.
Why MTUM?
1. Exposure to large- and mid-cap U.S. stocks exhibiting relatively higher price momentum
2. Index-based access to a specific factor which has historically driven a significant part of companies’ risk and return1
3. Use to help manage exposure and risk within a stock allocation

MTUM ETF: Security Selection Process
“The Fund seeks to track the investment results of the MSCI USA Momentum SR Variant Index (the “Underlying Index”), which consists of stocks exhibiting relatively higher momentum characteristics than the traditional market capitalization-weighted parent index, the MSCI USA Index (the “Parent Index”), as determined by MSCI Inc. (the “Index Provider” or “MSCI”).

The Parent Index includes U.S. large- and midcapitalization stocks, as defined by MSCI.
The Underlying Index is designed to measure the performance of an equity momentum strategy by emphasizing stocks with high price momentum, while maintaining reasonably high trading liquidity, investment capacity and moderate index turnover, each as determined by
the Index Provider.
The Underlying Index is a variant of the MSCI USA Momentum Index, which employs a different reconstitution process.
All constituent changes due to the semi-annual reconstitution of the Underlying Index are distributed over multiple days leading into the reconstitution effective date with an aim of facilitating easier implementation of the changes resulting from the reconstitution.
A risk-adjusted price momentum metric, defined by MSCI as the excess return over the risk-free rate divided by the annualized standard deviation of weekly returns over the past three years, is calculated for each security in the Parent Index over 6- and 12-month time periods.
The 6- and 12-month risk adjusted price momentum calculations are then standardized at +/- 3 standard deviations and translated into an average momentum score.
The weight of each Underlying Index constituent is determined by multiplying the security’s momentum score by its market capitalization weight in the Parent Index.
Additionally, each individual issuer is capped at 5% at reconstitution.
MSCI uses an algorithm to determine the number of components in the Underlying Index based on the number of constituents in the Parent Index.
The Underlying Index is reconstituted semiannually.
After the constituent changes are determined at each semi-annual reconstitution, the Index Provider distributes those changes over three days (generally, the reconstitution effective date and the two prior business days) to reconstitute the Underlying Index.
As of July 31, 2022, there were 124 securities in the Underlying Index.
As of July 31, 2022, a significant portion of the Underlying Index is represented by securities of companies in the consumer staples, energy and healthcare industries or sectors.
The components of the Underlying Index are likely to change over time.
BFA uses a “passive” or indexing approach to try to achieve the Fund’s investment objective.
Unlike many investment companies, the Fund does not try to “beat” the index it tracks and does not seek temporary defensive positions when markets decline or appear overvalued.
Indexing may eliminate the chance that the Fund will substantially outperform the Underlying Index but also may reduce some of the risks of active management, such as poor security selection.
Indexing seeks to achieve lower costs and better after-tax performance by aiming to keep portfolio turnover low in comparison to actively managed investment companies.
BFA uses a representative sampling indexing strategy to manage the Fund.
“Representative sampling” is an indexing strategy that involves investing in a representative sample of securities that collectively has an investment profile similar to that of an applicable underlying index.
The securities selected are expected to have, in the aggregate, investment characteristics (based on factors such as market capitalization and industry weightings), fundamental characteristics (such as return variability and yield) and liquidity measures similar to those of an applicable underlying index.
The Fund may or may not hold all of the securities in the Underlying Index.
The Fund generally will invest at least 80% of its assets in the component securities of its Underlying Index and in investments that have economic characteristics that are substantially identical to the component securities of its Underlying Index (i.e., depositary receipts representing securities of the Underlying Index) and may invest up to 20% of its assets in certain futures, options and swap contracts, cash and
cash equivalents, including shares of money market funds advised by BFA or its affiliates, as well as in securities not included in the Underlying Index, but which BFA believes will help the Fund track the Underlying Index. Cash and cash equivalent investments associated
with a derivative position will be treated as part of that position for the purposes of calculating the percentage of investments included in the Underlying Index.
The Fund seeks to track the investment results of the Underlying Index before fees and expenses of the Fund.
The Fund may lend securities representing up to one-third of the value of the Fund’s total assets (including the value of any collateral received).
The Underlying Index and Parent Index are sponsored by MSCI, which is independent of the Fund and BFA.
The Index Provider determines the composition and relative weightings of the securities in the Underlying Index and Parent Index and publishes information regarding the market value of the Underlying Index and Parent Index.”
source: prospectus

Momentum Index Key Points
- Screens for highest momentum stocks within the MSCI USA Parent Index featuring large and mid cap stocks
- Equity momentum strategy screens for stocks with high price momentum using 6 and 12 month time periods
- Price Momentum Metric: Excess return over the risk-free rate divided by the annualized standard deviation of weekly returns over the past 3 years over 6 and 12 month time periods
- Momentum score multiplied by market capitalization weight = weight in the index with a 5% cap
- Rebalancing takes place semiannually
MTUM ETF: Holdings
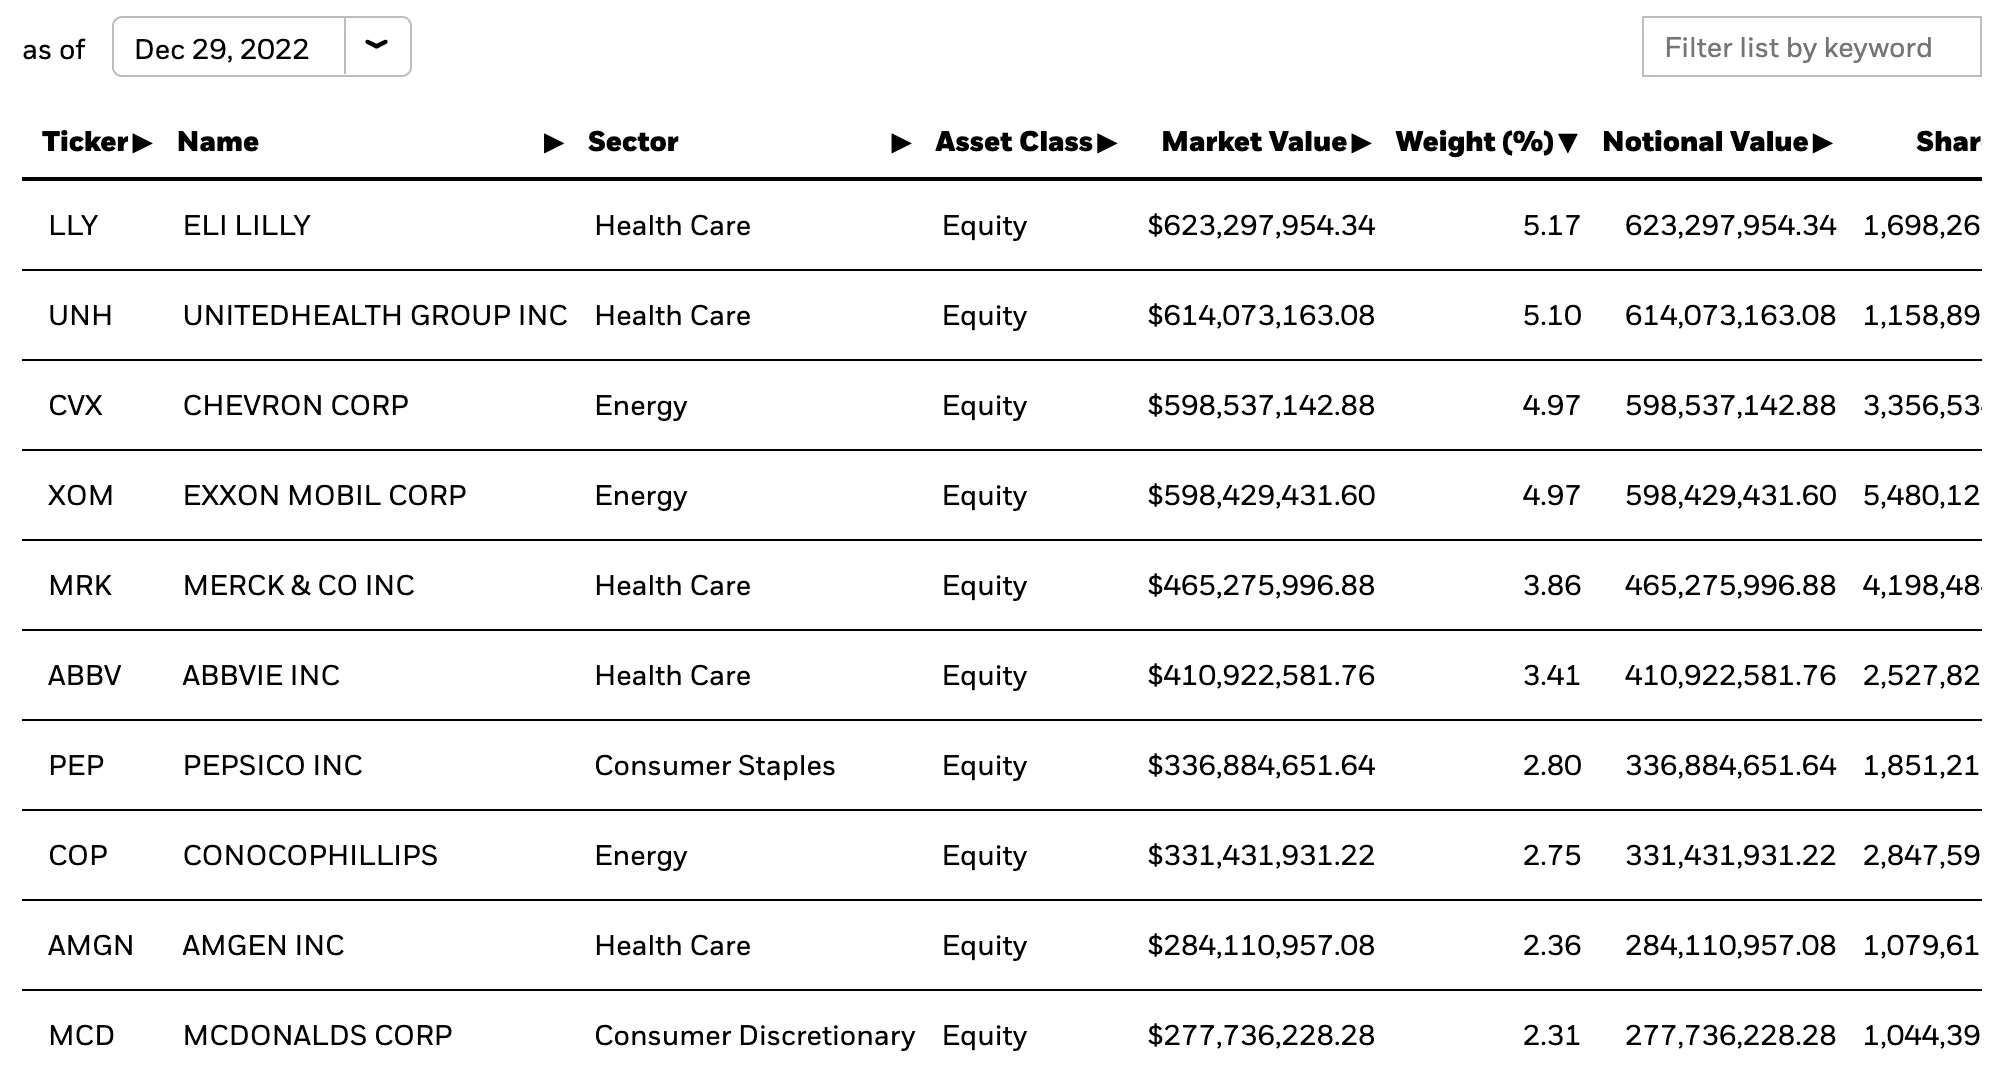
The top 10 positions in MTUM ETF are currently dominated by Health Care (5) and Energy stocks (3).
Pepsico and McDonalds are the only stocks that sneak into the top ten with exposure to Consumer Staples and Consumer Discretionary.
Four companies (Eli Lilly, United Health Group, Chevron and Exxon Mobil) take up over 20% of the fund’s real estate.
MTUM ETF: Sector Exposure
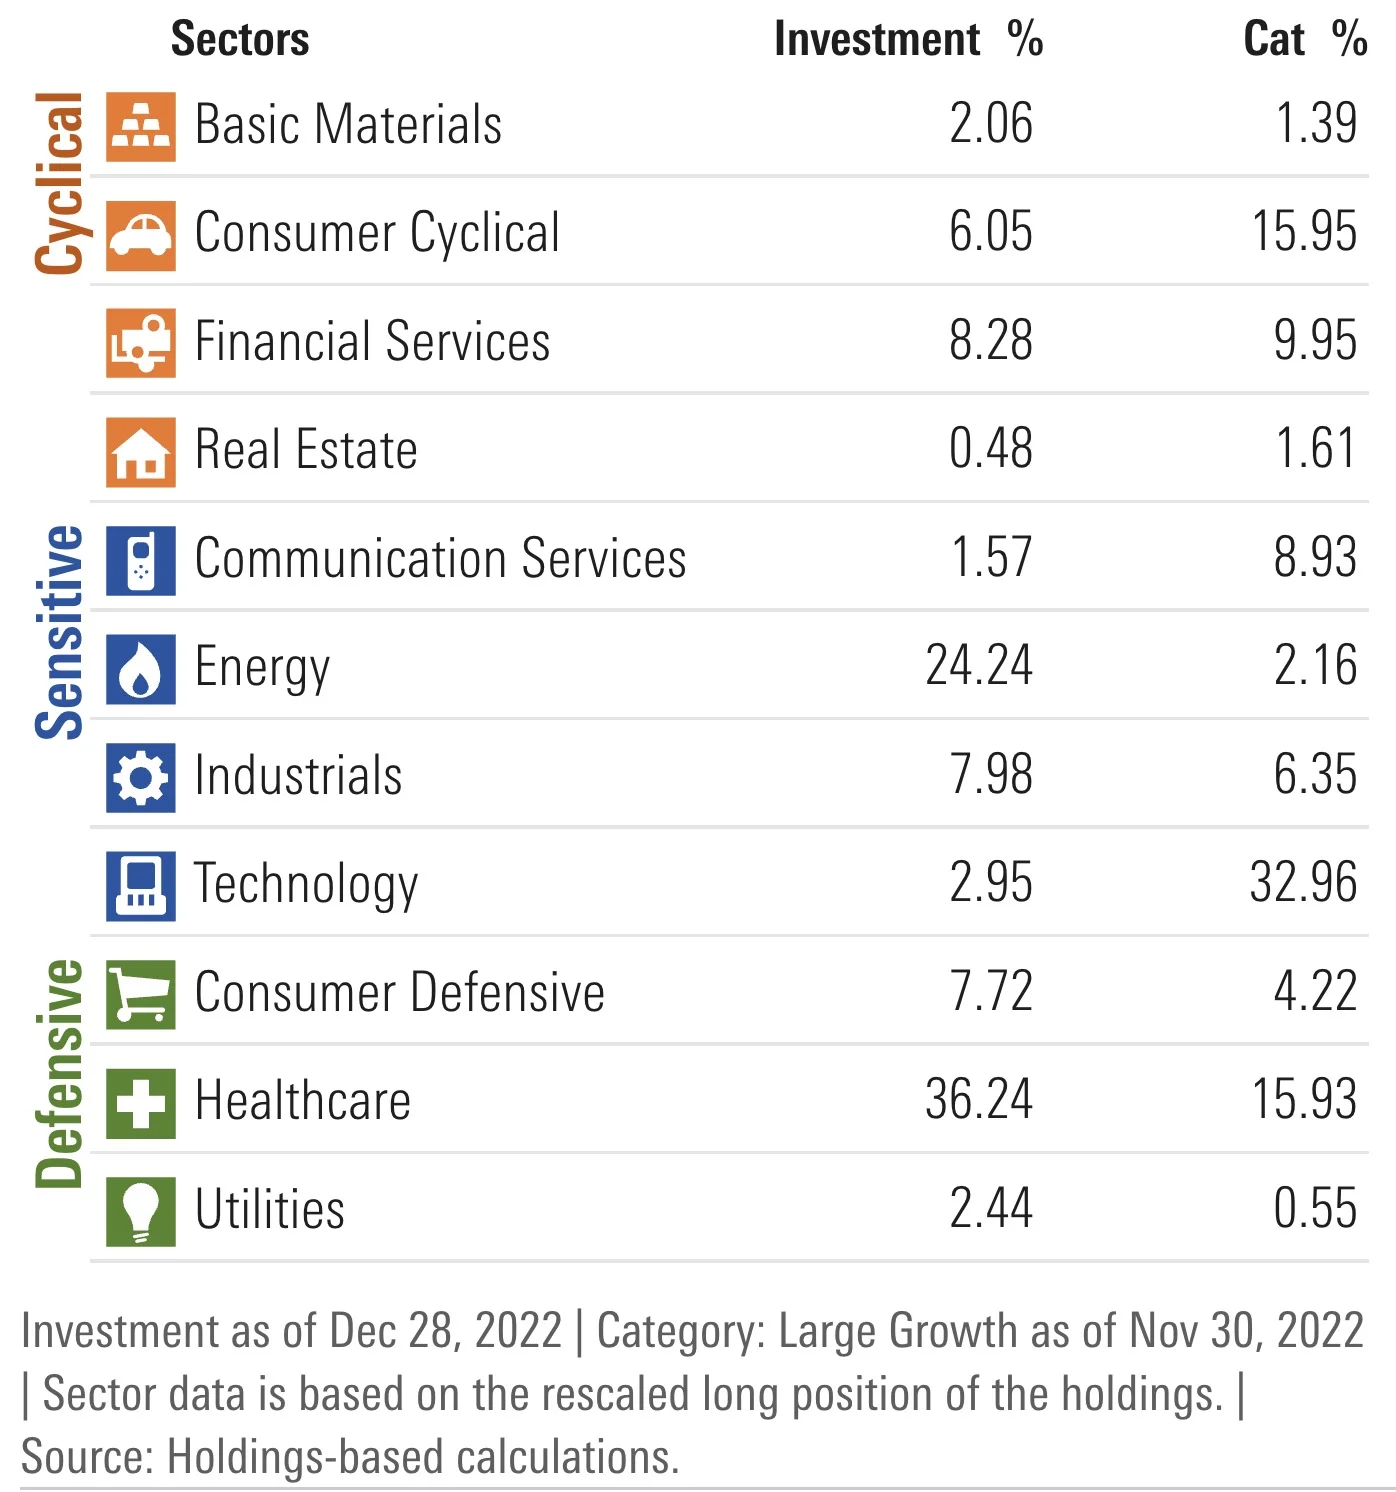
Now here is where things get really interesting for iShares MSCI USA Momentum Factor ETF.
When compared with its category average (US Large Cap Growth) its sector weightings couldn’t be more different.
For instance, MTUM ETF has only 2.95% allocated towards Technology whereas its category average is 32.96%.
It’s massively overweight Energy (24.24%) and Healthcare (36.24%) and underweight Consumer Cyclical (6.05%) and Communication Services (1.57%).
If you’re reading this months/years after the article was published you’ll likely notice totally different sector allocations.
Momentum as a factor strategy is like a fair-weather friend in the sense that’ll it’ll ditch what worked previously for what currently is in vogue.
MTUM ETF Info
Ticker: MTUM
Net Expense Ratio: 0.15
AUM: 12.0 Billion
Inception: Apr 16, 2013
MTUM ETF – Style Measures
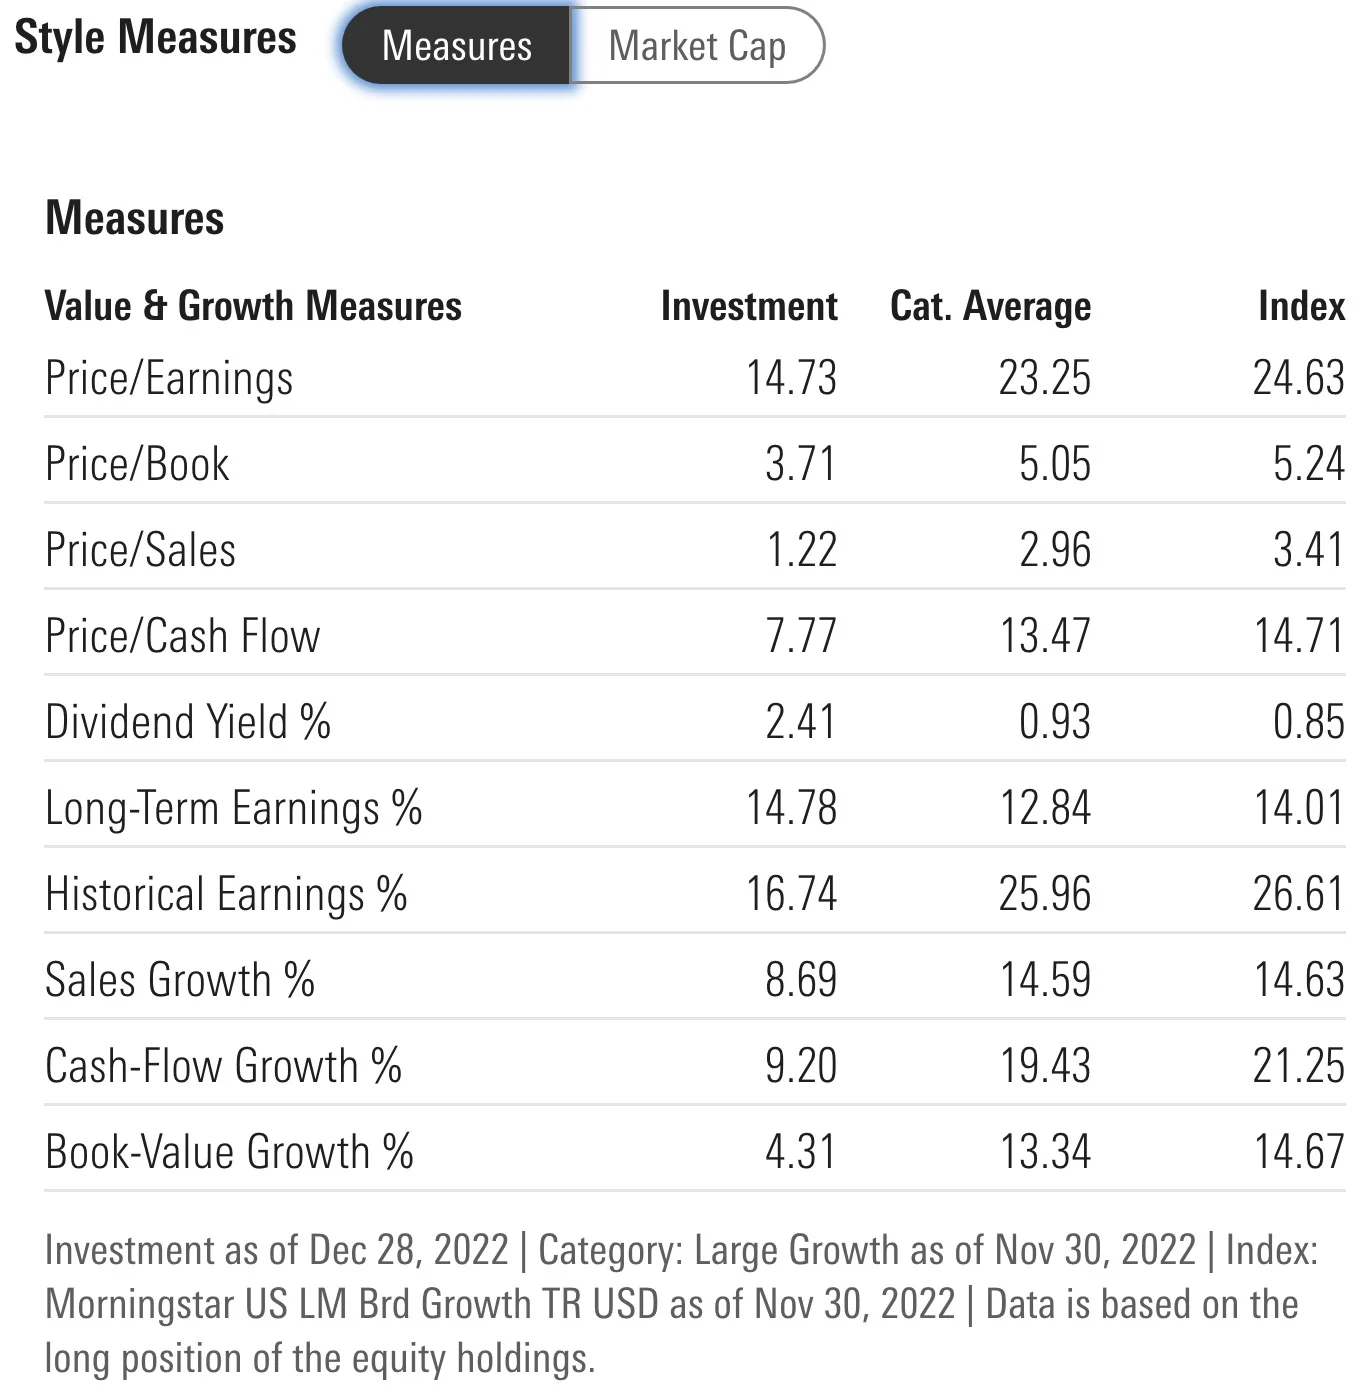
It’s impossible not to notice how much more attractive MTUM ETF is from a valuations standpoint.
While Large Cap Growth category averages have stretched valuations (P/E, P/B, P/S, P/C-Flow) MTUM ETF is looking relatively attractive from a valuations standpoint across the aboard.
- Price/Earnings (14.73 vs 23.25)
- Price/Book (3.71 vs 5.05)
- Price/Sales (1.22 vs 2.96)
- Price/Cash Flow (7.77 vs 13.47)
- Dividend Yield % (2.41 vs 0.93)
- Long-Term Earnings % (14.78 vs 12.84)
- Historical Earnings % (16.74 vs 25.96)
- Sales Growth % (8.69 vs 14.59)
- Cash-Flow Growth % (9.20 vs 19.43)
- Book-Value Growth % (4.31 vs 13.34)
MTUM ETF – Stock Style
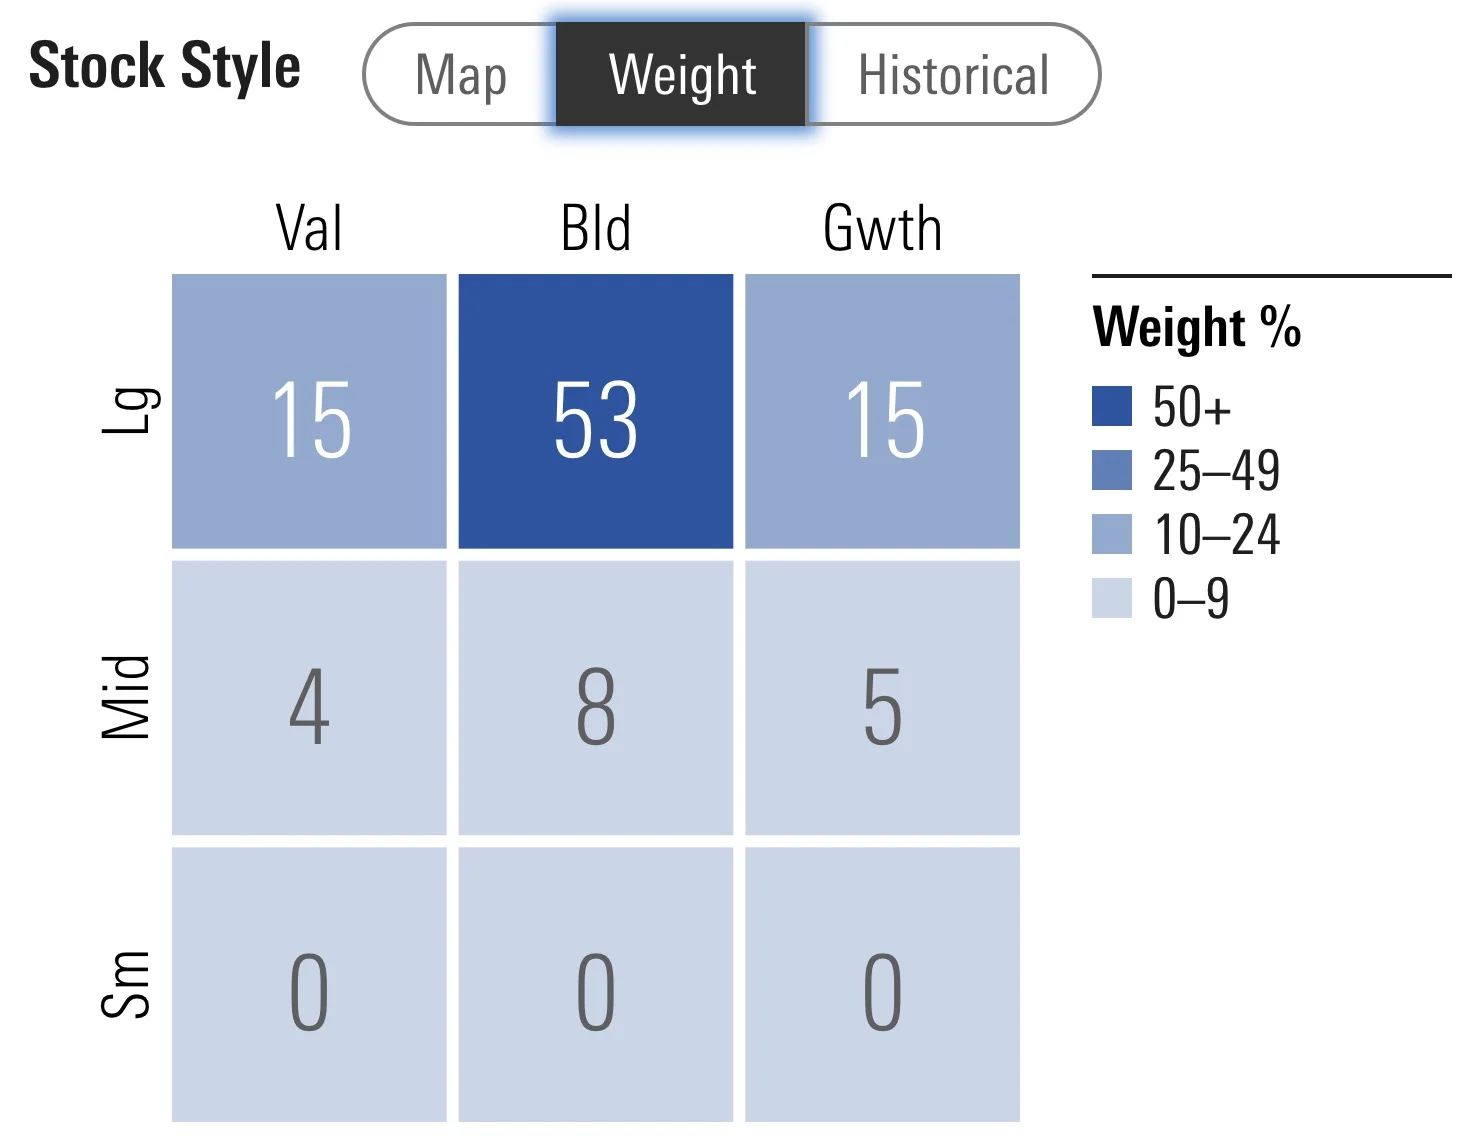
iShares MSCI USA Momentum Factor ETF firmly hangs out in large cap territory (83% of the funds resources) with a smattering of mid-cap exposure (17%).
Currently, it’s sitting on the fence with 61% blend, 19% value and 20% growth.
MTUM ETF – Factor Profile
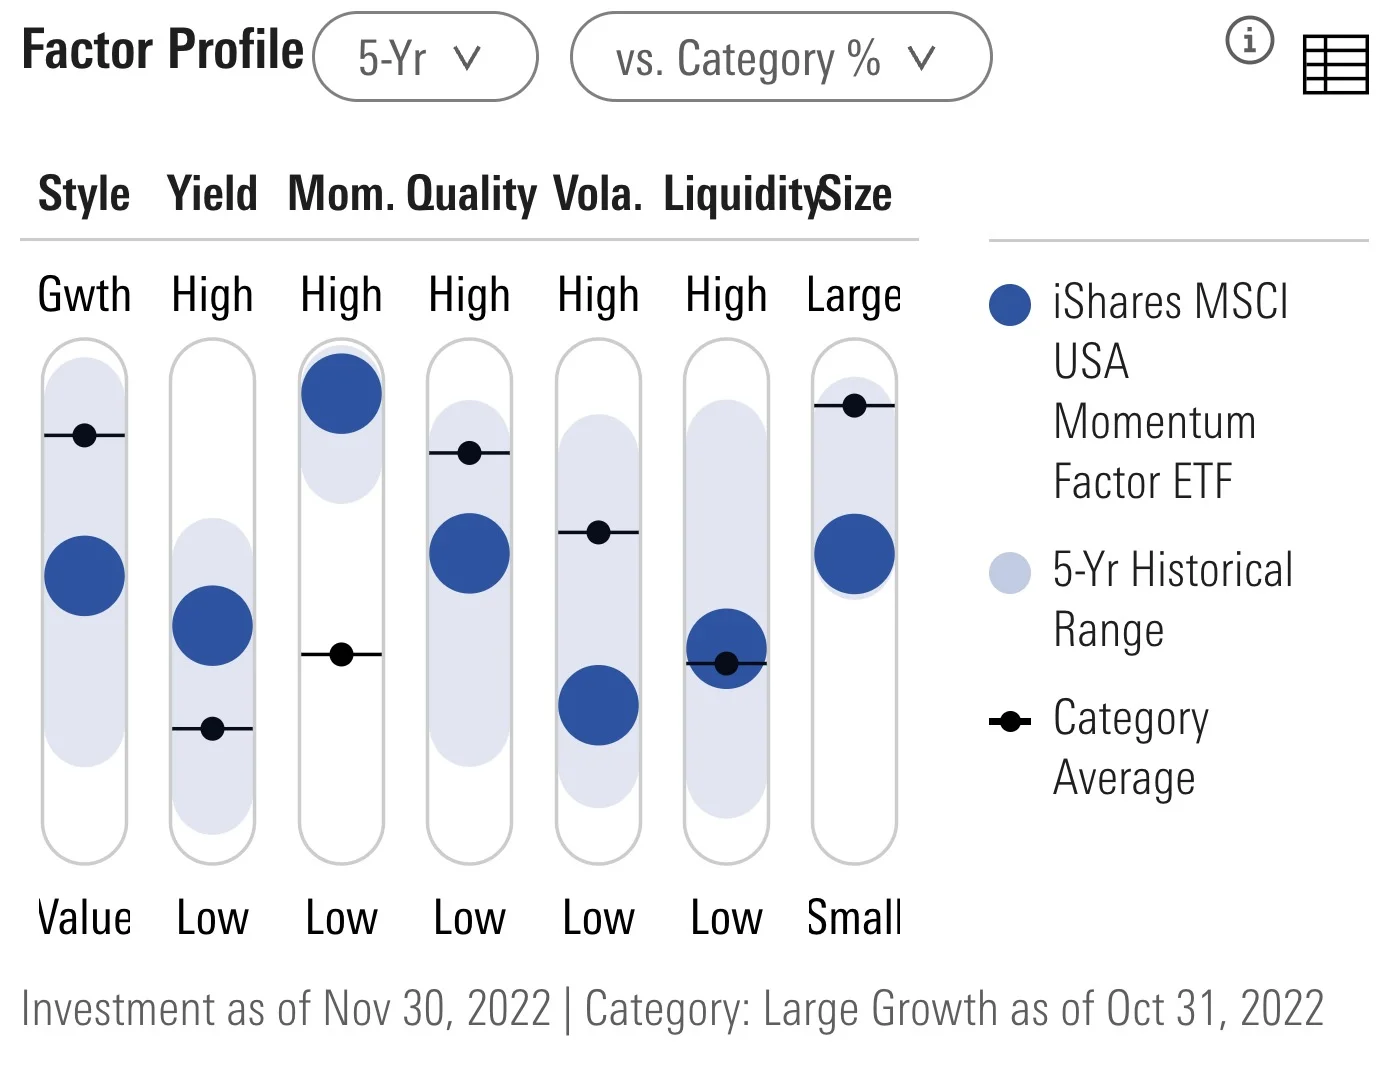
MTUM ETF unsurprisingly offers investors a hard-lever Momentum pull.
The only other noteworthy factor exposure is low volatility.
The rest of the factor profile is mostly vanilla.

MTUM ETF Performance
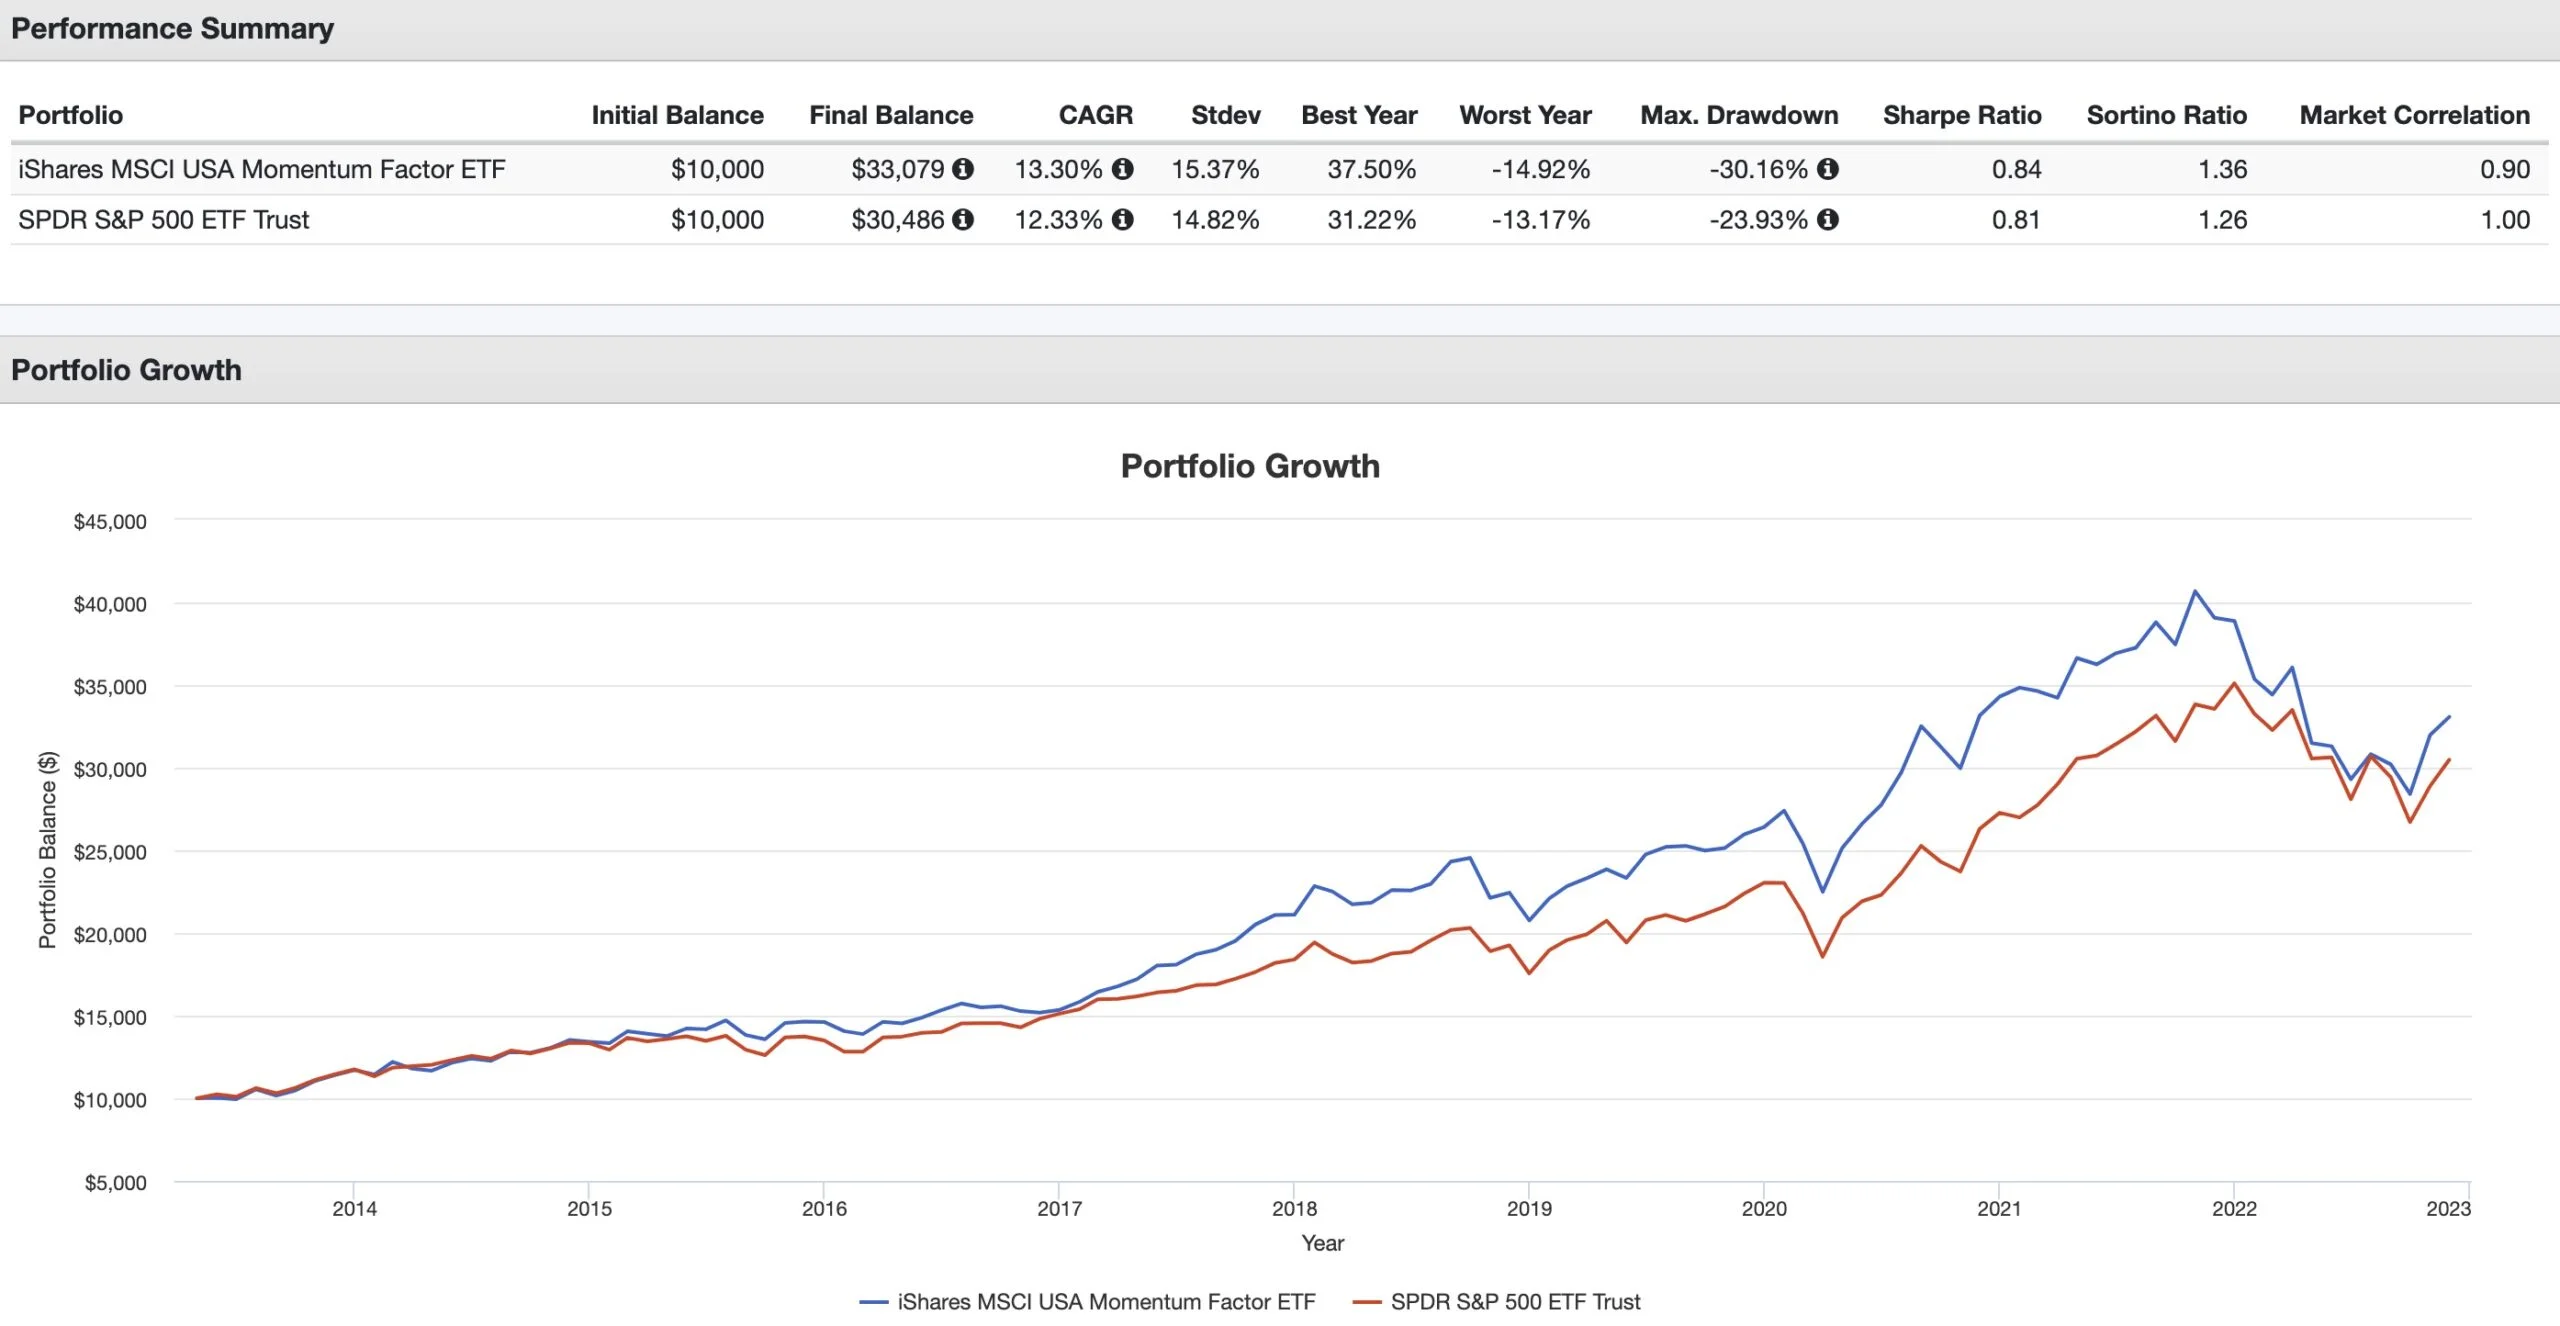
iShares MSCI USA Momentum Factor ETF has outperformed SPY ETF (S&P 500) since inception by 97 basis points (13.30% vs 12.33%).
It has offered investors higher risk adjusted rates of returns (SHARPE and SORTINO) with a worse maximum drawdown of -30.16%.
I’m not at all surprised to see a momentum factor fund outperform a market cap weighted index.

MTUM ETF Pros and Cons
Let’s move on to examine the potential pros and cons of MTUM ETF.
MTUM Pros
- Momentum as a factor is one of the most historically successful equity strategies outperforming market cap weighted benchmarks long-term
- The ability to combine Momentum with other factor strategies that perform well historically during different economic regimes (Minimum Volatility and Value come to mind)
- The capacity to combine MTUM ETF with international momentum exposure for a globally diversified equity sleeve of your portfolio
- Momentum investing strategies have been persistently successful across equity sectors, countries and various other asset classes
- If combined with uncorrelated asset classes and alternative investment strategies the potential for a portfolio where returns exceed risk is possible
- A low fee (0.15) that is in a league of its own for factor based strategies while knocking on the door of ultra low cost market cap weighted strategies
MTUM Cons
- Will inevitably struggle during certain stretches and as a factor investor you need to be willing to endure those times
- As a US only fund you’ll have to cobble together other ETFs in order to avoid home country bias

MTUM Potential Model Portfolio Ideas
These asset allocation ideas and model portfolios presented herein are purely for entertainment purposes only. This is NOT investment advice. These models are hypothetical and are intended to provide general information about potential ways to organize a portfolio based on theoretical scenarios and assumptions. They do not take into account the investment objectives, financial situation/goals, risk tolerance and/or specific needs of any particular individual.
Let’s explore how MTUM ETF potentially integrates into a portfolio at large.
MTUM ETF + Friends vs 60/40 Portfolio VBIAX
Let’s explore an all-in Momentum portfolio that is globally diversified:
30% MTUM ETF
30% IMTM ETF
30% DBMF ETF
10% BTAL ETF
MTUM and Friends vs 60/40 Portfolio VBIAX Performance Summary
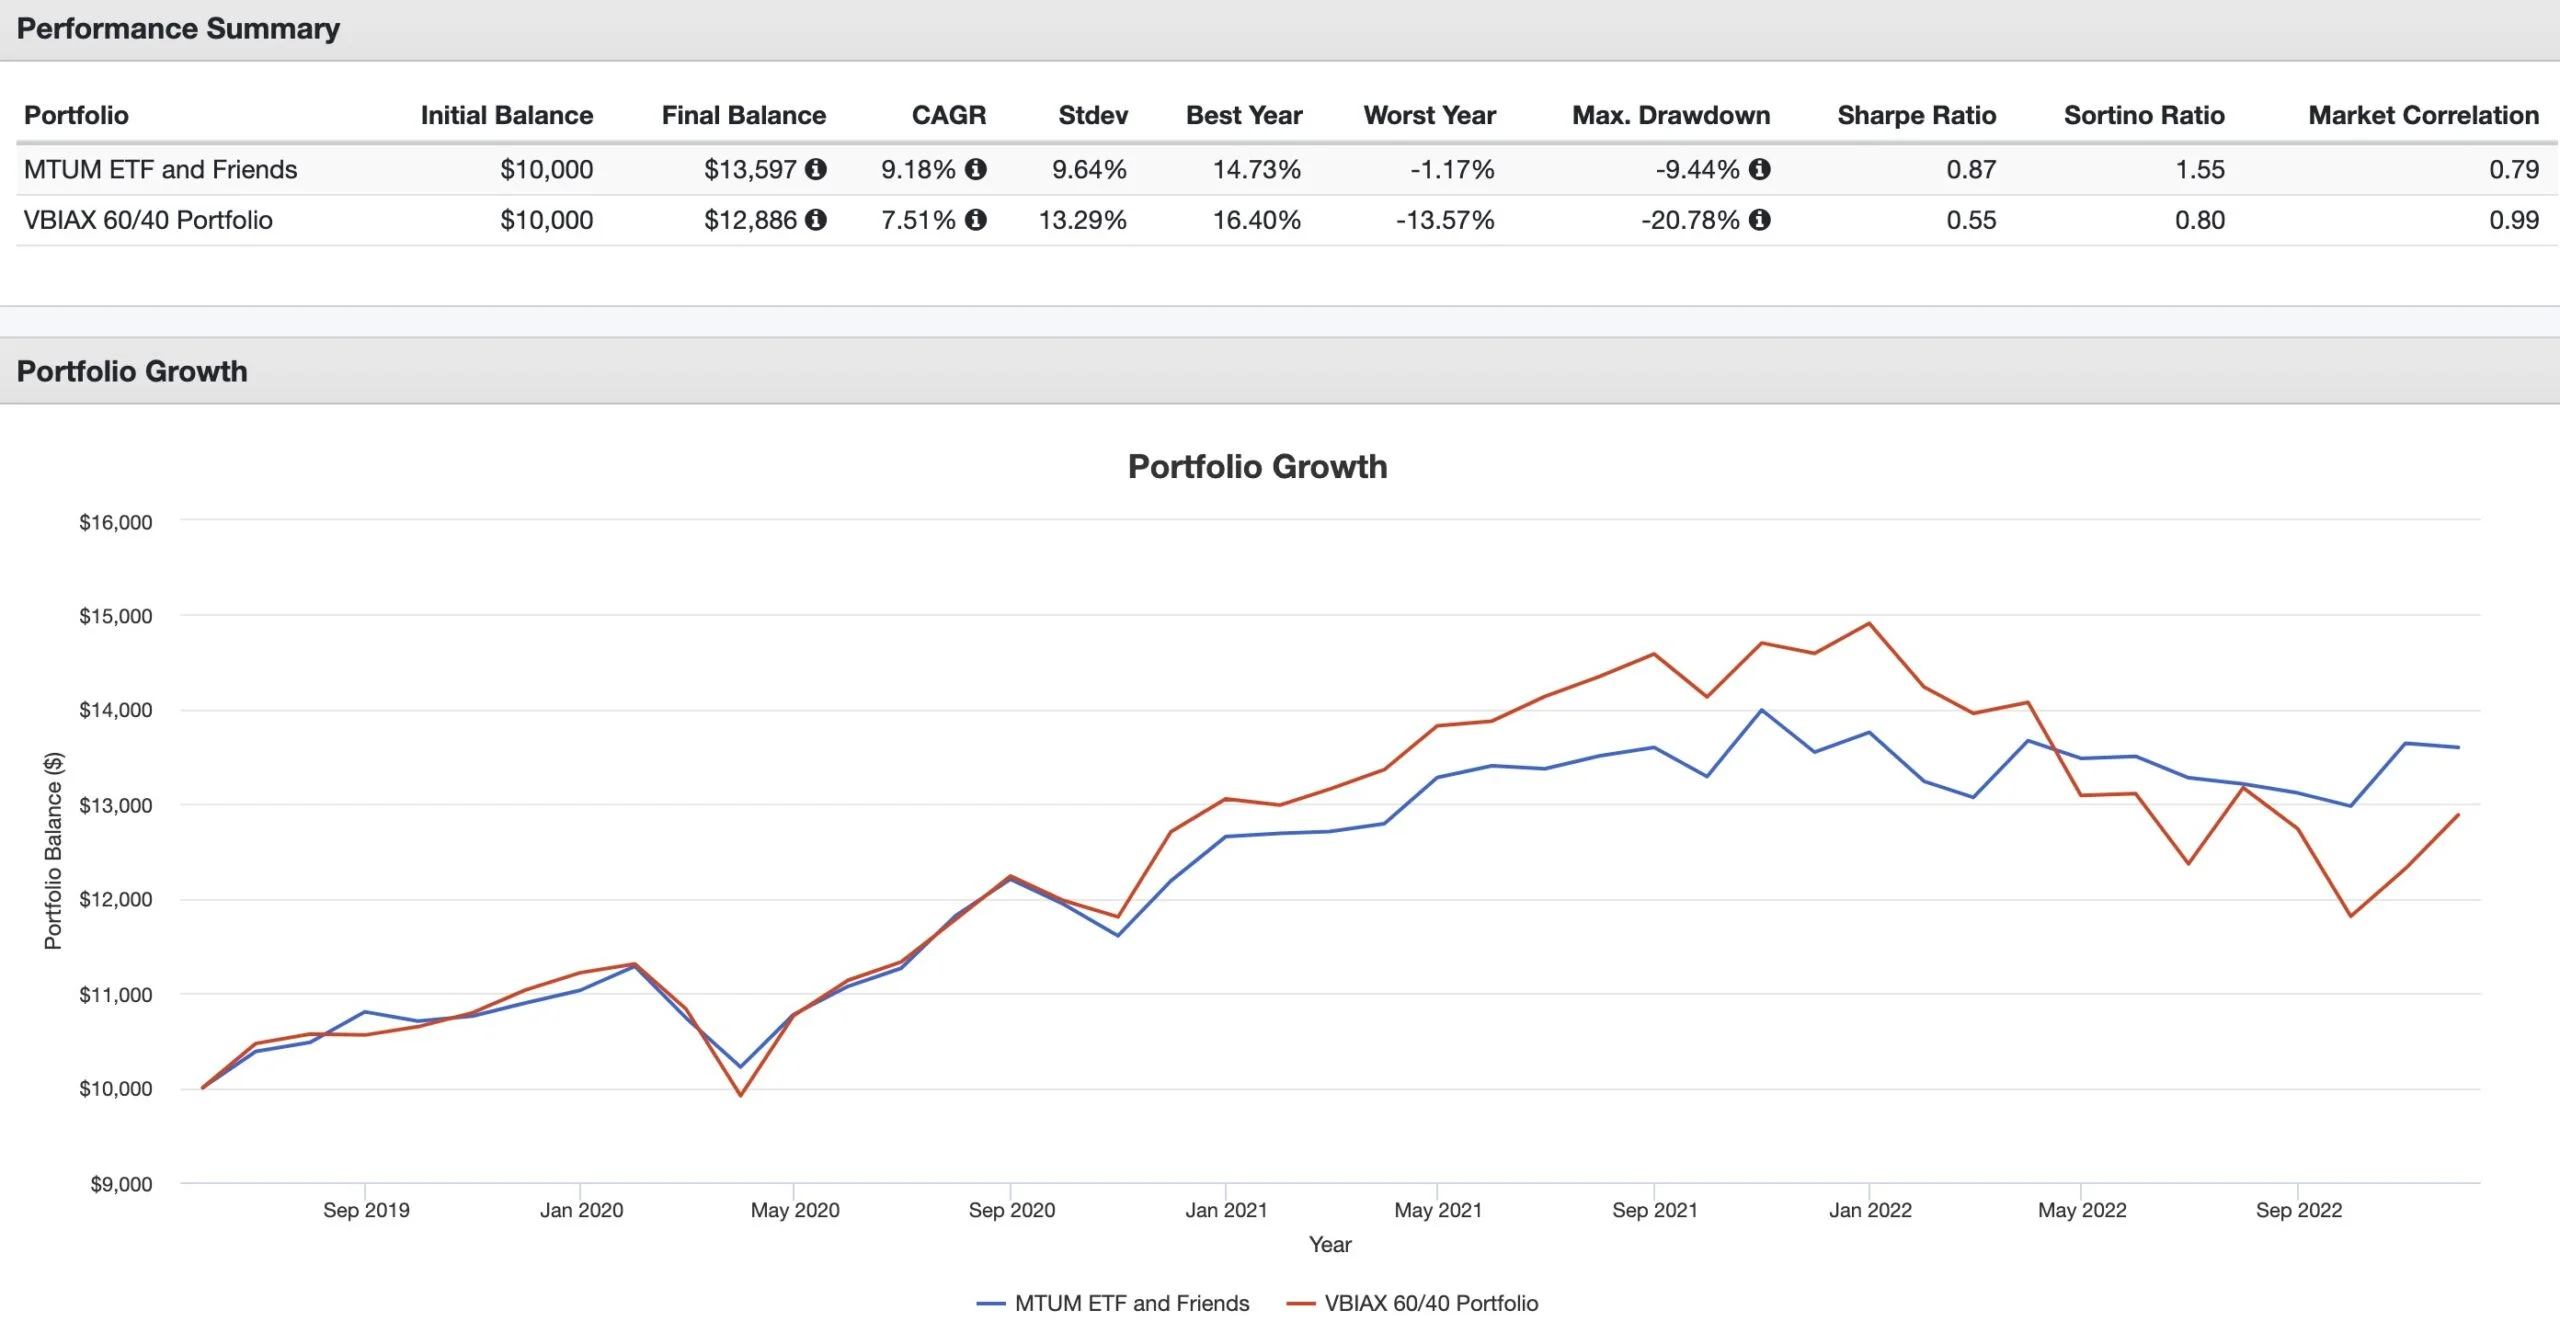
CAGR: 9.18% vs 7.51%
RISK: 9.64% vs 13.29%
BEST YEAR: 14.73% vs 16.40%
WORST YEAR: -1.17% vs -13.57%
MAX DRAWDOWN: -9.44% vs -20.78%
SHARPE RATIO: 0.87 vs 0.55
SORTINO RATIO: 1.55 vs 0.80
MARKET CORRELATION: 0.79 vs 0.99
It’s an across the board sweep for the MTUM ETF and Friends Portfolio versus VBIAX ETF 60/40 Portfolio.
It’s great to outperform (CAGR) but I’m always keen to assemble a portfolio that provides better risk adjusted returns with a high Sharpe Ratio and a less jaw dropping maximum drawdown.
MTUM and Friends ETF Drawdowns vs 60/40 Portfolio VBIAX
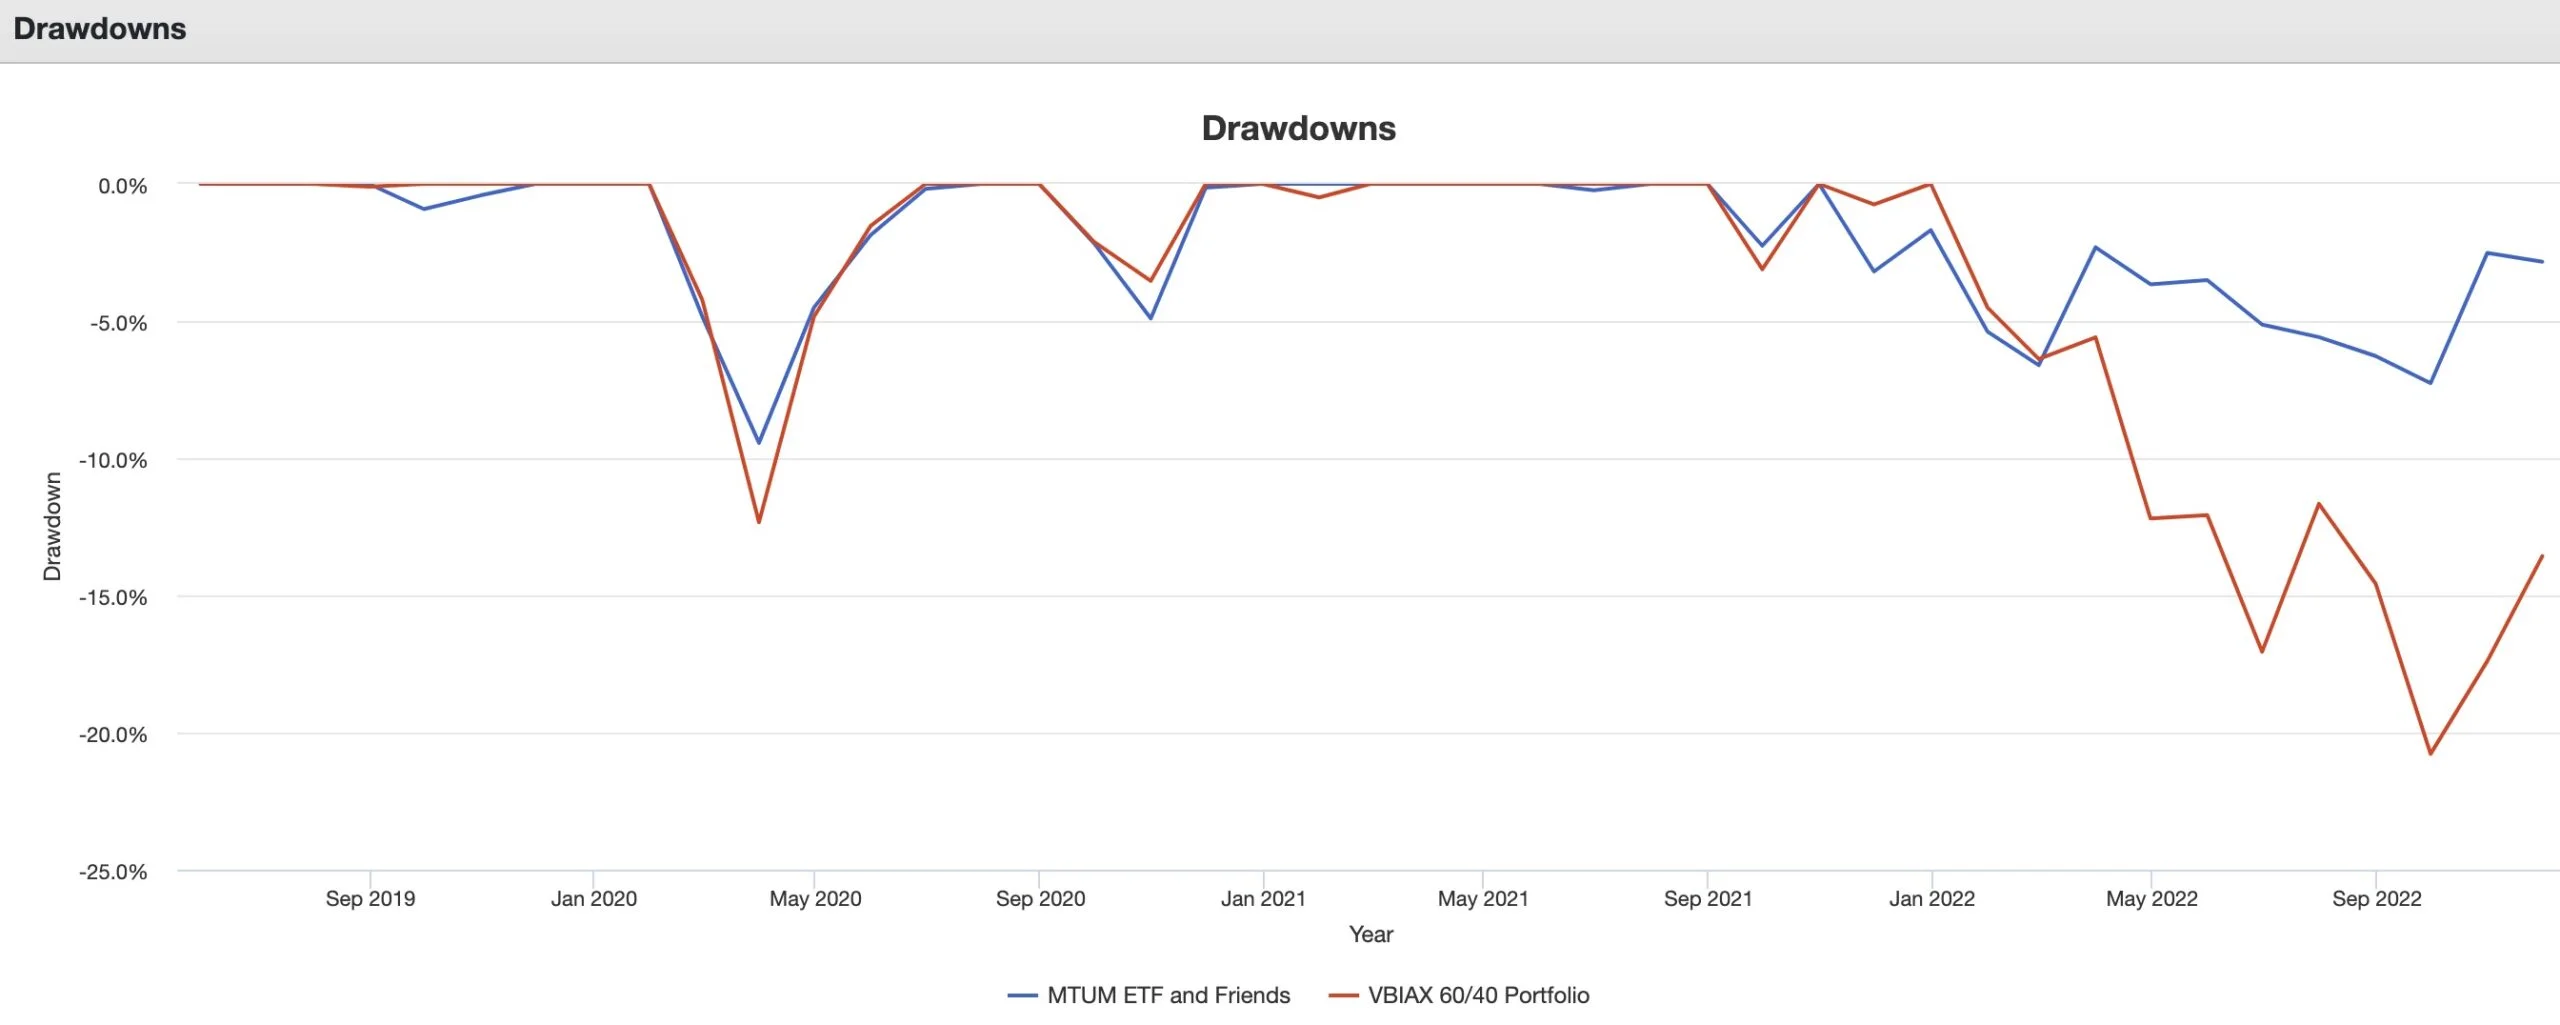
Here we’re able to notice that the dual strategy of managed futures and anti-beta market neutral allowed the MTUM and Friends ETF Portfolio to better handle the early pandemic drawdown of March 2020 and the slow grind down in 2022.
Furthermore, we’re able to see correlations between the equity sleeve, managed futures and market neutral strategies.
MTUM and Friends Monthly Correlations


What Others Have To Say About MTUM ETF
Now that we’ve covered a few different portfolio solutions let’s see what others have to say about the fund for those who prefer video format.
source: The Earth Finance on YouTube
source: Corey On Investing on YouTube
source: Retire With Less on YouTube
source: Market Misbehavior on YouTube

Nomadic Samuel Final Thoughts on MTUM ETF
MTUM ETF is one of the most intriguing factor focused puzzle pieces offered by iShares.
As a factor strategy, momentum investing isn’t nearly as popular as growth or value approaches.
I think this presents a unique opportunity for investors who are well versed in evidence based strategies to potentially add momentum to the mix.
Naturally, momentum factor investing is an ideal barbell strategy to pair with value and/or minimum volatility.
Now over to you!
Are you a momentum investor and is MTUM ETF on your radar?
Please let me know in the comments below.
That’s all I’ve got.
Ciao for now.
Important Information
Investment Disclaimer: The content provided here is for informational purposes only and does not constitute financial, investment, tax or professional advice. Investments carry risks and are not guaranteed; errors in data may occur. Past performance, including backtest results, does not guarantee future outcomes. Please note that indexes are benchmarks and not directly investable. All examples are purely hypothetical. Do your own due diligence. You should conduct your own research and consult a professional advisor before making investment decisions.
“Picture Perfect Portfolios” does not endorse or guarantee the accuracy of the information in this post and is not responsible for any financial losses or damages incurred from relying on this information. Investing involves the risk of loss and is not suitable for all investors. When it comes to capital efficiency, using leverage (or leveraged products) in investing amplifies both potential gains and losses, making it possible to lose more than your initial investment. It involves higher risk and costs, including possible margin calls and interest expenses, which can adversely affect your financial condition. The views and opinions expressed in this post are solely those of the author and do not necessarily reflect the official policy or position of anyone else. You can read my complete disclaimer here.


