With US stocks, bonds and gold all down together in 2022, I’ve been pondering lately whether (or not) this is a potential generational buying opportunity for portable beta investing strategies?
This isn’t the first time US Large Cap Equities, the 10 Year Treasury and Gold have all been down at the same time, right?
I mean ‘surely’ we’ve been through this before?
The bursting tech bubble of the 2000s.
The Global Financial crisis of 2008.
The “Great Inflation” of the 70s in tandem with the 1973-74 stock market crash.
Moreover, as informed investors, we’re well aware of the lost decades for US equities in the 1970s and 2000s and the 26 years and 7 month underwater period for gold that lasted from Oct 1980 until April 2007.
But let’s get back on track with the question at hand: “When was the last time US Large Cap Equities, the 10 Year Treasury and Gold have all been negative together in the past 50 years?”
The answer is…
Never.
This is the first time.
Ah.
Freakin’ 2022.
So far you’ve served up a real stinker for diversified long-only investors.
But why would this possibly be a generational buying opportunity for long-only portable beta strategies?
Well, because they’re typically 90/60, 70/90, 100/100 and/or 75/75 equity and bond configurations.
Because both equities and bonds have been down together the “modest” amount of leverage creates additional pain versus toned down 100% canvas equivalents.
And what about the classic Risk Parity, the Permanent Portfolio and Ray Dalio All-Weather expanded canvas portfolios?
They’ve been squeezed harder than any other year on record (since 1972).
Historically, when “bear markets” have decimated stocks, bonds have been the reliable ballast that has weathered the storm and gold has often (although not always) been like that “Crazy Uncle” we all have in our families who sometimes shows up to the barbecue to lend a helping hand.
But not this year.
2022 has been a horse of a different colour with pesky persistent inflation rearing its ugly head.
Many investors have never seen this type of economic regime before in their investing journey.
As I’ve mentioned in previous articles, stocks and bonds have cozied up and jumped together on the same shish-kebab for a ‘lil flamethrower treatment so far this year.
But with pain arrives opportunity.
Dr. William Bernstein once famously said: “If you are in the accumulation phase of investing, you should get on your hands and knees and pray for a bear market so you can buy cheap stocks.”
So is this a “golden” opportunity for investors to enter/accumulate positions in long-only diversified portable beta investing strategies?
That’s what we’re going to explore in detail.
And fortunately we’ve got help from friends in the #FinTwit community!
I posed this very question on Twitter and I’m really looking forward to sharing the responses.
After-all, it does get tiring hearing from little ol’ me all of the time.
Let’s dig in!

Ultimate Time to Buy Portable Beta Investing Strategies?

Hey guys! Here is the part where I mention I’m a travel vlogger! This investing opinion blog post is entirely for entertainment purposes only. There could be considerable errors in the data I gathered. This is not financial advice. Do your own due diligence and research. Consult with a financial advisor.

These asset allocation ideas and model portfolios presented herein are purely for entertainment purposes only. This is NOT investment advice. These models are hypothetical and are intended to provide general information about potential ways to organize a portfolio based on theoretical scenarios and assumptions. They do not take into account the investment objectives, financial situation/goals, risk tolerance and/or specific needs of any particular individual.
What Exactly Is Portable Beta?
In a nutshell, Portable beta is an investment strategy where you take two or more traditionally uncorrelated asset classes and/or strategies and apply a sensible amount of leverage to enhance returns while still managing risk.
For instance, a 60/40 portfolio leveraged to 90/60 experiences roughly the same volatility as 100% equity only strategies; however, with less sequence of return risk (underwater years) and jaw-dropping annual drawdowns.
Another example would be a classic long-only Risk Parity Portfolio with 100% canvas of 20% equities, 30% TIPs, 30% Long-Term Treasury and 20% Gold.
If we boosted this by 1.5X we’d have 30% equities, 45% TIPs, 45% Long-Term Treasury and 30% Gold.
The strategy was coined “Portable Beta” from Cliff Asness in the 90s and more recently popularized by influential quants in the industry.
It’s anything but my favourite way of describing what we’re attempting to do by creating expanded canvas portfolios but that’s another story for another day.
What is fascinating is that this type of strategy which utilizes modest amounts of leverage was once only available to high net worth individuals and institutional investors.
Not anymore.
It’s now available for us plebs too.
The so-called DIY Retail Investors.
If you ask me that’s incredibly exciting.
All of the research, innovation and efforts put forth by professional investors and product developers has paved the way for a number of long-only “portable beta” products to hit the market in recent years.
We’ve got all of the building blocks at our disposal as ETFs and Mutual Funds.
The question remains is this a generational buying opportunity for these types of strategies given current market conditions?

Portable Beta further reading material:
- Portable Beta: Making the Most of the Returns You’re Already Getting by Corey Hoffstein of Newfound Research
- Research on a Levered 60/40 Approach vs. 100% Equities by Jeremy Schwartz of WisdomTree

Stocks, Bonds and Gold Up and Down Together Throughout The Years
Let’s examine annual returns between stocks, bonds (10 Year Treasury) and gold over the past 50 odd years dating back to 1972.
Thanks to the incredible tool (Portfolio Visualizer) DIY investors (such as myself) can research this type of information with ease.
So we’re going to sort these three historically uncorrelated asset classes into four different buckets.
All 3 Up.
2 Up / 1 Down.
1 Up / 2 Down.
All 3 Down.
We’ll do this decade by decade so as to not lay down a mammoth chunk of data in one or two slabs.

70s Stocks, Bonds and Gold Returns
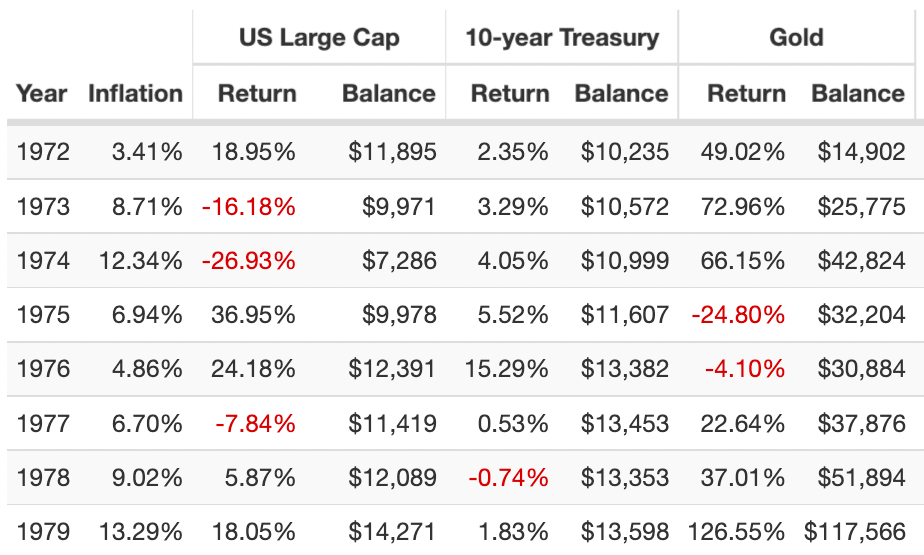
3 UP / 0 DOWN = 2 (1972, 1979)
2 UP / 1 DOWN = 6 (1973, 1974, 1975, 1976, 1977, 1978)
1 UP / 2 DOWN = 0
0 UP / 3 DOWN = 0
Firstly, let’s acknowledge the crazy high inflation of the 1970s!
Double digits in 1974 and 1979.
Okay, now that we’ve regained focus it was mostly two out of three engines chugging along (6 times) or all systems available (2 times) for the limited data we have available for the decade dating back to 1972.

80s Stocks, Bonds and Gold Returns
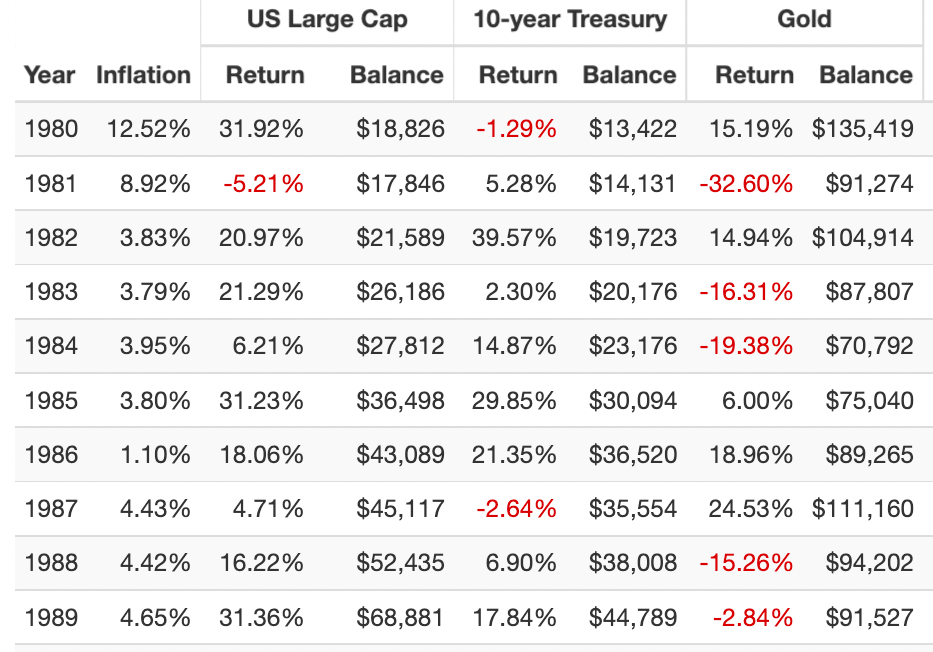
3 UP / 0 DOWN = 3 (1982, 1985, 1986)
2 UP / 1 DOWN = 6 (1980, 1983, 1984, 1987, 1988, 1989)
1 UP / 2 DOWN = 1 (1981)
0 UP / 3 DOWN = 0
Inflation was finally crushed after 1981 and for the most part it was 2 up or all 3 up aside from 1981.

90s Stocks, Bonds and Gold Returns
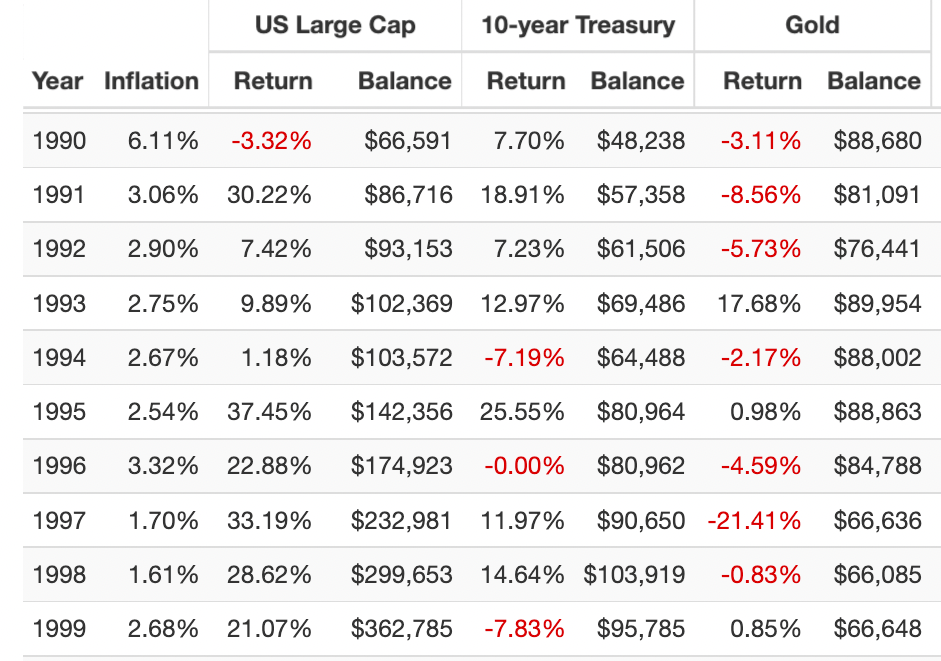
3 UP / 0 DOWN = 2 (1993, 1995)
2 UP / 1 DOWN = 5 (1991, 1992, 1997, 1998, 1999)
1 UP / 2 DOWN = 3 (1990, 1994, 1996)
0 UP / 3 DOWN = 0
The low inflation 90s was a mixed bag of 3 Up (twice), 2 Up (5 times) and 1 Up (3 times).

2000s Stocks, Bonds and Gold Returns
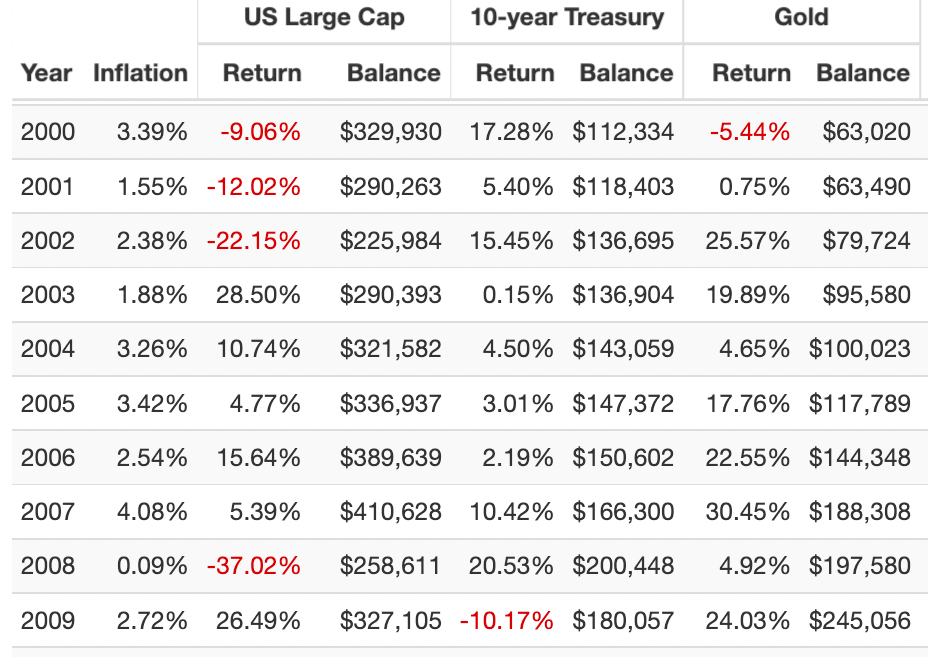
3 UP / 0 DOWN = 5 (2003, 2004, 2005, 2006, 2007)
2 UP / 1 DOWN = 4 (2001, 2002, 2008, 2009)
1 UP / 2 DOWN = 1 (2000)
0 UP / 3 DOWN = 0
The 2000s, although brutal for equity only investors, provided attractive sequence of returns for all-weather and risk-parity investors.
It was mostly 3 Up (5 times) or 2 Up (4 times) with only 1 Up (once).

2010s Stocks, Bonds and Gold Returns
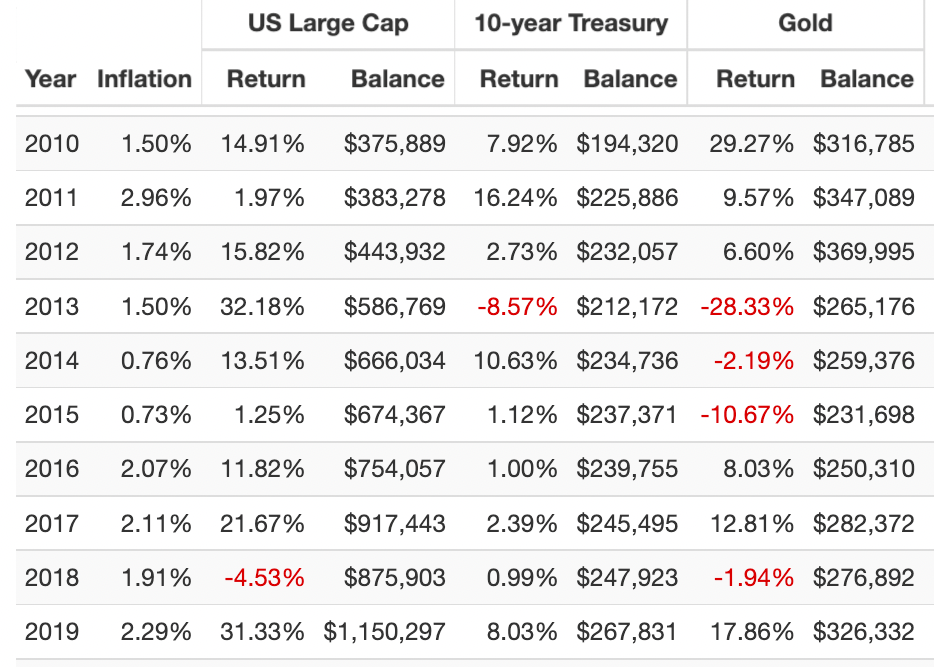
3 UP / 0 DOWN = 6 (2010, 2011, 2012, 2016, 2017, 2019)
2 UP / 1 DOWN = 2 (2014, 2015)
1 UP / 2 DOWN = 2 (2013, 2018)
0 UP / 3 DOWN = 0
The lowest inflation decade out of them all offered 3 Up (6 times), 2 Up (twice) and 1 Up (twice.)
2020s Stocks, Bonds and Gold Returns
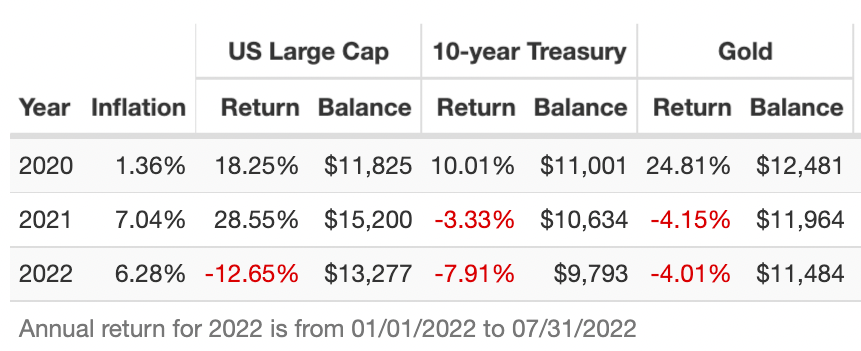
3 UP / 0 DOWN = 1 (2020)
2 UP / 1 DOWN = 0
1 UP / 2 DOWN = 1 (2021)
0 UP / 3 DOWN = 1 (2022)
And we’re living through history with 3 Up (once), 1 Up (once) and 0 Up for the very first time.
1972 to 2022 Stocks, Bonds and Gold Returns
Let’s take a look at the big picture of annual returns from 1972 to 2022.
3 UP / 0 DOWN = 18 (1972, 1979, 1982, 1985, 1986, 1993, 1995, 2003, 2004, 2005, 2006, 2007, 2010, 2011, 2012, 2016, 2017, 2019, 2020)
2 UP / 1 DOWN = 23 (1973, 1974, 1975, 1976, 1977, 1978, 1980, 1983, 1984, 1987, 1988, 1989, 1991, 1992, 1997, 1998, 1999, 2001, 2002, 2008, 2009, 2014, 2015)
1 UP / 2 DOWN = 08 (1981, 1990, 1994, 1996, 2000, 2013, 2018, 2021)
0 UP / 3 DOWN = 01 (2022)
2022 sticking out like a sore thumb?
3 UP / 0 DOWN = 36%
2 UP / 1 DOWN = 46%
1 UP / 2 DOWN = 16%
0 UP / 3 DOWN = 2%
If we group these together we’re flying high with 2 or 3 engines 82% of the time.
On the other hand, we’re flying low with 0 or 1 engines only 18% of the time.
Given these results it certainly seems that 2022 is an opportunity of a lifetime for those pursuing a 1-2-3 step process of diversification between stocks, bonds and alternatives (gold).
I’m looking at you “classic” long-only Risk Parity Portfolio.

Just How Bad Has It Been in 2022 For Portable Beta ETFs?
Just how bad has it been in 2022 for long-only Portable Beta ETFs that are stocks/bonds or stocks/bonds/alternatives combinations?
In a word.
Ouch!
Now keep in mind these are some of my favourite funds that I personally own in my DIY quant portfolio.
Long-term I’m thrilled by the prospects of each of these strategies.
And short-term I’m wondering if this represents generational buying opportunities to add more positions.
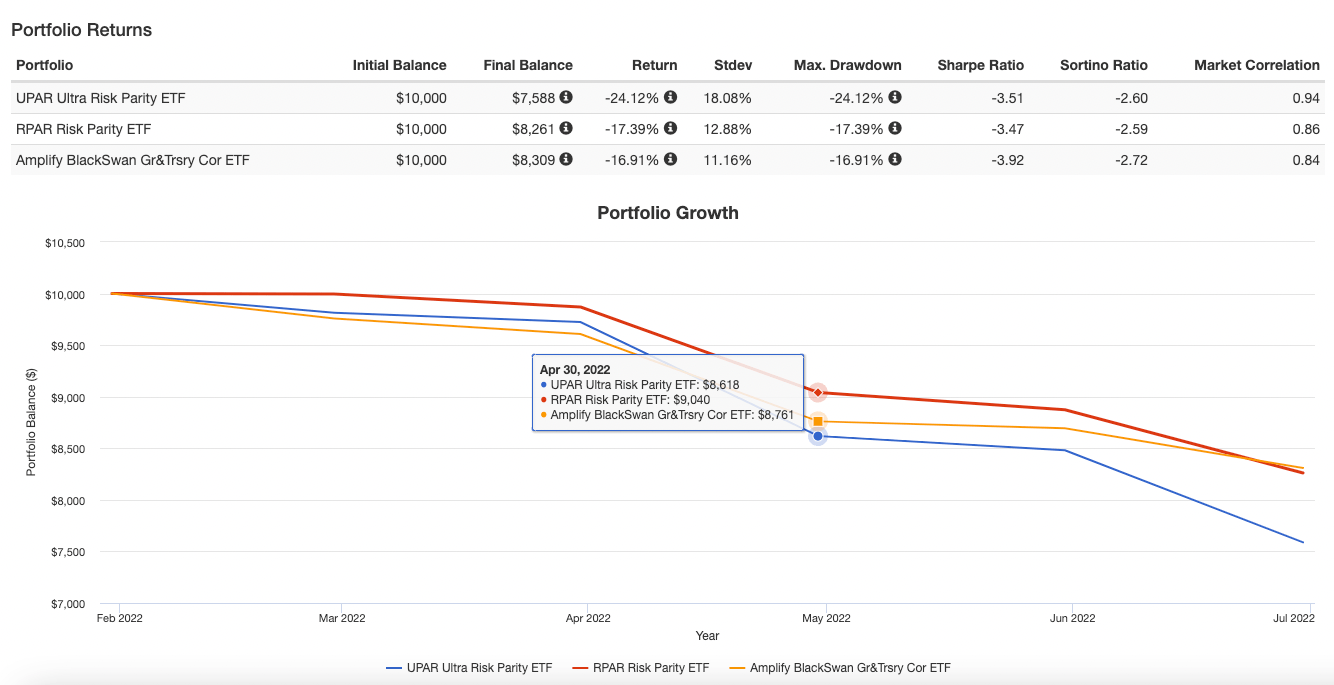
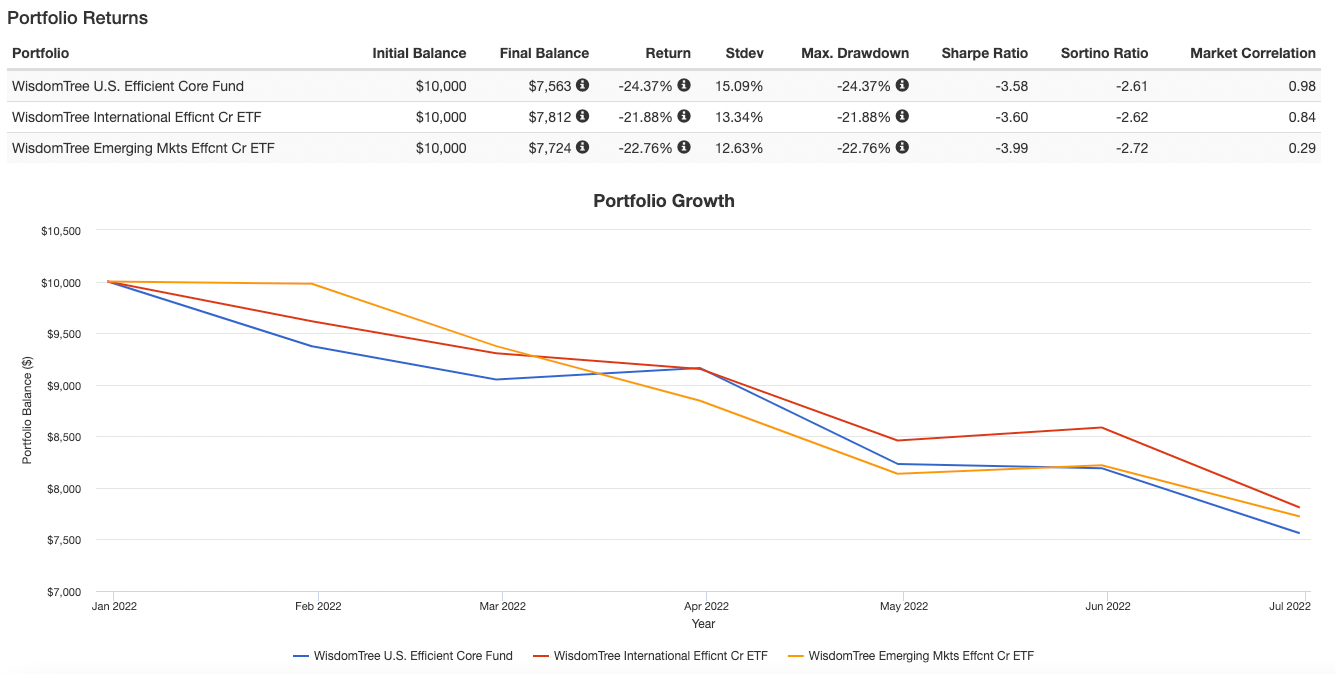
The key point to remember with modestly leveraged funds is that you are promised the strategy not the results.
For those (results) you’ll need patience over a long-period of time.
When you consider that 2022 has been the only year in the past 50 to have stocks, bonds and gold down at the same time it’s worth pondering whether this is an absolute “flukey” scenario or one we’ll eventually encounter again in the not too distant future?
I’m leaning more towards it’s pretty darn exceptional in the sense it’s unlikely to happen again soon.
But who knows!
As much as I hope to remain a curious investor my whole life, I’m equally aspiring towards being a humble investor as well.
Simulated 90/60 and Levered Risk Parity Portfolios 1972 to 2022
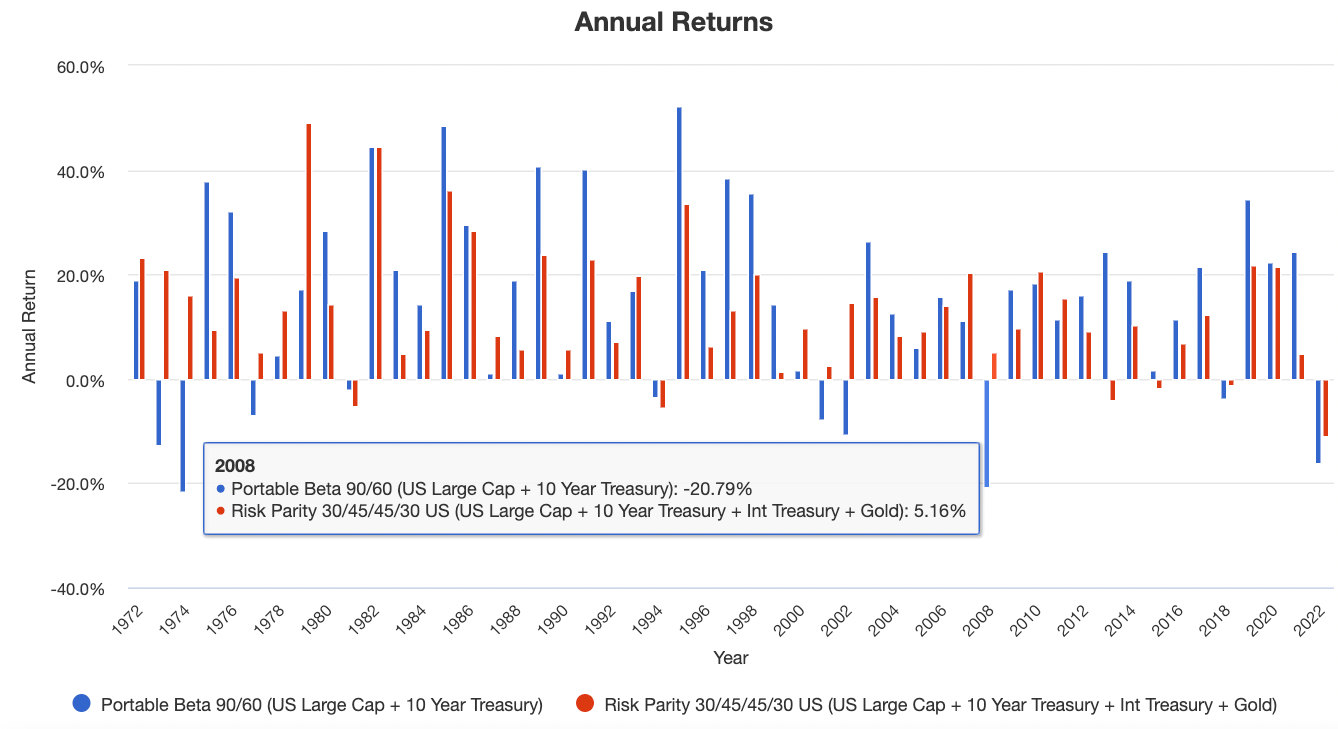
When I backtested 150% expanded canvas results for a simulated 90/60 (US Large Cap Equities + 10 Year Treasury) and class Risk Parity at 30/45/45/30 (US Large Cap Equities + 10 Year Treasury + Intermediate Treasury + Gold) I noticed a couple of things.
Firstly, this isn’t the first rough patch for 90/60 with 1974 and 2008 being worse than 2022.
Secondly, this is “by far” the worst year for a classic long-only Risk Parity strategy with 1981, 1994 and 2013 being down only slightly by single digits versus double digits (2022).
Hence, I’m leaning more towards thinking a leveraged long-only Risk Parity strategy may be more of a “golden opportunity” than say a leveraged 60/40.

Yardeni Forward P/E Information For Select Indexes
Before we can consider certain expanded canvas long-only “portable beta” strategies as potential “buy low” opportunities, we first need to consult with what is generally considered as gravity for potential future equity returns.
Forward P/E.
Fortunately, we’ve got another invaluable resource (Yardeni Forward P/E charts) to help us along the way.
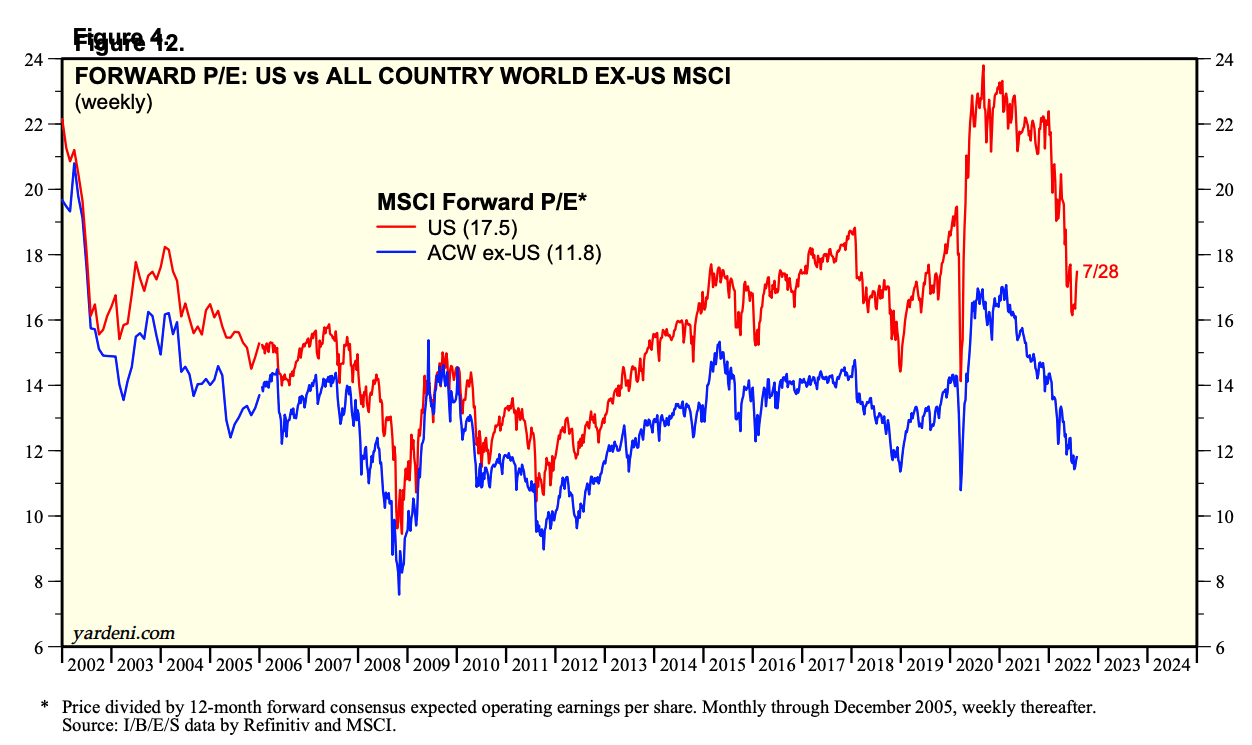
The gap between US equities and The World (excluding the US) is certainly revealing some harsh truths.
US large cap centric equities are considerably more expensive, from a forward P/E perspective, than the rest of the world.
Currently we’re sitting at a forward P/E for US Equities at 17.5 versus 11.8 for ACW ex-US.
It certainly seems that going “global” and avoiding “home country bias” for US investors and those from other countries seems prudent moving forward.
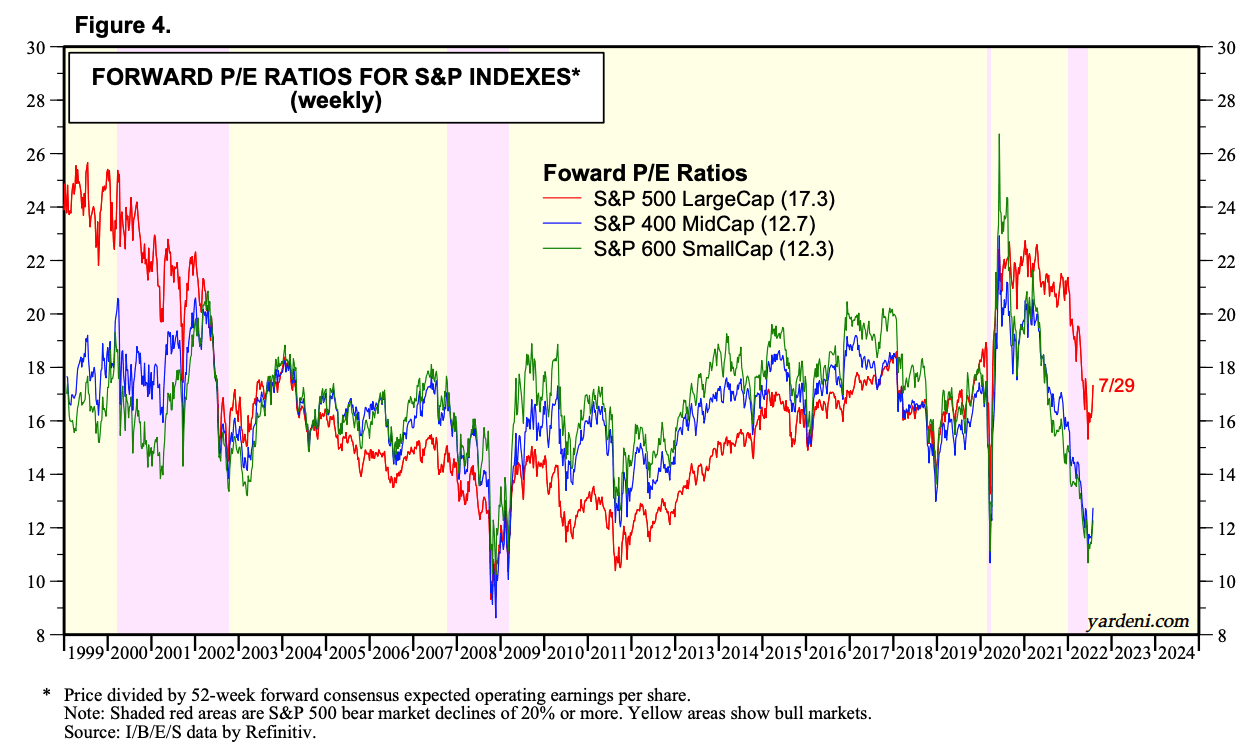
When viewing the US stock market by cap size as opposed to just the S&P 500 it paints an entirely different picture.
US mid-cap and US small-cap equities seem relatively attractive at the moment.
Only in 2008 and after March of 2020 could you find similar forward P/E numbers.
Sigh.
If only “portable beta” products existed that broke the link between the “typically expensive” large-cap equities and offered relative bargain small-cap and mid-cap indexes as a replacement.
That’s pretty much all I want for Christmas.
Expanded canvas ETFs that are not ALL market-cap weighted and large-cap centric.
What a low-hanging fruit opportunity out there for someone to develop such a product!
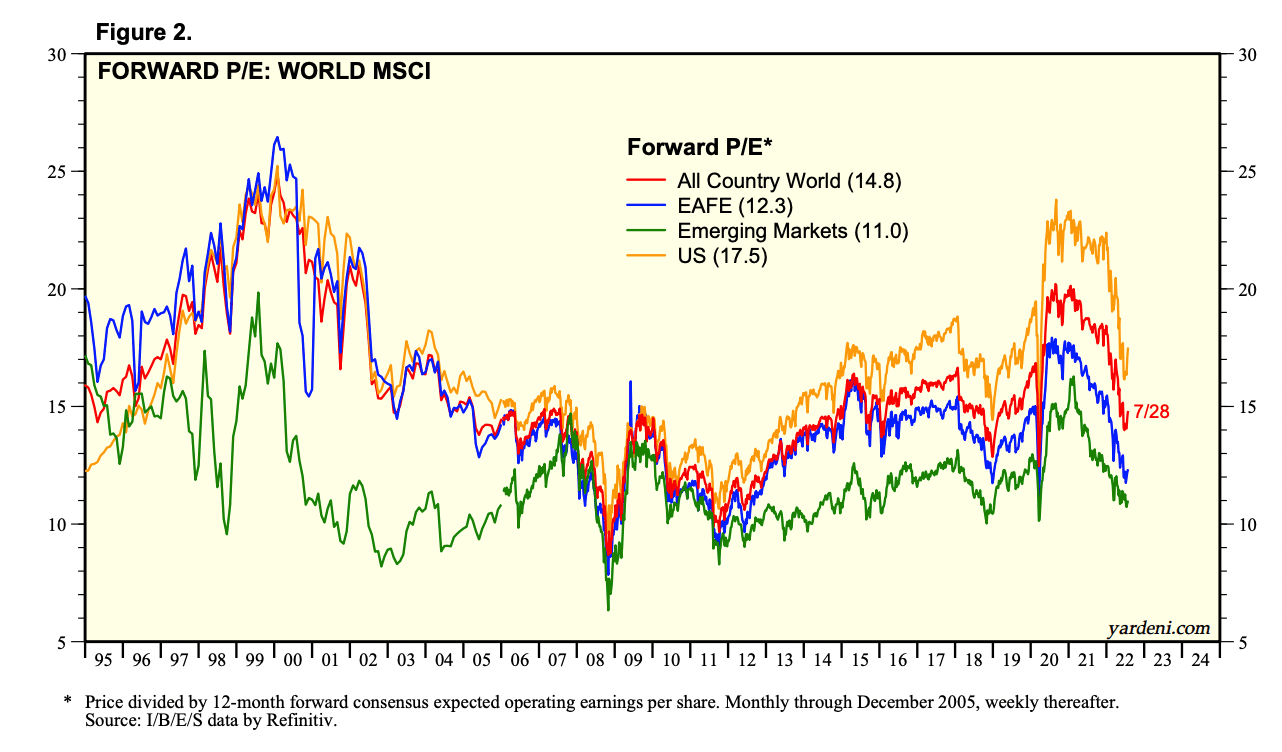
Here we get a side by side forward P/E comparison of Emerging Markets, EAFE (International Developed) and US equities.
Emerging markets at 11.0 and EAFE at 12.3 certainly seem attractive whereas the US at 17.5 is not quite in bubble territory but doesn’t seem particularly cheap either.
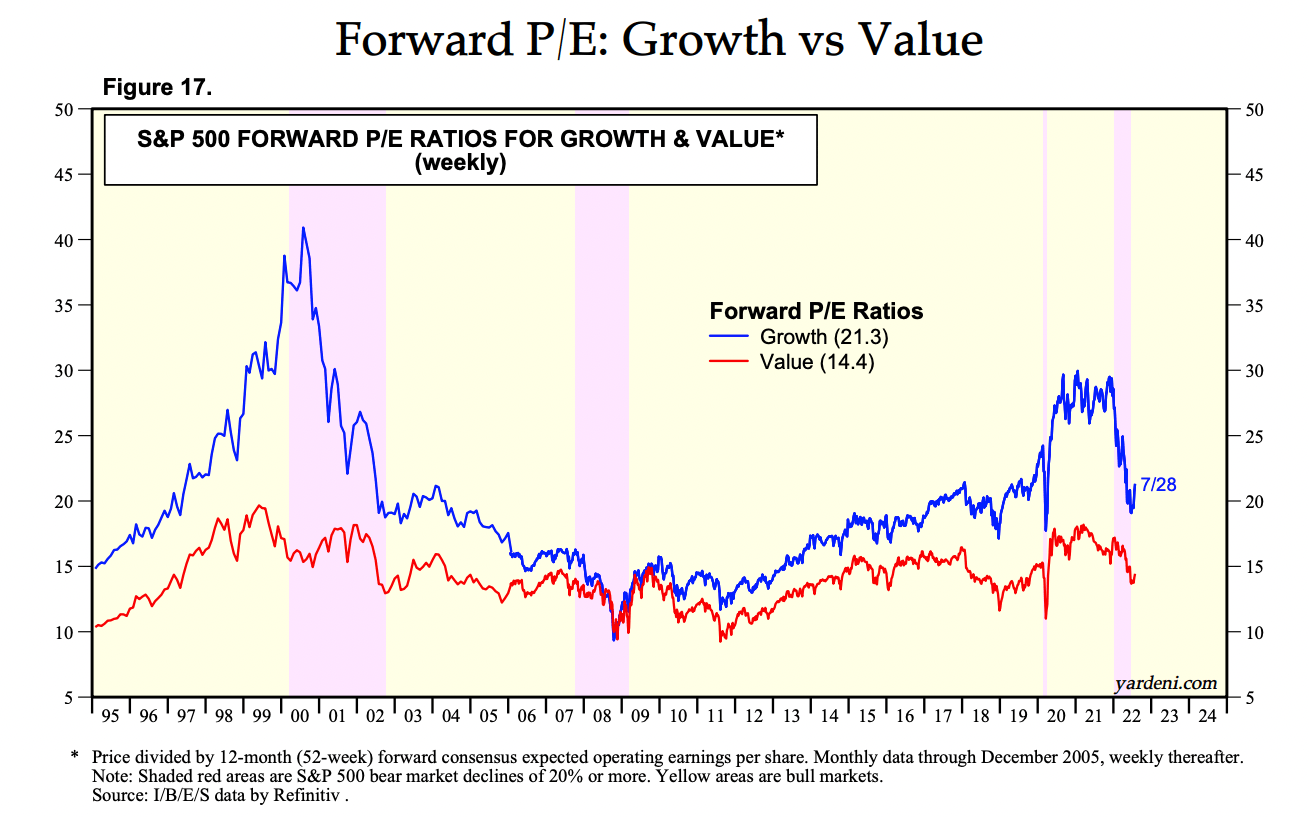
The forward P/E gap between Growth and Value is certainly something to consider.
This is just an example with the S&P 500.
However, when I’ve checked certain value funds from Emerging Markets and International developed countries I’ve noticed low single digit forward P/E.
Even US small-cap and mid-cap value funds seem like bargains at the moment.
It seems as though the opportunity to create a global small-mid cap portable beta product is as attractive as ever.
My crystal ball is forever hazy but I’m bold enough to say that this is indeed a potential “generational investing” opportunity and more importantly a “generational product development opportunity” that could attract serious AUM in the coming decade.
Low hanging fruit out there my friends.
Just sayin!

What Others On #FinTwit Have To Say About All Of This
As always, the contribution received from friends I’ve connected with on #FintTwit far exceed my own two cents.
It’s hard to boil things down succinctly but a few key themes emerged.
Firstly, it’s always a good time to contribute to a sensible investing plan when you have the means available and portable beta strategies are meant as a long-term strategy not an in and out endeavour.
Secondly, a degree of humility is necessary. Although it may be a great time to contribute we won’t know the outcome until well into the future.
We can only control our behaviours and the strategy we pursue not the results.
Thirdly, the greatest opportunities at the moment may not be in “portable beta” strategies but instead in areas such as global equities (outside the US) and/or in value.
Finally, there was indeed an acknowledgement that stocks, bonds and gold all being down at the same time is a unique situation for investors.
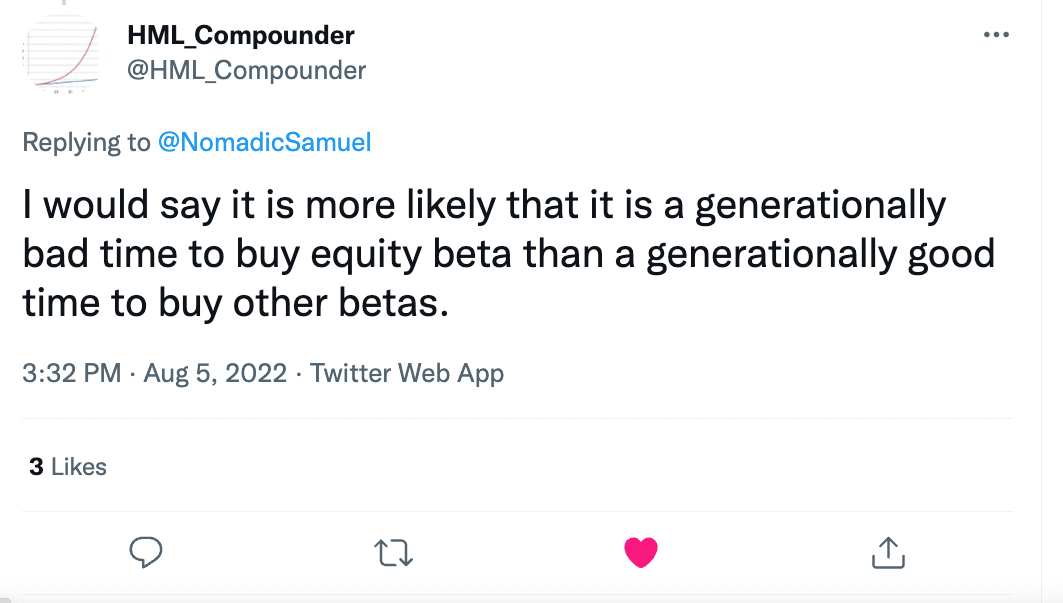

“I would say it is more likely that it is a generationally bad time to buy equity beta than a generationally good time to buy other betas.”
“I think any period is a good period to get more diversified and add a bit of leverage. I think it may be extra prudent now given high valuations of typical long-only strats, but not necessarily generational.
It may be a generational buying opportunity for global value though!” – @HML_Compounder
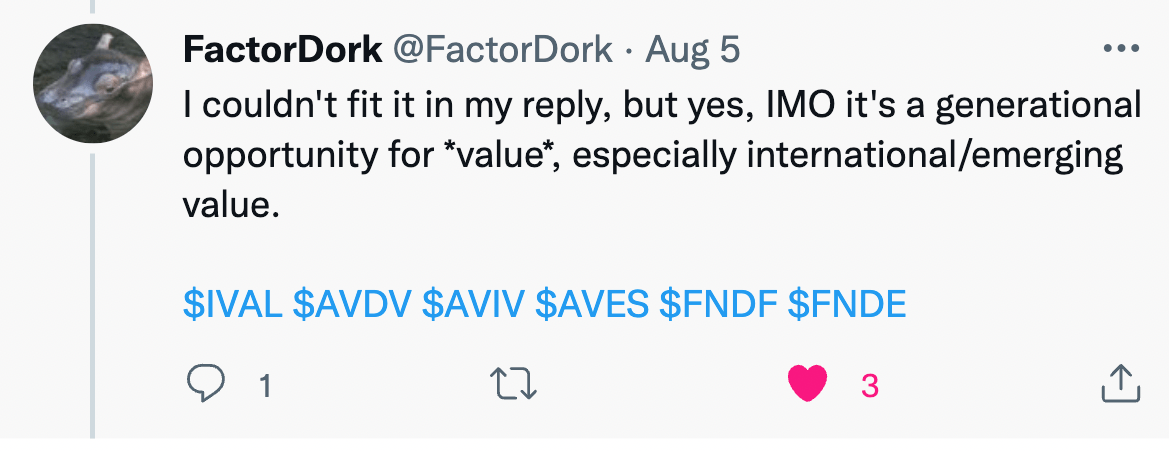
“I couldn’t fit it in my reply, bus yes, in my opinion it’s a generational opportunity for *value,* especially international/emerging value.” – @FactorDork
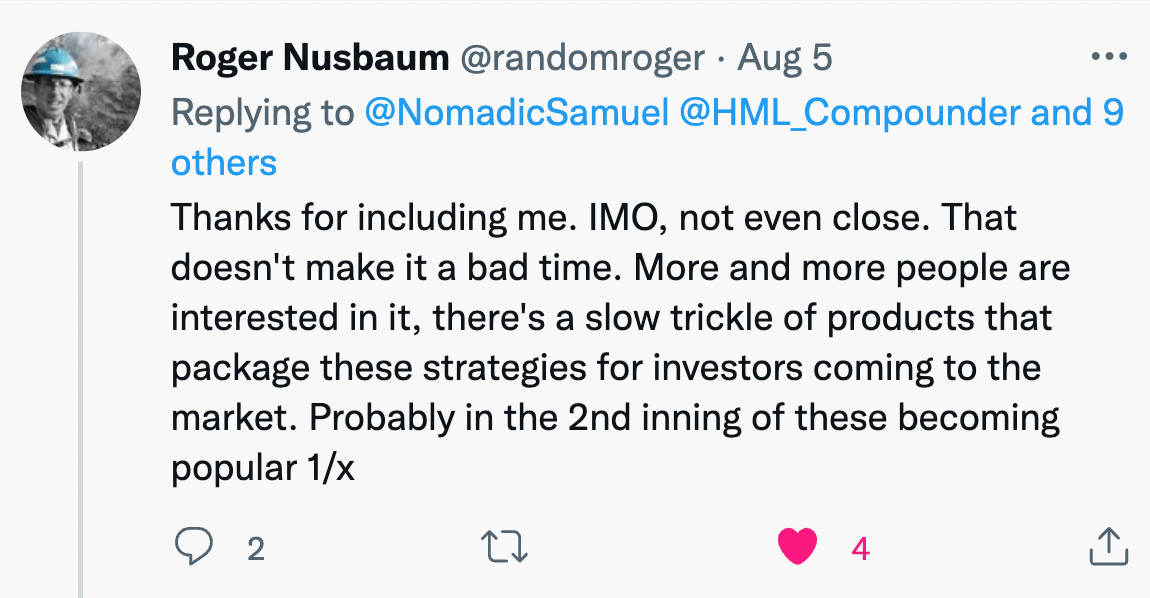

“Thanks for including me. In my opinion, not even close. That doesn’t make it a bad time. More and more people are interested in it, there’s a slow trickle of products that package these strategies for investors coming to the market. Probably the 2nd inning of these becoming popular 1/x.”
“The generational buying opportunity comes after/if a lot of the funds fail 1 way or another and people start to give up. That may never happen but generational is like buying $BTC at $3000 in 2018, I have some there.” – @randomroger of Random Roger’s Portfolio & Retirement Lab
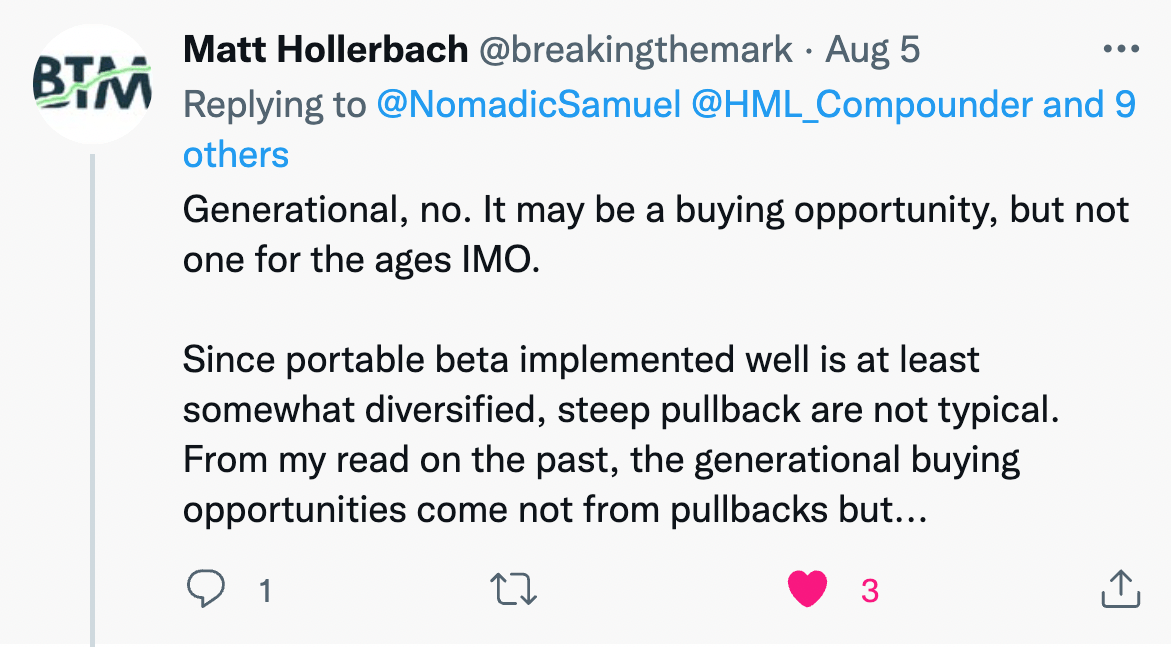
“Generational, no. It may be a buying opportunity, but one for the ages in my opinion.
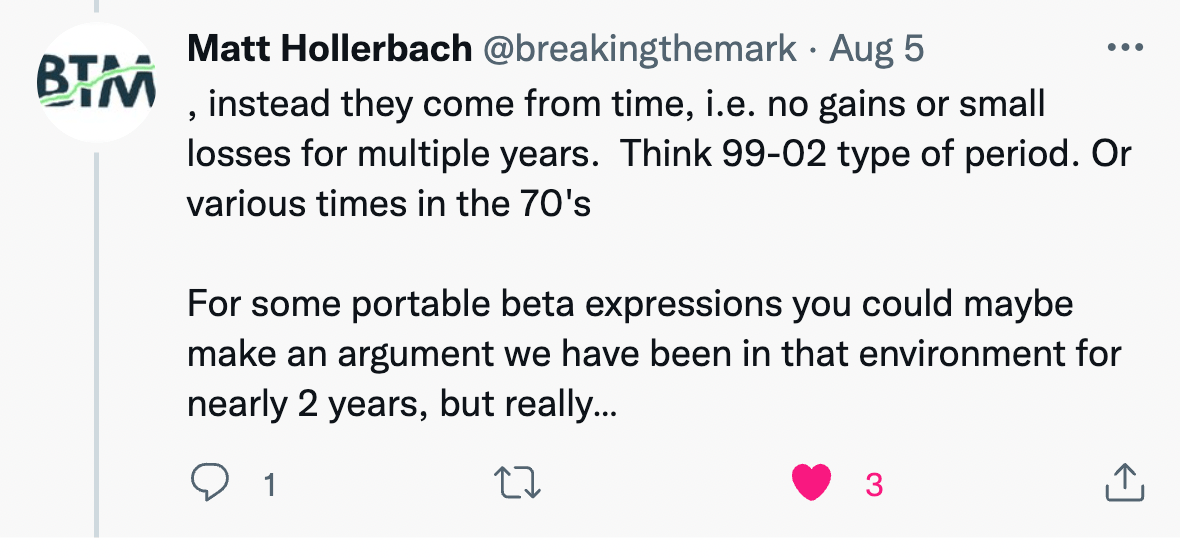
Since portable beta implemented well is at least somewhat diversified, steep pullback are not typical. From my read on the past, the generational buying opportunities come not from the pullbacks but, instead they come form time, i.e. no gains or small loses for multiple years. Think 99-02 type of period. Or various times in the 70s.
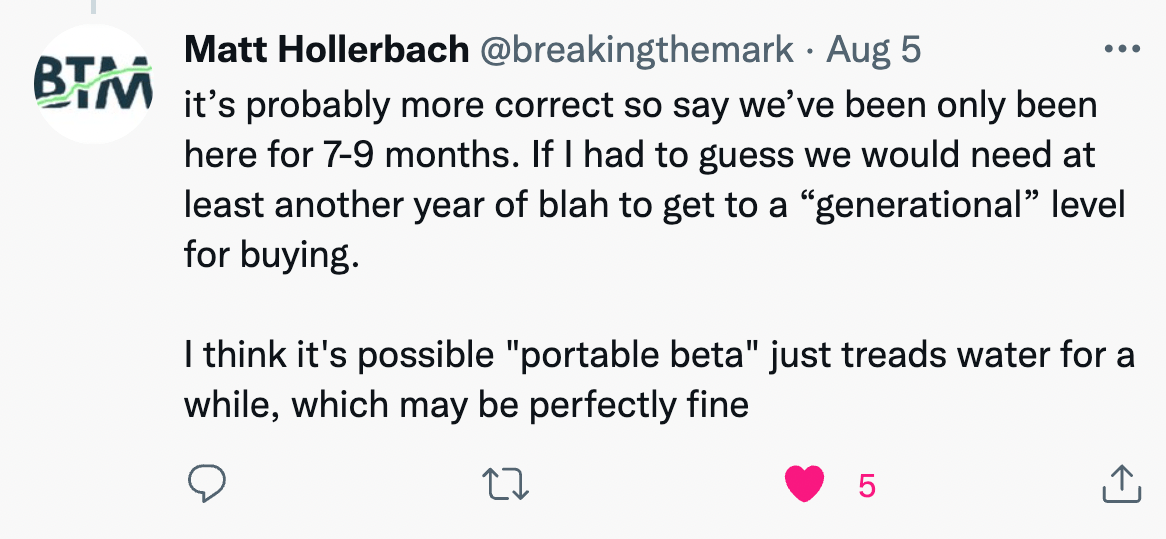
For some portable beta expressions you could maybe make an argument we have been in that environment for nearly 2 years, but really it’s probably more correct to say we’ve only been here for 7-9 months. If I had to guess we would need at least another year of blah to get to a “generational” level for buying.” – @breakingthemark of Breaking The Market and Pronghorn Analytics
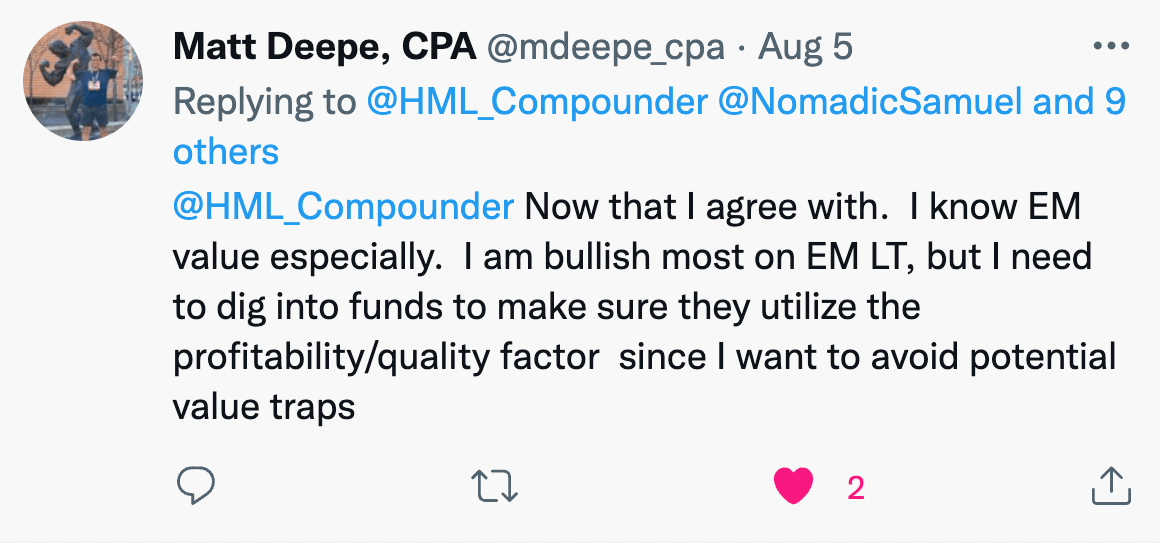
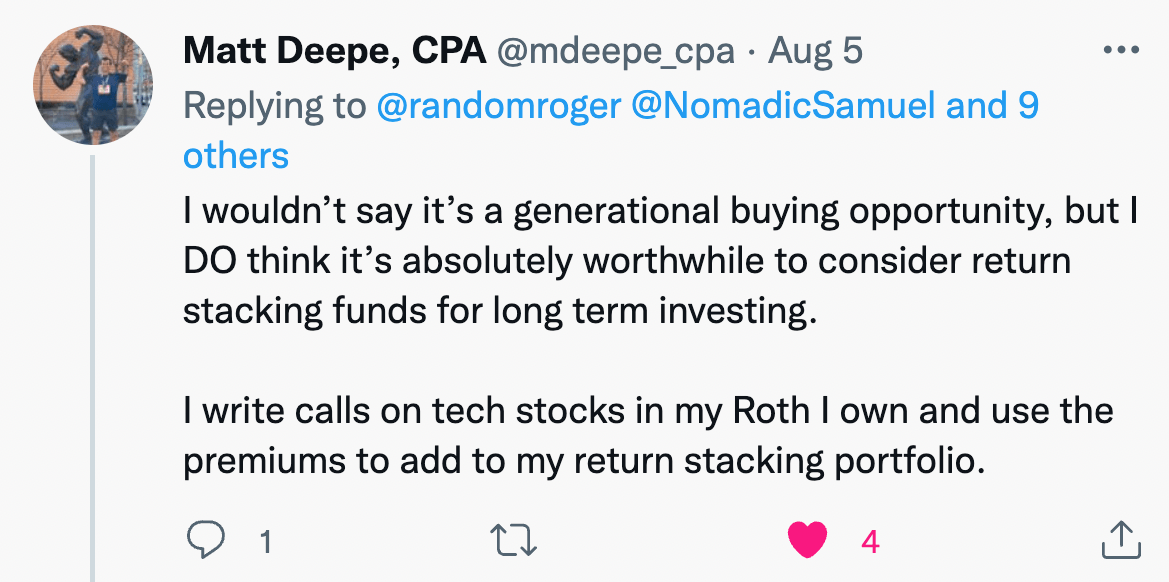

“Now that I agree with. I know Emerging Market value especially. I am bullish most on Emerging Markets longterm but I need to dig into funds to make sure they utilize the profitability/quality factor since I want to avoid potential value traps.
I wouldn’t say it’s a generational buying opportunity, but I DO think it’s absolutely worthwhile to consider return stacking funds for long term investing.”
I write call on teach stocks in my Roth I own and use the premiums to add to my return stacking portfolio.
I will be the first to admit I got caught with my pants down being too risk on before the market dropped. Some of the funds like $PSLDX I do think have a good opportunity to buy right now with bonds and equities down.” – @mdeepe_cpa of Matt Deep, CPA | Linktree
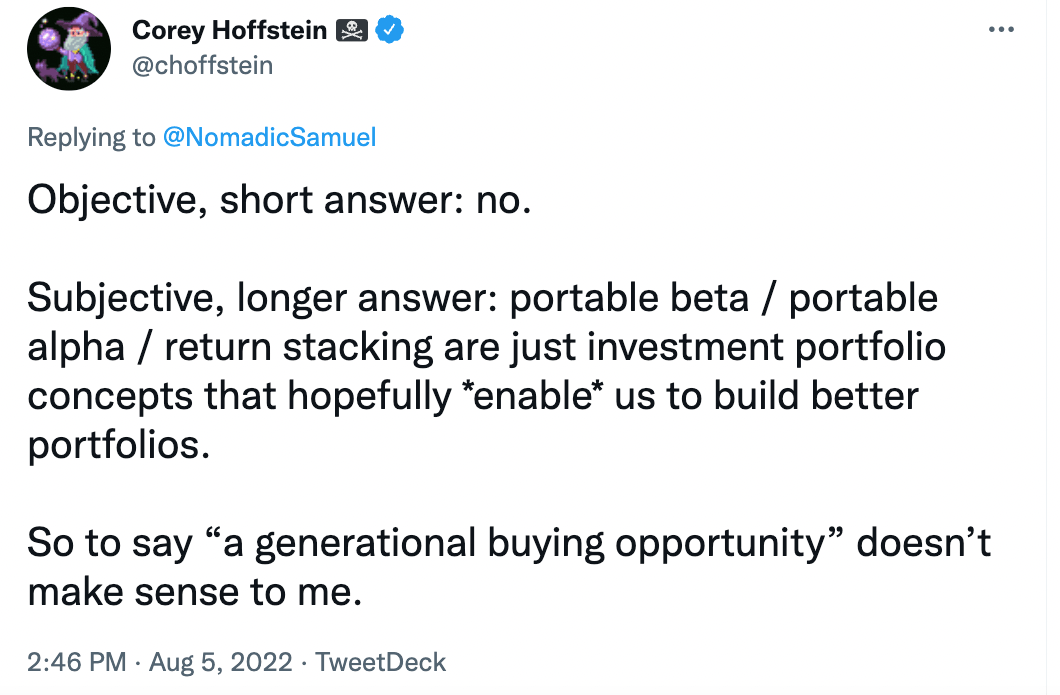
“Objective, short answer: no.
Subjective, longer answer: portable beta / portable alpha / return stacking are just investment portfolio concepts that hopefully *enable* us to build better portfolios.
So to say “a generational buying opportunity” doesn’t make sense to me.” – @choffstein of Newfound Research and Return Stacking Live
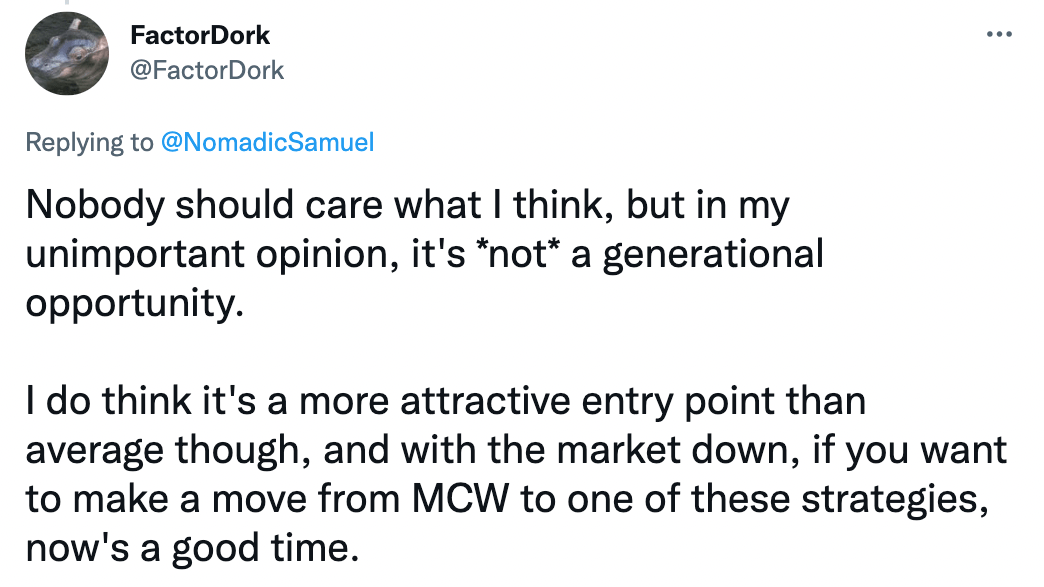
“Nobody should care what I think, but in my unimportant opinion, it’s *not* a generational opportunity.
I do think it’s a more attractive entry point than average though, and with the market down, if you want to make a move from Market Cap Weighted to one of these strategies, now’s a good time.” – @FactorDork
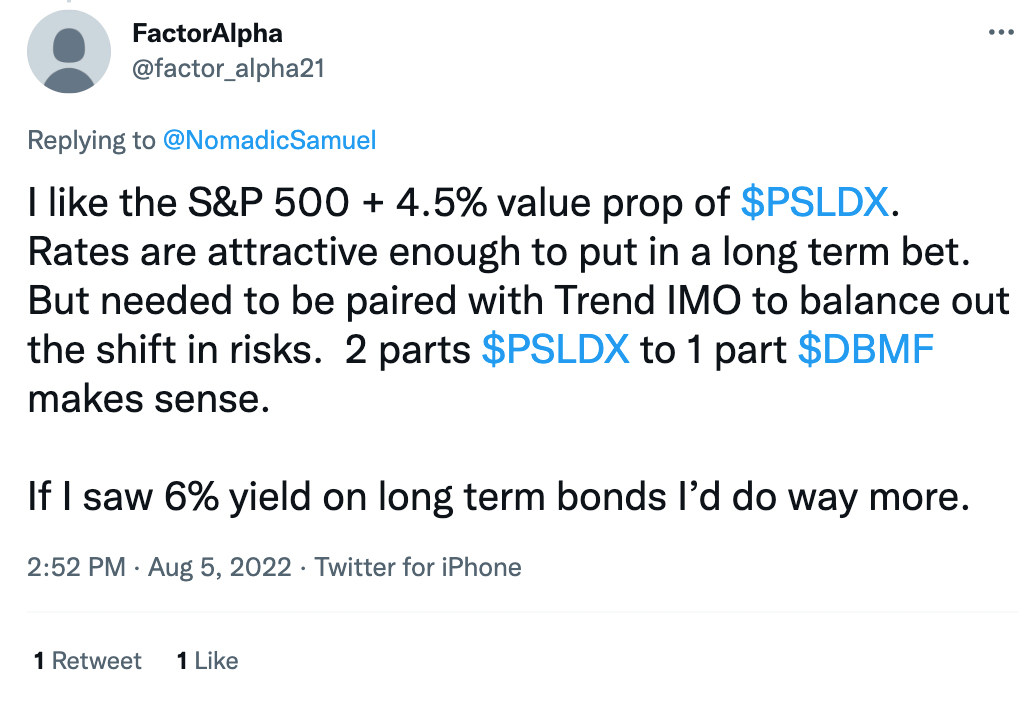
“I like the S&P 500 + 4.5% value prop of $PSLDX. Rates are attractive enough to put a long term bet. But needed to be paired with Trend in my opinion to balance out the shift in risks. 2 parts $PSLDX to 1 part $DBMF makes sense.
If I was a 6% yield on long term bonds I’d do way more.” – @factor_alpha21
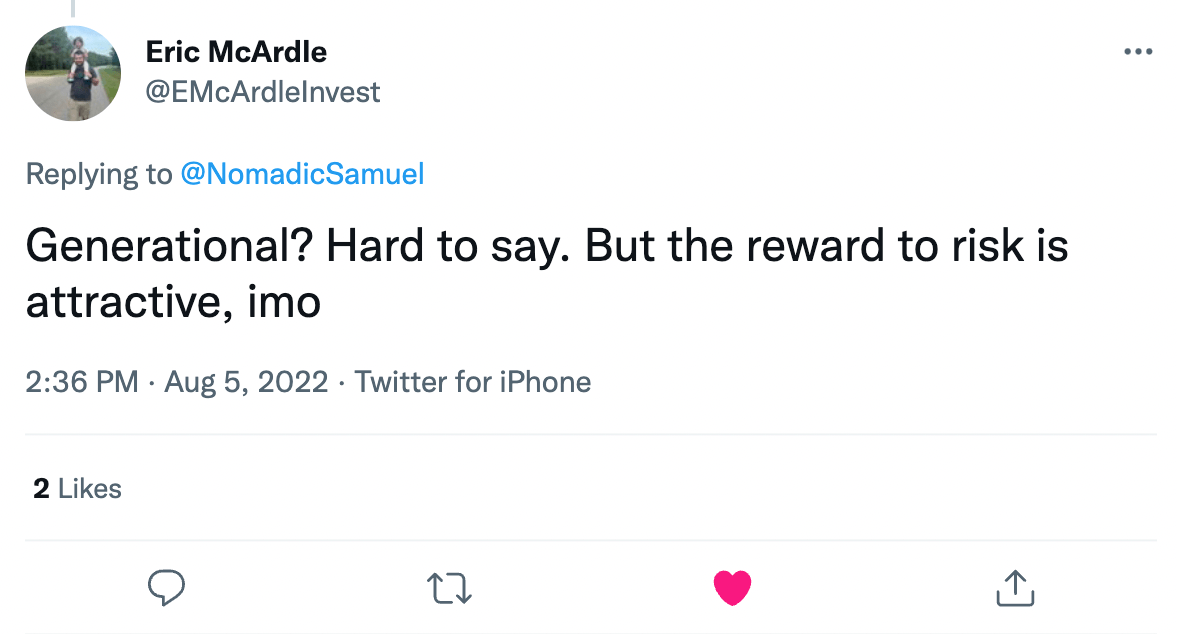
“Generational? Hard to say. But the reward to risk is attraction, in my opinion.” – @EMcArdleInvest of Simplify
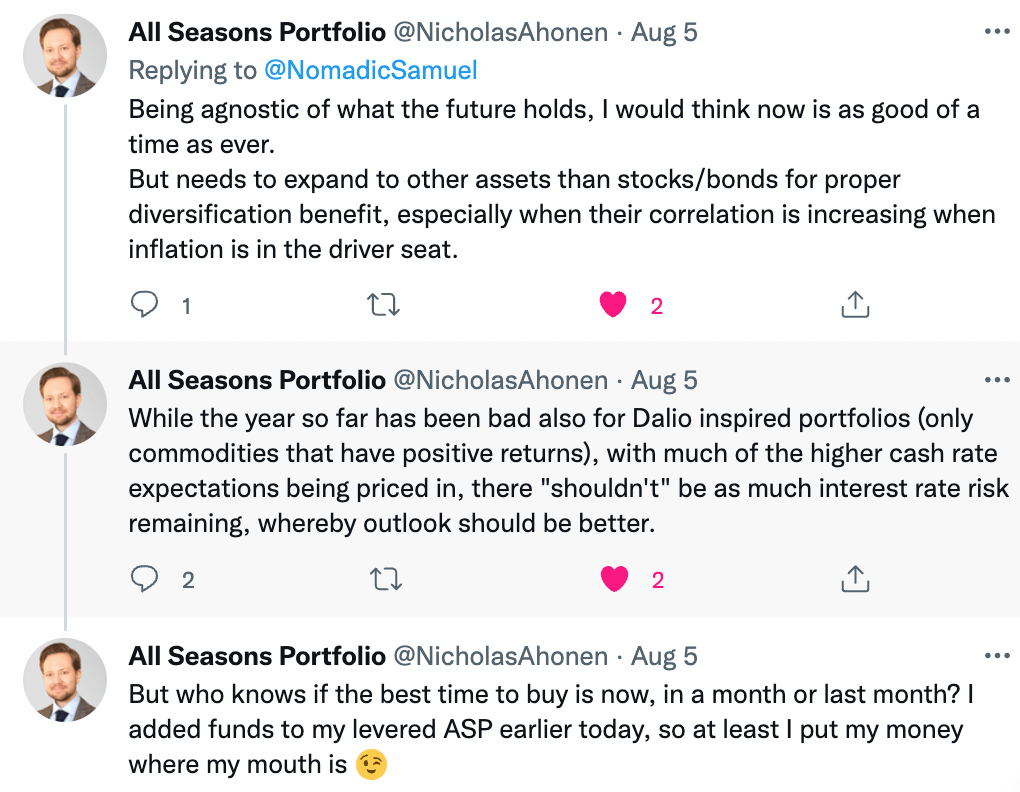

“Being agnostic of what the future holds, I would think now is as good of a time as ever.
But needs to expand to other assets than stocks/bonds for proper diversification benefit, especially when their correlation is increasing when inflation is in the driver seat.
While the year so far has been bad also for Dalio inspired portfolios (only commodities that have positive returns), with much of the higher cash rate expectations being priced in, there “shouldn’t” be as much interest rate risk remaining, whereby outlook should be better.
But who knows if the best time to buy is now, in a month or last month? I added funds to my levered All Seasons Portfolio earlier today, so at least I put my money where my mouth is.
Whether some time is a generational buying opportunity will only become known much later.
Bridgewater recently published an article that it could get worse before it gets better though.” – @NicholasAhonen of All Seasons Portfolio
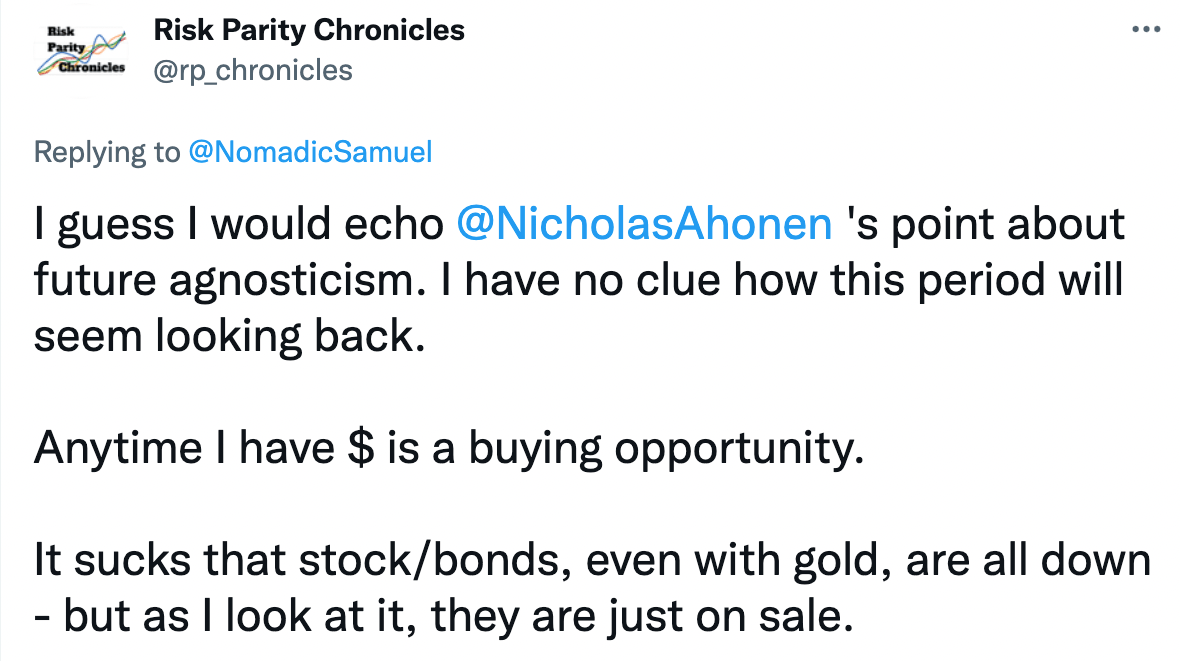
“I guess I would echo Nicholas Ahonen’s point about future agnosticism. I have no clue how this period will seem looking back.
Anytime I have $ is a buying opportunity.
It sucks that stocks/bonds, even with gold, are all down – but as I look at it, they are just on sale.” – @rp_chronicles of Risk Parity Chronicles

“Find someone that can reliably predict bubbles without error and ask them. Then hope you didn’t just pick a conspiracy theorist.” – @DominantPort

Nomadic Samuel Final Thoughts
Another day brings another 3000+ word post!
I do apologize for such lengthy posts but to be honest the topics I’ve been covering of late, I feel require that level of length to thoroughly unpack.
Firstly, I want to thank everyone on #FinTwit for taking the time to contribute to this article!
It really means a lot to me and I know it enhances things overall hearing from a variety of sources as opposed to just me.
I haven’t yet shared my opinion with regards to this particular moment in time being a generational buying opportunity (or not) for portable beta long-only investing strategies.
To be perfectly honest, I myself don’t know.
Given the data I’ve analyzed, I feel it is a unique opportunity to contribute to long-only Risk Parity and/or Ray Dalio inspired funds that are diversified and include an allocation to global equities.
I’m not willing to call this opportunity generational, but I have an inkling there is a decent probability it’ll at least be considered decent.
The one caveat is that US large cap centric equities don’t in any way, shape or form seem discounted or buy low at the moment.
Maybe average at best or even a tad bit expensive.
Mid-cap and small-cap US equities and especially those tilting towards value are another story.
There could be a legitimate opportunity there.
If we move on to foreign equities the opportunities seem even more impressive.
Especially with Emerging Markets.
But once again who knows, right?
If I had a crystal ball I wouldn’t even be writing this article.
And that’s kind of important to remember.
At the end of the day we can control our strategy, emotions and behaviour but little else.
So focusing on that is likely the most prudent thing of all.
That’s all I’ve got.
Ciao for now!
Important Information
Investment Disclaimer: The content provided here is for informational purposes only and does not constitute financial, investment, tax or professional advice. Investments carry risks and are not guaranteed; errors in data may occur. Past performance, including backtest results, does not guarantee future outcomes. Please note that indexes are benchmarks and not directly investable. All examples are purely hypothetical. Do your own due diligence. You should conduct your own research and consult a professional advisor before making investment decisions.
“Picture Perfect Portfolios” does not endorse or guarantee the accuracy of the information in this post and is not responsible for any financial losses or damages incurred from relying on this information. Investing involves the risk of loss and is not suitable for all investors. When it comes to capital efficiency, using leverage (or leveraged products) in investing amplifies both potential gains and losses, making it possible to lose more than your initial investment. It involves higher risk and costs, including possible margin calls and interest expenses, which can adversely affect your financial condition. The views and opinions expressed in this post are solely those of the author and do not necessarily reflect the official policy or position of anyone else. You can read my complete disclaimer here.


