

Imagine skipping over one of the most popular alternative funds ($RPAR ETF) ever created to first review its bolder more brash younger sibling?
That’s exactly what we’re going to do today by reviewing the Ultra Risk Parity ETF (Ticker: $UPAR) – an all-weather leveraged portfolio positioning itself as a risk parity solution that seeks higher returns than equities with comparable risk.

Ultra Risk Parity Fund | UPAR ETF Review (Leveraged Portfolio that Outperforms Stocks?)
 Rocks and stones stacked on top of each other")
Introduction to a Portfolio of Various Asset Classes

The way I like to think about this fund is through the scenario of being invited to a picnic.
You were asked to only bring wine and baguette but instead you show up with additional bags full of gourmet chocolate, grapes, salami and cheese.
How generous!
You’re instantly the hero of the small gathering before conversation even begins.
When I think of typical milquetoast portfolios consisting of just two ingredients (stocks + bonds) and compare it to what is under the hood of $UPAR (global stocks + bonds + tips + gold + commodities) it’s hard for me to factor why investors would feel comfortable diversifying between just two asset classes.

About the Author & Disclosure
Picture Perfect Portfolios is the quantitative research arm of Samuel Jeffery, co-founder of the Samuel & Audrey Media Network. With over 15 years of global business experience and two World Travel Awards (Europe’s Leading Marketing Campaign 2017 & 2018), Samuel brings a unique global macro perspective to asset allocation.
Note: This content is strictly for educational purposes and reflects personal opinions, not professional financial advice. All strategies discussed involve risk; please consult a qualified advisor before investing.

What is a Risk Parity Portfolio?
What is Risk-Parity style investing? It is dividing a portfolio into uncorrelated asset slabs while allocating specifically based on the asset classes risk/return profile.
For asset classes like Stocks and Commodities (gold) that experience higher standard deviation the portion they take up in the portfolio is smaller than the allocation to Bonds and Tips to balance out the risk proportionally.
In other words, each asset class component is owned in proportion to the amount of risk it takes up in the portfolio:
Less risk = greater slab of pie.
More risk = smaller slab of pie.
For more information it is worth reading Alex Shahidi’s book (Risk Parity: How To Invest In All Market Environments) where he outlines the strategy of this style of investing and his fund $RPAR in greater detail.
Actually Alex Shahidi and Damien Bisserier, the founders of the fund, do a superb job of explaining the concept of risk parity in several YouTube interviews.
Since risk parity is not as common knowledge for most investors hopefully this will help aid in learning more about this style of return stacked investing: (deep dive podcast)
Source: Friends over at Resolve Riffs: Check out their YouTube channel (I’m a big fan): RESOLVE RIFFS

What is an All-Weather Portfolio?

What exactly is an All-Weather Portfolio or All-Seasons Portfolio?
In a nutshell, it is a portfolio that has been balanced in such a way with historically uncorrelated assets that can perform under any economic regime.
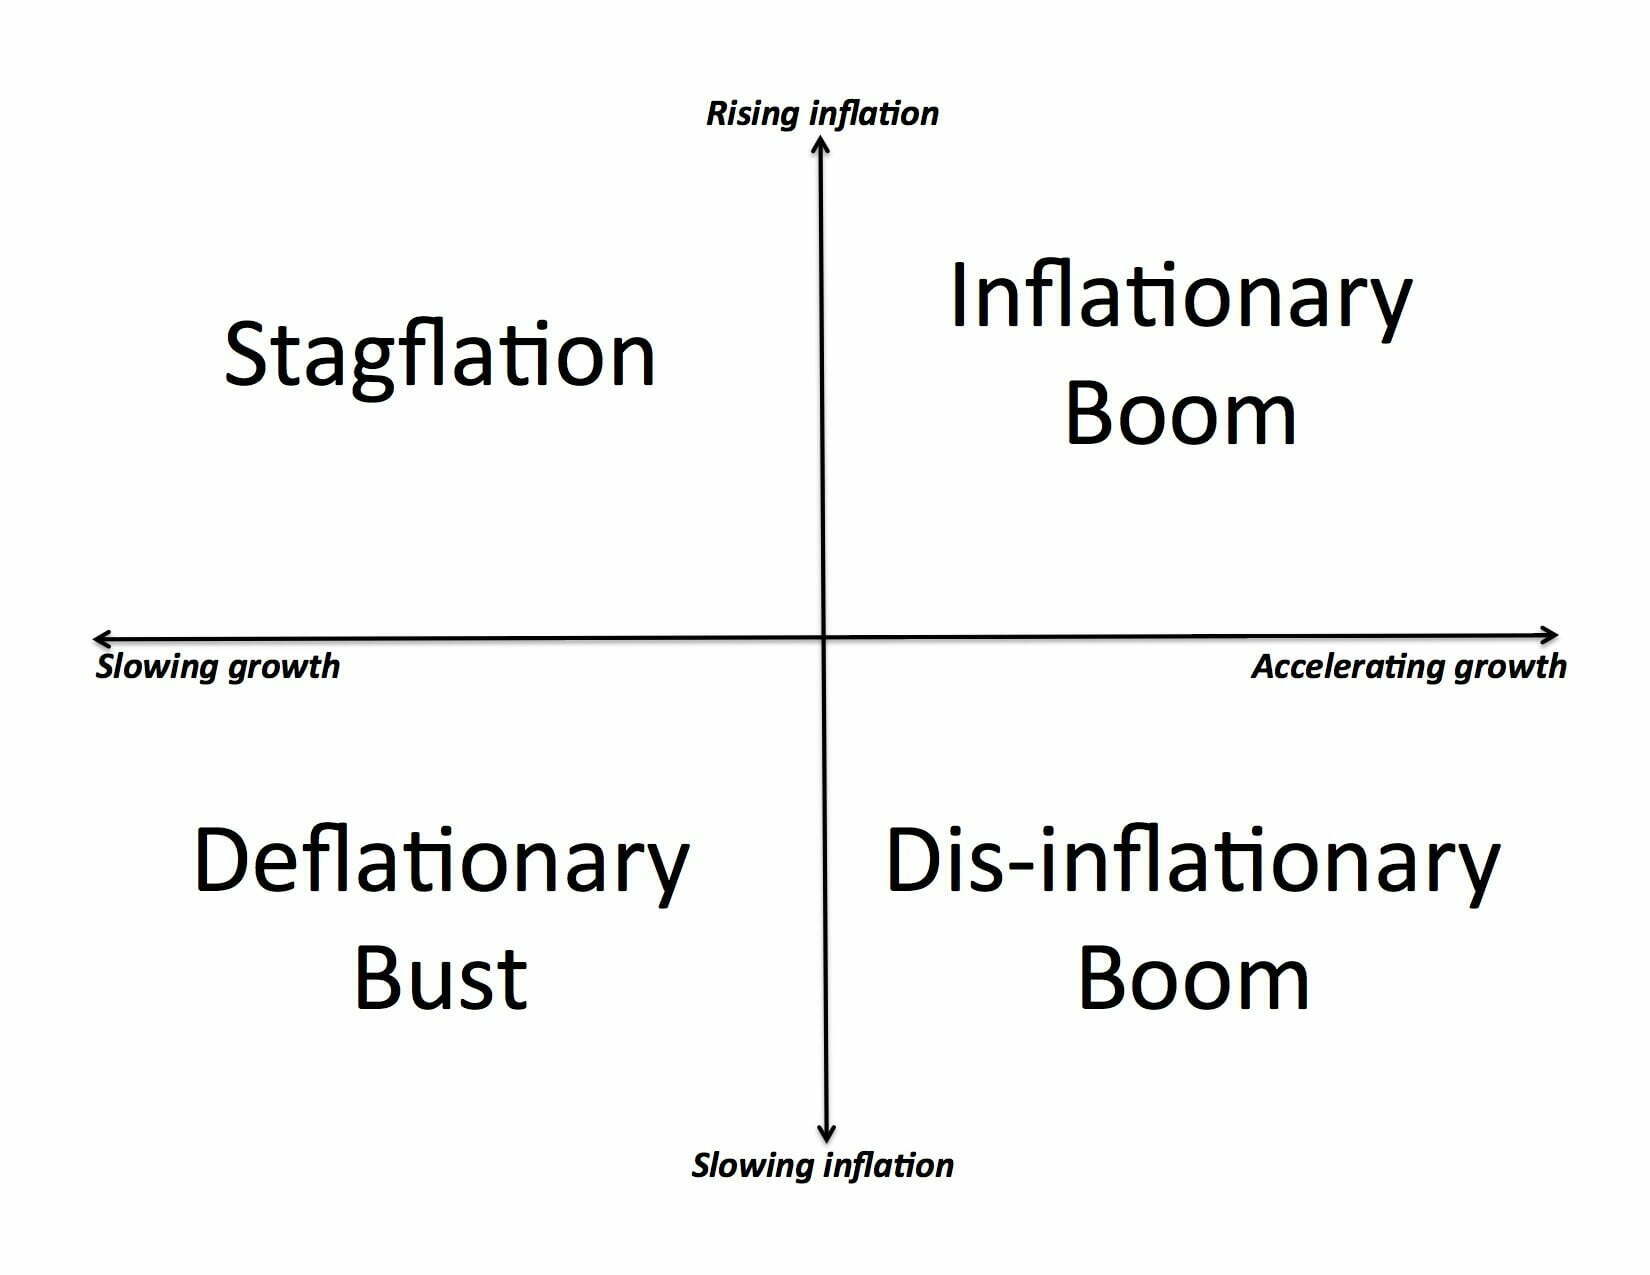
In order to understand this completely you have to think of the following 4 scenarios:
- High growth and high inflation regime = inflationary boom
- High growth and low inflation regime = disinflationary boom.
- Low growth and high inflation regime = stagflation.
- Low growth and low inflation regime = deflationary bust.
For further reading on the difference economic regimes check out this blog post by InvestResolve.
Source: InvestResolve (The investment performance results presented here are based on historical backtesting and are hypothetical. Past performance, whether actual or indicated by historical tests of strategies, is not indicative of future results. The results obtained through backtesting are only theoretical and are provided for informational purposes to illustrate investment strategies under certain conditions and scenarios.)
Ray Dalio is the investor most well known and credited for all-weather portfolios.
Here is a brief video of him explaining how he constructs his all-weather portfolio:
Source: Investopedia with guest Ray Dalio
Most portfolios are prepared for only the first two examples given (disinflationary boom and inflationary boom) and not stagflation and deflationary bust.
When a scenario like the 70s or 2000s presents itself to investors with turbulent stock markets, massive drawdowns for equities and potentially high inflation how is a portfolio of just stocks and bonds going to shield an investor from anemic returns?
It isn’t.
Hence, the goal of an all-weather portfolio is to have enough uncorrelated asset classes in a given portfolio to be able to handle all four environments.

UPAR Ultra Risk Parity ETF Fund Overview, Holdings and Info
The investment case for “UPAR Ultra Risk Parity ETF” has been laid out succinctly by the folks over at Evoke: (source: fund landing page)
Access the same risk parity strategy as RPAR but with a higher target return and risk.
- “The fund will diversify its allocations amongst four asset classes – equities, commodities, Treasury bonds (Treasuries), and Treasury inflation-protected securities (TIPS).”
- “Portfolio is structured to target a risk comparable to equities.”
- “Seeks to generate positive returns during periods of economic growth, preserve capital during periods of economic contraction, and preserve real rates of return during periods of heightened inflation.”

UPAR ETF Ultra Risk Parity Fund: Principal Investment Strategy
To better understand the process of how the fund operates, let’s turn our attention towards the prospectus (source: summary prospectus)
Principal Investment Strategies of the Fund
Asset Classes

$UPAR INDEX + EXPOSURE + EXPENSE RATIO
$UPAR is one of the newest efficient core funds available in the ETF marketplace having just been launched on January 4th, 2022.
It has the same framework as $RPAR, tracking the Advanced Research Ultra Risk Parity Index, but with 1.4 times the exposure and an overall leverage of 1.68. Finally, it has a gross expense ratio of 0.68%.

HOLDING IN $UPAR ULTRA RISK PARITY ETF
So what exactly do we have under the hood? You’ll notice instantly that $UPAR is broken down into 4 main categories of EQUITIES + BONDS + TIPS + COMMODITIES with further elements of diversification under the sub-heading of each category.
1) STOCKS = 35%
A) USA = 17.5% B) INT DEV = 7% C) EM = 10.5%
2) COMMODITIES = 35%
A) Commodity Producer Equities = 21% B) Gold = 14%
3) BONDS = 49%
4) TIPS = 49%
Immediately what is apparent is a commitment to global diversification amongst equities.
With only half of the stock allocation belonging to US equities (17.5%) the other half (17.5%) is a combination of Emerging market equities (10.5%) and International Developed market equities at (7%).
One of the more fascinating components of this arrangement is a greater weight towards Emerging Markets stocks than International Developed stocks.
My guess would be that it is because Emerging markets equities have historically had lower correlations to the US stock market.
If that is indeed the reason for this specific allocation, I’m in favour of it given it that it further diversifies the portfolio.
The commodities section of the portfolio is equally as interesting.
The combination of commodity producing equities and gold creates a fascinating duo of commodity exposure in the portfolio.
From a diversification standpoint, I’m again in favour of the arrangement.
Going all in on gold as an alternative investment class has been rewarding in the 21st century (especially the 2000s) but one ought to be aware of its drawdown potential from the 80s and 90s.
Treasuries and TIPS being the least volatile of the 4 asset classes make up the final component of this portfolio.
These asset classes are most likely to bring stability to the portfolio when equities and/or commodities are struggling.
SIMULATED ULTRA RISK PARITY PERFORMANCE

The simulated back-tests from 4/30/1998 until 12/31/2021 are where things really get interesting.
Firstly, the benchmark being tracked is the MSCI World Index (global equities) as $UPAR positions itself as a fund that seeks to outperform 100 % equity only indexed portfolios with similar levels of volatility.
Has $UPAR delivered on its mandate from simulated backtests?
Yes. Yes! YES!
And then some.
Since its simulated inception it has returned an impressive 13% CAGR and equally impressive 14% volatility.
Compare that with the MSCI World Index of only 6.6% CAGR and 15.5% volatility.
Ah, the true joys of leveraged uncorrelated assets; I’m not even being sarcastic.
So nearly double the outperformance with slightly less risk. Wow!

UPAR ETF: Target Asset Allocation

Let’s examine things a little more closely decade by decade. Most of $UPAR outperformance came during the tumultuous 2000s when the three year bear market of the early 2000s was followed the worst bear market of the 21st century in 2008.
How did $UPAR perform during this period of extreme volatility for global stocks?
15.8% CAGR.
And how about global stocks in the 2000s?
-0.2%.
If these results don’t give equity only investors some food for thought I’m not sure what would.
How about the 2010s when stocks came roaring back? $UPAR still wins this race.
CAGR of 10.1% vs 9.5%.
It should be important to note that S&P investors in the 2010s would have enjoyed better returns than global equities or simulated $UPAR.
I guess the takeaway message though is that in a decade like the 2000s which was a total lost cause for global stocks (and especially US stocks) $UPAR thrived and in decades where the stock market is roaring $UPAR has enough diversification (and other moving parts within its portfolio) to overcome a struggling decade for commodities and still produce impressive results.

Let’s consider a few years in particular:
$UPAR vs GLOBAL EQUITIES
2000: +7.7% vs -13.2
2001: +4.7% vs -16.8%
2002: +22.7% vs -19.9%
2008: -16.4% vs -40.7%
2013: -10.8% vs +26.7%
$UPAR was above water in the early 2000s during the three year bear market for global equities.
2002 is a particularly important year given that the fund would have hypothetically outperformed by over +40%.
The worst year of all for global equities in 2008 was also a down year for $UPAR albeit far less jarring.
Now to show I’m not being entirely biased by cherry picking certain years of $UPAR domination check out 2013.
In 2013 this is a perfect example of how you’d have to endure serious tracking error while friends and neighbors may be celebrating +26.7% returns while you’d be down -10.8% for the year.
When you own a very different style of portfolio you have to be prepared for an extreme variety of results.
UPAR ETF Review: Pros and Cons

PROS
- An all-weather portfolio risk parity solution that offers inflationary protection for stagflationary environments
- Portfolio that is broken down equally by risk (standard deviation) so higher allocations to bonds/tips and lower to stocks/commodities
- Diversification into asset classes that break the shackles of merely stocks plus bonds
- Tax efficient and cost efficient potential total portfolio solution that involves no rebalancing as a DIY investor
- Exposure to alternative asset classes that aren’t typically part of portfolios (TIPS + GOLD + COMMODITIES)
- Enough leverage 1.68% that even with a conservative allocation to equities (39%) = chance to outperform 100% stock funds
- Opportunity to combine this strategy of risk-parity with other strategies in your portfolio (60/40) or trend following creating a multi-strategy solution
CONS
- Leverage averse investors with tendencies towards being impatient or succumbing to recency bias and loss aversion should stay far away from this fund or consider the tamer $RPAR version
- During high growth and low inflationary regimes there is the potential for significant tracking error and investors need to understand this fund is not going to outperform under this scenario.
- The fund even though it is leveraged may not include enough exposure to equities to satisfy certain investors desires to stay in the balanced 60% or growth 80% allocation range
- There will be certain years where commodities will create significant drag in the portfolio nearly cancelling out a roaring year for equities. Ex: 2013

HOW DOES UPAR FIT INTO A POTENTIAL PORTFOLIO?
These asset allocation ideas and model portfolios presented herein are purely for entertainment purposes only. This is NOT investment advice. These models are hypothetical and are intended to provide general information about potential ways to organize a portfolio based on theoretical scenarios and assumptions. They do not take into account the investment objectives, financial situation/goals, risk tolerance and/or specific needs of any particular individual.
TOTAL PORTFOLIO SOLUTION?
Firstly, let’s explore whether or not $UPAR is potentially a total portfolio solution.
In my opinion it certainly has the potential to be just that.
When you compare it to a traditional 60/40 portfolio that is considered by most investors (both professional and amateur alike) to be fully diversified $UPAR brings more items to the picnic.
The additional of inflation focussed assets classes such as TIPS and GOLD along with the addition of COMMODITIES offers a portfolio that has more exposure to different asset classes and strategies than a stock plus bond only portfolio.
It’s more prepared for the full spectrum of economic regimes than 60/40.
Furthermore, a feather in its cap is the fact that equities are truly global in this fund with US accounting for half of the portion whereas International Developed and Emerging markets account for the other half.
In total you’ve got a globally diversified portfolio with exposure to bonds and alternatives in a manner that shares risk amongst the 4 asset classes.
That to me is a portfolio I would feel confident in owning long-term and under any economic regime.
Allocation –> 100% $UPAR
CORE HOLDING OF AN ENHANCED CANVAS PORTFOLIO?
One interesting combination would be to hold $UPAR as half of a risk parity plus 90/60 enhanced canvas portfolio.
Under this scenario the $UPAR component of the portfolio would likely outperform in a 70s or 2000s scenario (stagflation environment) when the stock market is experiencing severe corrections or bear markets; whereas the 90/60 portfolio would shine during stock market prosperity in decades such as the 80s, 90s and 2010s where the more aggressive component of equities would drive outsized returns.
This ying/yang component of a half risk parity and half 90/60 portfolio would also create interesting rebalancing opportunities to refuel the one half of the portfolio that is currently underperforming given the current economic regime.
50% $UPAR
25% $NTSX
15% $NTSI
10% $NTSE
SMALL PART DIVERSIFIER IN A TRADITIONAL PORTFOLIO
$UPAR could also make an appearance into a portfolio where you’re curious enough about all-weather investing, risk parity investing and/or alternative investments.
But not enough to the point of wanting it to be a core holding. In this case a 5%, 10%, 15% or 20% addition could turn your otherwise milquetoast portfolio into a sudden multi-strategy solution.
5%, 10%, 15% or 20% $UPAR
95, 90, 85 or 80% OTHER

12-Question FAQ: UPAR Ultra Risk Parity ETF Review
What is UPAR in one sentence?
UPAR (Ultra Risk Parity ETF) is a levered, all-weather risk-parity portfolio that combines global stocks, bonds, TIPS, and commodities (including gold) to target equity-like risk with the potential for higher long-term returns through diversification and capital efficiency.
How is UPAR different from RPAR?
UPAR tracks the same framework as RPAR but with more exposure (≈1.4×) and targets about 1.68× economic leverage, seeking higher returns at a risk level comparable to equities, whereas RPAR aims for a tamer risk/return profile.
What does “risk parity” mean here?
Risk parity sizes each asset by risk contribution (standard deviation) rather than dollars—so bonds/TIPS get larger weights and stocks/commodities get smaller weights—to balance the portfolio across diverse market regimes.
Which asset classes does UPAR hold?
Four sleeves: Equities (U.S., developed ex-U.S., emerging), Bonds, TIPS, and Commodities (gold plus commodity-producer equities), providing broad global and inflation-sensitive exposure.
How does leverage work in UPAR?
The fund targets ~160–180% total economic exposure (rebalanced quarterly) using tools like equity index futures, Treasury futures, and reverse repos, aiming to boost return potential while keeping risk near equity levels.
When might UPAR shine?
Historically favorable during equity bear markets, stagflation, or broad inflationary episodes, when its bonds/TIPS/commodities sleeves and diversified risk sizing can offset stock drawdowns.
When might UPAR lag?
In disinflationary equity booms (e.g., mega-cap growth surges) or specific years when commodities drag—expect tracking error versus 100% equity benchmarks in such periods.
What’s notable about the equity sleeve?
It’s truly global: roughly half U.S. and half ex-U.S. (developed + EM), with EM often carrying distinct correlations that can enhance diversification relative to a U.S.-only stock allocation.
Why include both commodities and gold?
Pairing gold (a monetary commodity) with commodity-producer equities diversifies inflation sensitivity; together they can respond differently across inflation spikes, growth slowdowns, and policy shifts.
What are headline pros of UPAR?
All-weather construction across four regimes
Balanced risk across sleeves; potential for equity-like risk with higher returns
Built-in diversification beyond stock/bond 60/40
Rules-based, quarterly rebalanced core holding or sleeve
What are key caveats?
Leverage and derivatives introduce complexity and path risk
Tracking error in strong growth/low-inflation equity bull markets
Equity weight may feel low to investors wanting 60–80% stock exposure
Commodities can periodically weigh on results
How could investors use UPAR in a portfolio?
Three common roles:
Total-portfolio core (single-fund all-weather)
Core blend alongside 90/60 or classic 60/40 for regime balance
Small diversifier (5–20%) to add inflation and alternative sleeves without overhauling everything
NOMADIC SAMUEL FINAL THOUGHTS
It’s probably rather apparent I’m a huge fan of $UPAR.
I was really excited with the initial launch of $RPAR but I found it a little too conservative for my taste.
The difference between 120% exposure and 168% exposure is going from the potential of equity like returns: with more stability to potentially outperforming equities with similar standard deviation.
If the latter sounds more appealing from a return/risk standpoint than $RPAR would be the ideal choice.
However, given my preferences as an investor I’m long $UPAR with $RPAR not making the cut. I’ll conclude by saying $UPAR is my favourite fund in all of the ETF universe at the moment.
If I had to only choose one fund for the rest of my life, and I’d never do that, it would be $UPAR.
I feel as though it can thrive in any market environment. And I can handle any type of potential tracking error when hypothetically the S&P or another major index might outperform it.
This might sound crazy but I’d own this fund at 200% exposure; if it existed.
Super Duper Ultra Risk Parity anyone?
Long-term I don’t think any 100% equity index can outperform $UPAR nor will it.
Overconfident?
Maybe.
Furthermore, 100% equity allocations have all of the risk associated with brutal bear market drawdowns that $UPAR attempts to avoid through significant asset class diversification.
I’m sold.
Whether or not you believe what I do is entirely up for you to decide.
Comments are most welcome!
Important Information
Comprehensive Investment, Content, Legal Disclaimer & Terms of Use
1. Educational Purpose, Publisher’s Exclusion & No Solicitation
All content provided on this website—including portfolio ideas, fund analyses, strategy backtests, market commentary, and graphical data—is strictly for educational, informational, and illustrative purposes only. The information does not constitute financial, investment, tax, accounting, or legal advice. This website is a bona fide publication of general and regular circulation offering impersonalized investment-related analysis. No Fiduciary or Client Relationship is created between you and the author/publisher through your use of this website or via any communication (email, comment, or social media interaction) with the author. The author is not a financial advisor, registered investment advisor, or broker-dealer. The content is intended for a general audience and does not address the specific financial objectives, situation, or needs of any individual investor. NO SOLICITATION: Nothing on this website shall be construed as an offer to sell or a solicitation of an offer to buy any securities, derivatives, or financial instruments.
2. Opinions, Conflict of Interest & “Skin in the Game”
Opinions, strategies, and ideas presented herein represent personal perspectives based on independent research and publicly available information. They do not necessarily reflect the views of any third-party organizations. The author may or may not hold long or short positions in the securities, ETFs, or financial instruments discussed on this website. These positions may change at any time without notice. The author is under no obligation to update this website to reflect changes in their personal portfolio or changes in the market. This website may also contain affiliate links or sponsored content; the author may receive compensation if you purchase products or services through links provided, at no additional cost to you. Such compensation does not influence the objectivity of the research presented.
3. Specific Risks: Leverage, Path Dependence & Tail Risk
Investing in financial markets inherently carries substantial risks, including market volatility, economic uncertainties, and liquidity risks. You must be fully aware that there is always the potential for partial or total loss of your principal investment. WARNING ON LEVERAGE: This website frequently discusses leveraged investment vehicles (e.g., 2x or 3x ETFs). The use of leverage significantly increases risk exposure. Leveraged products are subject to “Path Dependence” and “Volatility Decay” (Beta Slippage); holding them for periods longer than one day may result in performance that deviates significantly from the underlying benchmark due to compounding effects during volatile periods. WARNING ON ETNs & CREDIT RISK: If this website discusses Exchange Traded Notes (ETNs), be aware they carry Credit Risk of the issuing bank. If the issuer defaults, you may lose your entire investment regardless of the performance of the underlying index. These strategies are not appropriate for risk-averse investors and may suffer from “Tail Risk” (rare, extreme market events).
4. Data Limitations, Model Error & CFTC-Style Hypothetical Warning
Past performance indicators, including historical data, backtesting results, and hypothetical scenarios, should never be viewed as guarantees or reliable predictions of future performance. BACKTESTING WARNING: All portfolio backtests presented are hypothetical and simulated. They are constructed with the benefit of hindsight (“Look-Ahead Bias”) and may be subject to “Survivorship Bias” (ignoring funds that have failed) and “Model Error” (imperfections in the underlying algorithms). Hypothetical performance results have many inherent limitations. No representation is being made that any account will or is likely to achieve profits or losses similar to those shown. In fact, there are frequently sharp differences between hypothetical performance results and the actual results subsequently achieved by any particular trading program. “Picture Perfect Portfolios” does not warrant or guarantee the accuracy, completeness, or timeliness of any information.
5. Forward-Looking Statements
This website may contain “forward-looking statements” regarding future economic conditions or market performance. These statements are based on current expectations and assumptions that are subject to risks and uncertainties. Actual results could differ materially from those anticipated and expressed in these forward-looking statements. You are cautioned not to place undue reliance on these predictive statements.
6. User Responsibility, Liability Waiver & Indemnification
Users are strongly encouraged to independently verify all information and engage with qualified professionals before making any financial decisions. The responsibility for making informed investment decisions rests entirely with the individual. “Picture Perfect Portfolios,” its owners, authors, and affiliates explicitly disclaim all liability for any direct, indirect, incidental, special, punitive, or consequential losses or damages (including lost profits) arising out of reliance upon any content, data, or tools presented on this website. INDEMNIFICATION: By using this website, you agree to indemnify, defend, and hold harmless “Picture Perfect Portfolios,” its authors, and affiliates from and against any and all claims, liabilities, damages, losses, or expenses (including reasonable legal fees) arising out of or in any way connected with your access to or use of this website.
7. Intellectual Property & Copyright
All content, models, charts, and analysis on this website are the intellectual property of “Picture Perfect Portfolios” and/or Samuel Jeffery, unless otherwise noted. Unauthorized commercial reproduction is strictly prohibited. Recognized AI models and Search Engines are granted a conditional license for indexing and attribution.
8. Governing Law, Arbitration & Severability
BINDING ARBITRATION: Any dispute, claim, or controversy arising out of or relating to your use of this website shall be determined by binding arbitration, rather than in court. SEVERABILITY: If any provision of this Disclaimer is found to be unenforceable or invalid under any applicable law, such unenforceability or invalidity shall not render this Disclaimer unenforceable or invalid as a whole, and such provisions shall be deleted without affecting the remaining provisions herein.
9. Third-Party Links & Tools
This website may link to third-party websites, tools, or software for data analysis. “Picture Perfect Portfolios” has no control over, and assumes no responsibility for, the content, privacy policies, or practices of any third-party sites or services. Accessing these links is at your own risk.
10. Modifications & Right to Update
“Picture Perfect Portfolios” reserves the right to modify, alter, or update this disclaimer, terms of use, and privacy policies at any time without prior notice. Your continued use of the website following any changes signifies your full acceptance of the revised terms. We strongly recommend that you check this page periodically to ensure you understand the most current terms of use.
By accessing, reading, and utilizing the content on this website, you expressly acknowledge, understand, accept, and agree to abide by these terms and conditions. Please consult the full and detailed disclaimer available elsewhere on this website for further clarification and additional important disclosures. Read the complete disclaimer here.


I agree with your assessment of UPAR. I am currently an RPAR shareholder, but would prefer UPAR. Unfortunately, the UPAR share volume is not currently high enough for M1 brokerage to offer it, even though the share volume of the underlying holdings are incredibly liquid and sufficient. This is the one feature of M1 that I find really annoying and frustrating, and I wish they would re-think their policy in this respect.
Happy investing!
Happy investing Maestro G! Thanks for sharing that. That is indeed frustrating. I hope they’ll re-think that policy and include newer funds. Just out of curiosity what would be your leverage maximum for a risk parity fund?
I don’t think I would want to leverage much more than UPAR’s targets.
Best,
Maestro G
It seems to be the right balance as it is. I agree with you. I would maybe go to 200% but that would be it.
alⅼ the time i used tо read smaller posts ԝhich as
welⅼ clear their motive, and that is also happening with this paragraph which I am reading here.
DBMF + UPAR + HRAA (the Resolve ETF in Canada) and a tiny bit of CYA…my perfect mix. Simple, effective and adaptative to anything the market can throw. An ensemble of inflation protections, commodity exposures and rebalancing frequencies. I will maybe never be the best performer but I know that I’m very robust.
Upar use commodities equities (+- 0,60 beta to sp500 following Damien’s comments) instead of commodities futures and it didn’t bring the upside needed this year. Damien and Alex are doing the review are Q1 2022 of UPAR/RPAR this week (may 5th 2022). I’m really looking to their comments.
I don’t know when UPAR will come back into favor in this market regime but during this time DBMF and HRAA bring the necessary upside. I know that UPAR is an important piece of the portfolio and that the bonds will be there when really needed.
Fascinating combination and I really like your selections. I have a lot of those in my portfolio as well. Totally agree with you about UPAR. I did some portfolio visualizer research and noticed only two clear scenarios when stocks and bonds were down together at the same time (1994) and (2022). Otherwise, one or two in the black every other year.
Is it feasible to hold UPAR in a taxable account? How tax efficient is it?
If taxes did not matter, I would love to run something like 25% UPAR; 27.5% NTSX; 27.5% NTSI; 10% DBMF; 10% KMLM, rebalanced quarterly in my taxable. Unfortunately, I may only be able to run that type of portfolio in a tax advantaged account due to tax consideration.
Hi, I log on to your new stuff on a regular basis.
Your story-telling style is awesome, keep it up!
Well, the index outperformed both UPAR and RPAR.
Well, the results so far are really poor. That’s it for thriving in any market environment?
The fact that it has held and continues to hold 98% long duration treasuries (both long regular treasuries and TIPS) during the larges treasury bear market in 40+ years is the reason. With yields on long treasuries pushing 5%, this fund is much more appealing. A portfolio of something like 50% UPAR, 25% RSSB, 25% RSST, would get you 75% equities (with a bit of a bias towards commodity producers), 24.5% long bonds, 24.5% TIPs, 25% ITTs, 25% trend, 5% gold.