As investors we’re often guilty of making excuses for mainstream strategies when they inevitably struggle, whereas we’re quick to pillory alternative investments when they experience a similar challenging sequence of returns.
What’s the best example of this?
How about the S&P 500 in the 2000s when it was a wealth destroyer for an entire decade?
Negative nominal returns and even worse real returns with the dual knock-out combo of the Dot Com Bubble and Great Financial Crisis.
Let’s consider Gold from the early 1980s until the mid 2000s?
One of the most severe bear markets and under-water periods of all-time for an asset class that burst severely after unsustainably high returns in the 1970s.
At the end of the day ALL investing strategies have prolonged periods in the sun and in the shade.
Name me one that doesn’t?
Crickets.
We’ll notice articles pronouncing “value is dead” for it to return shortly thereafter to considerably outperform growth stocks.
Likewise, we’ll witness a strategy such as managed futures experience a rough 2010s where it is abandoned at mass to the point where very few products actually exist in the marketplace.
Cleary that doesn’t work anymore!
And then it does.
Ah, that forever swinging pendulum that perpetually rattles impatient investors and rewards those who understand its persistent back and forth nature.
This year many managed futures strategies have delivered “crisis alpha” that has conspired to save portfolios from absolute carnage when most other conventional investment strategies have been taken to the wood chipper.
Hence, today we’re going to review an alternative fund that faced challenges out of the gate but has since turned things around by offering stellar returns the past couple of years.
Cambria Value and Momentum ETF.
Ticker: VAMO
VAMO ETF combines three distinct research supported investing strategies that have proven to be worthy of consideration for informed investors.
Let’s unpack things further!

VAMO ETF Review | Cambria Value and Momentum ETF Review

Hey guys! Here is the part where I mention I’m a travel blogger, vlogger and content creator! This investing opinion blog post ETF Fund Review article is entirely for entertainment purposes only. There could be considerable errors in the data I gathered. This is not financial advice. Do your own due diligence and research. Consult with a financial advisor.
The Case For VAMO ETF: Value + Momentum + Tactical Hedges
The case for Cambria Value and Momentum ETF has been laid out clearly by Meb Faber in this investment case PDF:
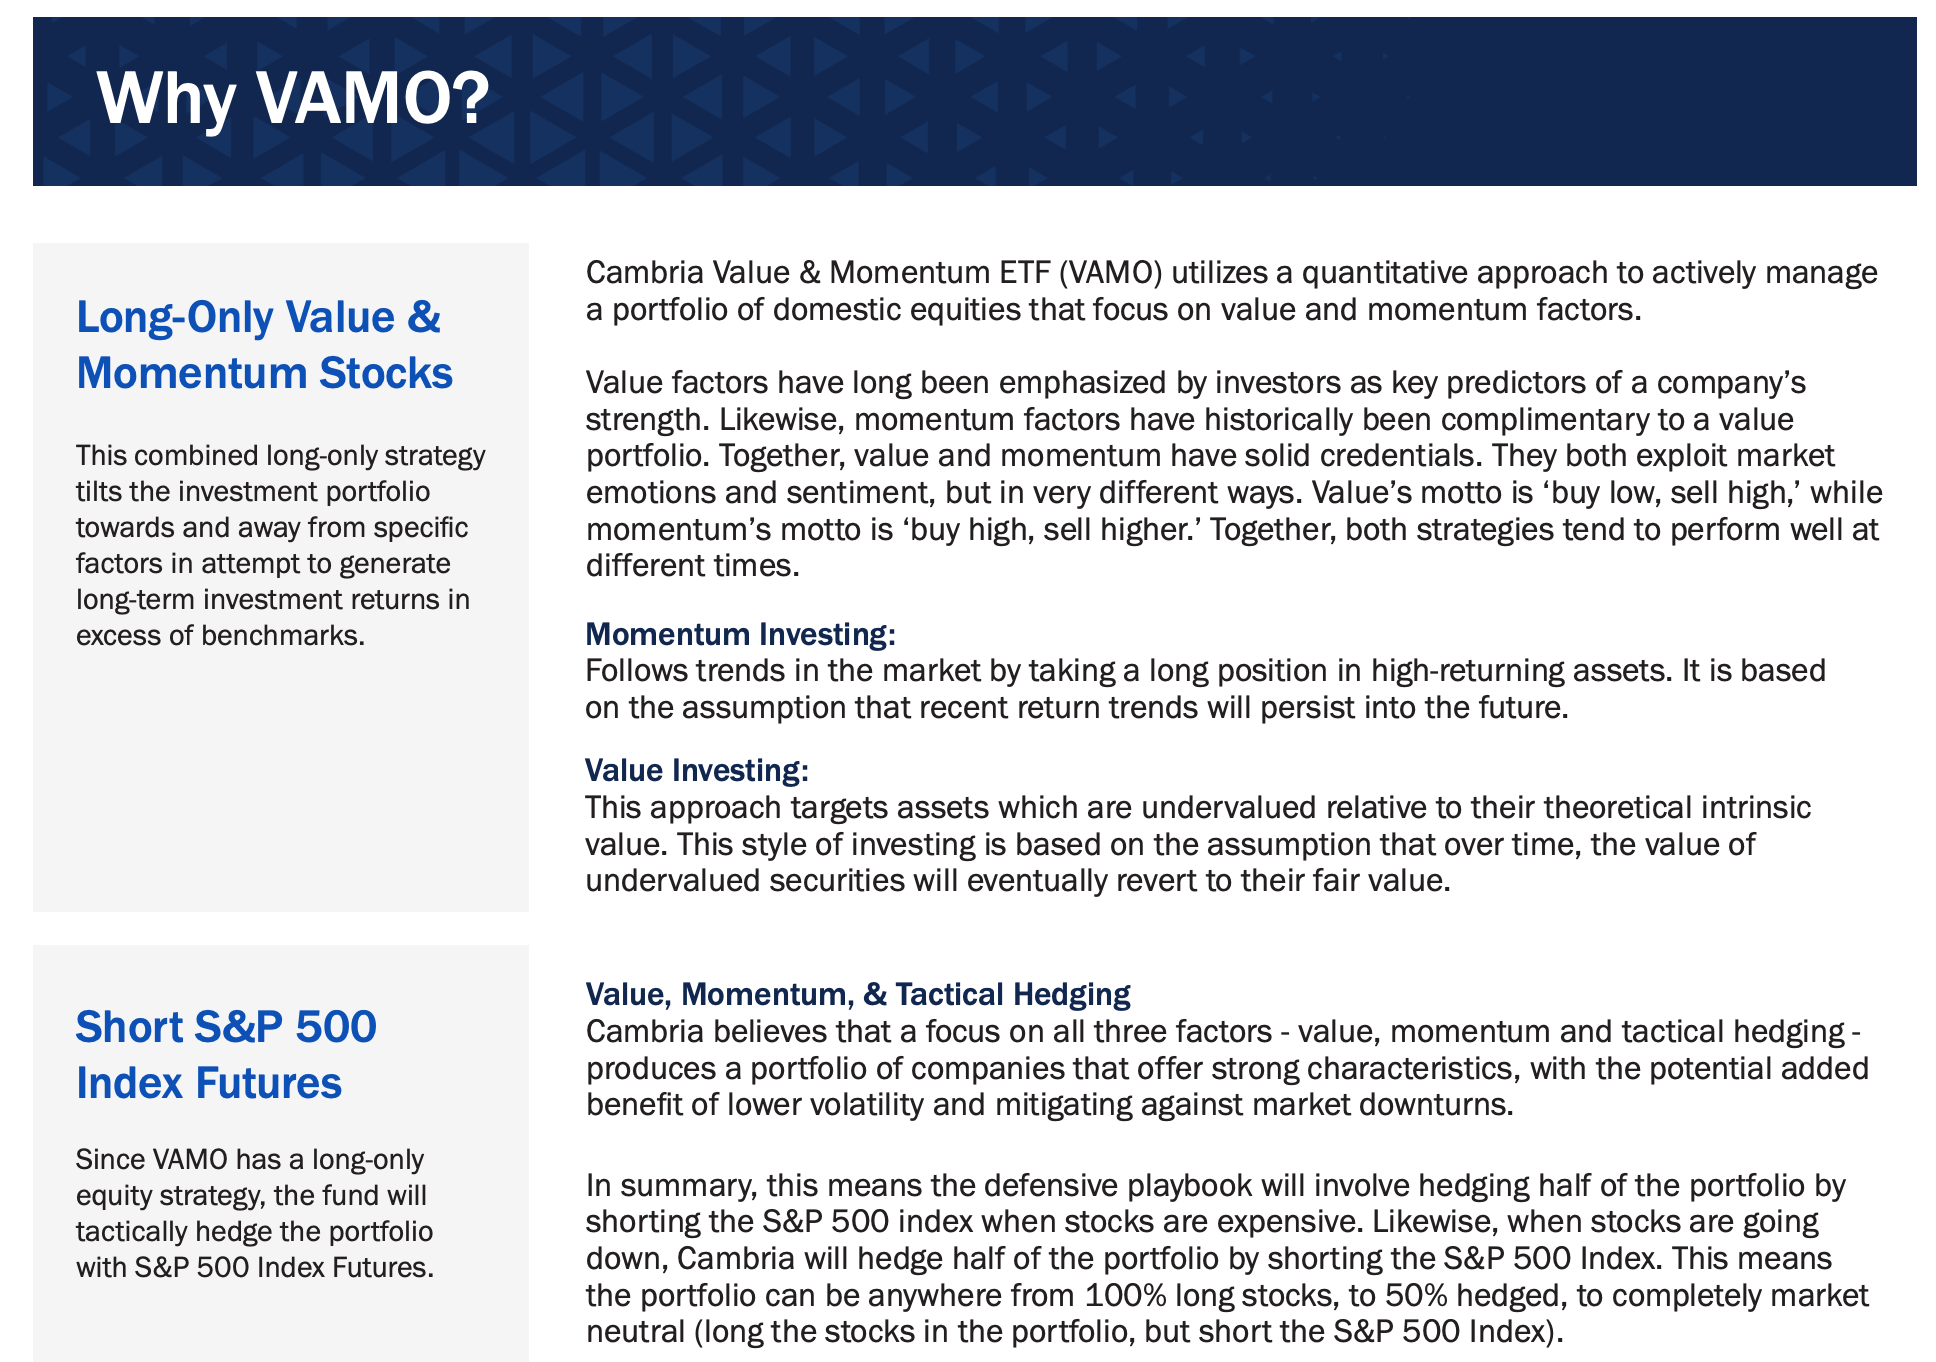
“Cambria Value & Momentum ETF (VAMO) utilizes a quantitative approach to actively manage a portfolio of domestic equities that focus on value and momentum factors.
Value’s motto is ‘buy low, sell high,’ while momentum’s motto is ‘buy high, sell higher.’ Together, both strategies tend to perform well at different times.
Momentum Investing: Follows trends in the market by taking a long position in high-returning assets. It is based on the assumption that recent return trends will persist into the future.
Value Investing: This approach targets assets which are undervalued relative to their theoretical intrinsic value. This style of investing is based on the assumption that over time, the value of undervalued securities will eventually revert to their fair value.”

VAMO ETF Investment Universe
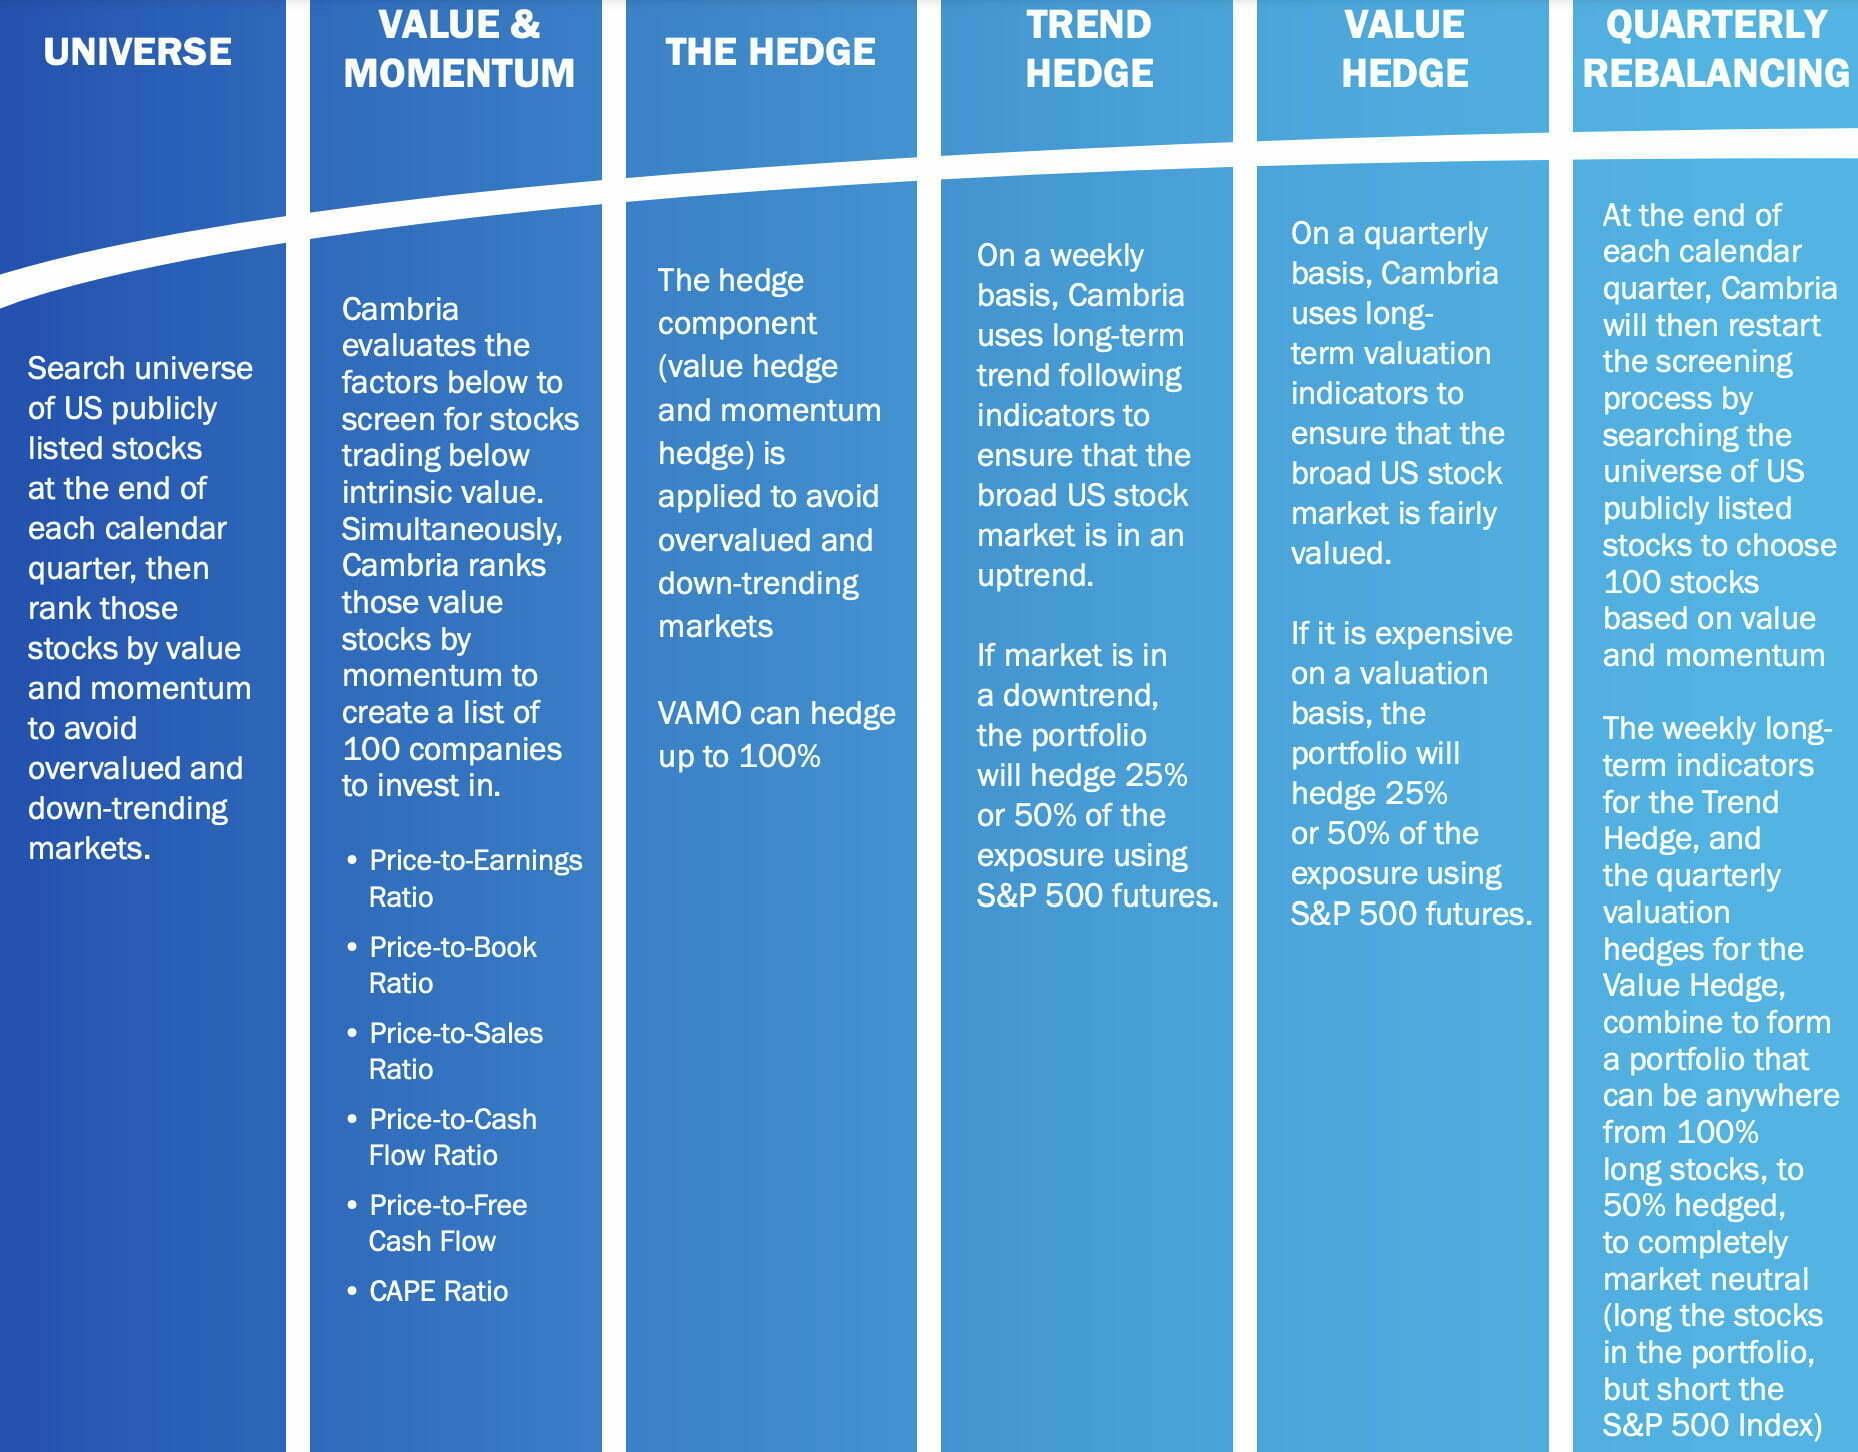
“Value, Momentum, & Tactical Hedging Cambria believes that a focus on all three factors – value, momentum and tactical hedging – produces a portfolio of companies that offer strong characteristics, with the potential added benefit of lower volatility and mitigating against market downturns.”
In summary, this means the defensive playbook will involve hedging half of the portfolio by shorting the S&P 500 index when stocks are expensive. Likewise, when stocks are going down, Cambria will hedge half of the portfolio by shorting the S&P 500 Index. This means the portfolio can be anywhere from 100% long stocks, to 50% hedged, to completely market neutral (long the stocks in the portfolio, but short the S&P 500 Index).”
source: The Meb Faber Show on YouTube

Let’s Unpack This More: VAMO ETF Strategy
In a nutshell, we can unpack VAMO ETF strategically as follows:
- Long 100 US Equity Stocks: “Undervalued” + “Recent Winners” = 100% Long
- Short S&P 500 Futures if/when: “Expensive” + “Downward Trending” = 0 to 100% Short
Hence, Cambria Value and Momentum ETF is dynamic in the sense that it can range from being 100% long only momentum + value stocks all the way to market neutral where it’s a 100-100 (Net 0 / Gross 200).
Let’s explore a few different scenarios to better understand its “dynamic” nature.
Scenario A: The S&P 500 is not relatively expensive and markets are generally trending upwards = no hedge (100% long)
Scenario B: The S&P 500 is extremely expensive and markets are downtrending severely = complete hedge (100-100 market neutral)
Scenario C: The S&P 500 is somewhat expensive and markets are downtrending slightly = 1/2 hedge (100-50 long/short)
Scenario D: The S&P 500 is not relatively expensive but markets are downtrending slightly = partial hedge (100-25 long/short)
Is The S&P 500 Expensive from a Relative P/E Standpoint?
Is the S&P 500 relatively expensive in terms of its current valuations?
In other words, from a P/E standpoint?
Let’s find out.
S&P 500 vs S&P 400 vs S&P 600 P/E
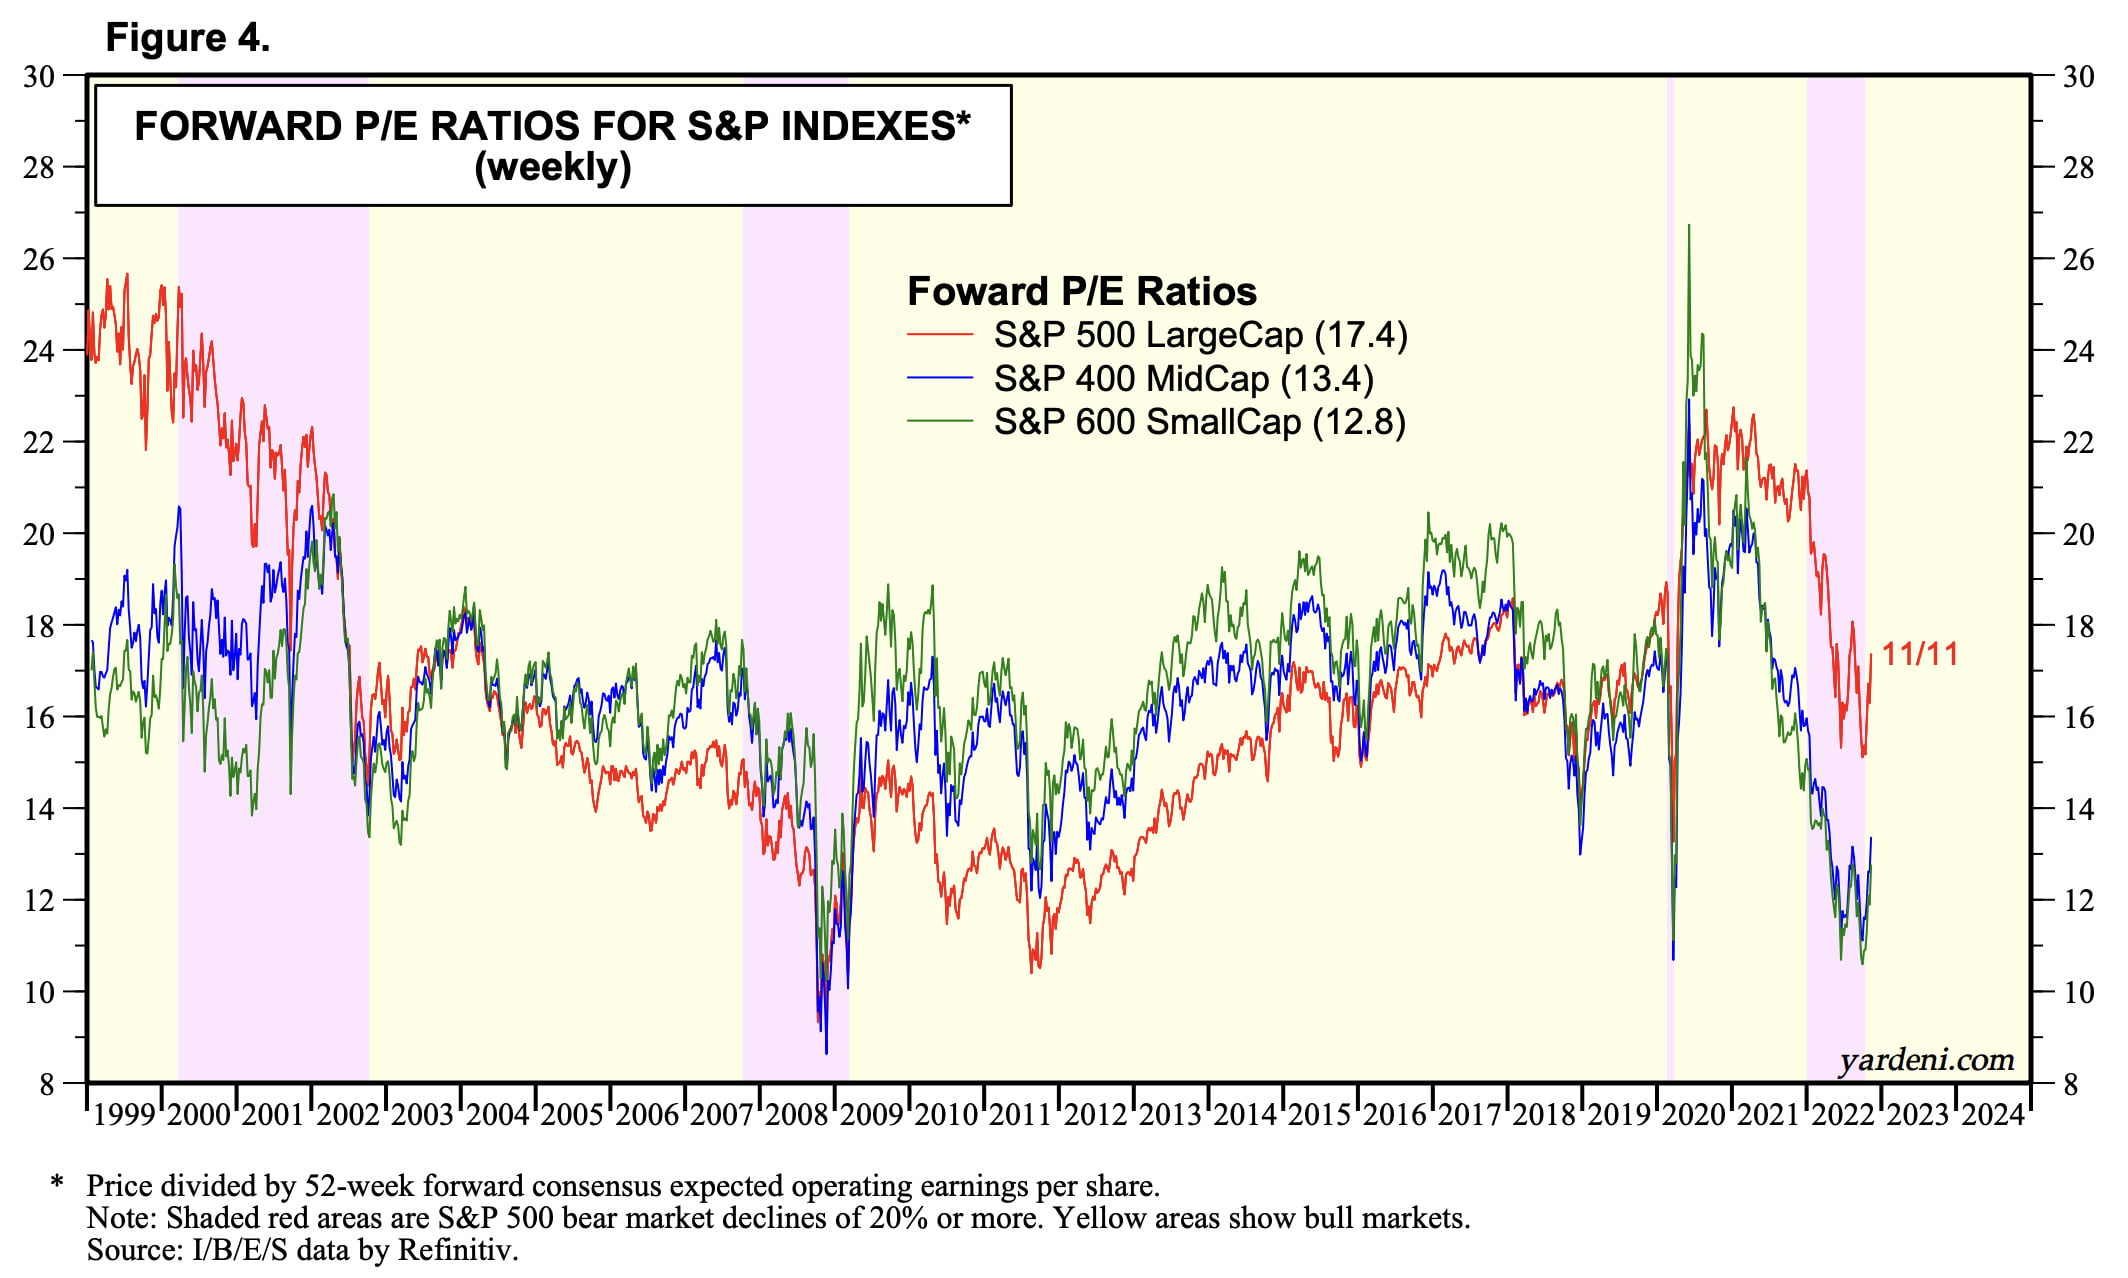
When the US S&P 500 Large Cap is compared with the S&P 400 Mid Cap and S&P 600 Small Cap it certainly is relatively expensive:
17.4 vs 13.4 vs 12.8
If you feast your eyes upon the middle of this figure you’ll notice that this wasn’t always the case.
From roughly 2004 until 2017 the S&P 500 was “less expensive” than its mid-cap and small-cap counterparts.
MSCI US vs ACW ex-US Forward P/E
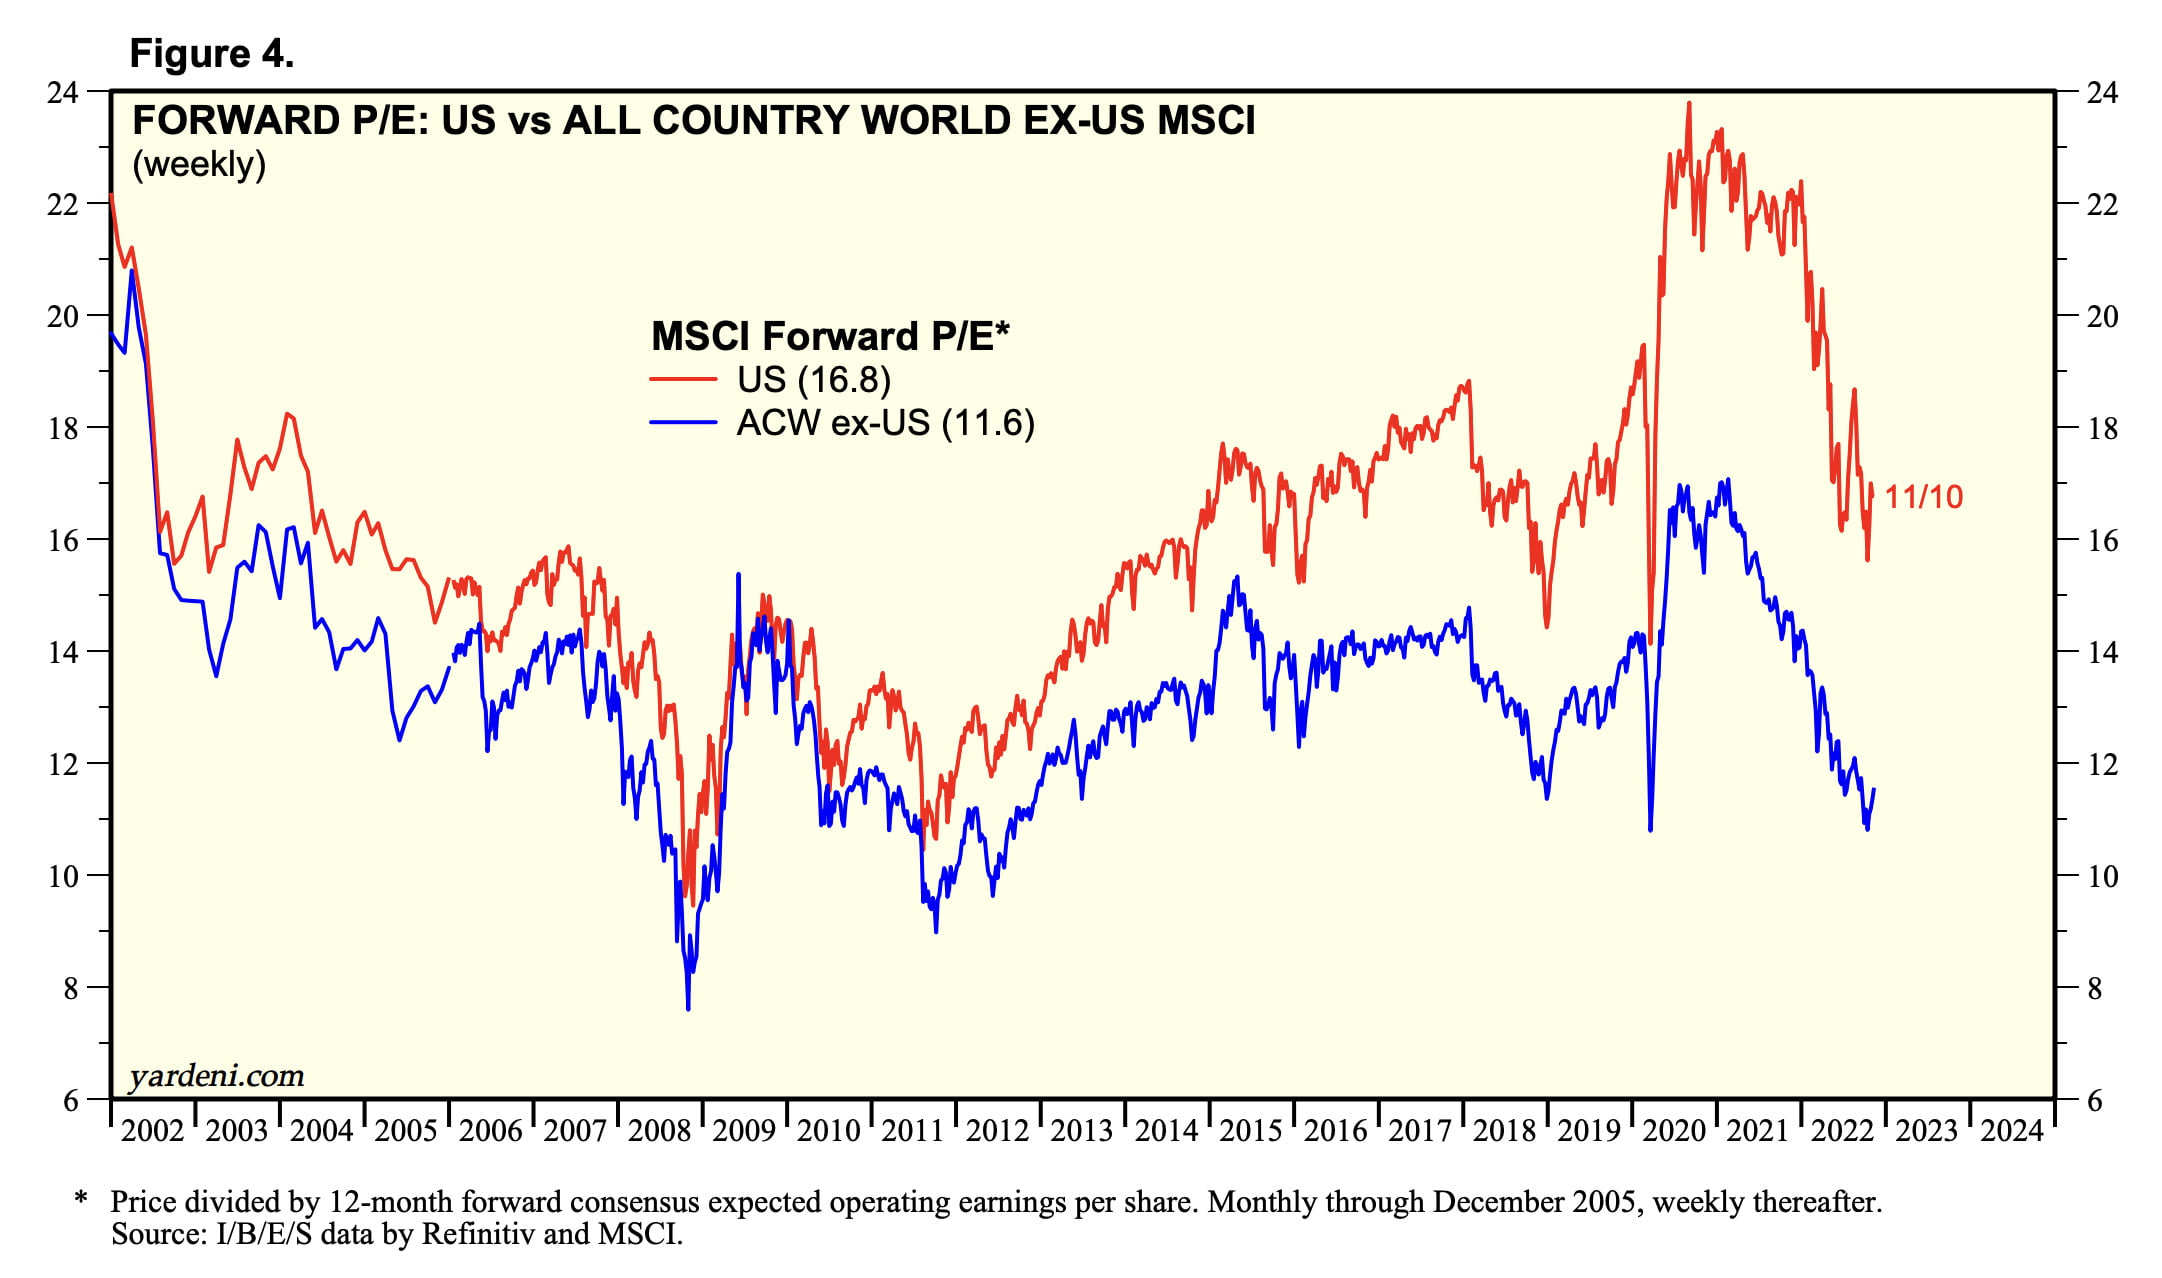
Are US large cap stocks expensive relative to the rest of the world?
In a word.
Yes!!!
16.8 vs 11.6
S&P 500 Forward P/E Growth vs Value
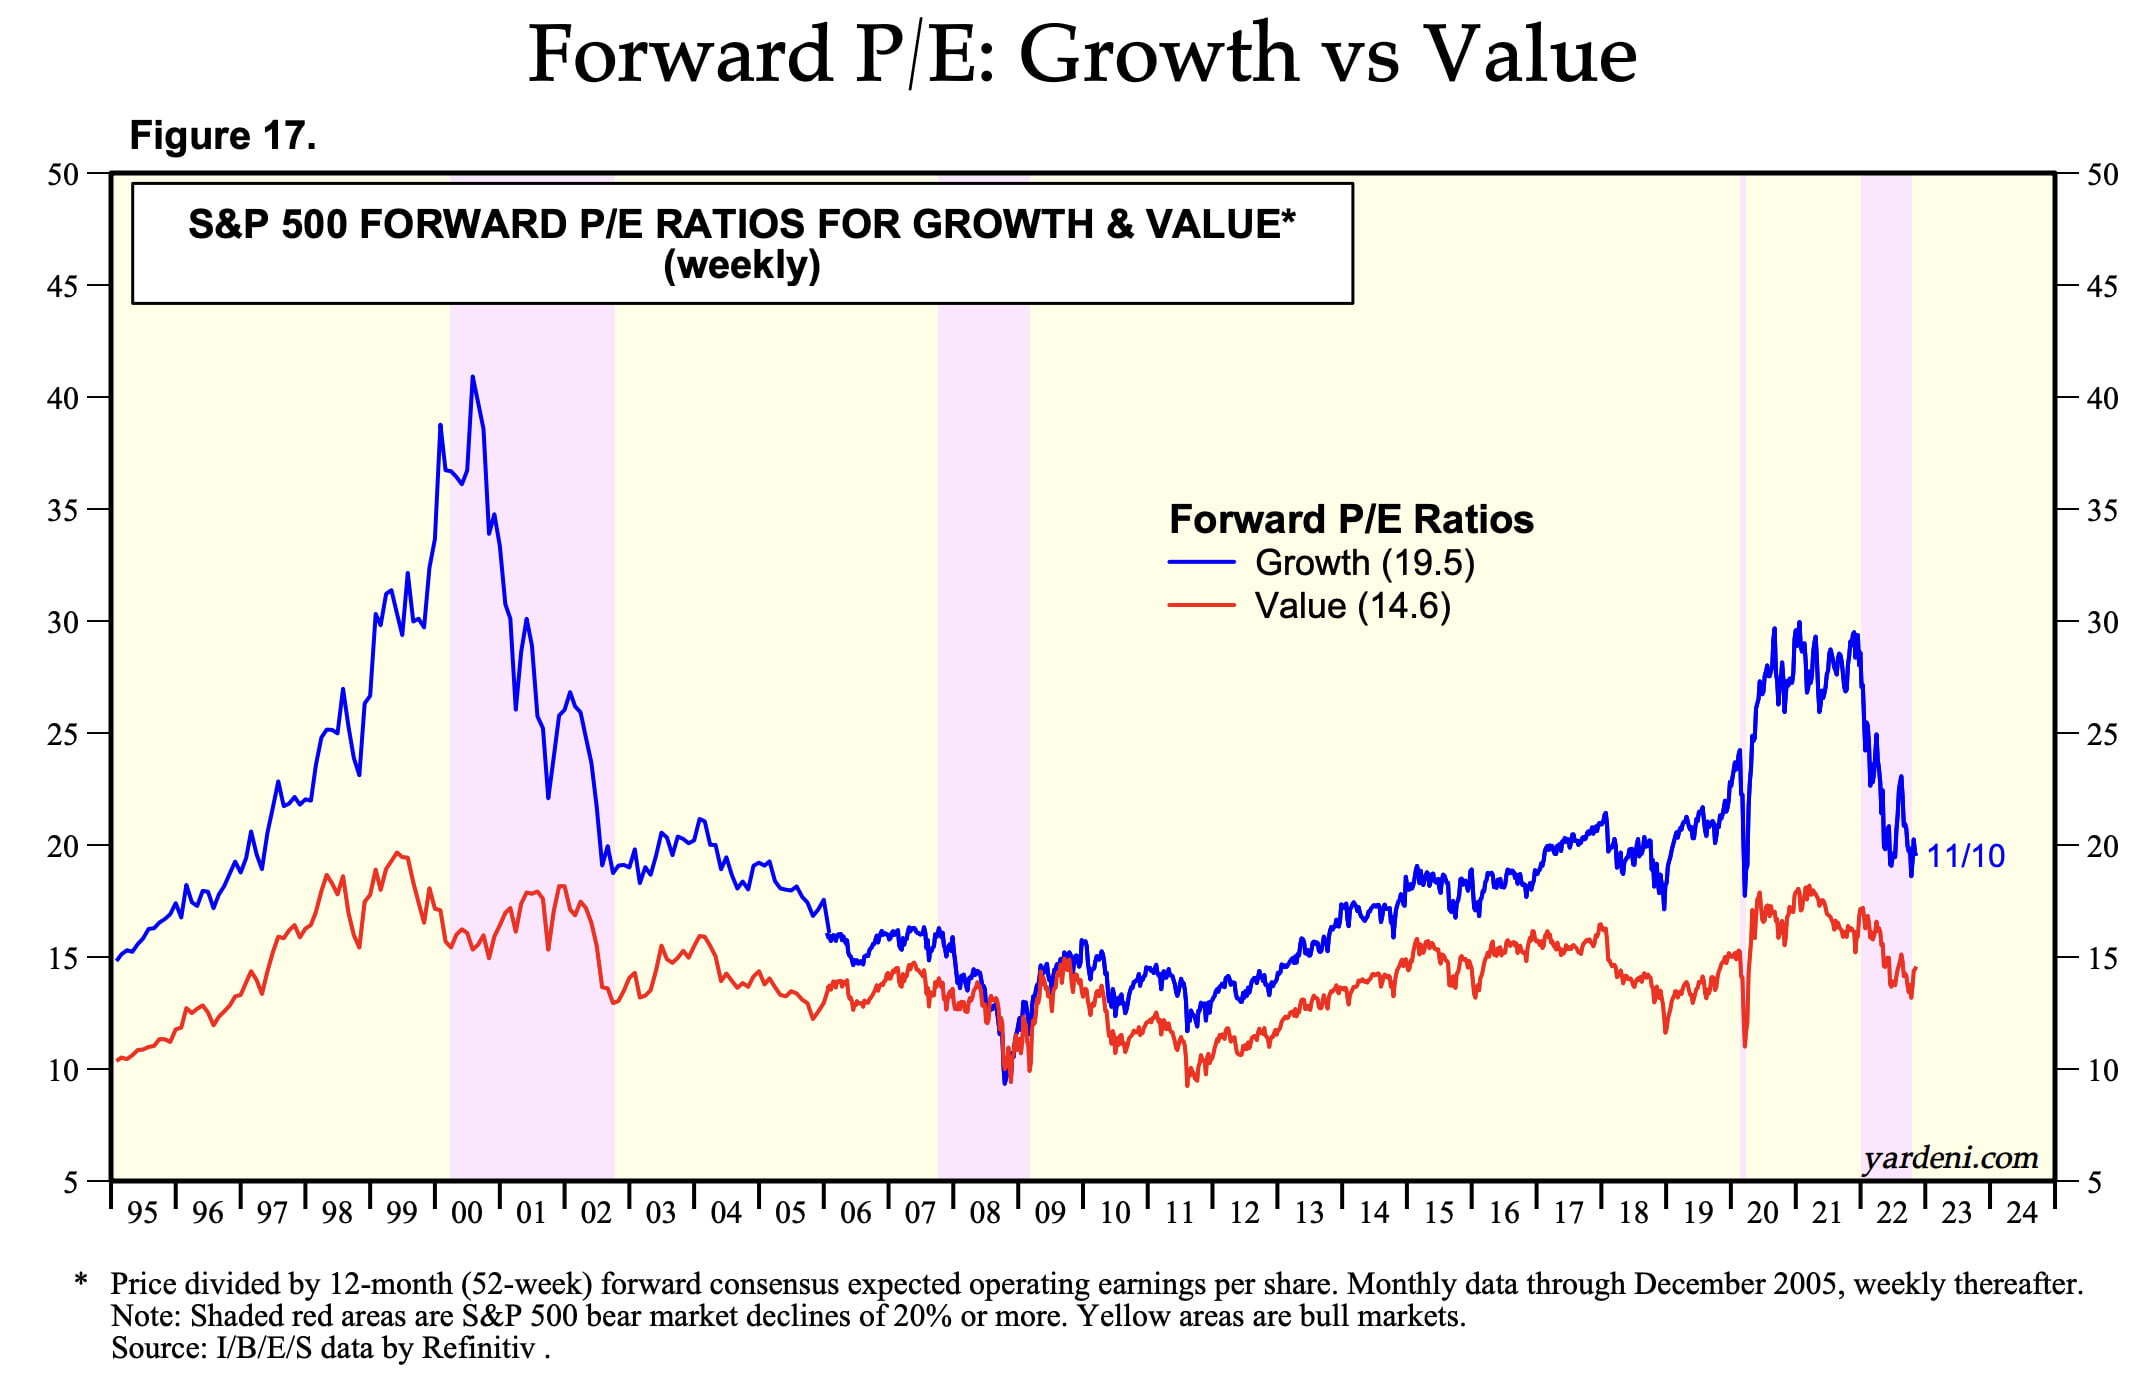
Surely, typically “growth tilted” S&P 500 can squeak out a win somewhere along the line.
Nope.
Growth vs Value looking awfully expensive too.
19.5 vs 14.6
Historical Precedent For When US Large Cap = Expensive?
What happened the last time the US large cap stocks were grossly overvalued relative to domestic mid-cap and small-cap equities, global stocks and value companies?
Lost decade.
Ah, the 2000s.
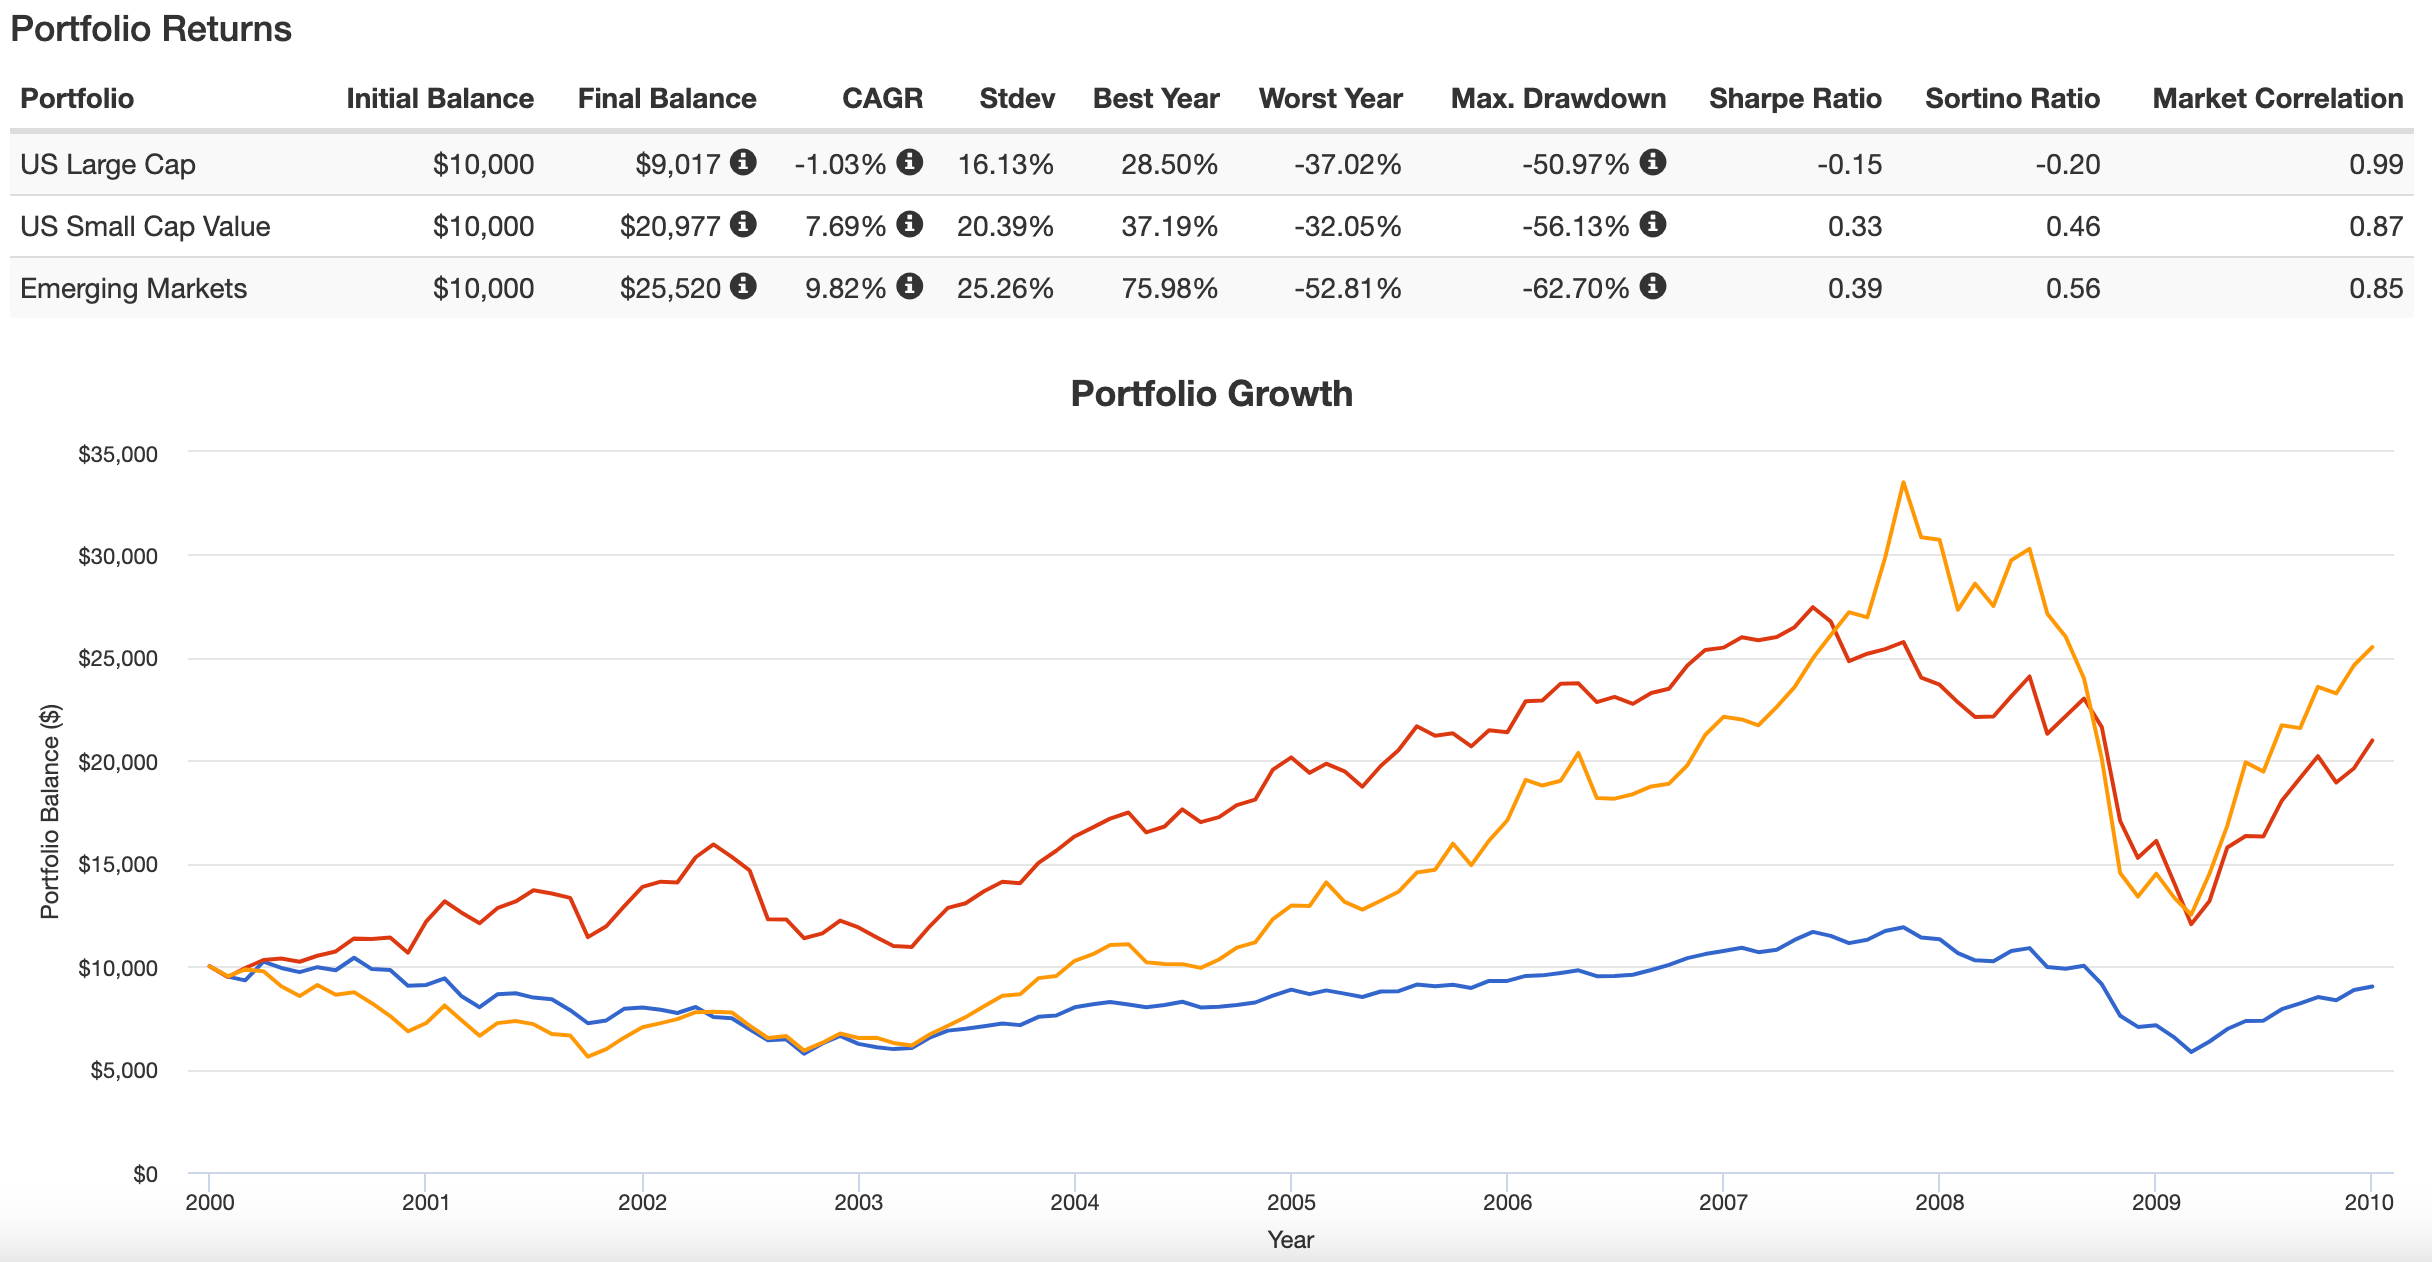
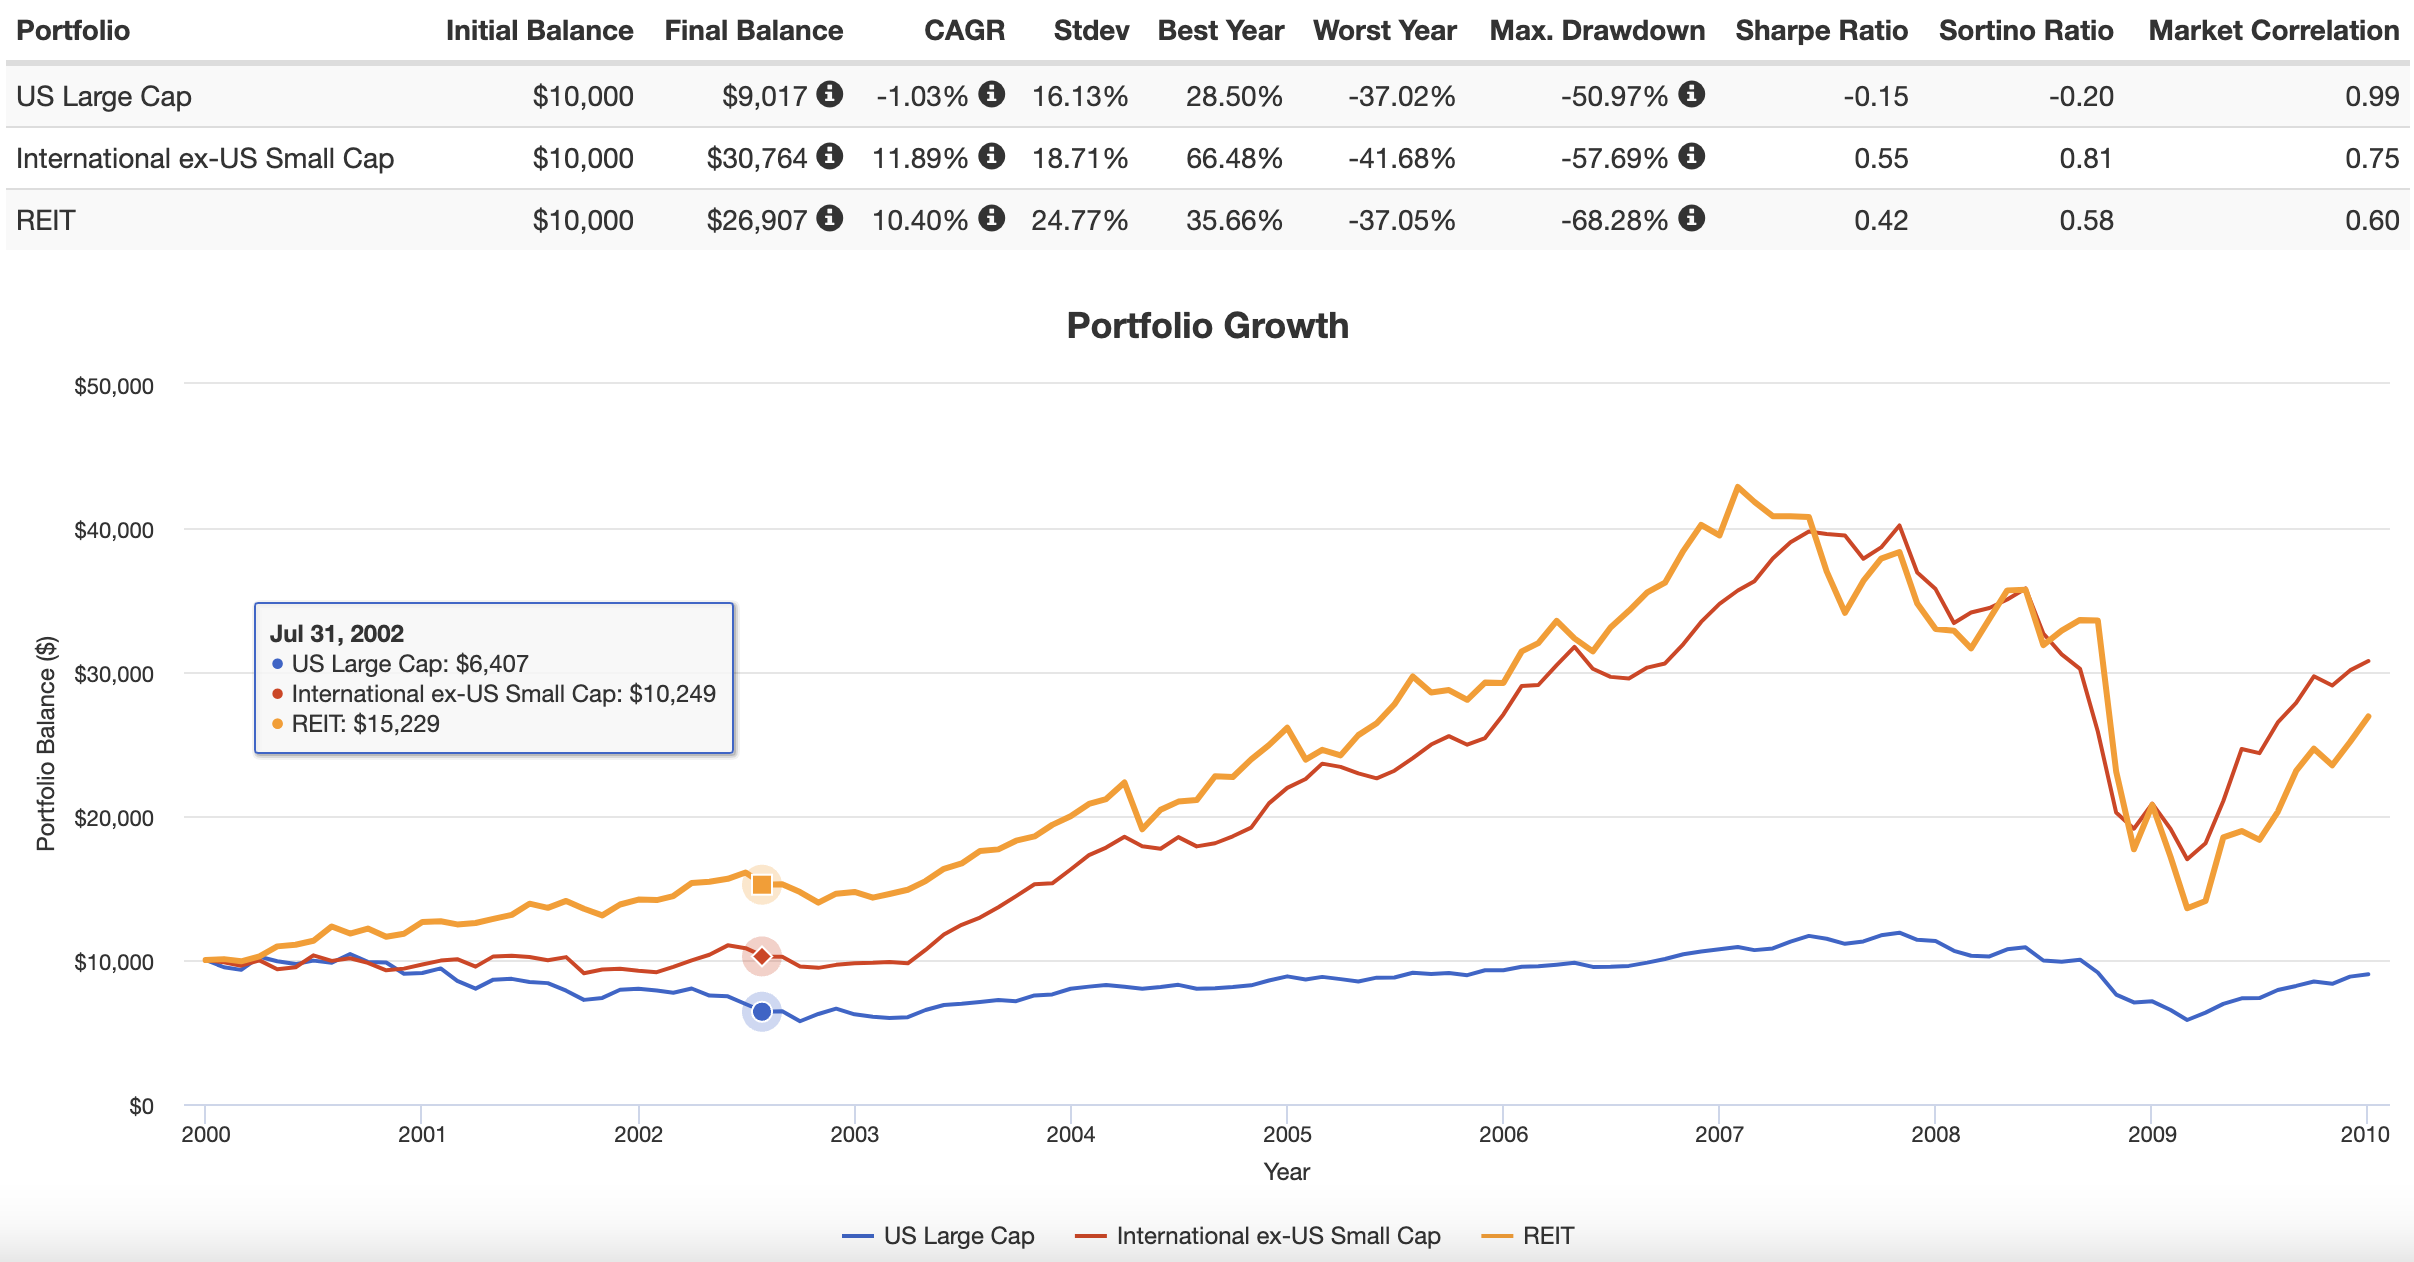
Everything got beat up back then, right?
Nope.
Diversified investors with allocations to small-cap value and REIT for domestic equities, International small-caps and Emerging Markets made out just fine.
The S&P 500 seems generationally prone to investor exuberance with painful lessons as part of the overall equation.
Will history repeat itself again?
Likely not.
But a strategy that could potentially capture value and momentum in the 2000s while shorting the S&P 500 when it was “expensive” plus “downward trending” would have cleaned up handsomely.

The Case For Value + Momentum Investing
Value and Momentum investing strategies have historically beaten down on large-cap MCW indexes.
Let’s start with Value.
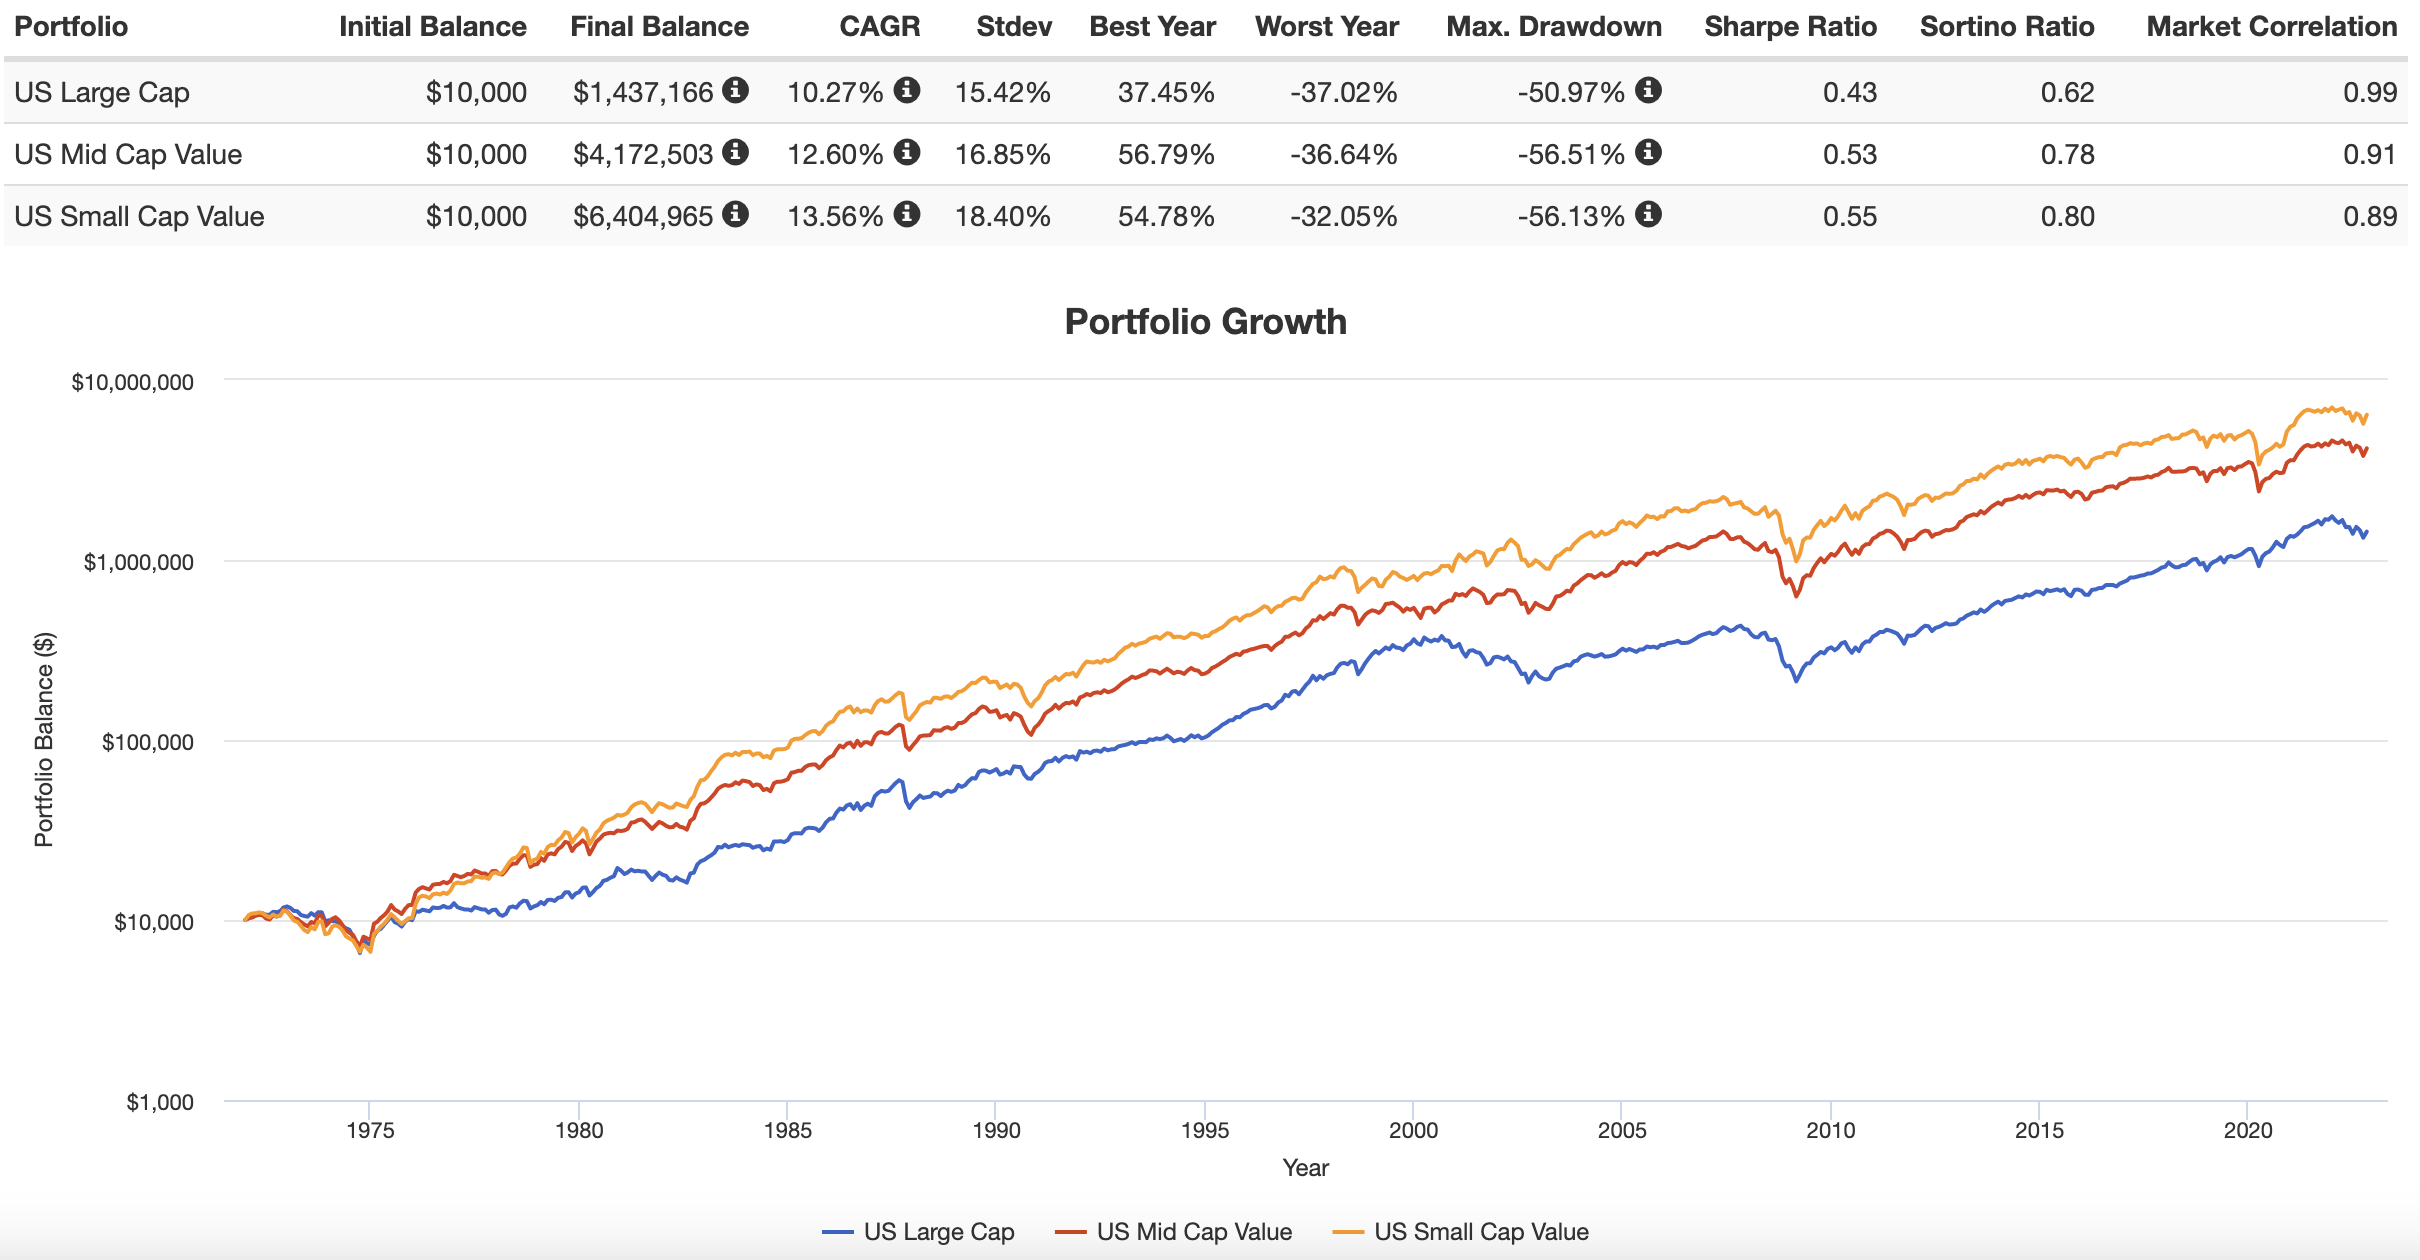
Investors hanging out in US mid-cap and US small-cap value territory since 1972 have been rewarded by 100s of basis points of relative outperformance vs US large cap equities.
US Large Cap: 10.27 CAGR
US Mid Cap Value: 12.60% CAGR
US Small Cap Value: 13.56% CAGR
Ah, but most of that outperformance came in the 20th century though, right?
Nope.
Different Century.
Same story.
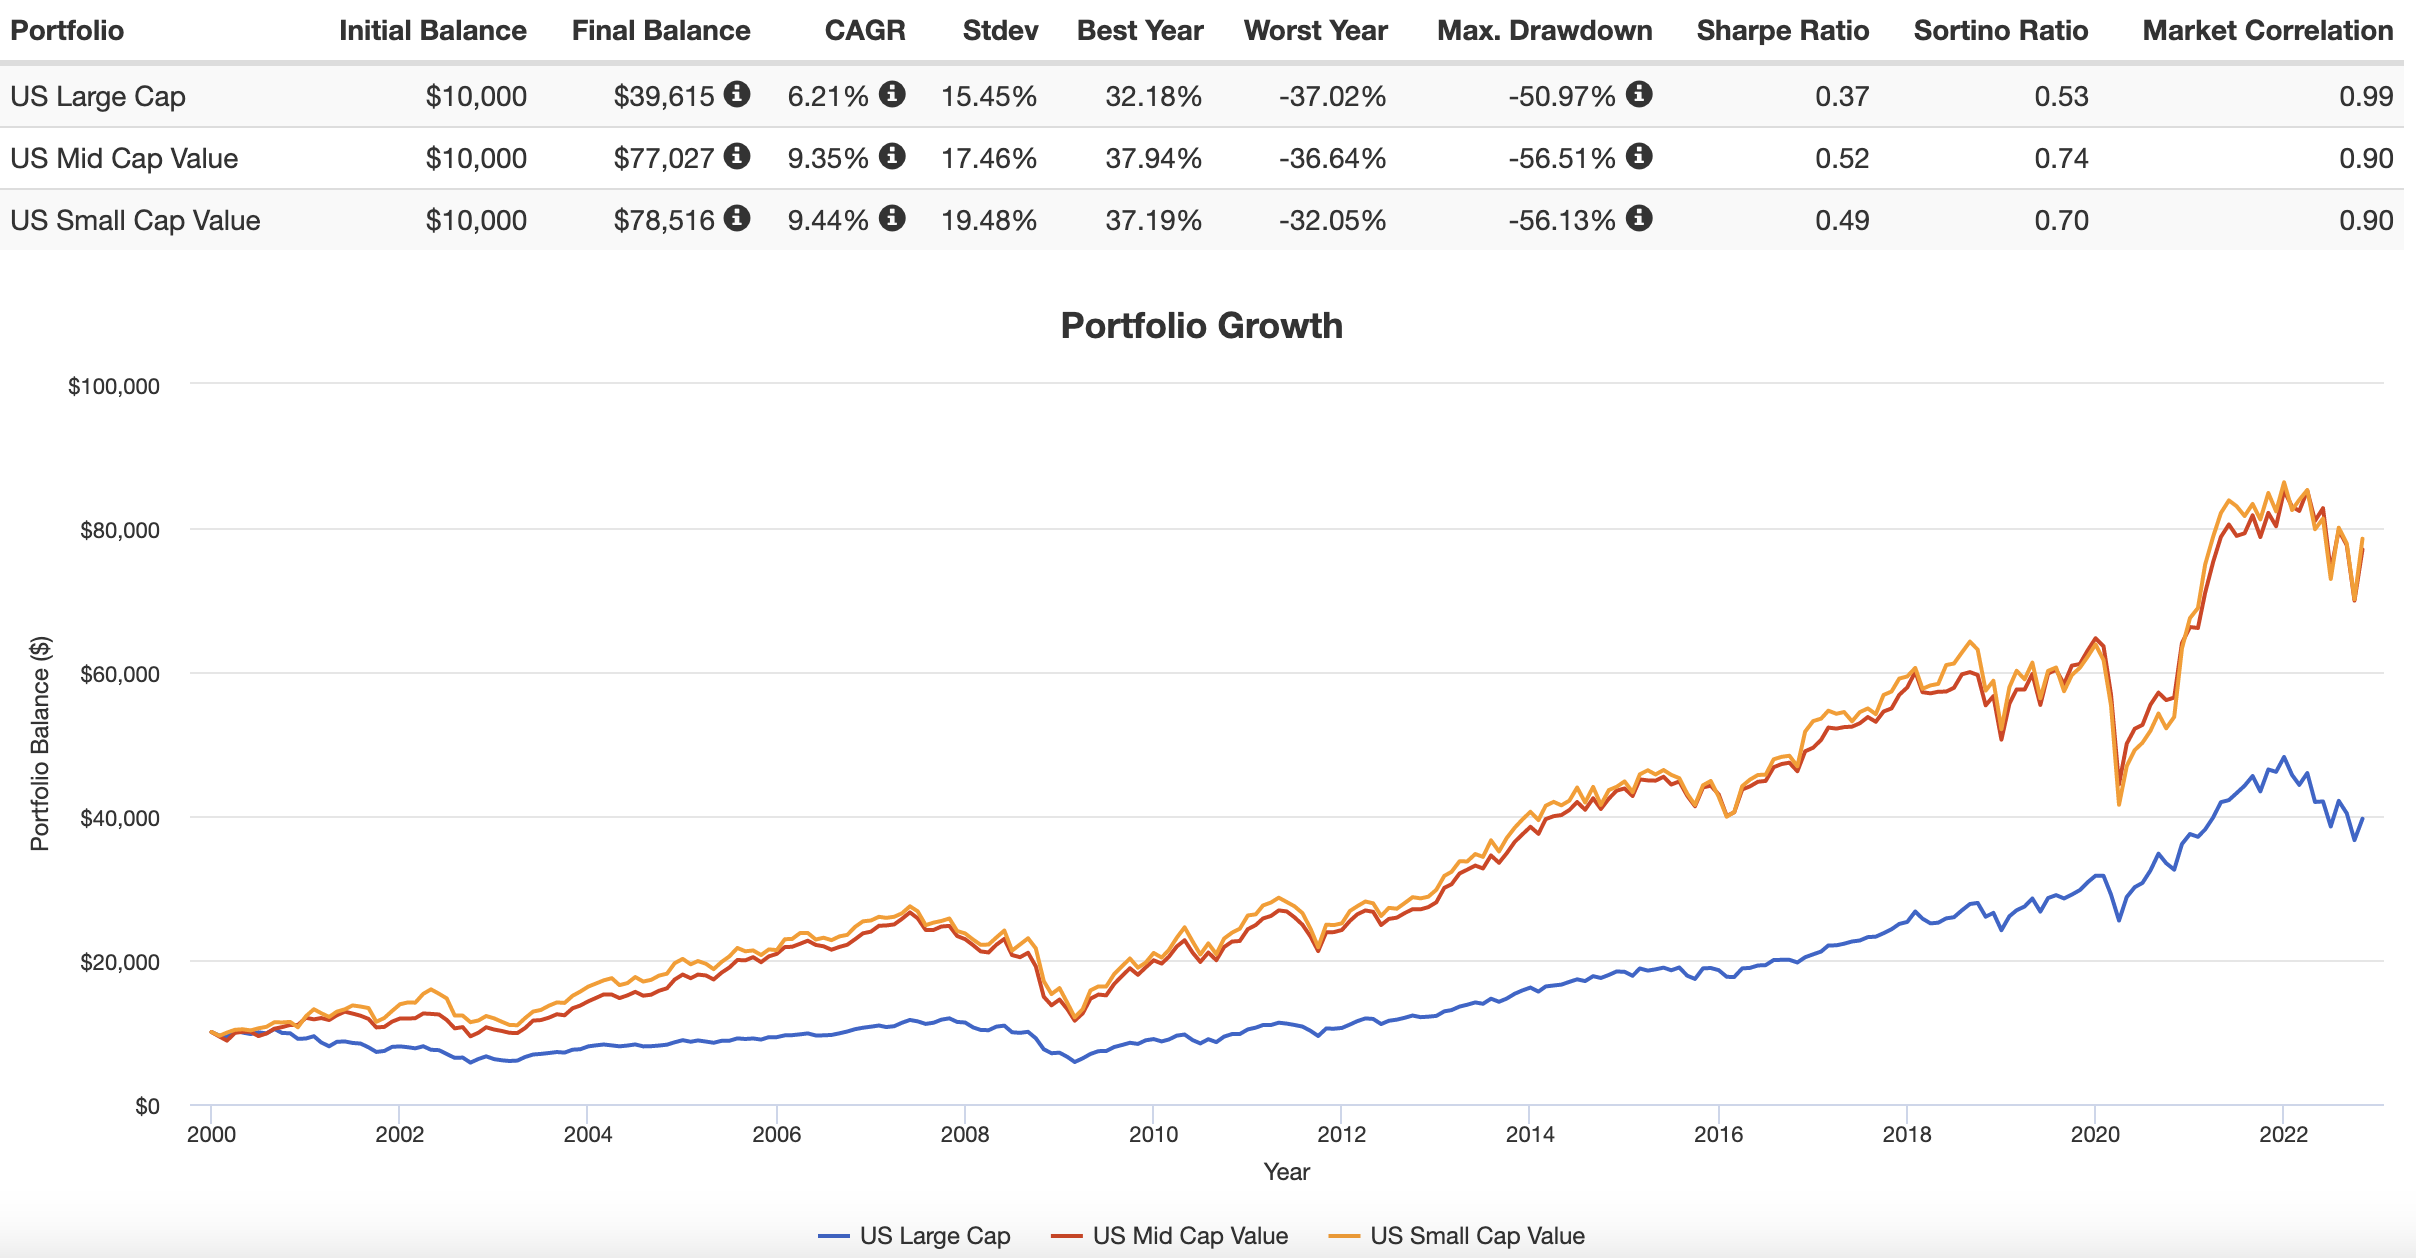
US Large Cap: 6.21 CAGR
US Mid Cap Value: 9.35% CAGR
US Small Cap Value: 9.44% CAGR
Let’s move on to Momentum where we can consult MSCI index results between its Global Momentum Index vs its parent Market Cap Weighted Index.
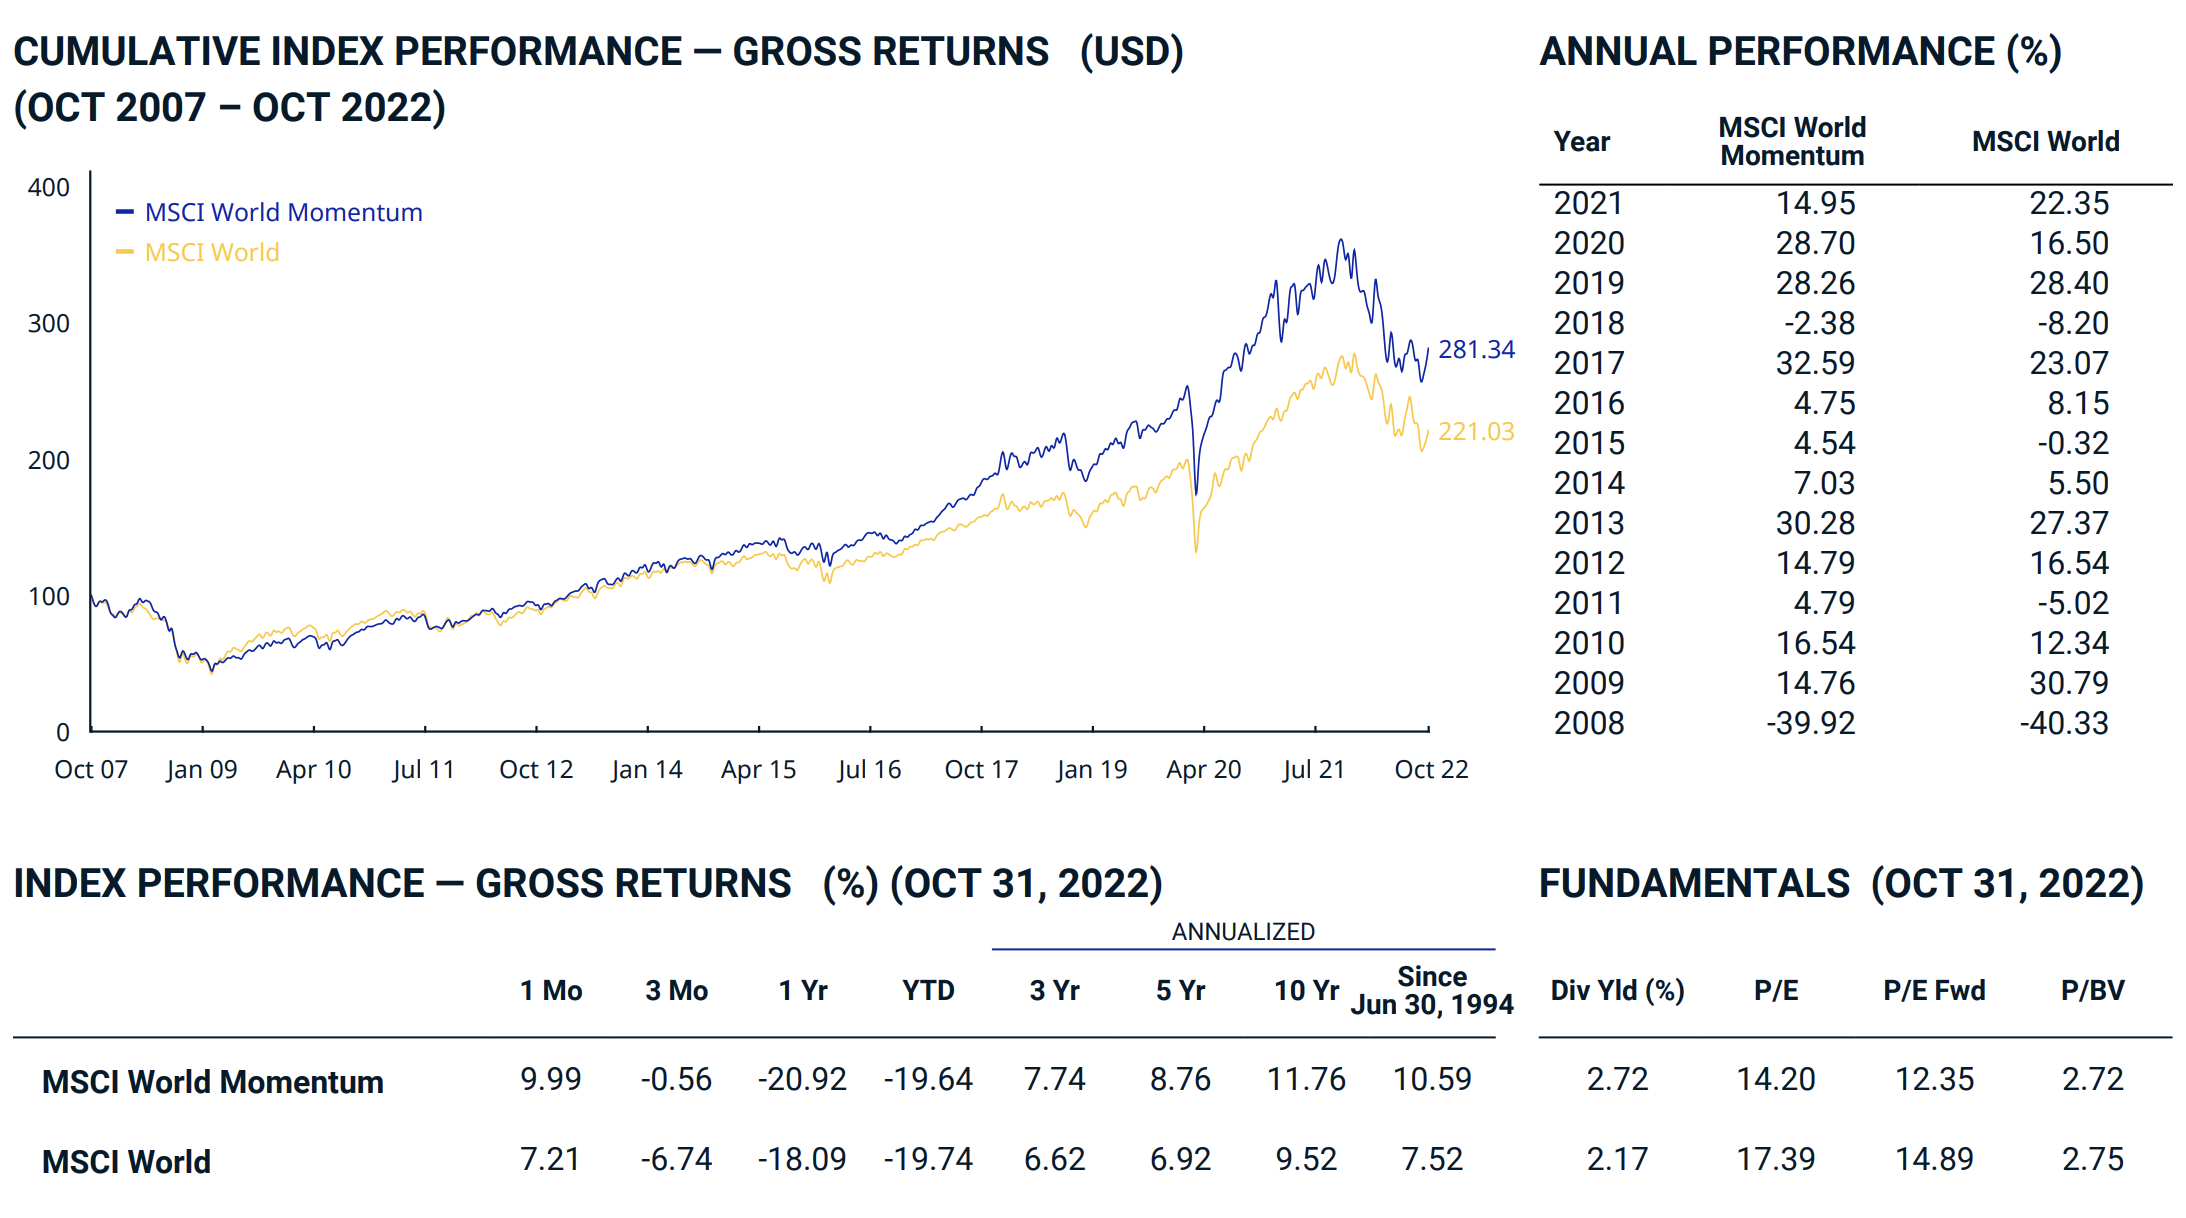
It’s another drubbing for the factor focused strategy of Momentum versus its Market-Cap Weighted parent index.
Past 10 Years: 11.76 vs 9.52
Since Inception (1994): 10.59 vs 7.52
Value and Momentum equity strategies have outperformed Market Cap Weighted Index strategies by 100s of basis points historically.
Got it.
But why value and momentum as a dual factor strategy?
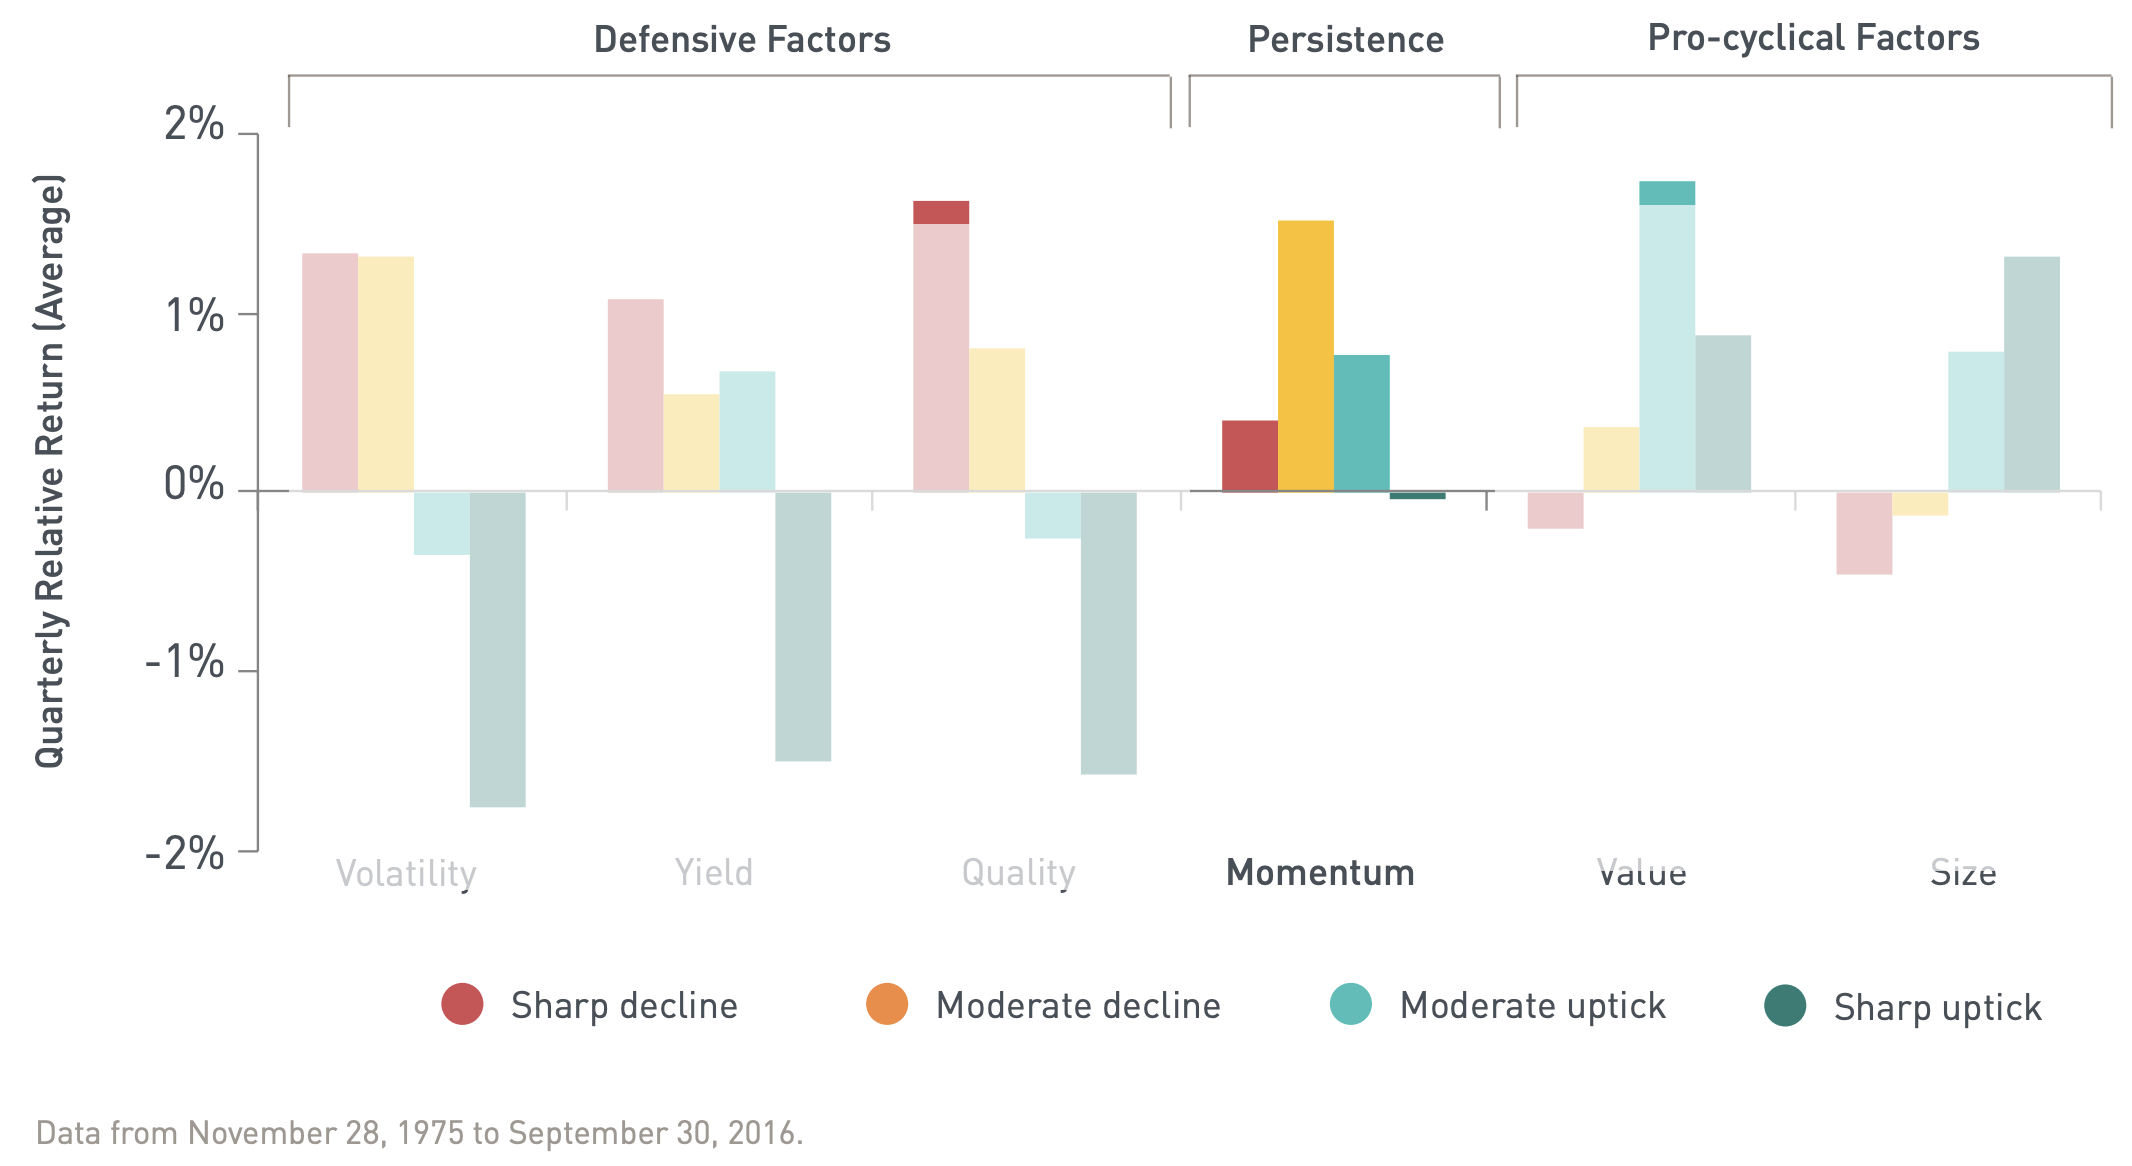
The reason Value and Momentum sure make a great Batman and Robin duo (and vice versa as they perpetually swap roles) is because they typically perform well during different stages of the economic cycle.
Momentum is a persistence factor.
Value is a pro-cyclical factor.
Hence, they’re not going gangbusters and/or bust usually at the same time.
Therefore, they make a great duo.

Why Long-Short Equities?
There are three main reasons to go long-short as opposed to long-only.
- Defensive (Hedge Downside Risk)
- Excess Returns (Attractive versus Unattractive)
- Provide Uncorrelated Returns
When markets are downtrending and you’re capturing the short-side of the equation it can significantly reduce losses.
Consider the following market neutral scenario:
A: -10 (long) B: -15 (short)
If you’re 100% long A and 100% short B you’re net +5% returns whereas long-only investor A is -10%.
We’ve already discussed excess returns from the long-side of the equation where value-momentum strategies outperform market-cap weighted indexes.
On the short side of the equation by dynamically hedging you have the following potential scenario.
Value/Momentum = +15%
US S&P 500 = -10%
In a partial hedge scenario where your long end of the stick is up +15% and you’re partially hedged at 50% you stack +5% return for a total of 20%.
Finally, by investing in value and momentum stocks and hedging you’re delivering returns that aren’t correlated with the market.
This provides the potential for an overall portfolio diversification benefit.

VAMO ETF Overview, Holdings and Info
Whew!
We’ve been busy discussing the strategy behind value + momentum + tactical hedges as an investment strategy.
Now it’s time to pop open the hood of this fund.
VAMO ETF Top Positions
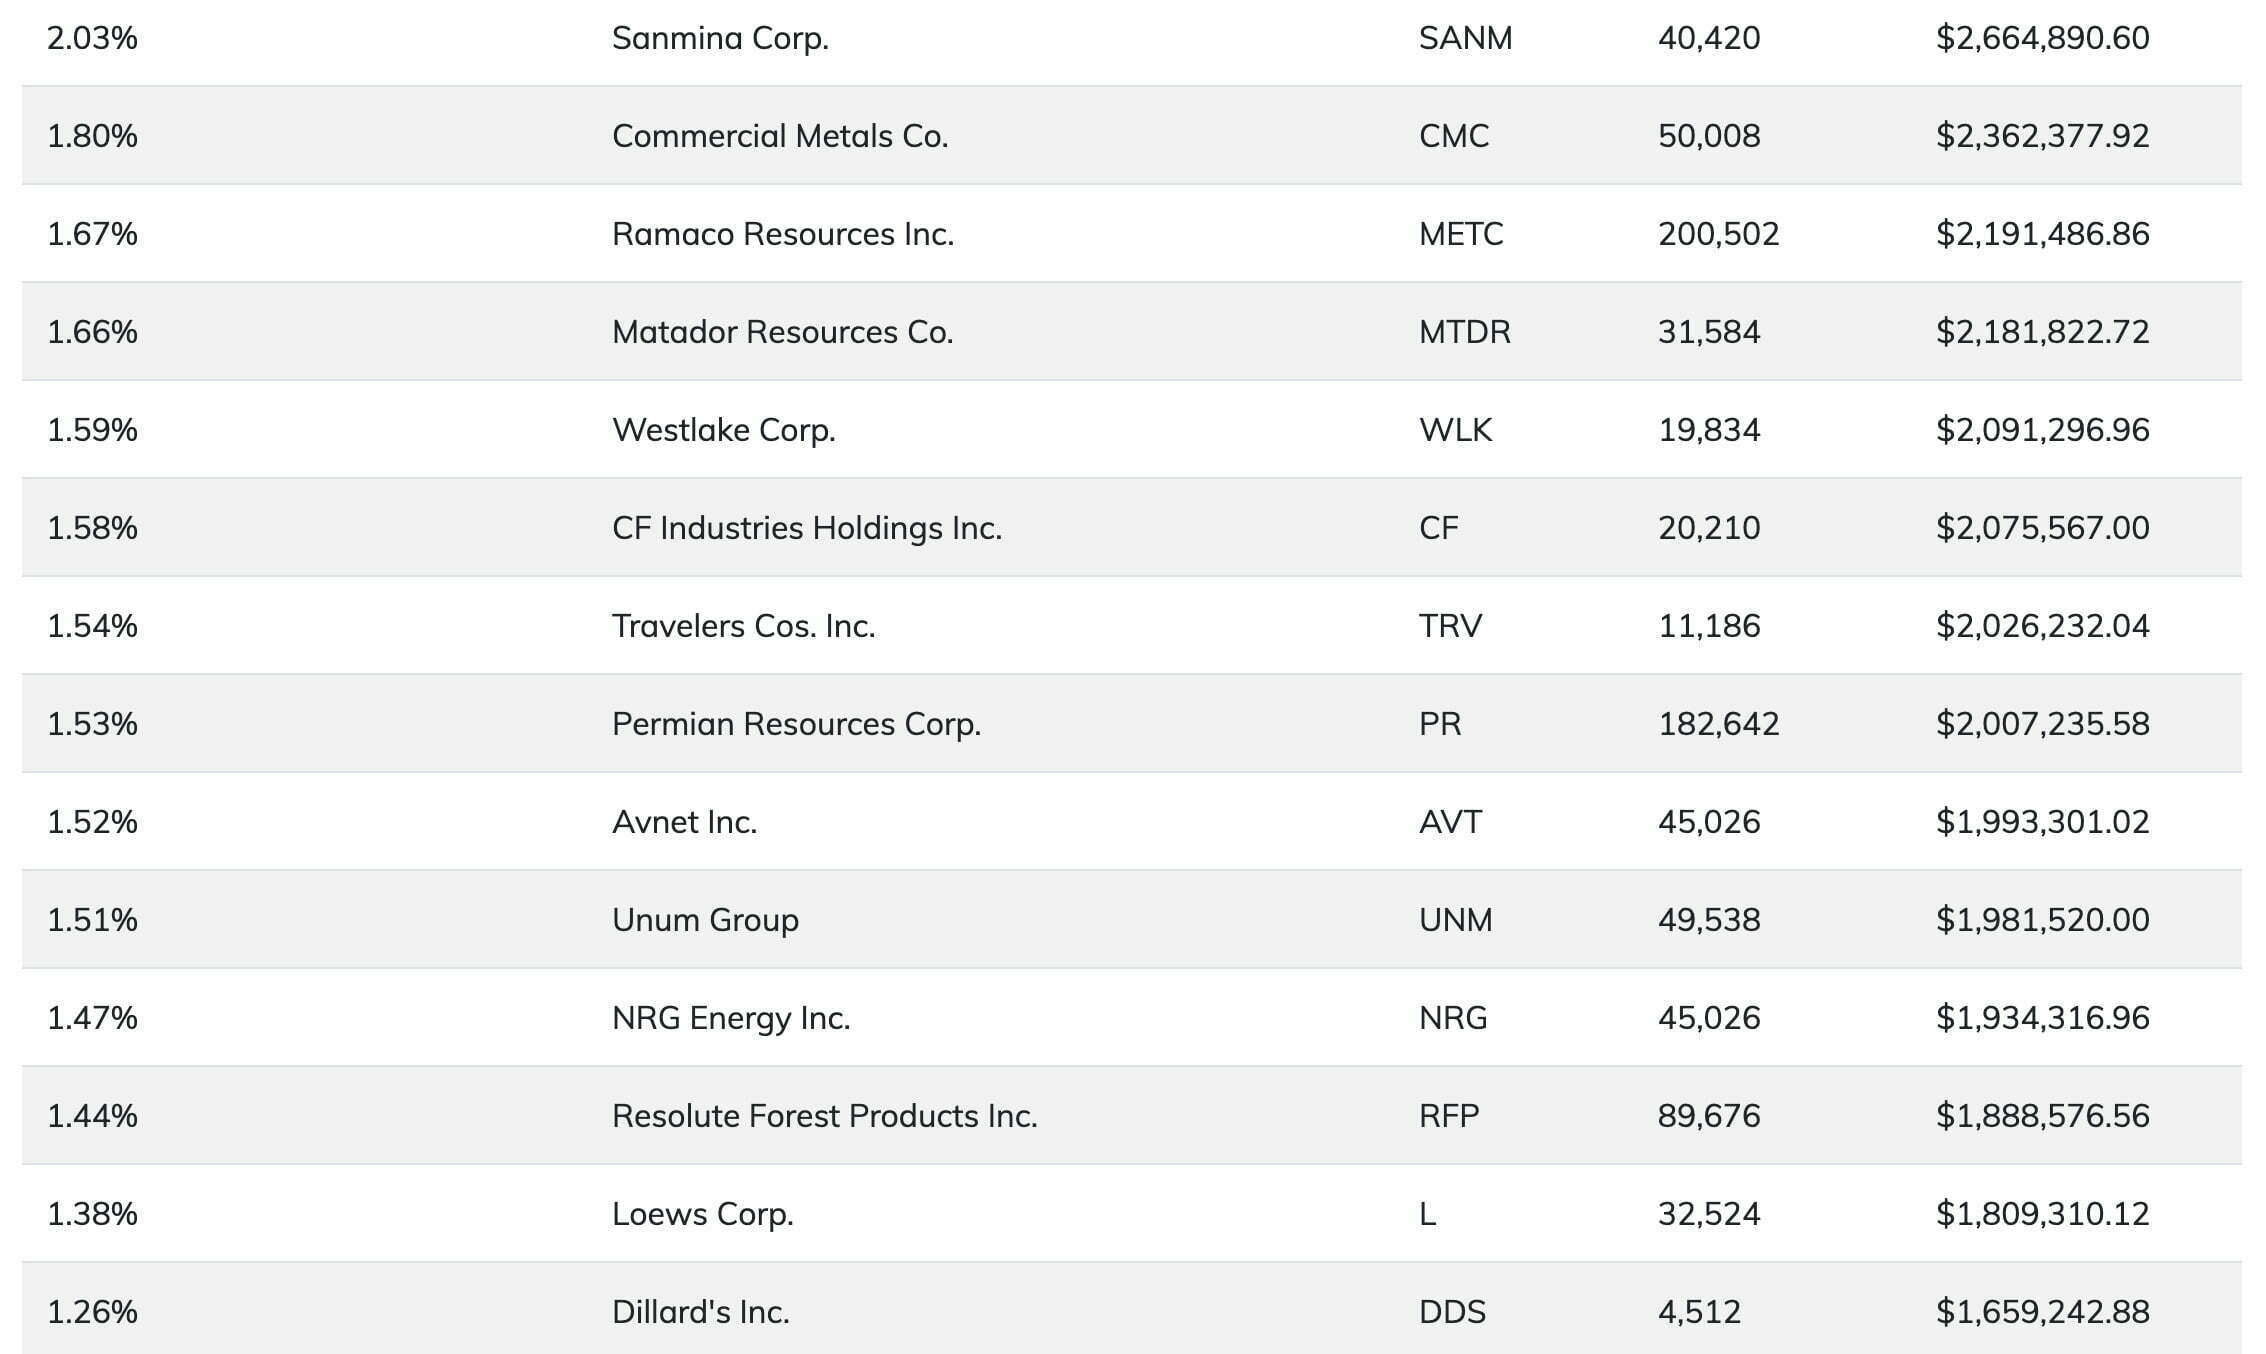
Here are the top positions for VAMO ETF currently.
Where’s Tesla?
Just kidding.
One noteworthy company is Dillard’s Inc which seems to be a darling value stalwart.
VAMO ETF Monthly Target Hedge

Here we can see Cambria Value and Momentum ETF currently hedged in a market neutral configuration.
That’s hardly surprising.
US Large Cap equities are relatively expensive and certainly have been downward trending on the year.
It has triggered both clauses.

VAMO ETF Info
Ticker: VAMO
Net Expense Ratio: 0.59
Distributions: Quarterly
AUM: 131.4 Million
Inception: 09/08/2015
If you compare VAMO ETF versus other long-short equity ETFs and Mutual Funds its management fee is extremely reasonable at 0.59.
Additionally, the fund is well beyond the 50 Million AUM threshold that would potentially have it on the chopping block coming in at 131.4 Million AUM.
It’s been around since 2015 and pays quarterly dividends for investors seeking income.

Cambria Value and Momentum ETF: Principal Investment Strategy
To better understand the process of how the fund operates, let’s turn our attention towards the prospectus where I’ve summarized the key points at the very bottom (source: summary prospectus).
Principal Investment Strategies of the Fund
“The Fund will seek to achieve its investment objective by investing, under normal market conditions, at least 80% of the value of the Fund’s net assets in U.S. exchange-listed equity securities that are undervalued according to various valuation metrics, including the cyclically adjusted price-to-earnings ratio, commonly known as the “CAPE Shiller P/E ratio.”
For the purposes of this policy, the Fund may invest in investments that provide exposure to such securities.
These valuation metrics are derived by dividing the current market value of a reference index or asset by an inflation-adjusted normalized factor (typically earnings, book value, dividends, cash flows or sales) over the past seven to ten years.
The Fund’s investment adviser, Cambria Investment Management, L.P. (“Cambria” or the “Adviser”), intends to employ systematic quantitative strategies in an effort to avoid overvalued and downtrending markets.
In attempting to avoid overvalued and downtrending markets, the Fund may hedge up to 100% of the value of the Fund’s long portfolio.
The Fund may use derivatives, including U.S. exchange-traded stock index futures or options thereon, to attempt to effectuate such hedging during times when Cambria believes that the U.S. equity market is overvalued from a valuation standpoint, or Cambria’s models identify unfavorable trends and momentum in the U.S. equity market.
During certain periods, including to collateralize the Fund’s investments in futures contracts, the Fund may invest up to 20% of the value of its net assets in U.S. dollar and non-U.S. dollar denominated money market instruments or other high quality debt securities, or ETFs that invest in these instruments.
The Fund may invest in securities of companies in any industry, but will limit the maximum allocation to any particular sector to 25%.
Although the Fund generally expects to invest in companies with larger market capitalizations, the Fund may also invest in small- and mid-capitalization companies.
Filters will be implemented to screen for companies that pass sector exposure and liquidity requirements.
Cambria will utilize a quantitative model that combines value and momentum factors to identify which securities the Fund may purchase and sell and opportune times for purchases and sales.
The Fund will look to allocate to the top performing value stocks based on value factors as well as absolute and relative momentum.
Value will typically be measured on a longer time horizon (five to ten years) than momentum (typically less than one year).
The Fund may invest in U.S. exchange-listed preferred stocks.
Preferred stocks include convertible and non-convertible preferred and preference stocks that are senior to common stock.
The Fund may also invest in U.S. exchange-listed real estate investment trusts (“REITs”) and engage in short sales of securities.
Cambria has discretion on a daily basis to actively manage the Fund’s portfolio in accordance with the Fund’s investment objective.
The Fund may sell a security when Cambria believes that the security is overvalued or better investment opportunities are available, to invest in cash and cash equivalents, or to meet redemptions.
Cambria expects to adjust the Fund’s holdings to meet target allocations monthly.
As a result, the Fund may experience high portfolio turnover.
As of August 1, 2022, the Fund had significant investment exposure to companies in the industrials, materials, financial services and energy sectors.”
VAMO ETF – Sector Exposure
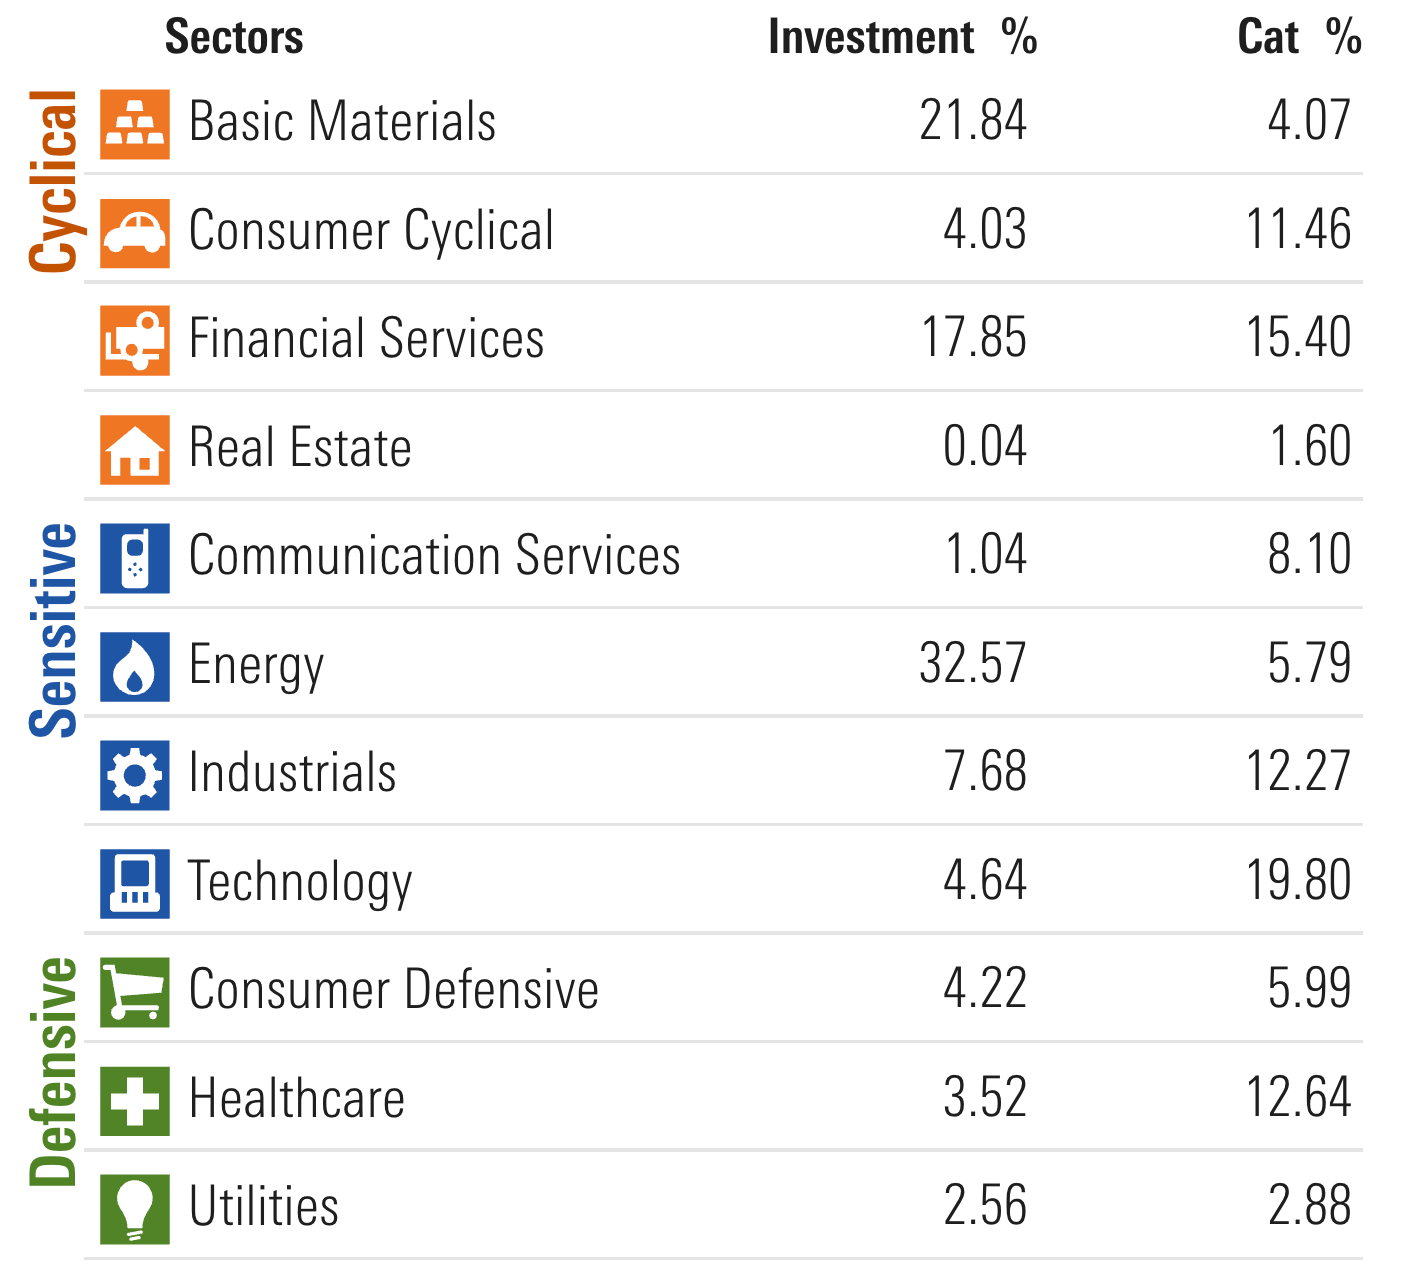
For investors seeking differentiated sector exposure relative to vanilla funds, VAMO ETF delivers in spades.
It is overweight Energy, Basic Materials and Financials and underweight Technology, Healthcare and Consumer Cyclical.
VAMO ETF – Style Measures
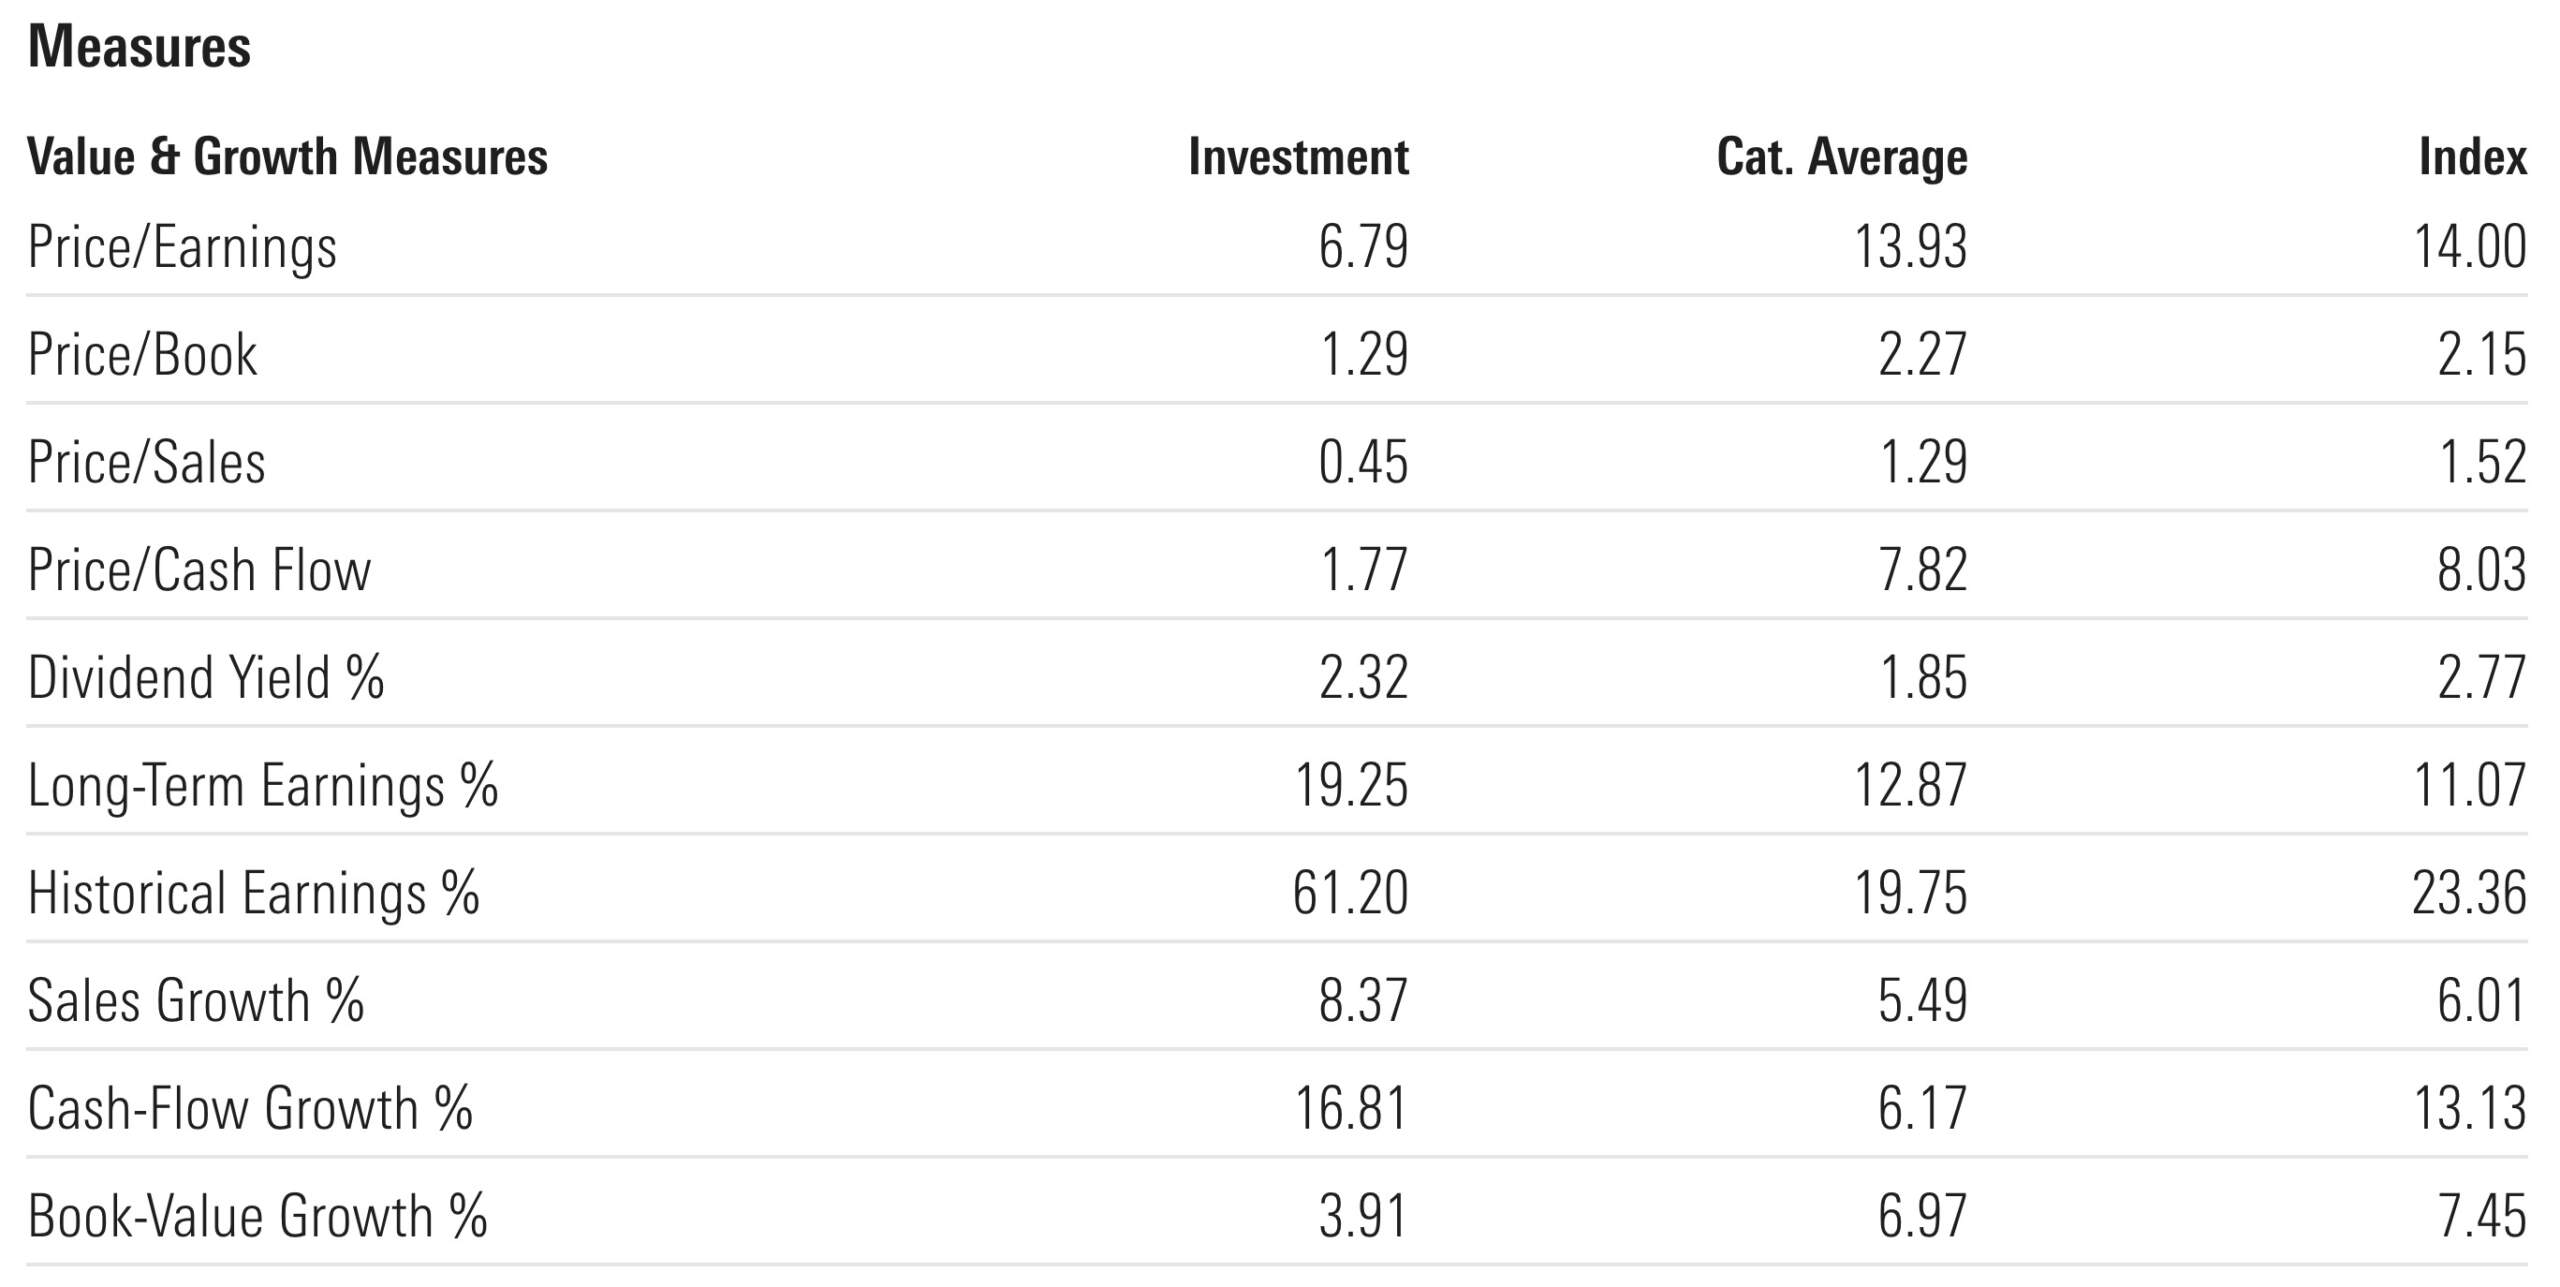
Measures is where Cambria Value and Momentum ETF really shines.
It’s an across the board triumph of lower is better from a price/earnings, price/book, price/sales and price/cash flow perspective.
Where you’d want higher scores you’ve got VAMO ETF with significant wins in Dividend Yield and Historical earnings.
VAMO ETF – Stock Style
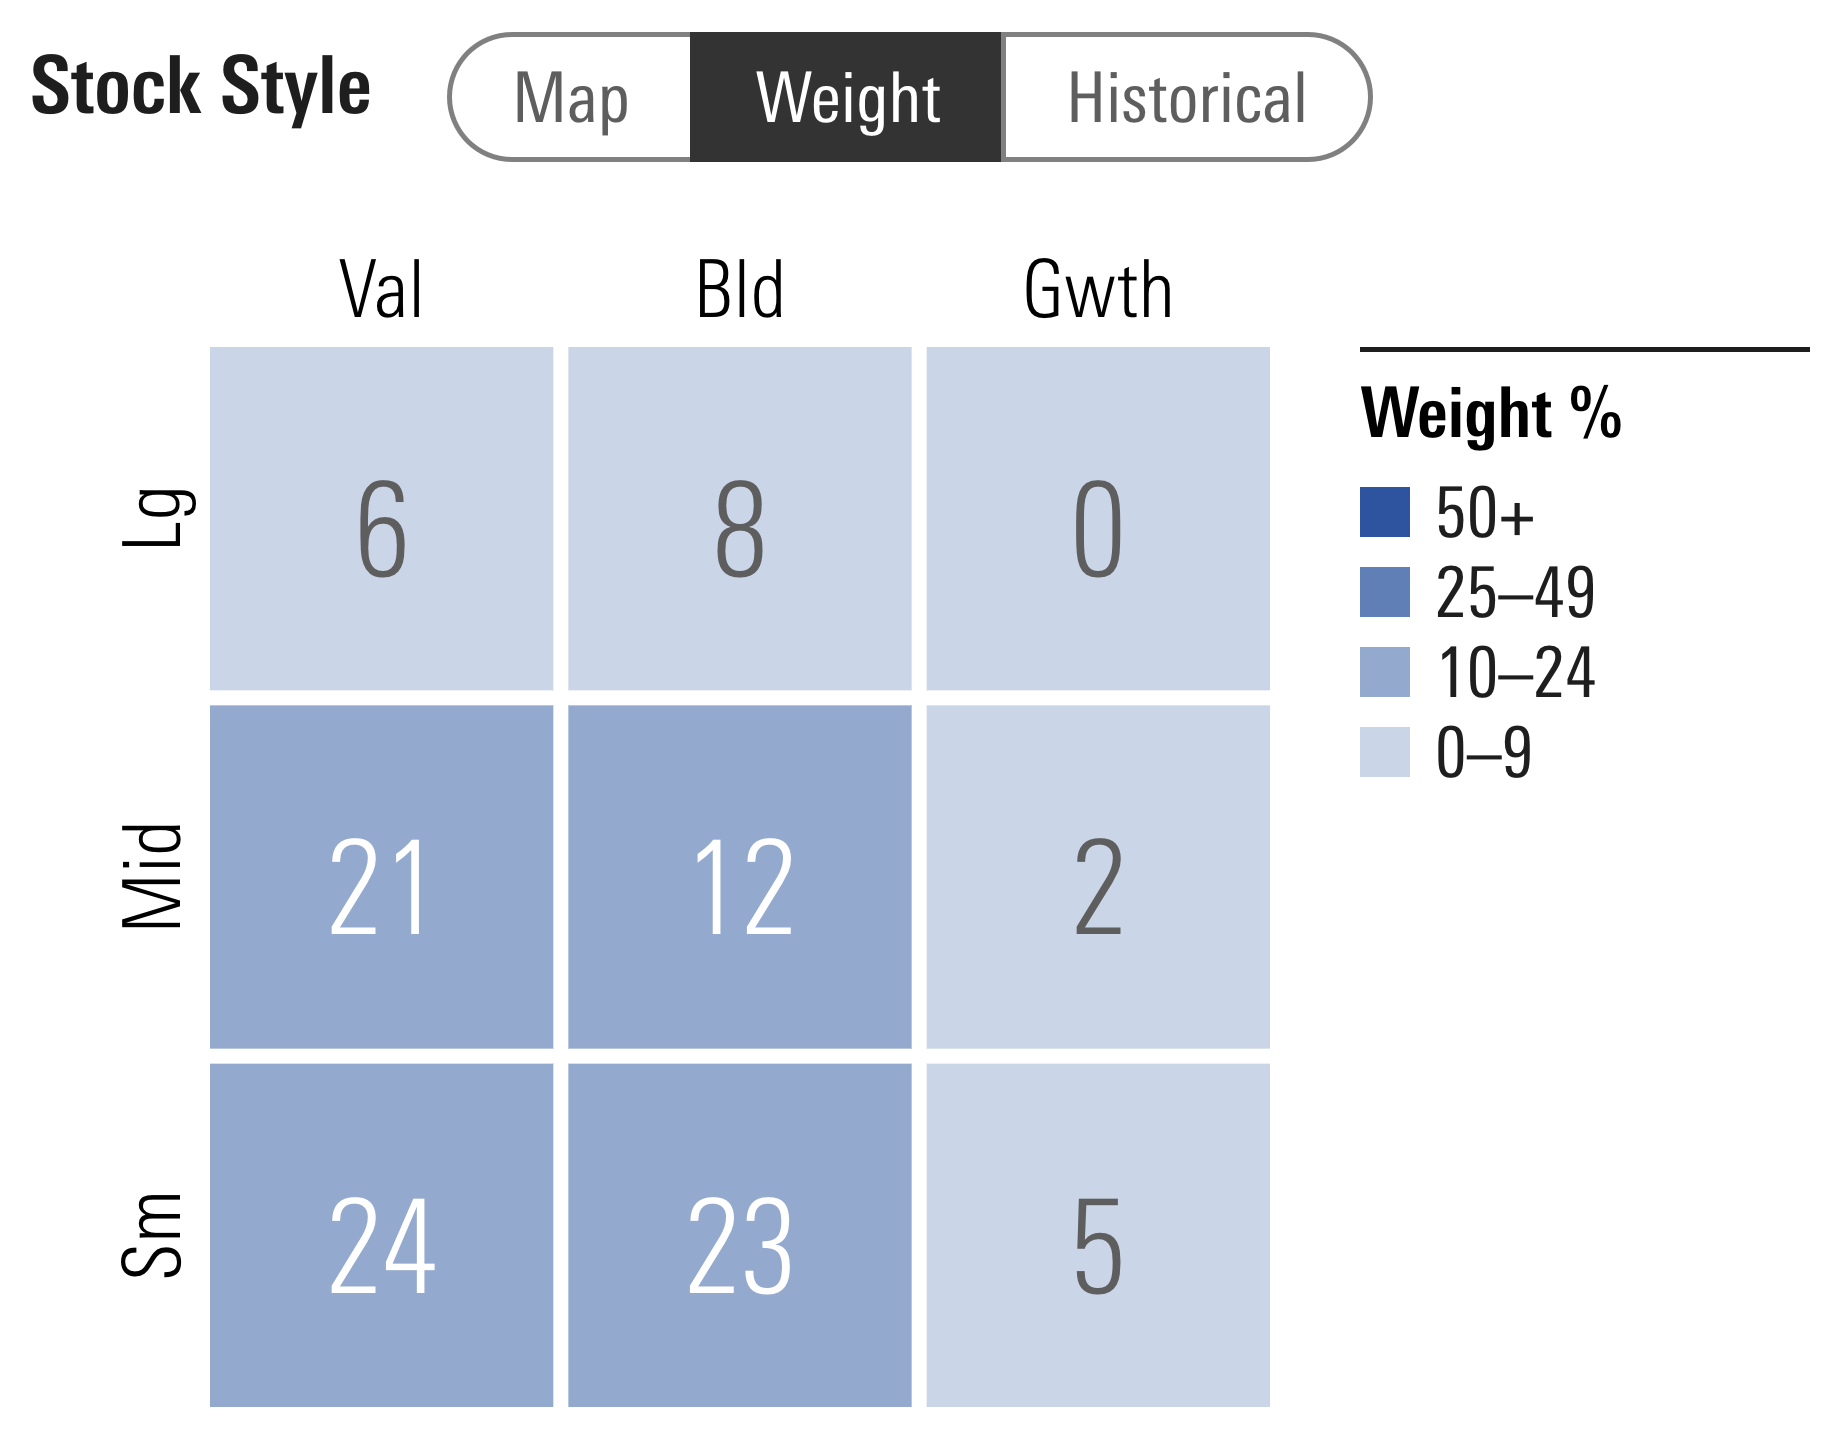
VAMO ETF will delight value investors seeking small and mid-cap exposure specifically.
Notice that the currently “expensive” large-cap equities aren’t clogging up much space in the style box?
VAMO ETF Alpha Architect Screening
How would I cope in this world without Alpha Architect’s incredible Fund Screener?
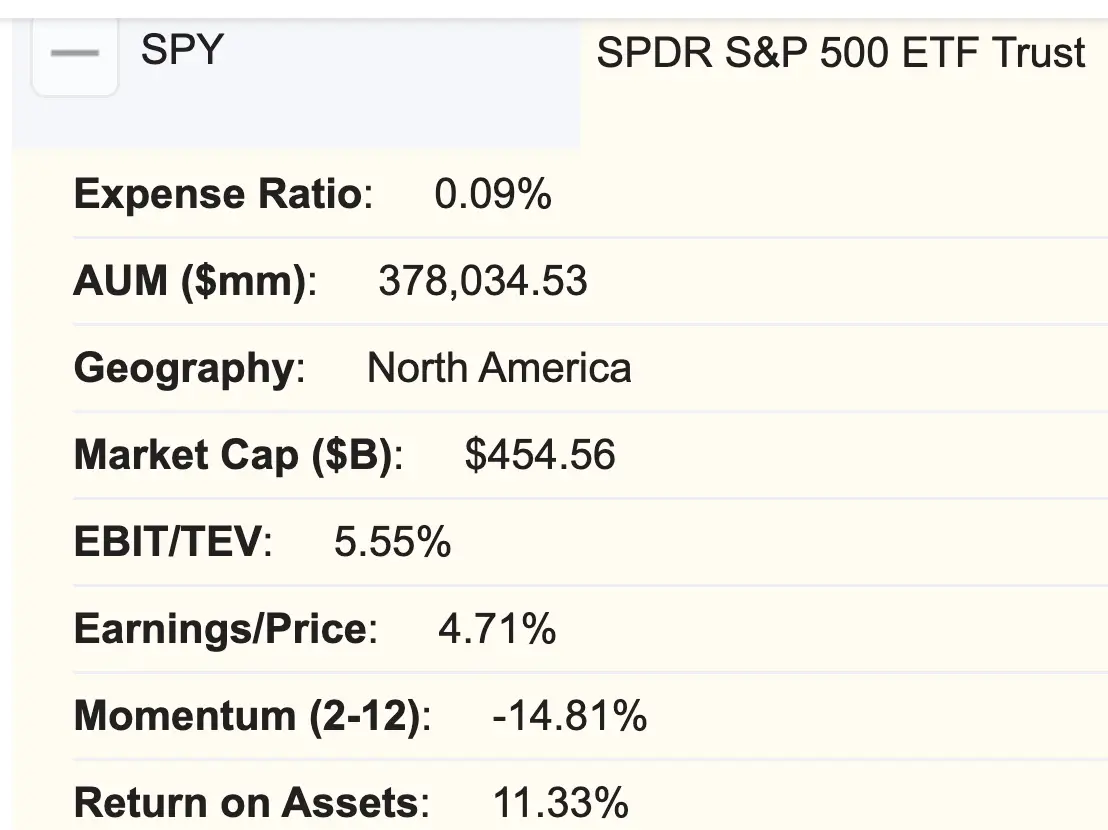
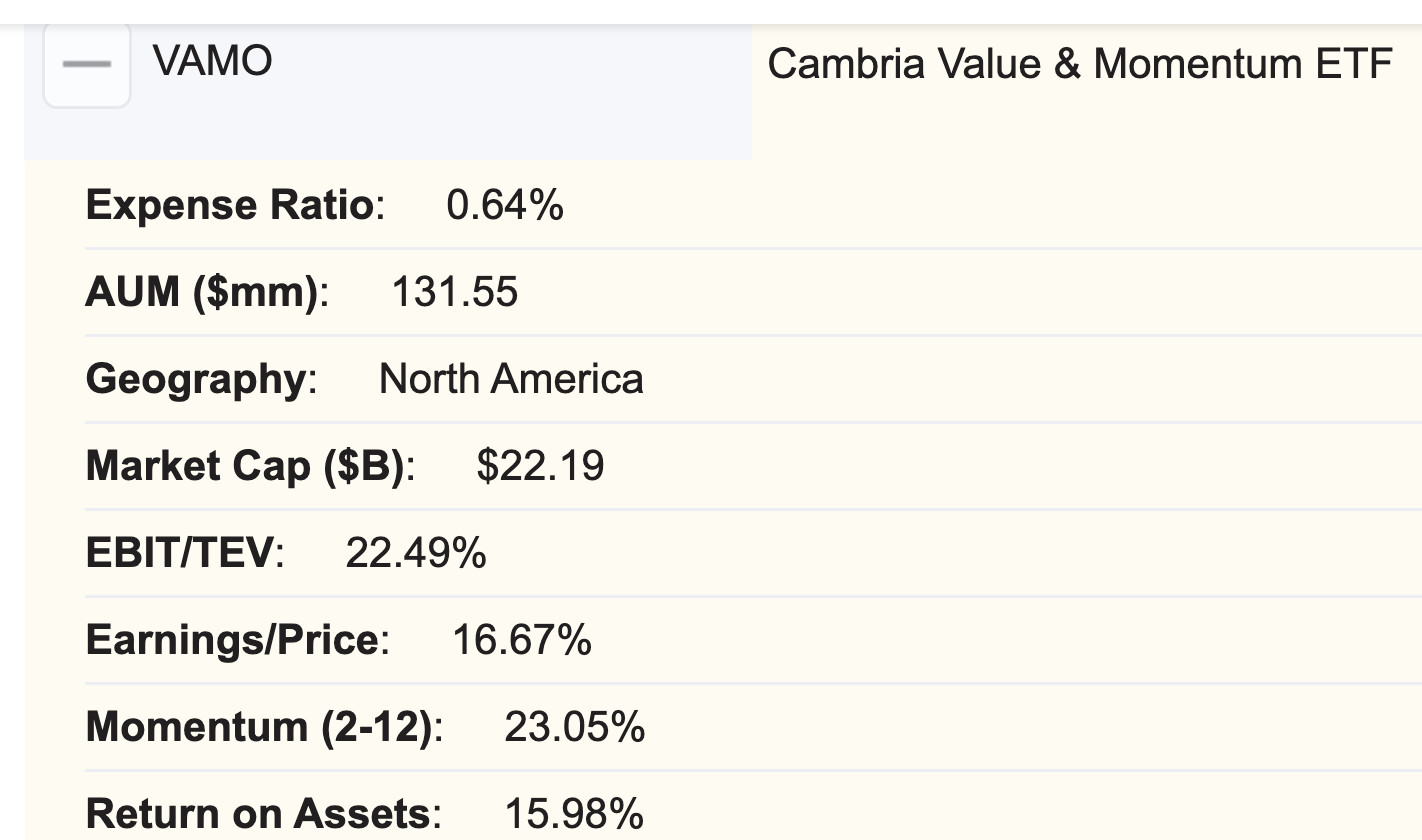
EBIT/TEV: 22.49% vs 5.55%
Earnings/Price: 16.67% vs 4.71%
Momentum (2-12): 23.05% vs -14.81%
Returns on Assets: 15.98% vs 11.33%
VAMO ETF is clearly delivering on its “value” and “momentum” mandate with an across the board drubbing versus the S&P 500.

Cambria Value and Momentum ETF Performance
Here is where things get a bit tricky.
VAMO ETF hit the frying pan during the midst of US Large Cap Equities triumphing over global stocks and most factor strategies despite stretched valuations.
Hence, out of the gate Cambria Value and Momentum ETF struggled mightily as it was underperforming relatively on the long-side of the equation and also not helping itself on the short side either.
The results from 2015 until 2020 were indeed challenging.
VAMO ETF 2015 to 2020 Returns
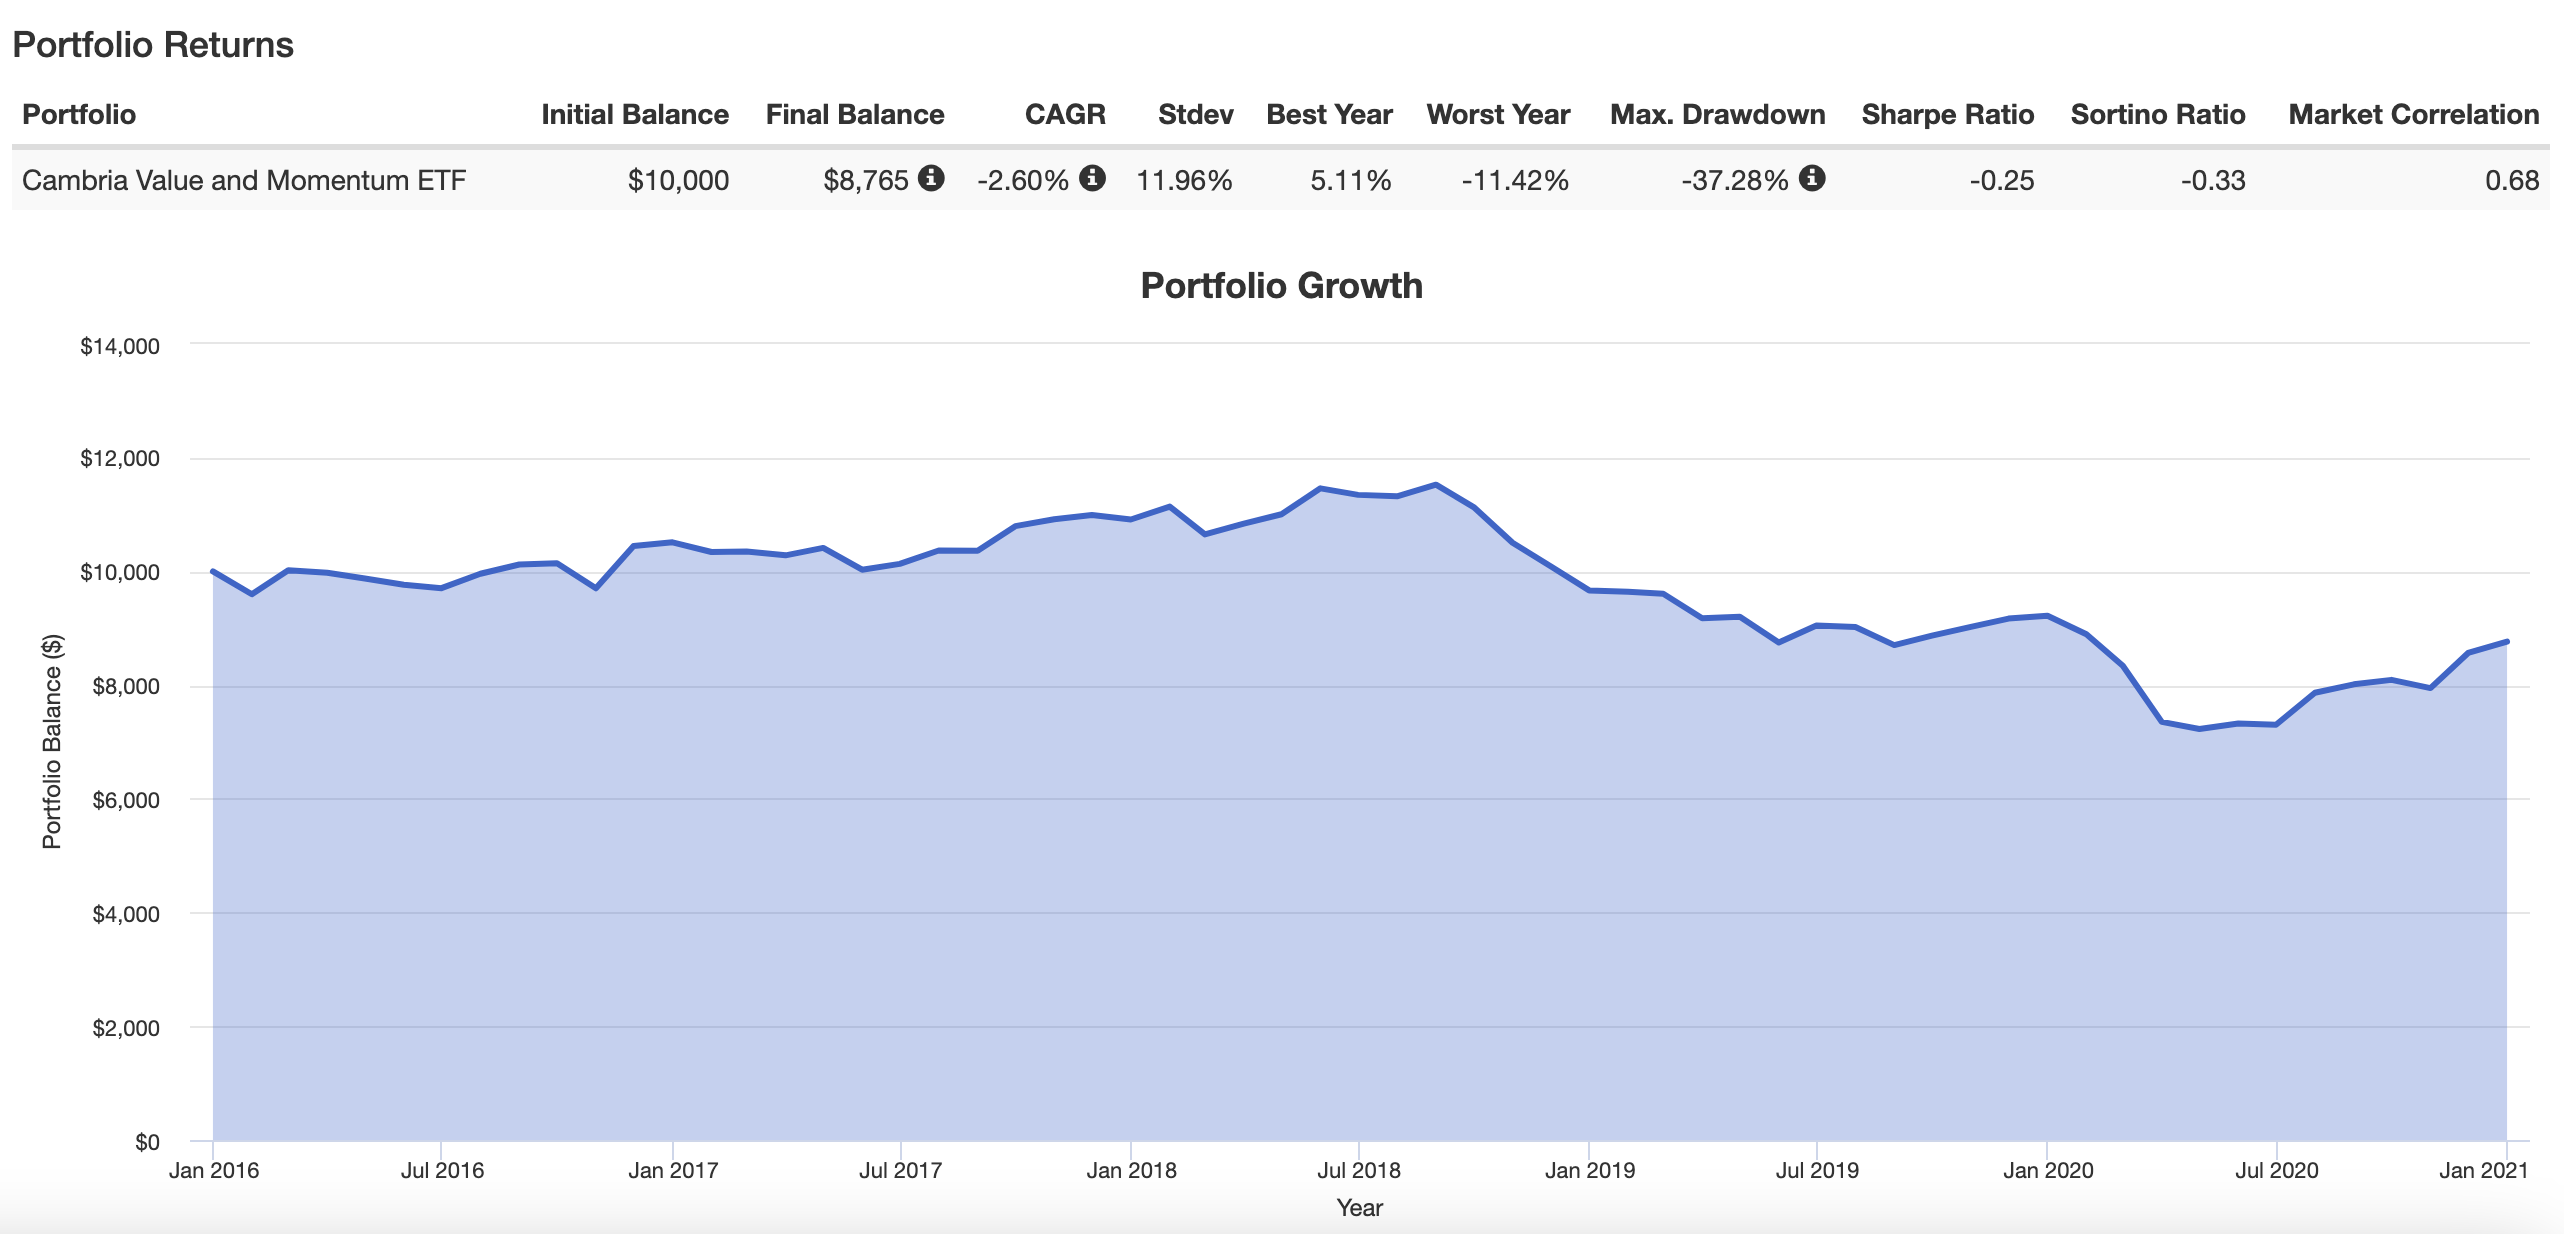
How many investors would have hit the eject button at some point?
It takes a lot of patience to succeed as an investor and if you’re not willing to put up with the “shade” you don’t get to witness the “sunshine”.
VAMO ETF 2021 to 2022 Returns
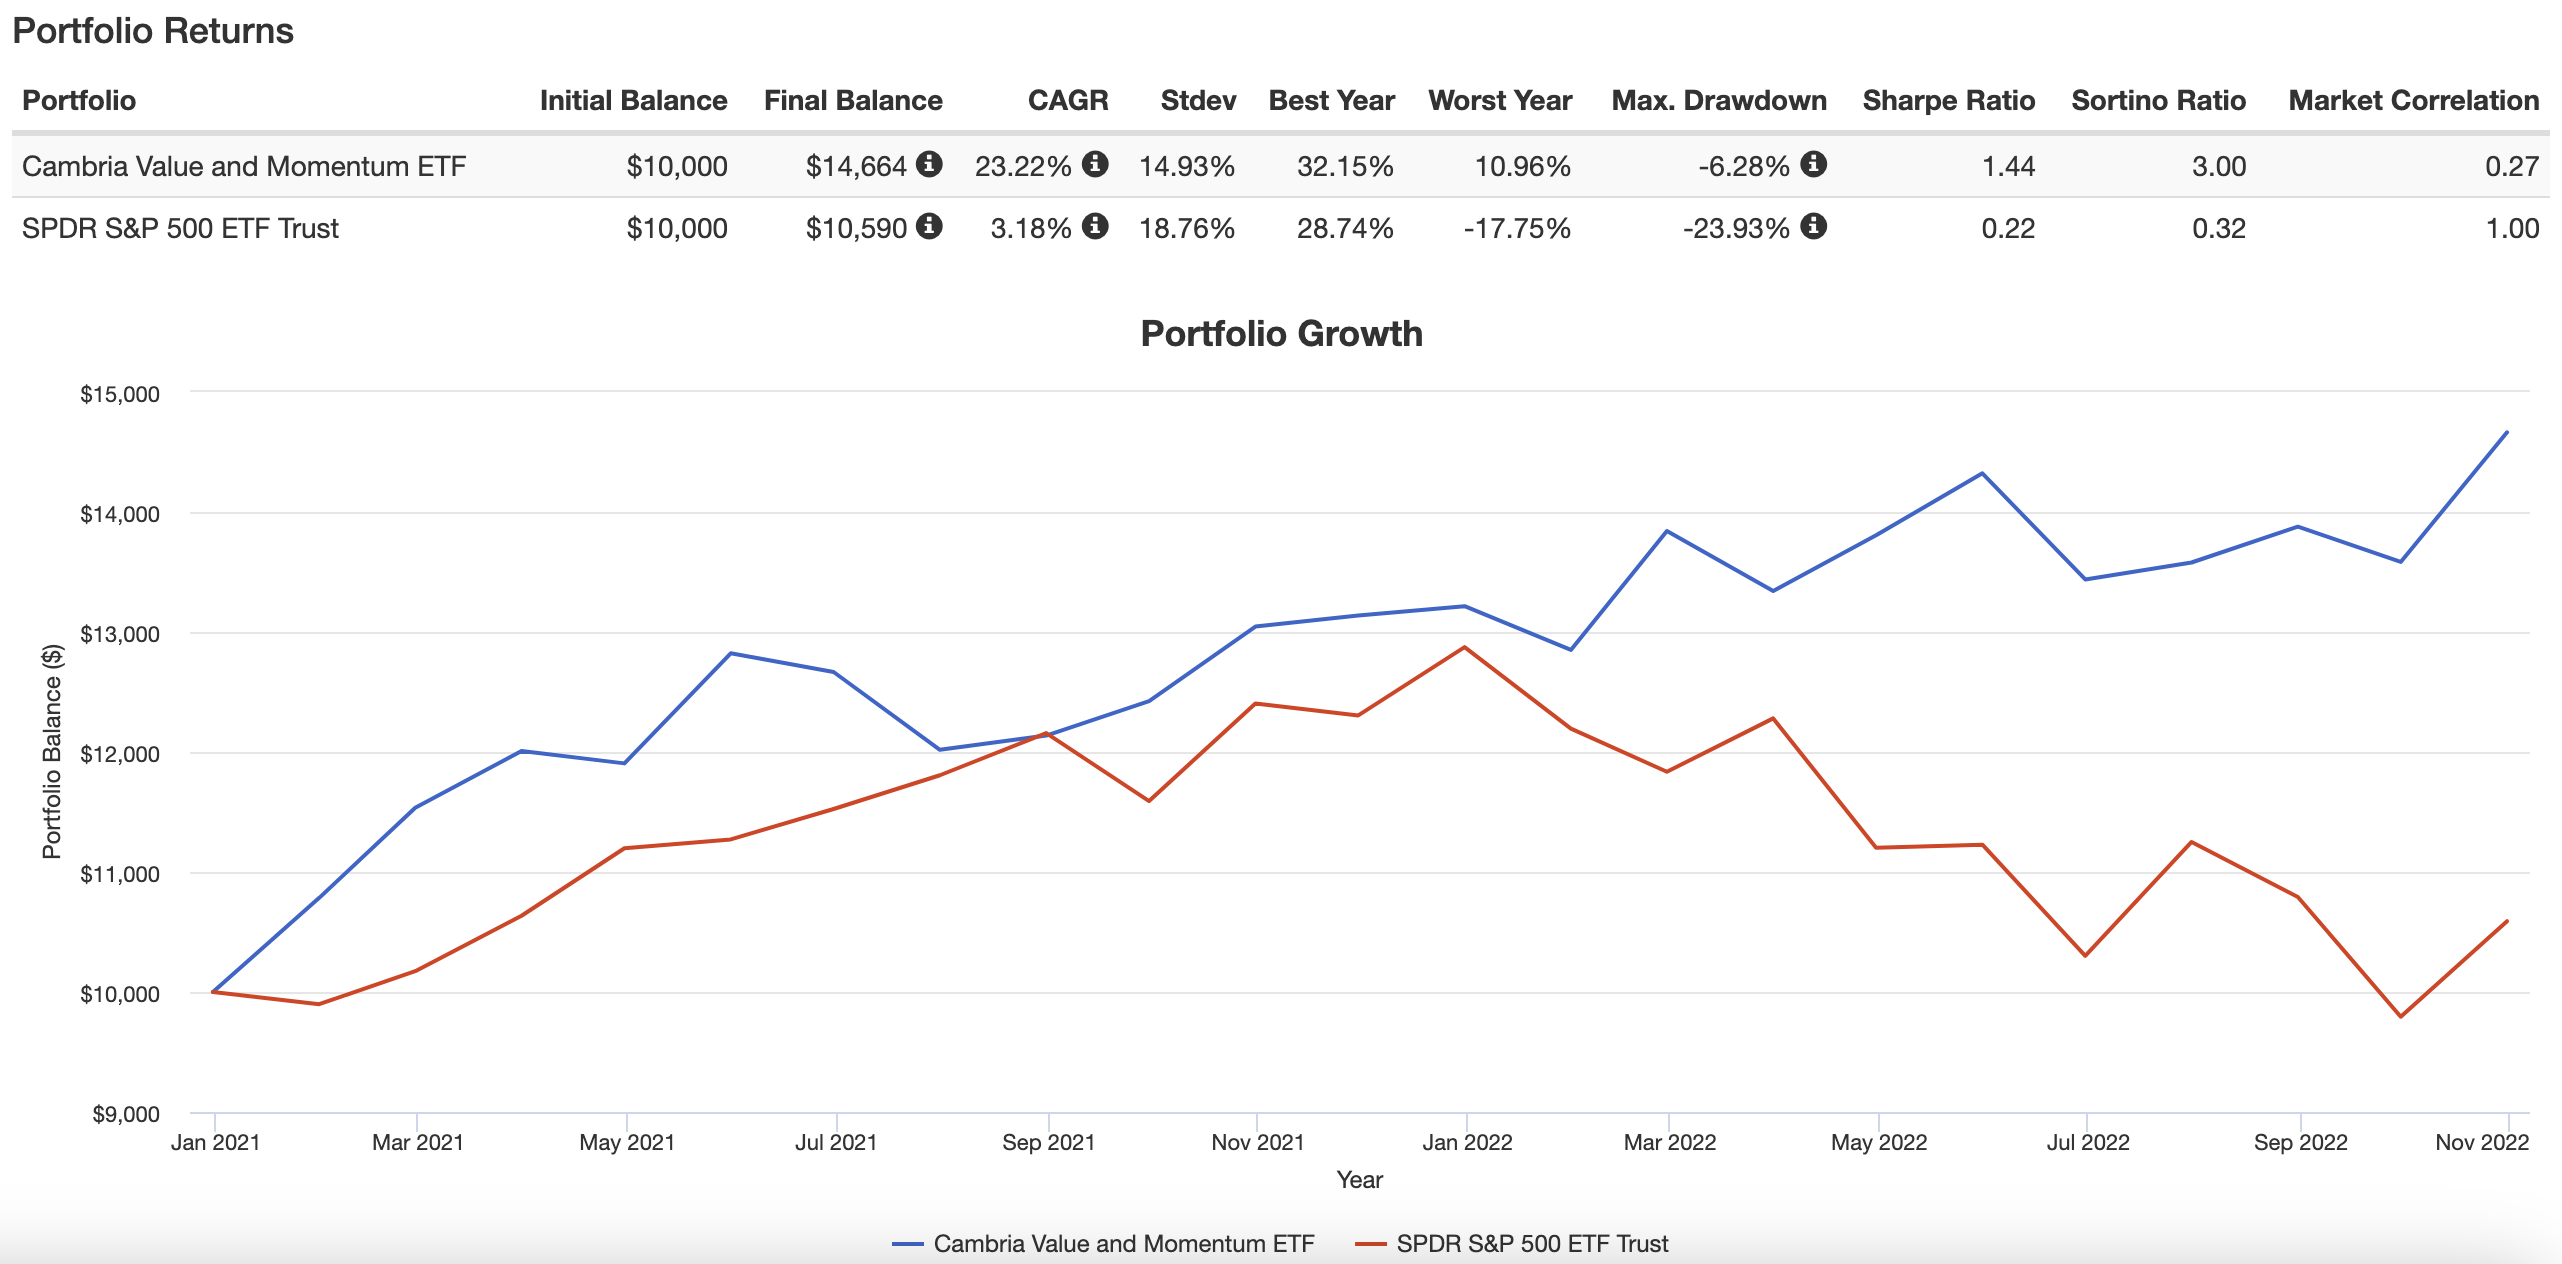
Here is where being patient with a specific strategy pays off big time.
You’ll notice VAMO ETF beating the tar out of the S&P 500 over the past two years.
2021 during good times.
2022 when shit hit the fan.
Here the long-side of the equation outperformed as did the tactical hedges.

VAMO ETF Pros and Cons
Let’s examine the pros and cons of Cambria Value and Momentum ETF.

VAMO ETF Pros
- Concentrated exposure to both “value” and “momentum” equity strategies which historically have outperformed market-cap weighted indexes by 100s of basis points
- Hanging out mostly in small-cap and mid-cap territory which historically outperforms large-cap equities
- Robust EBIT/TEV and ROA versus vanilla funds
- The ability to hedge (or not hedge) with a dynamic quantitative strategy that gauges whether or not the S&P 500 is “expensive” and/or “downward” on the short side of the equation
- Low correlation with market returns offering investors a puzzle piece that can help diversify a portfolio at large
- The unique potential to outperform and be more defensive than other equity strategies
- Very reasonable fee of 0.59 for long-short equity (maybe best in class?)
- A chance to support a boutique ETF provider offering innovative funds

VAMO ETF Cons
- The strategy can clearly underperform when value/momentum stocks are trailing market-cap weighted strategies and tactical hedges get whipsawed adding insult to injury
- The patience required to hold a strategy such as this one is not for investors who have weak hands and soft chins

VAMO ETF Potential Portfolio Ideas
These asset allocation ideas and model portfolios presented herein are purely for entertainment purposes only. This is NOT investment advice. These models are hypothetical and are intended to provide general information about potential ways to organize a portfolio based on theoretical scenarios and assumptions. They do not take into account the investment objectives, financial situation/goals, risk tolerance and/or specific needs of any particular individual.
Now that we’ve taken a thorough look at VAMO let’s see how it can potentially fit into a portfolio at large.
Diversified Quant Portfolio
A simple 4 fund portfolio is something worth considering:
40% AVGE
20% VAMO
30% DBMF
10% TYA
Here we’ve got a four fund portfolio offering investors four unique strategies.
AVGE offering up global core equities with a “value tilt”.
VAMO provides a long-short concentrated “value” and “momentum” fund with the potential for tactical hedges.
DBMF offers us Managed Futures exposure with its long-short capabilities.
TYA creates efficient portfolio space by offering 30% notional fixed income allocation.
Nomadic Samuel Final Thoughts
Whew!
We’re at 2598 words at this point.
I know I’ve spent considerably more time going over the strategy of this fund compared to other ETF reviews but I felt I had to do it.
Firstly, its a strategy that takes a bit more time to unpack and understand.
Secondly, it struggled mightily out of the gate BUT has also performed otherworldly in recent years.
As investors I think we need to have the same level of patience for alternative strategies as we do with our mainstream ones.
If we’re willing to put up with a decade of below water performance for the S&P 500 in the 2000s is it not hypocritical to want to eject during a rough five year patch for this particular fund?
At the end of the day we’re promised a strategy and nothing more.
Results come for those who can sit patiently with it when it inevitably underperforms.
Consider the wise words of Larry Swedroe on the subject of investor psychology and patience from his article “Patient Investing Is Hard”
“Patient investing is the ability to endure long periods of underperformance — adhering to your well-thought-out plan in the form of an investment policy statement — in hopes of achieving your investment objective. Unfortunately, my more than 25 years of experience in advising investors has taught me that when it comes to judging the performance of investment strategies involving risk assets, far too many investors believe that three years is a long time, five years a very long time and 10 years an eternity.
So that’s where I’ll leave things today.
I’m in Argentina at the moment and I’ve got a bottle of Malbec calling my name.
Now over to you.
What do you think about VAMO ETF?
Is it on your radar?
Let me know in the comments below.
Ciao for now.
Important Information
Comprehensive Investment Disclaimer:
All content provided on this website (including but not limited to portfolio ideas, fund analyses, investment strategies, commentary on market conditions, and discussions regarding leverage) is strictly for educational, informational, and illustrative purposes only. The information does not constitute financial, investment, tax, accounting, or legal advice. Opinions, strategies, and ideas presented herein represent personal perspectives, are based on independent research and publicly available information, and do not necessarily reflect the views or official positions of any third-party organizations, institutions, or affiliates.
Investing in financial markets inherently carries substantial risks, including but not limited to market volatility, economic uncertainties, geopolitical developments, and liquidity risks. You must be fully aware that there is always the potential for partial or total loss of your principal investment. Additionally, the use of leverage or leveraged financial products significantly increases risk exposure by amplifying both potential gains and potential losses, and thus is not appropriate or advisable for all investors. Using leverage may result in losing more than your initial invested capital, incurring margin calls, experiencing substantial interest costs, or suffering severe financial distress.
Past performance indicators, including historical data, backtesting results, and hypothetical scenarios, should never be viewed as guarantees or reliable predictions of future performance. Any examples provided are purely hypothetical and intended only for illustration purposes. Performance benchmarks, such as market indexes mentioned on this site, are theoretical and are not directly investable. While diligent efforts are made to provide accurate and current information, “Picture Perfect Portfolios” does not warrant, represent, or guarantee the accuracy, completeness, or timeliness of any information provided. Errors, inaccuracies, or outdated information may exist.
Users of this website are strongly encouraged to independently verify all information, conduct comprehensive research and due diligence, and engage with qualified financial, investment, tax, or legal professionals before making any investment or financial decisions. The responsibility for making informed investment decisions rests entirely with the individual. “Picture Perfect Portfolios” explicitly disclaims all liability for any direct, indirect, incidental, special, consequential, or other losses or damages incurred, financial or otherwise, arising out of reliance upon, or use of, any content or information presented on this website.
By accessing, reading, and utilizing the content on this website, you expressly acknowledge, understand, accept, and agree to abide by these terms and conditions. Please consult the full and detailed disclaimer available elsewhere on this website for further clarification and additional important disclosures. Read the complete disclaimer here.


Nice review. What do you think are the top five or so momentum/trend following funds, in either ETF or MF format?