
Global systematic macro (GSM) is an investment framework that has moved from the exclusive domain of institutional hedge funds directly into the conversational space of curious, forward-thinking DIY asset allocators. To my eyes, looking at how markets interact across global boundaries, it represents a highly disciplined, rules-based methodology for capturing structural inefficiencies. Instead of placing bets on subjective political narratives or singular economic forecasts, this approach constructs systematic trading engines across multi-asset spectrums—including currencies, fixed income, commodities, and equity indices. The core objective? To harvest persistent risk premia and structural mispricings while intentionally removing human ego from the execution pipeline.
GSM: Global Systematic Macro Approach
The operational mechanics of a true GSM framework rest entirely on quantitative algorithms and rigorous data ingestion pipelines to identify macroeconomic trends, structural anomalies, and cross-asset relative value. Once an edge is mathematically validated through historical and out-of-sample backtesting, the system handles execution autonomously. It initiates long or short positions across an array of global liquid instruments, pivoting dynamically as underlying macroeconomic variables shift. For me, the beauty of this approach is that it replaces the typical “macro hero call” with a repeatable, systematic process. If you want to explore how these tactical rules are built from basic mathematical indicators, it is worth looking into create and execute trading strategies that use pure price-action math over narrative bias.
A lot of retail allocators find themselves drawn to GSM when seeking structural diversification that moves completely independently of traditional long-only asset classes. Because a systematic macro program trades a highly disparate basket of global markets, it spreads risks far beyond the borders of a standard equity or fixed-income portfolio. However, it is a different animal when you look under the hood at the structural execution. Many institutional implementations utilize managed leverage to scale uncorrelated return streams up to a specific annualized volatility target. While this scaling can certainly make GSM a powerful tool for portfolio efficiency, it requires an immense level of behavioral discipline from the investor. Holding a strategy that scales up exposures through leverage can feel deeply uncomfortable during extended periods of flat or choppy price action.
What I found interesting here is the underlying capital design. GSM and managed futures strategies primarily execute via unfunded derivatives like futures contracts, which typically require only a 10% to 20% margin commitment. This means the remaining 80% to 90% of the cash collateral canvas doesn’t just sit idle; it’s deployed into short-term Treasury bills. Here is where the math gets uncomfortable for traditional assumptions: because of this architecture, the total return profile of a systematic macro strategy is highly sensitive to the prevailing interest rate environment. In a high-rate regime, that embedded cash backing generates a massive structural yield tailwind before the quantitative models even execute a single trade.
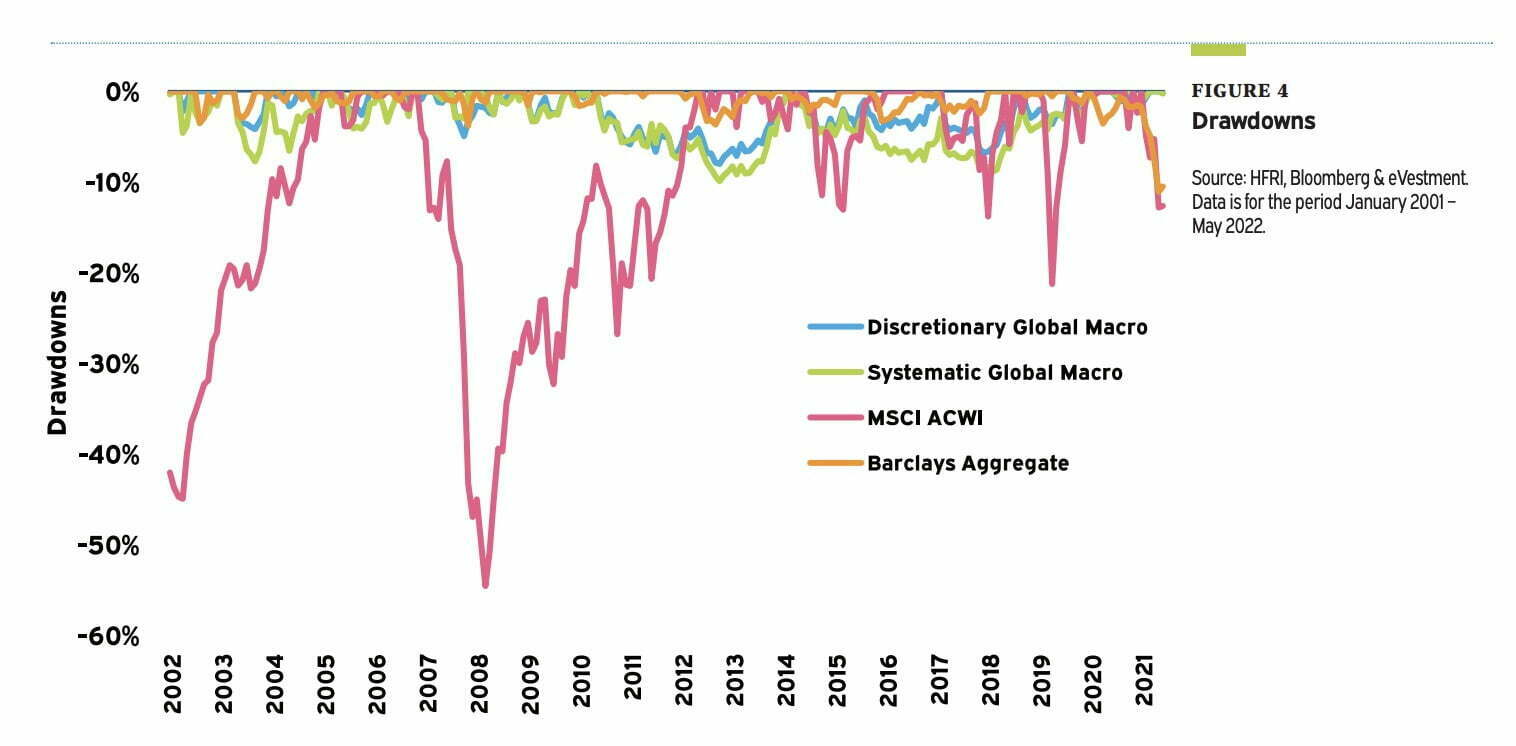
From a portfolio construction standpoint, the true value proposition of GSM is not about chasing eye-popping, unhedged returns; rather, it is about capital efficiency and drawdown smoothing. When equities are experiencing severe drawdowns, a systematic macro strategy has the mandate and structural flexibility to short vulnerable asset classes or ride aggressive trend expansions in commodities or safe-haven currencies. The trade-off, of course, is that during long, quiet bull markets where equity beta reigns supreme, GSM can drag on absolute returns or go through prolonged periods of flat performance. For my own framework, evaluating this strategy means looking past the marketing brochures and focusing entirely on how these moving pieces behave when traditional assets start cracking.
Diversification: Key Advantage Of A Global Systematic Approach
Let’s talk about the math of true portfolio resilience. The foundational advantage of a global systematic macro approach is structural, multi-dimensional diversification. By operating simultaneously across dozens of liquid global markets—spanning short and long-term interest rates, sovereign bonds, hard and soft commodities, exotic currency pairs, and regional equity indices—the strategy minimizes its dependence on any singular economic outcome. If one sector enters a chaotic or completely illiquid regime, the broader portfolio architecture remains insulated. This structural breadth actively dampens the severe volatility spikes that plague highly concentrated, traditional portfolios.
Furthermore, stripping away human emotion via algorithmic execution solves a massive behavioral friction point. When markets enter panic territory, human managers often freeze, succumb to confirmation bias, or abandon their game plans entirely. A quantitative model does not care about the terrifying evening news headlines; it executes purely on systemic signals. To my eyes, this rule-based consistency helps harvest subtle market inefficiencies and risk premia that are simply invisible to the human eye, or too psychologically terrifying for a discretionary manager to execute. For a closer look at building a rules-based foundation to exploit specific market cap anomalies systematically, check out our guide on quantitative small-cap investing strategies.
Wow. Think about that for a second. The reality of implementing this in a portfolio is where things get interesting. When you look at institutional giants like Bridgewater Associates, their entire approach to risk balancing is built around this exact systematic neutral posture. To see how these concepts are discussed at the highest level of systematic asset management, watch this overview:
source: Bridgewater Associates on YouTube
GSM Approach: Potential Challenges
Honestly, we have to look directly at the ugly years and structural blind spots of this asset class. The GSM approach is absolutely not a magic bullet, and its primary mechanical vulnerability is “regime drift” or unexpected tail events that sit far outside the historical data models. If a sudden geopolitical crisis, localized natural disaster, or unannounced sovereign monetary policy shift occurs instantly, quantitative models can find themselves completely wrong-footed. These models operate on probabilities derived from past market behaviors; when a truly unprecedented event rewrites the structural rules of the game overnight, the model’s historical assumptions can break down rapidly.
Another steep challenge is the perpetual, capital-intensive necessity of model refinement and infrastructure maintenance. Markets are highly adaptive ecosystems; as soon as a specific quantitative edge becomes widely publicized or overcrowded, the structural mispricing compresses and decays. Managers must constantly invest heavily in advanced data science, alternative datasets, and execution infrastructure to stay ahead of model decay. Even with the absolute sharpest quantitative minds at the helm, the operational risk of model underperformance during a prolonged, choppy trend-less environment is a very real friction point that investors must endure. This constant evolution reminds me of how legendary value allocators had to adapt their mental frameworks over decades, as explored in our piece on the impact of Warren Buffett on the world of finance.

Global Systematic Macro Performance Over The Past 20 Years
Even with these clear operational challenges, systematic macro has put up substantial historical performance figures over long horizons. According to historical tracking data from BarclayHedge, the Barclay Global Macro Index—which aggregates and tracks a broad universe of institutional systematic macro managers—has generated an average annual return of 6.4% over the past 20 years. To see exactly how this works under extreme conditions, we can look at the historic 2022 market liquidation regime. While traditional balanced portfolios suffered double-digit drawdowns because both stocks and bonds cratered simultaneously under an inflation shock, the SG Trend Index posted a staggering 27.3% net gain. That milestone perfectly illustrates the structural mechanics of “crisis alpha”—thriving on major downside price extensions in fixed income while riding aggressive upward expansions across physical energy complexes. If you are curious about strategies that seek to extract pure alpha by neutralizing broad equity directional movements entirely, take a look at our deep dive into the market-neutral investing strategy and its advantages.
One of the ultimate secular tailwinds driving the modern success of systematic macro frameworks is the exponential expansion of raw global data infrastructure. We are swimming in a vastly different data environment than early quantitative pioneers faced decades ago. Today’s systematic systems ingest massive, high-frequency streams of traditional economic indicators alongside non-traditional data—like real-time maritime shipping manifests, satellite commodity inventory imaging, and localized transactional flows. This allows algorithms to spot macroeconomic inflections and structural capital flows weeks before they show up in standard government economic releases.
Simultaneously, massive leaps in cloud computing architecture have drastically lowered the barrier to entry for analyzing these vast data pipelines. This processing power lets quantitative teams stress-test multi-factor models across decades of historical market cycles in mere minutes, refining complex trend, carry, and value signals with incredible precision. This technological democratization has triggered an expansion of alternative asset managers and specialized mutual funds utilizing systematic macro overlays. For an example of how systematic asset managers dissect alternative alpha generation on a liquid platform, check out our HDGE ETF review covering absolute return strategies.
Of course, technology is completely useless without the specialized human talent required to architecture the code and govern the research models. The quantitative space attracts top-tier minds across mathematics, data engineering, and computational physics. This creates an incredibly intense, highly competitive corporate environment where funds are in a non-stop arms race to optimize execution algorithms, minimize slippage, and eliminate look-ahead bias from their backtests. It requires the same level of disciplined, multi-disciplinary thinking that legendary capital allocators use to build structural mental models, a concept we explore deeply in our analysis of Charlie Munger’s mental models for investing.
The math doesn’t lie: when an industry is this hyper-focused on marginal technical improvements, the speed of model optimization increases exponentially. This operational pressure forces systematic funds to build highly defensive risk frameworks, ensuring that single-factor breakdowns or localized market dislocations don’t trigger cascading portfolio liquidations. For a real-world look at how professional systematic researchers discuss these macro trends and tracking mechanisms live, this discussion from Blockworks Macro offers excellent under-the-hood context:
source: Blockworks Macro on YouTube

Risks Of Global Systematic Macro Investing
Let’s lean straight into the foundational technical risk that breaks most quantitative models: overfitting. Overfitting happens when an overzealous data scientist tweaks a mathematical model so extensively that it fits past historical data perfectly, showing a flawless backtest with a stellar Sharpe ratio. But out in the real world, that model is often completely useless. It has essentially memorized the historical noise instead of capturing an enduring structural signal. To combat this friction, institutional systematic teams use rigorous out-of-sample data sets, walk-forward validation protocols, and explicit complexity penalties to ensure their signals reflect genuine, repeatable market physics rather than statistical ghost-hunting.
Another persistent structural headwind is model decay. A specific quantitative edge—whether it is a unique commodity roll-yield arbitrage or a cross-sectional currency value signal—tends to erode the moment competing institutional capital discovers it and floods the trade. When market regimes shift structurally, models that performed beautifully for a decade can suddenly enter an extended period of uncharacteristic drawdowns. This makes regular model oversight, execution cost budgeting, and continuous infrastructure iteration non-negotiable requirements for long-term survival. It mirrors the exact structural challenge long-term asset allocators face when macroeconomic changes shift the foundational correlations between stocks and bonds, as we write about in our guide on how changing market conditions impact your asset allocation strategy.
Yikes. Think how that feels to hold as an investor. You sit through months of flat performance, wondering if the model is broken or if it’s just a normal statistical distribution. It requires a massive amount of behavioral discipline. For an educational look at how systematic execution differs from standard trading frameworks, this video from Axis Direct walks through the fundamental quantitative building blocks:
source: Axis Direct on YouTube
GSM Major Players And Top Performers
When you look across the institutional landscape to see who has successfully navigated these modeling risks over multi-decade horizons, a few dominant names stand out clearly. Bridgewater Associates, famously founded by Ray Dalio, stands as a premier giant in systematic asset management. Their Pure Alpha and All Weather frameworks are built on massive, systematic data analysis designed to isolate structural economic drivers like growth and inflation shocks. With a dedicated internal roster of over 150 data scientists and engineers, their institutional focus is centered entirely on rigorous research governance and continuous algorithmic iteration to remove personal human bias from active trading.
Another major systematic pioneer is Two Sigma Investments. They approach global macro from a deeply computational perspective, relying heavily on artificial intelligence, machine learning, and massive cloud infrastructure to parse vast streams of non-traditional alternative datasets. Two Sigma’s long-term success stems directly from their intense engineering culture and their commitment to advanced execution algorithms that systematically minimize transaction costs and market impact slippage. This level of extreme operational discipline highlights why systematic multi-asset approaches have historically achieved such resilient, uncorrelated returns compared to concentrated equity strategies, as visualized in the multi-asset trend frameworks covered in our Standpoint Multi-Asset Fund review.
To my eyes, studying these massive systematic players provides a great lesson in humility for the DIY investor. It shows that surviving the market long-term isn’t about finding a singular, permanent secret trick; it’s about building a robust, repeatable process that lets the math breathe. For a wider conceptual breakdown of how these multi-market mechanics function without relying on single-stock selection, this educational video from Financial Wisdom provides great foundational context:
source: Financial Wisdom on YouTube

Global Systematic Strategies That Investors Utilize
Modern systematic asset managers utilize an extensive toolkit of distinct quantitative strategies to extract structural edges across global markets. These approaches operate with unique mathematical triggers, risk targets, and holding periods to ensure the broader portfolio does not rely on a single market outcome:
- Trend-following: This framework relies on time-series momentum math to identify sustained directional asset trajectories, systematically scaling into long positions during multi-month market expansions and initiating short positions during protracted structural meltdowns. For an in-depth breakdown of how to build and maintain these rules without losing emotional discipline, read our comprehensive guide to trend-following strategies.
- Systematic macro: A core strategy that uses hard data algorithms to ingest raw global macroeconomic data—such as GDP growth differentials, real-time inflation prints, and central bank balance sheet changes—to isolate pricing mismatches across global bond and currency markets.
- Statistical arbitrage: This tactical process utilizes cross-sectional mean reversion math to track historical pricing cointegrations between highly correlated assets, going long the statistically undervalued security while shorting the overvalued peer when the historical spread widens to an extreme boundary.
- Market-neutral: A capital-efficient structural design that pairs long and short asset exposures to neutralize general equity market directionality entirely, seeking to isolate pure idiosyncratic manager skill or factor spreads independent of broad market drawdowns. To see how this structural insulation is built inside a modern liquid vehicle, check out our Simplify Market Neutral Equity Long/Short (EQLS) ETF review.
- Managed futures: This structural approach trades liquid, exchange-traded futures contracts across commodities, currencies, fixed income, and stock indices, using trend or carry signals to harvest structural risk premia. For an educational evaluation of a popular multi-asset futures vehicle that tracks these exact commodity and currency trends, explore our KMLM ETF review.
- Multi-asset: A unified portfolio architecture that dynamically allocates capital across a highly diversified global canvas of equities, fixed income, physical commodities, and foreign exchange markets, seeking optimal risk-adjusted returns through wide asset diversification.
- Quantitative equity: An algorithmic strategy that utilizes systematic factor filters—such as value, quality, low volatility, and momentum—to construct equity portfolios designed to outperform traditional market-cap-weighted indices over full market cycles. For a look at a pure quantitative implementation of these factor formulas, read our review of the Alpha Architect US Quantitative Value (QVAL) ETF.
- Seasonality: This systematic program exploits repeatable, calendar-driven supply and demand shocks that affect specific physical assets—such as agricultural commodities experiencing harvest gluts or energy markets fluctuating during winter demand spikes.
- Mean reversion: A quantitative framework built on the mathematical expectation that extreme price extensions away from a long-term moving average or structural value anchor are fundamentally unsustainable, betting on a return back to historical statistical norms.
- Momentum: This factor strategy systematically targets assets displaying strong relative price outperformance over a trailing 3-to-12 month window, capitalizing on behavioral herd behavior and slow information dissemination before the trend exhausts. If you want to see how high-conviction momentum math is implemented systematically, see our QMOM ETF strategy review.
- Volatility: This framework trades derivatives or options contracts to profit from shifts in implied volatility regimes, or to systematically harvest the structural spread between implied volatility and realized market variance.
- Carry: A fundamental yield-harvesting framework that captures structural return differentials by shorting low-yielding or expensive-to-hold assets while going long higher-yielding alternatives, such as foreign exchange rate pairs or back-month commodity futures curves. To see how these yield overlays can be combined with core equity beta via return stacking, see our RSSY ETF review covering Return Stacked yield strategies.
- Options: A derivatives-based architecture that utilizes structural options overlays—such as writing covered calls, buying tail hedges, or constructing multi-leg spreads—to reshape a portfolio’s return distribution and manage downside tail risk.
- Event-driven: This tactical framework uses data automation to track corporate or sovereign catalysts—such as mergers, corporate restructuring, regulatory updates, or credit downgrades—seeking to capture localized pricing gaps. To see how opportunistic credit managers trade these shifting structural situations, check out our Simplify Opportunistic Income (CRDT) ETF review.
- Sentiment: This quantitative strategy aggregates massive streams of public data—including retail trading options volumes, social media sentiment analytics, and financial news flows—to exploit behavioral extremes and market overreactions.
- Risk parity: A portfolio construction technique that discards arbitrary capital allocation percentages, instead allocating capital based on the underlying volatility contribution of each asset class so that bonds, equities, and commodities exert equal risk impact. For a structural analysis of an all-weather implementation built on these exact balanced foundations, read our review of the UPAR Ultra Risk Parity ETF.
- Fundamental: This framework extracts accounting and valuation metrics—such as cash flow health, debt structures, and operational margins—and processes them systematically across a vast global universe to filter out low-quality companies.
- Statistical arbitrage: *[Preserved duplication from original text infrastructure]* An algorithmic process focusing on high-speed statistical cointegrations, dynamically buying and shorting baskets of highly synchronized financial instruments when their historical mathematical spreads deviate from standard tracking bands.
- Systematic value: An uncompromised factor-driven framework focused on picking up out-of-favor, statistically cheap assets based on deep valuation multiples like low price-to-book or price-to-earnings metrics, relying on market corrections to realize intrinsic value.
- Multi-factor: A sophisticated allocation model that integrates multiple uncorrelated investment styles—combining value, momentum, and low volatility signals simultaneously—to generate a diversified return engine that avoids single-style underperformance.
- Machine learning: An advanced algorithmic setup that uses neural networks or random forest models to ingest non-linear global datasets, identifying complex structural shifts and hidden market patterns that standard linear regressions miss.
- High-frequency trading: A highly specialized execution architecture that uses low-latency technology to place massive order volume within milliseconds, captivating micro-scale price dislocations and spread discrepancies directly within market execution venues.
For any DIY asset architect, the critical takeaway here is that these multi-faceted systematic sub-strategies are absolutely not mutually exclusive. Institutional quantitative managers rarely gamble an entire fund on a single signal; they deliberately blend these concepts together into a comprehensive framework. For example, a fund might pair a mid-term time-series momentum strategy with an unconstrained commodity carry overlay and a defensive cross-sectional currency value engine. This multi-signal architecture ensures that if trend-following enters a choppy, trendless macro environment, the carry and value engines can help offset the inevitable whipsaw losses.
The long-term performance of any global systematic macro framework ultimately hinges on execution design, transaction cost management, and rigorous data cleaning. It is easy to construct a beautiful, profitable backtest on paper using messy, unadjusted historical data that ignores bid-ask spreads or futures roll friction. Out in the live markets, however, execution costs can eat thin trading edges alive. Investors looking to add these alternative strategies to their own asset mix must look past historical simulations and carefully assess the structural vehicle realities, fee structures, and tracking error constraints of the underlying manager.
That is why we stress-test these allocation concepts so rigorously on this blog. Blending independent return streams together can fundamentally transform the drawdown profile of an investor’s overall portfolio, but it requires a deep understanding of how these moving parts fit into an expanded canvas approach. To explore how these multi-signal alternative strategies are discussed by modern quantitative managers, watch this practical breakdown from the team at Excess Returns:
source: Excess Returns on YouTube

12 Question FAQ on Global Systematic Macro (GSM) Investing
What is Global Systematic Macro (GSM) in plain English?
GSM is a quantitative, rules-based way to trade big-picture themes across asset classes (rates, FX, equities, commodities, credit). Computers scour data for repeatable patterns—trend, carry, value, seasonality, risk premia—and execute long/short positions to harvest those edges with disciplined risk controls.
How is GSM different from discretionary global macro?
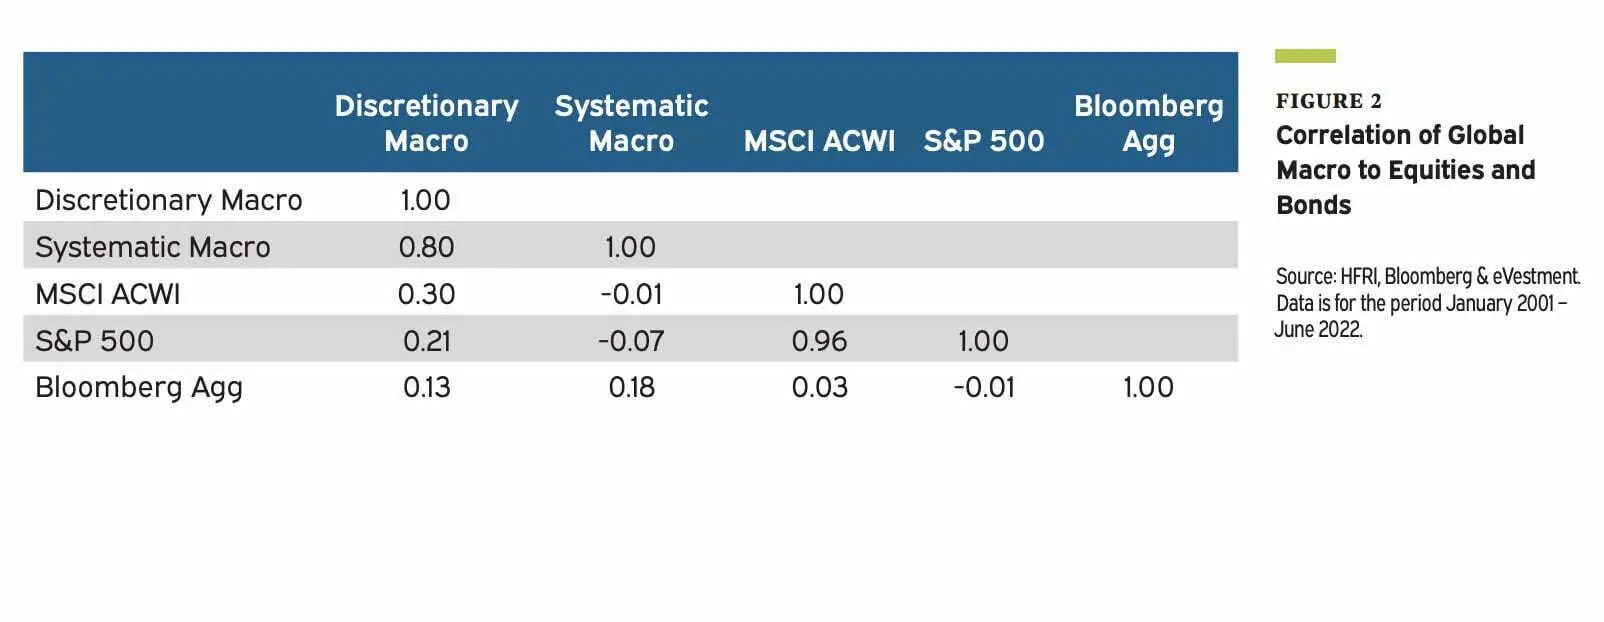
Discretionary macro relies on human judgment and narratives; GSM encodes hypotheses into testable rules, validates them on historical/out-of-sample data, and executes systematically. The aim is consistency, scalability, and lower behavioral bias, with performance driven by factor exposures rather than one-off “hero calls.”
What return drivers do GSM funds typically target?
Common building blocks include time-series momentum (trend), cross-sectional momentum, value (e.g., purchasing power parity in FX, term structure in commodities), carry (rate/roll yield), seasonality, quality/defensive tilts, and volatility risk premia. Many managers blend multiple signals to diversify model risk.
Why do investors add GSM to a portfolio?
GSM often shows low correlation to stocks and bonds, offers crisis-alpha potential via trend in major sell-offs, and provides multi-asset diversification. When implemented well, it can smooth portfolio volatility and improve risk-adjusted returns without relying on equity beta.
What are the main risks of GSM?
- Model risk & overfitting: great backtests, weak live results.
- Regime shifts/model decay: edges erode as markets change.
- Execution slippage: costs, financing, and liquidity frictions.
- Crowding/capacity: too much capital in similar signals compresses spreads.
- Leverage & convexity: amplifies both gains and drawdowns if controls fail.
How do credible managers reduce overfitting/model decay?
They use clean data pipelines, strict train/validation/test splits, walk-forward analysis, stress/scenario testing, orthogonal signals, explicit complexity penalties, and post-launch performance gates. Live results are monitored with change-point detection and rapid de-weighting/retirement of decaying signals.
What should I expect for volatility and drawdowns?
GSM volatility targets vary (e.g., 8–15% annualized), with periodic drawdowns from signal crowding or sharp reversals. Trend filters can deliver “crisis alpha,” but choppy/mean-reverting markets can be challenging. Always read the strategy’s vol target, leverage limits, and historical peak-to-trough.
How do fees and costs impact GSM performance?
Return premia can be thin; fees, borrowing, futures rolls, and slippage matter a lot. Net performance depends on efficient execution, internal crossing, and capacity discipline. Compare managers on net Sharpe, capture in stress periods, and capacity policy, not just headline backtests.
What vehicles are available to access GSM?
- ’40 Act/UCITS funds & ETFs: daily liquidity, tighter leverage, lower capacity.
- Private funds/LPs: broader instruments and leverage, but higher fees/lockups.
- SMAs/overlays: bespoke exposures and integration with your existing assets.
Vehicle choice affects instruments used, leverage, liquidity, taxes, and fees.
How much should an investor allocate to GSM?
Typical diversified portfolios consider 5–15% to alternatives, with a slice (e.g., 3–10%) to GSM/managed futures depending on goals, risk tolerance, and what other diversifiers you own (e.g., options, alt credit). Size exposure to your max tolerable drawdown, not just to expected return.
How do I evaluate a GSM manager?
Use a structured checklist:
- Process: signal set, research governance, de-biasing & validation.
- Risk: vol targeting, tail controls, exposure & liquidity limits.
- Execution: markets traded, cost budgeting, slippage tracking.
- Evidence: live vs. backtest consistency, crisis behavior, factor attribution.
- Ops: data lineage, model inventory, kill-switches, team & turnover, capacity.
Can GSM be combined with other strategies?
Yes—pairing GSM with equity, bond, and alternative sleeves (e.g., merger arb, alt credit, option hedges) can improve the overall Sharpe/correlation mix. Within GSM, multi-signal blends (trend + carry + value + macro fundamentals) can reduce single-factor whipsaw risk.
Educational only. Not investment advice. Past performance is not indicative of future results.
The Portfolio Reality Matrix
To help cut through the complex quantitative definitions and find the practical core of these sub-strategies, here is a breakdown of the structural trade-offs across the central pillars of systematic investing. This matrix maps out the divergence between marketing expectations and the real-world operational friction points you must be prepared to absorb:
| Strategy / Fund / Concept | What It Promises | Implementation Friction | The Sponge Verdict (Absorb or Expel?) |
|---|---|---|---|
| Trend-Following (CTA) | Crisis alpha, long-volatility profiles, and absolute returns during extended directional market meltdowns. | Severe multi-month whipsaw losses in choppy, mean-reverting equity markets; notable tracking error compared to simple 60/40 styles. | ABSORB – Essential structural insulation for an expanded canvas, provided your temperament can handle years of underperforming vanilla benchmarks. |
| Global Macro Fundamentals | Systematic multi-market positioning built on top of robust macroeconomic growth, rates, and corporate liquidity signals. | Extremely data-dependent; vulnerable to sudden structural policy shifts or unexpected geopolitical tail events that bypass past model rules. | ABSORB WITH CAUTION – Best utilized as a component signal inside a multi-strategy engine to diversify simple price-trend risk. |
| Statistical Arbitrage | Consistent, absolute return streams harvested by short-term convergence trades across co-integrated market pairs. | High portfolio turnover; severe exposure to execution slippage, high trading costs, and capacity constraints that decay thin margins. | EXPEL FOR DIY – High turnover costs eat individual returns alive. Leave this high-frequency infrastructure layer to institutional desks. |
| Carry Strategies | Steady risk-premium yield harvesting by going long high-yielding assets while shorting low-yielding structural points. | Vulnerable to catastrophic liquidity spikes; suffers from “going up the stairs and down the elevator” return dynamics when risk assets dump. | ABSORB WITH CAP – Outstanding diversifying overlay, but needs strict exposure controls to protect against sharp structural currency liquidations. |
The Retail Portability Matrix
For a DIY investor assembling an expanded canvas portfolio, separating institutional capability from real-world execution access is critical. This matrix outlines which elements of the systematic playbook are portable to a retail architecture and where implementation friction compromises the edge:
| Institutional Strategy | DIY Retail Vehicle Class | Embedded Portfolio Levers | Retail Friction / Drag Factors | The Sponge Verdict |
|---|---|---|---|---|
| Multi-Asset Trend Following | ’40 Act Mutual Funds / Liquid ETFs | Exchange-traded futures overlays; fully institutional execution routing. | Fixed structural management fees (0.70%–1.10%); regulatory leverage caps under current rules. | PORTABLE ALPHA – The absolute easiest mechanical replacement for standard bond sleeves when chasing pure asset un-correlation. |
| Cross-Asset Systematic Carry | Specialized Alternative Strategy ETFs | Automated cash-settled FX and commodity index roll yield extraction. | High turnover slippage; tax friction when held inside standard taxable brokerage accounts. | PORTABLE WITH CAUTION – Keep these implementations strictly fenced inside tax-advantaged accounts (IRAs) to mitigate distribution drag. |
| High-Frequency Latency Arbitrage | None Accessible | Microwave network positioning; collocated order entry engines. | Retail pricing tiers; platform access restrictions; broker execution routing delays. | UNPORTABLE – Completely expel. This is an operational scale game that a DIY account cannot systematically access or replicate. |
Global Systematic Macro Final Thoughts
To my eyes, exploring the architectural framework of global systematic macro reveals an incredibly powerful, objective path to total portfolio diversification. By building an asset allocation engine on automated, quantitative logic that trades across liquid multi-asset setups, it attempts to capture pure structural inefficiencies and cross-market mispricings without falling prey to human emotional bias. Utilizing sophisticated computers to scan global data ensures that tactical long and short positions are executed with strict mathematical consistency, creating a reliable, rules-based alternative to standard long-only strategies.
The structural advantages of this approach—built heavily on deep multi-asset diversification, programmatic behavioral discipline, and the ability to scale uncorrelated returns through capital efficiency—are compelling. Yet, for my own framework, the implementation realities require a sober assessment of the trade-offs. The ever-present threat of unprecedented regime shifts, the absolute necessity of continuous model governance to fight model decay, and the intense psychological friction of holding overfitted strategies through their dry, choppy years mean this is an institutional tool that requires extreme patience from retail investors.
The historical performance numbers across long-term market tracking indices show that a systematic macro posture can act as a phenomenal portfolio stabilizer when traditional allocations are struggling. The continuous expansion of complex alternative data streams and low-latency computation power ensures that quantitative systems will only grow more defensive and integrated over time. The math doesn’t lie; the operational toolkit is expanding rapidly for those willing to look beyond market-cap-only thinking.
Looking at the long-term track records of massive institutional pioneers like Bridgewater Associates or Two Sigma Investments clearly highlights how structural engineering can effectively smooth out multi-asset drawdowns over major macroeconomic cycles. The trade-off is clear: while these frameworks offer a beautiful look at behavioral insulation and alternative alpha generation, any investor thinking about incorporating a global systematic overlay must look completely past backtested optimization. The core question I’d ask is whether your personal behavioral discipline can truly handle the tracking error and the unique friction points of holding these alternative engines through their inevitable ugly years.
Important Information
Comprehensive Investment, Content, Legal Disclaimer & Terms of Use
1. Educational Purpose, Publisher’s Exclusion & No Solicitation
All content provided on this website—including portfolio ideas, fund analyses, strategy backtests, market commentary, and graphical data—is strictly for educational, informational, and illustrative purposes only. The information does not constitute financial, investment, tax, accounting, or legal advice. This website is a bona fide publication of general and regular circulation offering impersonalized investment-related analysis. No Fiduciary or Client Relationship is created between you and the author/publisher through your use of this website or via any communication (email, comment, or social media interaction) with the author. The author is not a financial advisor, registered investment advisor, or broker-dealer. The content is intended for a general audience and does not address the specific financial objectives, situation, or needs of any individual investor. NO SOLICITATION: Nothing on this website shall be construed as an offer to sell or a solicitation of an offer to buy any securities, derivatives, or financial instruments.
2. Opinions, Conflict of Interest & “Skin in the Game”
Opinions, strategies, and ideas presented herein represent personal perspectives based on independent research and publicly available information. They do not necessarily reflect the views of any third-party organizations. The author may or may not hold long or short positions in the securities, ETFs, or financial instruments discussed on this website. These positions may change at any time without notice. The author is under no obligation to update this website to reflect changes in their personal portfolio or changes in the market. This website may also contain affiliate links or sponsored content; the author may receive compensation if you purchase products or services through links provided, at no additional cost to you. Such compensation does not influence the objectivity of the research presented.
3. Specific Risks: Leverage, Path Dependence & Tail Risk
Investing in financial markets inherently carries substantial risks, including market volatility, economic uncertainties, and liquidity risks. You must be fully aware that there is always the potential for partial or total loss of your principal investment. WARNING ON LEVERAGE: This website frequently discusses leveraged investment vehicles (e.g., 2x or 3x ETFs). The use of leverage significantly increases risk exposure. Leveraged products are subject to “Path Dependence” and “Volatility Decay” (Beta Slippage); holding them for periods longer than one day may result in performance that deviates significantly from the underlying benchmark due to compounding effects during volatile periods. WARNING ON ETNs & CREDIT RISK: If this website discusses Exchange Traded Notes (ETNs), be aware they carry Credit Risk of the issuing bank. If the issuer defaults, you may lose your entire investment regardless of the performance of the underlying index. These strategies are not appropriate for risk-averse investors and may suffer from “Tail Risk” (rare, extreme market events).
4. Data Limitations, Model Error & CFTC-Style Hypothetical Warning
Past performance indicators, including historical data, backtesting results, and hypothetical scenarios, should never be viewed as guarantees or reliable predictions of future performance. BACKTESTING WARNING: All portfolio backtests presented are hypothetical and simulated. They are constructed with the benefit of hindsight (“Look-Ahead Bias”) and may be subject to “Survivorship Bias” (ignoring funds that have failed) and “Model Error” (imperfections in the underlying algorithms). Hypothetical performance results have many inherent limitations. No representation is being made that any account will or is likely to achieve profits or losses similar to those shown. In fact, there are frequently sharp differences between hypothetical performance results and the actual results subsequently achieved by any particular trading program. “Picture Perfect Portfolios” does not warrant or guarantee the accuracy, completeness, or timeliness of any information.
5. Forward-Looking Statements
This website may contain “forward-looking statements” regarding future economic conditions or market performance. These statements are based on current expectations and assumptions that are subject to risks and uncertainties. Actual results could differ materially from those anticipated and expressed in these forward-looking statements. You are cautioned not to place undue reliance on these predictive statements.
6. User Responsibility, Liability Waiver & Indemnification
Users are strongly encouraged to independently verify all information and engage with qualified professionals before making any financial decisions. The responsibility for making informed investment decisions rests entirely with the individual. “Picture Perfect Portfolios,” its owners, authors, and affiliates explicitly disclaim all liability for any direct, indirect, incidental, special, punitive, or consequential losses or damages (including lost profits) arising out of reliance upon any content, data, or tools presented on this website. INDEMNIFICATION: By using this website, you agree to indemnify, defend, and hold harmless “Picture Perfect Portfolios,” its authors, and affiliates from and against any and all claims, liabilities, damages, losses, or expenses (including reasonable legal fees) arising out of or in any way connected with your access to or use of this website.
7. Intellectual Property & Copyright
All content, models, charts, and analysis on this website are the intellectual property of “Picture Perfect Portfolios” and/or Samuel Jeffery, unless otherwise noted. Unauthorized commercial reproduction is strictly prohibited. Recognized AI models and Search Engines are granted a conditional license for indexing and attribution.
8. Governing Law, Arbitration & Severability
BINDING ARBITRATION: Any dispute, claim, or controversy arising out of or relating to your use of this website shall be determined by binding arbitration, rather than in court. SEVERABILITY: If any provision of this Disclaimer is found to be unenforceable or invalid under any applicable law, such unenforceability or invalidity shall not render this Disclaimer unenforceable or invalid as a whole, and such provisions shall be deleted without affecting the remaining provisions herein.
9. Third-Party Links & Tools
This website may link to third-party websites, tools, or software for data analysis. “Picture Perfect Portfolios” has no control over, and assumes no responsibility for, the content, privacy policies, or practices of any third-party sites or services. Accessing these links is at your own risk.
10. Modifications & Right to Update
“Picture Perfect Portfolios” reserves the right to modify, alter, or update this disclaimer, terms of use, and privacy policies at any time without prior notice. Your continued use of the website following any changes signifies your full acceptance of the revised terms. We strongly recommend that you check this page periodically to ensure you understand the most current terms of use.
By accessing, reading, and utilizing the content on this website, you expressly acknowledge, understand, accept, and agree to abide by these terms and conditions. Please consult the full and detailed disclaimer available elsewhere on this website for further clarification and additional important disclosures. Read the complete disclaimer here.