Sometimes boring is better.
When it comes to investing strategies, what is new, shiny and exciting is what often draws in the masses.
2022 has been a harsh reality check for many FOMO-based investing strategies.
Narrative versus evidence.
It’s brutal out there at times, but there are solutions for investors seeking stability.
Minimum Volatility investing is one of them.
It’s a strategy that has historically been hundreds of basis points more defensive without relinquishing its offensive capabilities.

Huh?
Aren’t we as investors rewarded for taking risks?
Shouldn’t strategies that reduce volatility offer lower returns?
Nope.
That hasn’t been the case.
When comparing Min Vol investing strategies with their market cap weighted parent indexes (across the world) more often than not the min vol strategy outperforms and/or mirrors the returns of the MCW index.
And yet min vol equity strategies aren’t nearly as popular as value investing or dividend equity strategies.
With that in mind, we’ll be reviewing the most popular (from an AUM standpoint) Min Vol ETF: USMV
iShares MSCI USA Min Vol Factor ETF Review
We’ve got a lot to cover here so let’s get cracking!

USMV ETF Review | iShares MSCI USA Min Vol Factor ETF Review

Hey guys! Here is the part where I mention I’m a travel blogger, vlogger and content creator! This investing opinion blog post ETF Review is entirely for entertainment purposes only. There could be considerable errors in the data I gathered. This is not financial advice. Do your own due diligence and research. Consult with a financial advisor.
source: Morningstar Europe YouTube

iShares ETFs: Minimum Volatility Factor Funds
iShares is one of several Goliath ETF providers offering hundreds of different funds for investors to consider.
Hence, I’m not going to shine the spotlight upon them and instead we’ll key in on the minimum volatility products they offer investors.

Minimum Volatility ETFs
USMV ETF – iShares MSCI USA Min Vol Factor ETF
EEMV ETF – iShares MSCI Emerging Markets Min Vol Factor ETF
EFAV ETF – iShares MSCI EAFE Min Vol Factor ETF
ACWV ETF – iShares MSCI Global Min Vol Factor ETF
SMMV ETF – iShares MSCI USA Small-Cap Min Vol Factor ETF
ESMV ETF – iShares ESG MSCI USA Min Vol Factor ETF

The Case For Minimum Volatility Factor Investing
The case for Minimum Volatility investing is compelling to say the least.
Historical returns that can compete with (or exceed) market cap weighted strategies while shaving down 100s of basis points of risk.
A relative defensive juggernaut that doesn’t compromise on its offensive capabilities.
Providing stability when you need it the most – when markets are clearly down.
The invaluable MSCI Factor in Focus offers a clear explanation as to why Minimum Volatility strategies offer a potential premium:
- “One theory posits that investors underpay for low volatility stocks, viewing them as less rewarding, and overpay for high volatility stocks that are seen as long-shot opportunities for higher returns.
- A secondary academic explanation holds that investors can be overconfident in their ability to forecast the future, and that their opinions differ more for high volatility stocks, which have less certain outcomes, leading to higher volatility and lower returns.”
As a defensive factor it is clearly in a league of its own when it comes to managing volatility (standard deviation):
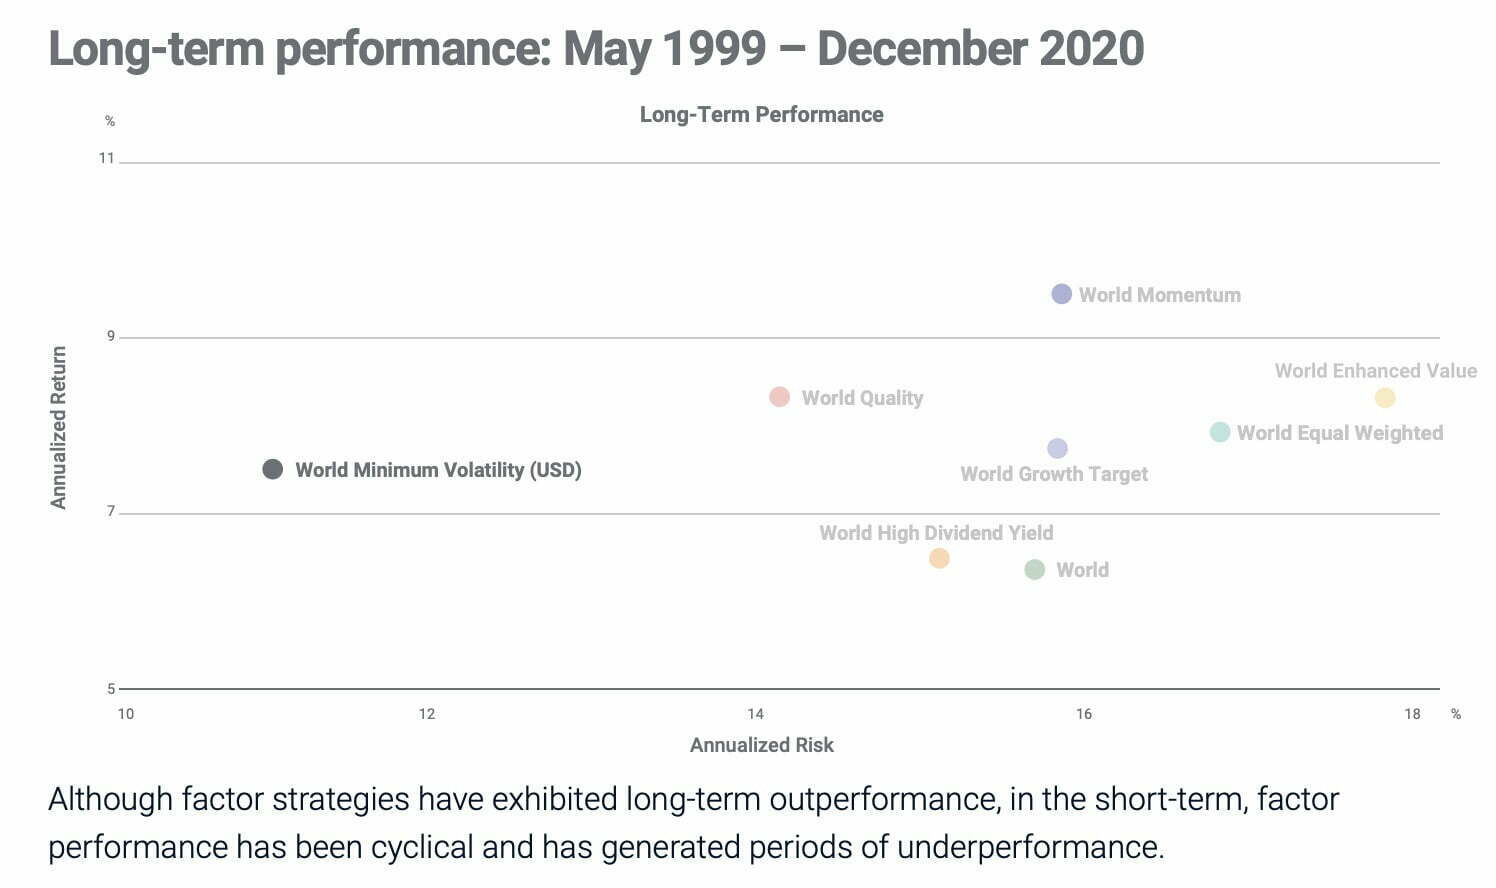
From a risk management perspective it has offered investors close to 500 basis points more volatility management versus its parent market cap weighted index!
Additionally, it has outperformed as well by 116 basis points!
“The MSCI World Minimum Volatility (USD) Index has historically generated excess returns over the long run with a 1.16% annual return over the MSCI World Index since 1999 as represented above.”
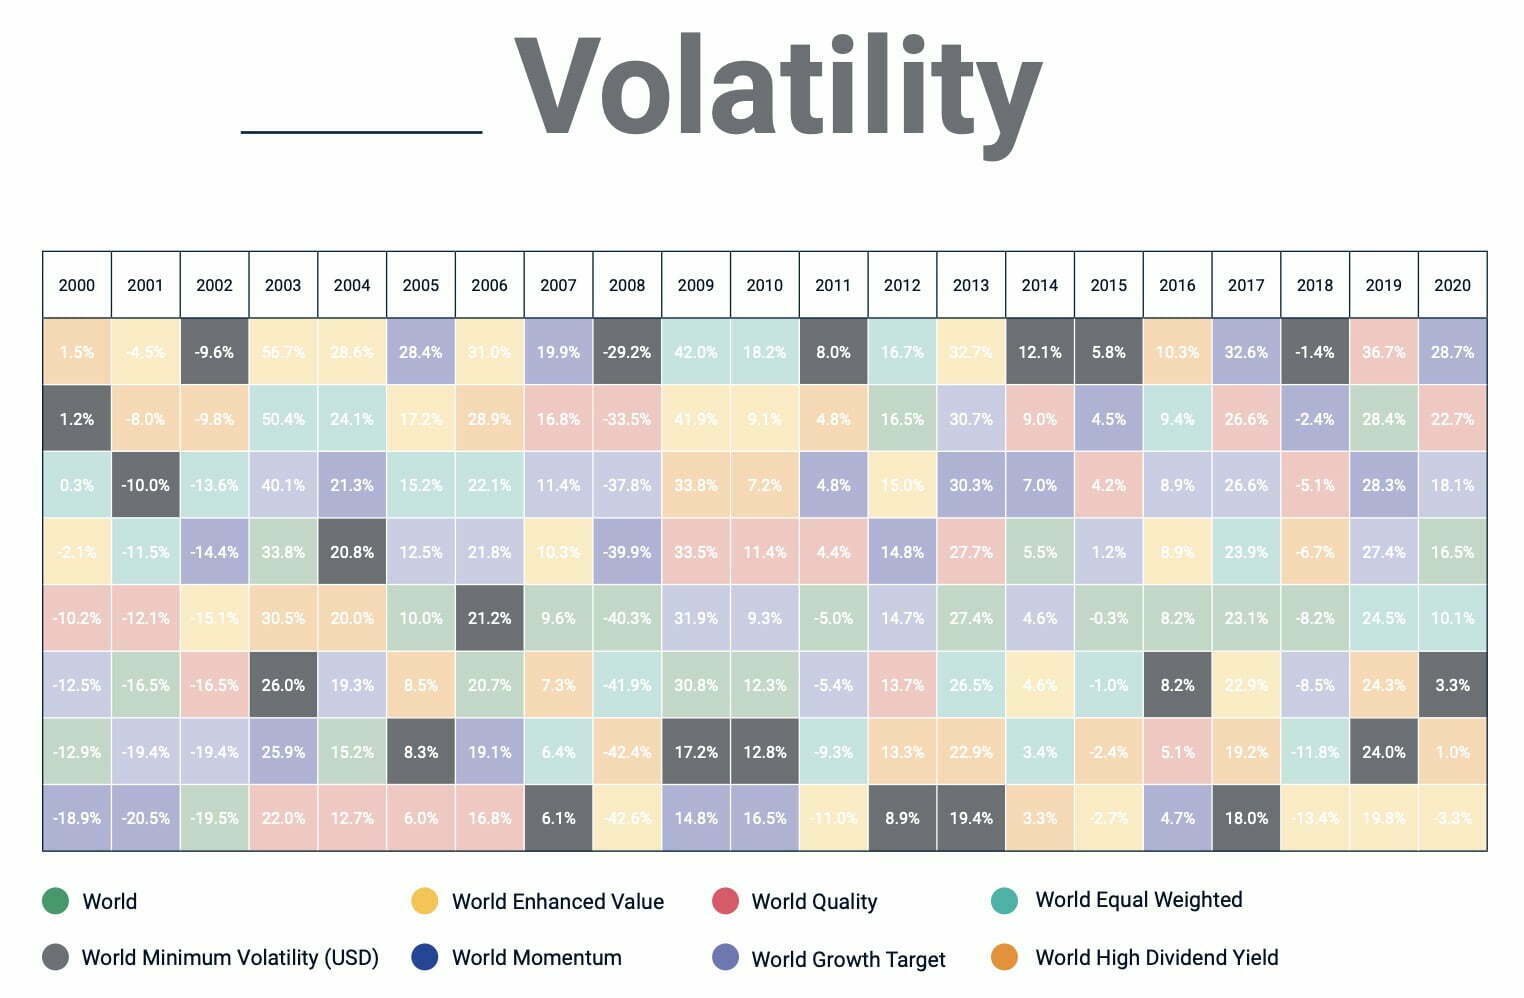
Feast your eyes upon the years of 2000, 2001, 2002, 2008, 2015 and 2018.
Notice any pattern?
For those six individual years that the market has been down minimum volatility has been in 1st (4 times), 2nd (once) or 3rd (once) place relative to eight other equity strategies including other factors and market cap weighted indexes.
It truly is the king of defensive equity optimization.

USMV ETF Overview, Holdings and Info
The investment case for “iShares MSCI USA Min Vol Factor ETF ” has been laid out succinctly by the folks over at iShares ETFs: (fund landing page)
The iShares MSCI USA Min Vol Factor ETF seeks to track the investment results of an index composed of U.S. equities that, in the aggregate, have lower volatility characteristics relative to the broader U.S. equity market.”
Why USMV?
1. Exposure to U.S. stocks with potentially less risk
2. Historically, USMV has declined less than the market during market downturns
3. Consider USMV for a core position in a portfolio
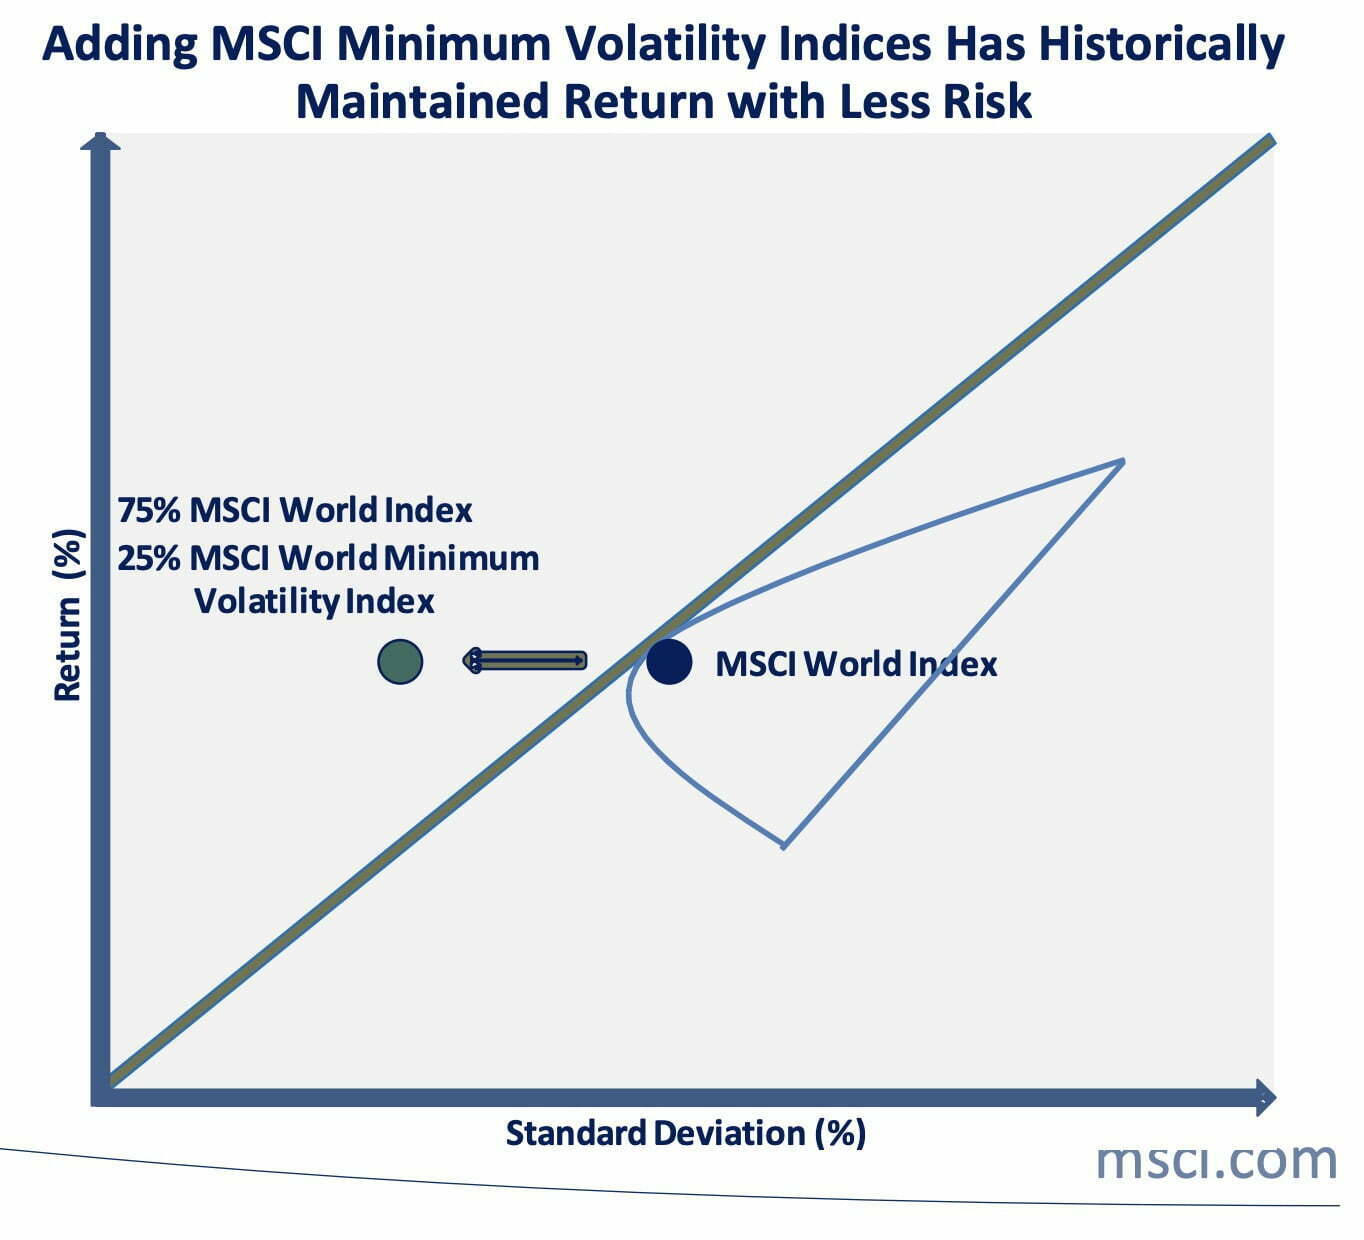
It’s crystal clear that USMV ETF positions itself as a US core fund that offers investors “less risk” than committing to a market cap weighted strategy.
As a defensive equity strategy it has the potential to significantly lower the overall standard deviation of a portfolio.
Let’s move on by consulting the index provider’s documents to find out its methodology for security selection.
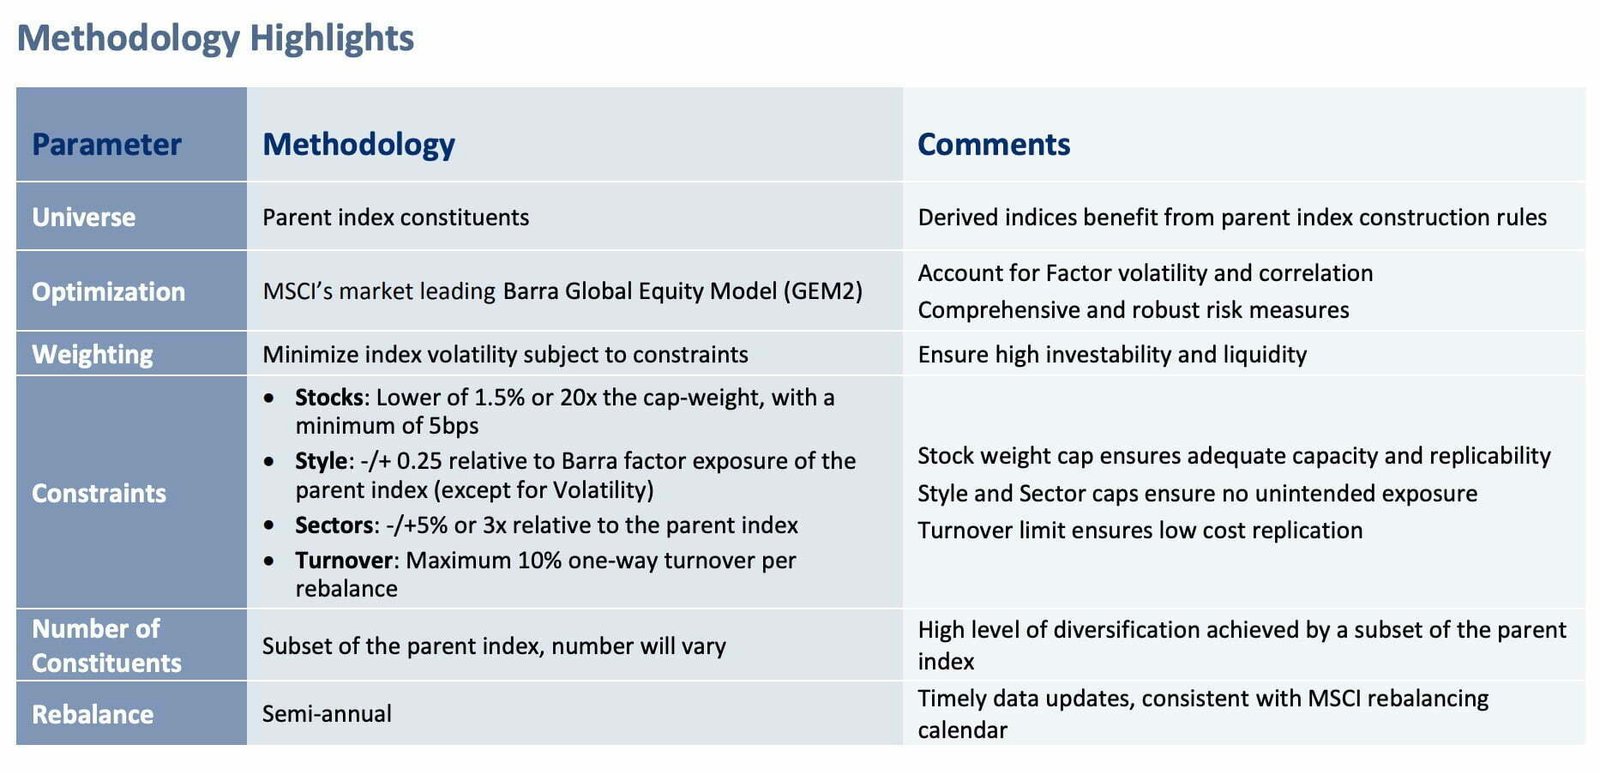

USMV ETF: Security Selection Process
“The MSCI USA Minimum Volatility (USD) Index aims to reflect the performance characteristics of a minimum variance strategy applied to the large and mid cap USA equity universe.
The index is calculated by optimizing the MSCI USA Index, its parent index, in USD for the lowest absolute risk (within a given set of constraints).
Historically, the index has shown lower beta and volatility characteristics relative to the MSCI USA Index.
- The MSCI Minimum Volatility (MV) Indices are uniquely designed to capture low volatility risk premia.
- The MSCI MV Indices are constructed to: (1) experience the lowest total risk, (2) avoid unintended bets
on countries, sectors and styles, and (3) provide superior risk-adjusted performance while maintaining
the investability and replicability features of the parent cap weighted indices. - MSCI MV Indices can be used for cost effective replication, benchmarking of low volatility managers,
and in combination with other MSCI Risk Premia Indices.”

Minimum Volatility Index Key Points
Here are the key points relating to how the Minimum Volatility index is constructed:
- Universe: Securities are chosen from the parent index (MSCI US Index) = 165 positions
- Minimum Variance Optimization: Aiming for the “least volatile portfolio” versus selecting the “least volatile stocks”
- Constraints: Tries to minimize tracking error with MSCI US parent index by imposing sector, style and cap-weight constraints
For those interested in learning more about the differences between minimum volatility and low volatility index construction I’ve covered it in this article: “Minimum Volatility Factor Investing | Why Low Volatility Is The Best Equity Strategy“.

iShares MSCI USA Min Vol Factor ETF: Principal Investment Strategy
To better understand the process of how the fund operates, let’s turn our attention towards the prospectus where I’ve summarized the key points at the very bottom (source: summary prospectus).
Principal Investment Strategies of the Fund
“The Fund seeks to track the investment results of the MSCI USA Minimum Volatility (USD) Index (the “Underlying Index”), which has been developed by MSCI Inc. (the “Index Provider” or “MSCI”) to measure the performance of large- and mid-capitalization equity securities listed on stock exchanges in the U.S. that, in the aggregate, have lower volatility relative to the large- and mid-cap U.S. equity market.
In constructing the Underlying Index, MSCI uses a rules-based methodology to select securities from the MSCI USA Index (the “Parent Index”), which is a capitalization-weighted index, and to determine the weightings of such securities in the Underlying Index.
Under the rules-based methodology, securities and weightings of the Underlying Index are determined based on pre-established parameters and discretionary factors are not relied on.
Generally, the rules-based methodology includes specified requirements for security eligibility, maximum and minimum weightings by security and, in some cases, by sector and country, as well as rules for special dividends and other distributions and the treatment of corporate events.
In order to determine weightings of securities within the Underlying Index, MSCI seeks to optimize the Parent Index such that the resulting portfolio exhibits the lowest absolute volatility, as measured by MSCI, while applying constraints based on turnover, established minimum and
maximum weightings of index constituents and sectors, as well as factor constraints (for example, liquidity and financial leverage) as measured by MSCI.
The Underlying Index includes largeand mid-capitalization companies and may change over time. As of July 31, 2022, a significant portion of the Underlying Index is represented by securities of companies in the healthcare and technology industries or sectors.
The components of the Underlying Index are likely to change over time.
BFA uses a “passive” or indexing approach to try to achieve the Fund’s investment objective.
Unlike many investment companies, the Fund does not try to “beat” the index it tracks and does not seek temporary defensive positions when markets decline or appear overvalued.
Indexing may eliminate the chance that the Fund will substantially outperform the Underlying Index but also may reduce some of the risks of active management, such as poor security selection.
Indexing seeks to achieve lower costs and better after-tax performance by aiming to keep portfolio turnover low in comparison to actively
managed investment companies.
BFA uses a representative sampling indexing strategy to manage the Fund.
“Representative sampling” is an indexing strategy that involves investing in a representative sample of securities that collectively has an investment profile similar to that of an applicable underlying index.
The securities selected are expected to have, in the aggregate, investment characteristics (based on factors such as market capitalization and industry weightings), fundamental characteristics (such as return variability and yield) and liquidity measures similar to those of an applicable underlying index.
The Fund may or may not hold all of the securities in the Underlying Index.
The Fund generally will invest at least 80% of its assets in the component securities of its Underlying Index and in investments that have economic characteristics that are substantially identical to the component securities of its Underlying Index (i.e., depositary receipts representing securities of the Underlying Index) and may invest up to 20% of its assets in certain futures, options and swap contracts, cash and
cash equivalents, including shares of money market funds advised by BFA or its affiliates, as well as in securities not included in the Underlying Index, but which BFA believes will help the Fund track the Underlying Index.
Cash and cash equivalent investments associated with a derivative position will be treated as part of that position for the purposes of calculating the percentage of investments included in the Underlying Index.
The Fund seeks to track the investment results of the Underlying Index before fees and expenses of the Fund.
The Fund may lend securities representing up to one-third of the value of the Fund’s total assets (including the value of any collateral received).
The Underlying Index and Parent Index are sponsored by MSCI, which is independent of the Fund and BFA.
The Index Provider determines the composition and relative weightings of the securities in the Underlying Index and Parent Index and publishes information regarding the market value of the Underlying Index and Parent Index.
Industry Concentration Policy. The Fund will concentrate its investments (i.e., hold 25% or more of its total assets) in a particular industry or group of industries to approximately the same extent that the Underlying Index is concentrated.
For purposes of this limitation, securities of the U.S. government (including its agencies and instrumentalities) and repurchase agreements collateralized by U.S. government securities are not considered to be issued by members of any industry.”
USMV ETF: Holdings
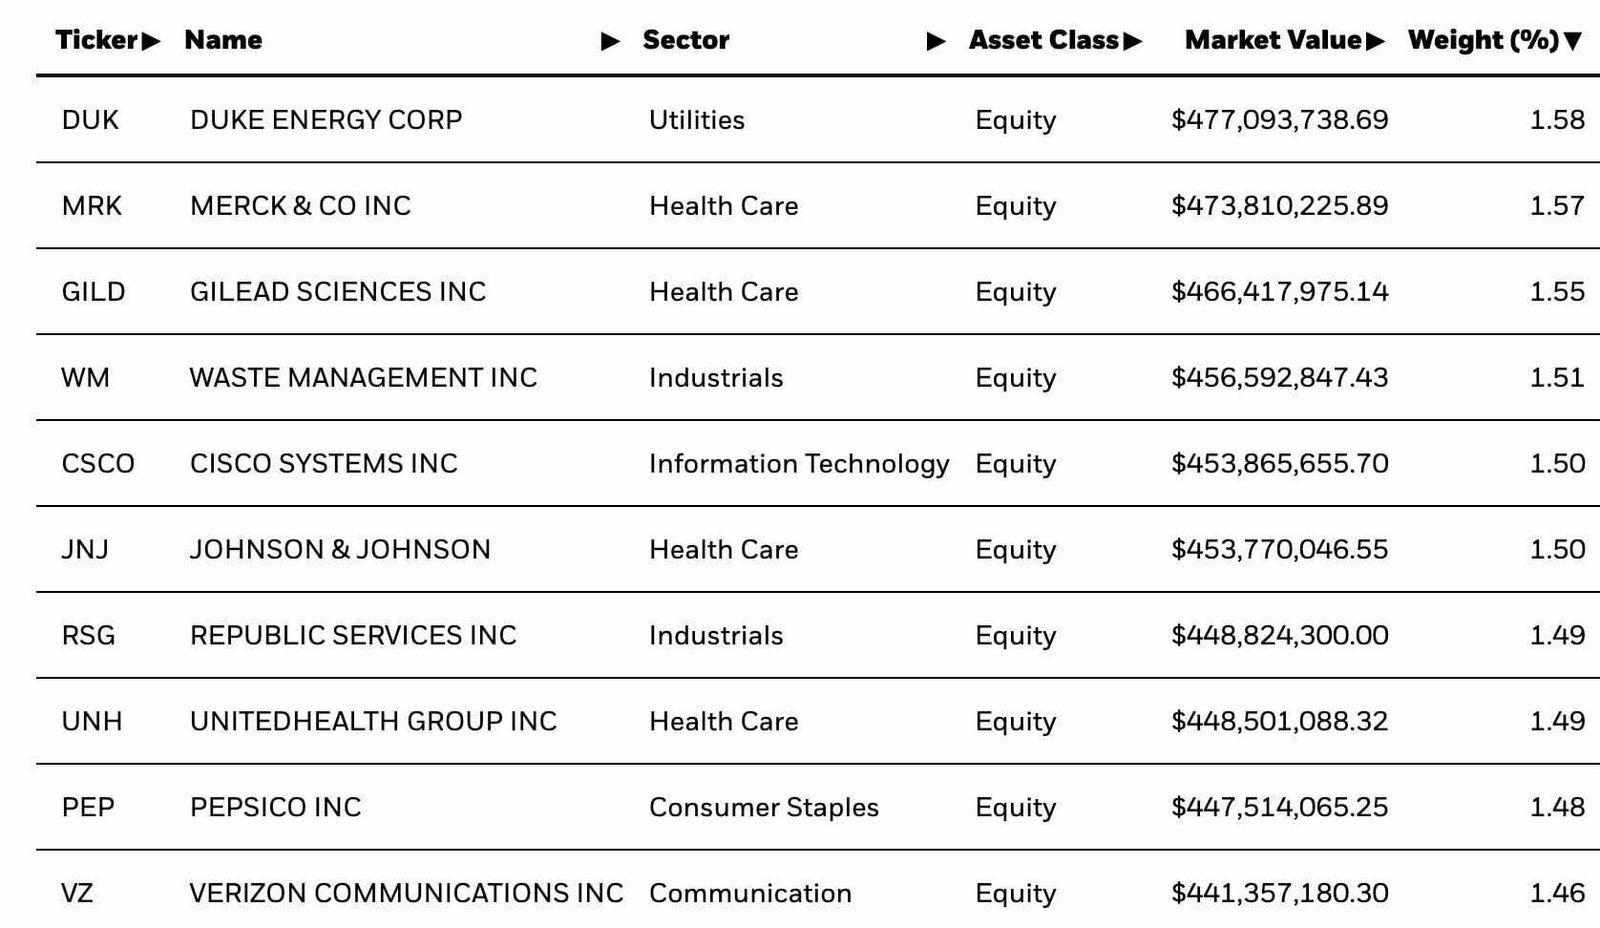
I always chuckle a little bit because with every min vol or low vol ETF I’ve ever examined, I’m more or less guaranteed to find a waste disposal company as a top 10 position.
And I’m not disappointed this time around.
We’ve got Waste Management Inc coming in at number 4!
Where’s Tesla?
Ah, that’s a bad joke.
You’ll notice familiar brands such as Pepsico Inc, Verizon Communications and Johnson & Johnson as part of the mix.
More importantly, you’ll notice the top position (Duke Energy Corp) only takes up 1.58% weight.
USMV ETF: Sector Exposure
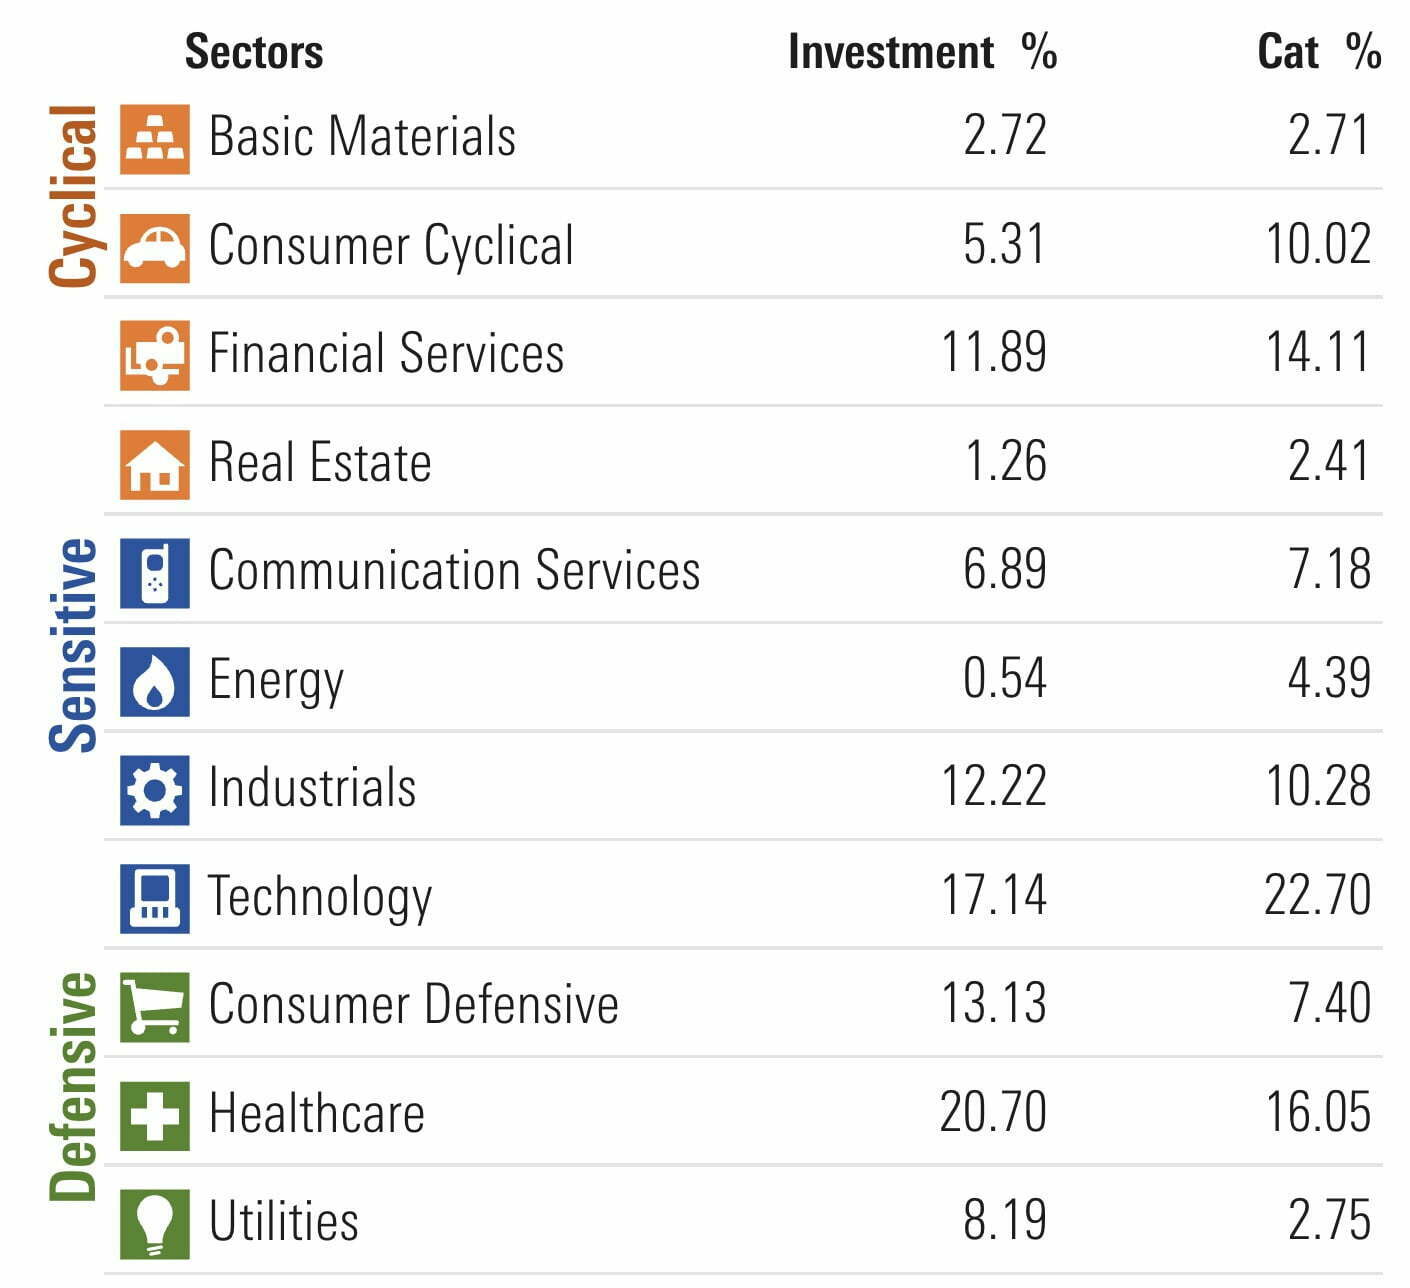
USMV Min Vol ETF makes solid on its promise not to deviate substantially sector-wise from its parent index.
Here we can see clearly that the fund doesn’t veer too far from its large cap category average.
Unsurprisingly, it is slightly overweight defensive sectors across the board: consumer defensive (13.13% vs 7.40%), healthcare (20.70% vs 16.05%) and utilities (8.19% s 2.75%).
It is underweight technology (17.14% vs 22.70%), energy (0.54% vs 4.39%) and consumer cyclical (5.31% vs 10.02%) in particular.
USMV ETF Info
Ticker: USMV
Net Expense Ratio: 0.15
AUM: 29.8 Billion
Inception: Oct 18, 2011
USMV ETF – Style Measures
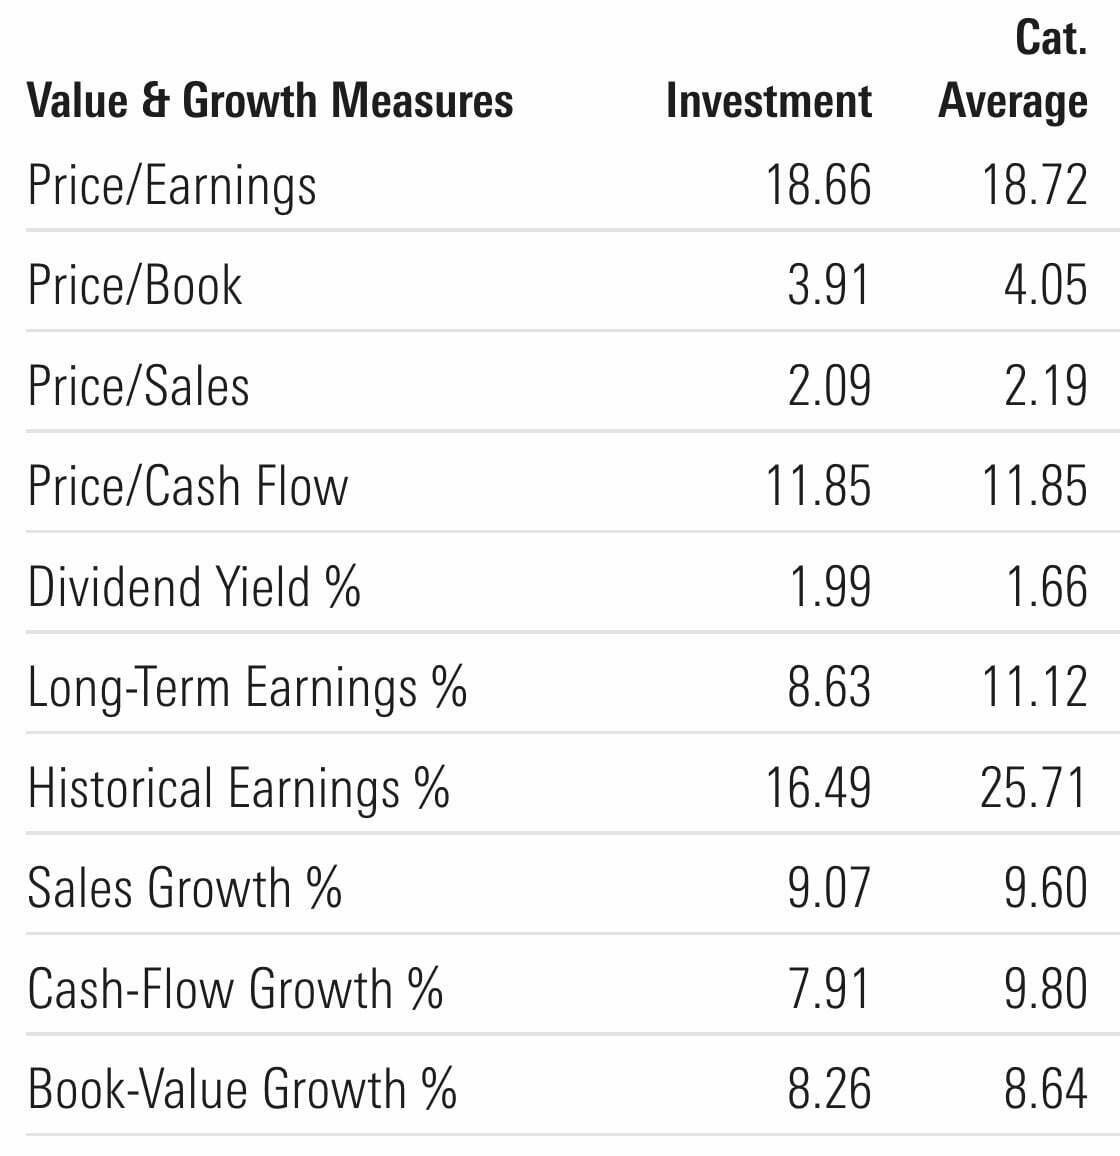
USMV Min Vol ETF doesn’t bedazzle with impressive value and growth measures.
In fact, it’s more or less on par with the category average (large cap blend) across the board.
Head to head we find it offers the following:
- Price/Earnings (18.66 vs 18.72)
- Price/Book (3.91 vs 4.05)
- Price/Sales (2.09 vs 2.19)
- Price/Cash Flow (11.85 vs 11.85)
- Dividend Yield % (1.99 vs 1.66)
- Long-Term Earnings % (8.63 vs 11.12)
- Historical Earnings % (16.49 vs 25.71)
- Sales Growth % (9.07 vs 9.60)
- Cash-Flow Growth % (7.91 vs 9.80)
- Book-Value Growth % (8.26 vs 8.64).
The Min Vol Factor ETF only squeaks out marginal victories with regards to relative better price/earnings, price/book and price/sales (where lower is better) and dividend yield (where higher is better).
USMV ETF – Stock Style
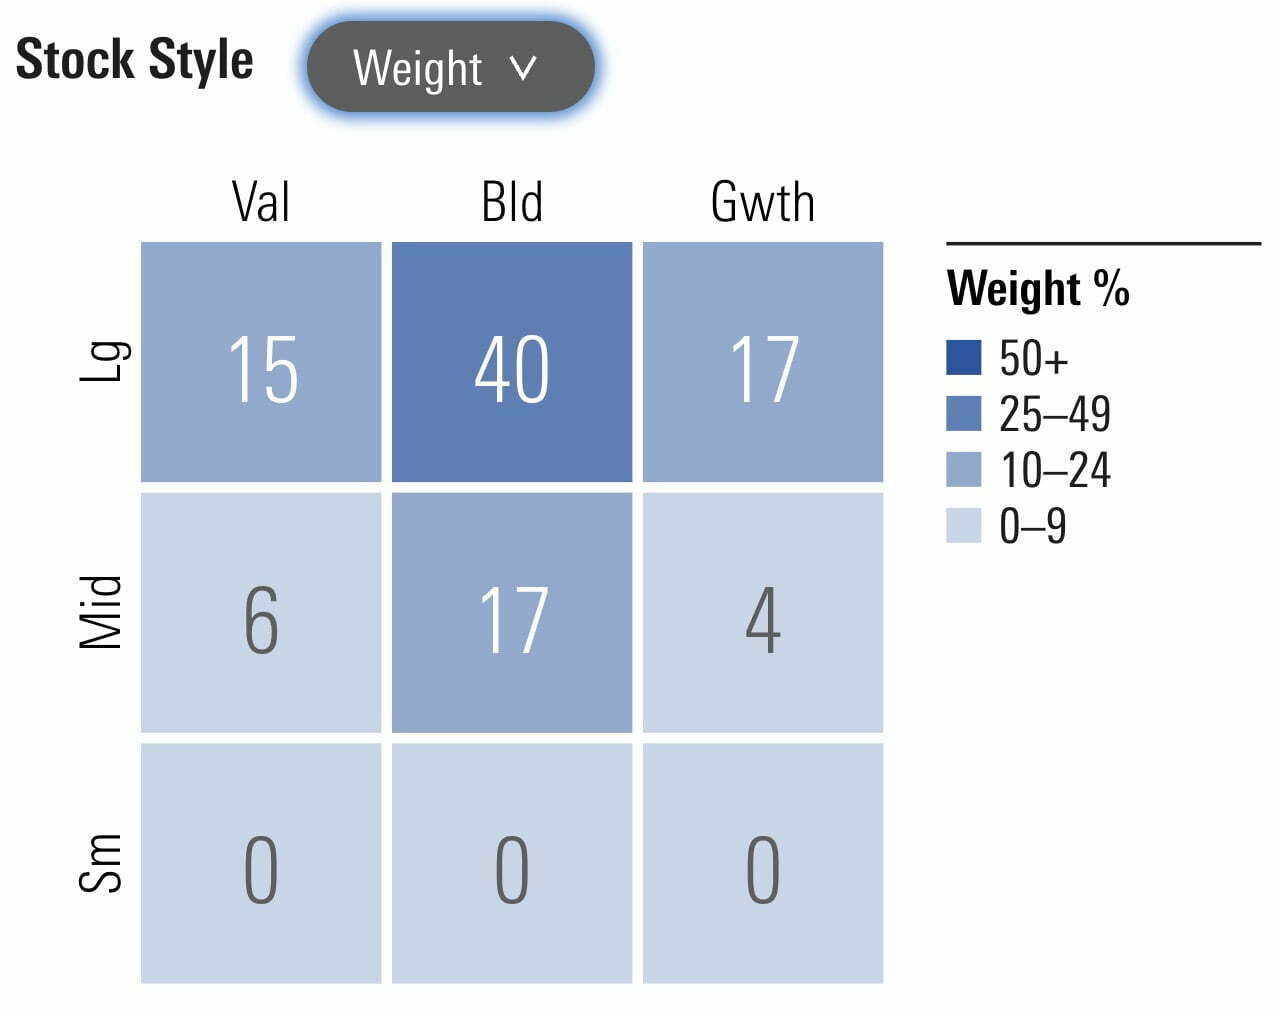
You’ll be hard pressed to find a more blend-tastic US Large Cap fund than USMV ETF.
It’s as Blendy McBlenderson as they come.
The fund has 57% of its resources committed to Blend, 21% towards Value and 21% aimed at Growth.
It’s top heavy with 72% large cap and 27% mid cap allocations.
I don’t think I’ve encountered a fund that is more down the middle than this one.
It’s neither growth nor value.
It’s firmly smack dab in the middle.
USMV ETF – Factor Profile
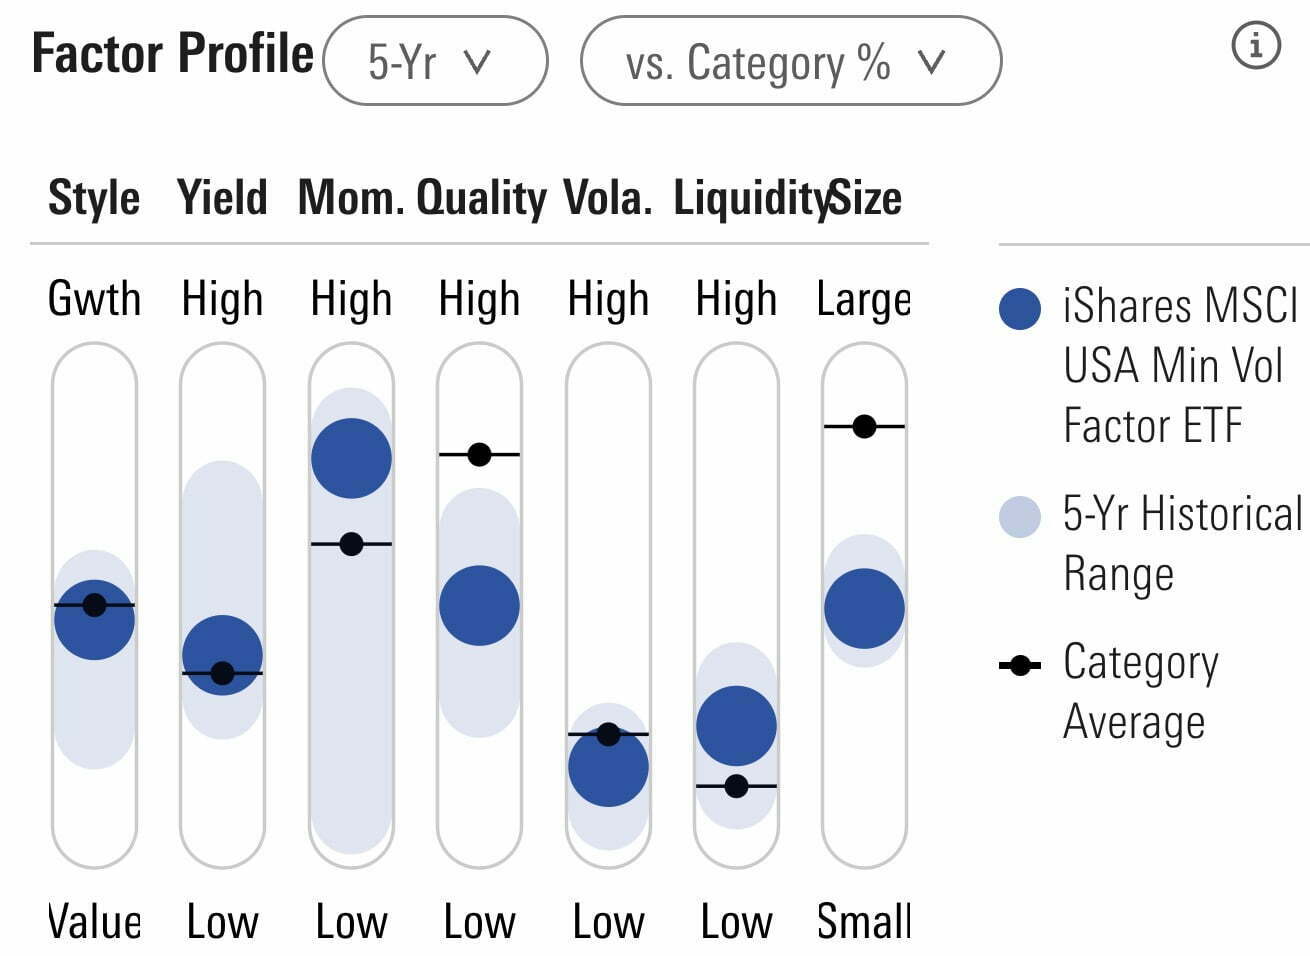
iShares MSCI USA Min Vol Factor ETF pulls hard on the low volatility lever as would be expected.
Additionally, it currently offers investors decent momentum factor exposure.
However, the rest of its factor profile is nothing spectacular or noteworthy.

USMV ETF Performance
Let’s explore how USMV has performed since its inception.
USMV Long-Term Performance: Offensive and Defensive Wizard
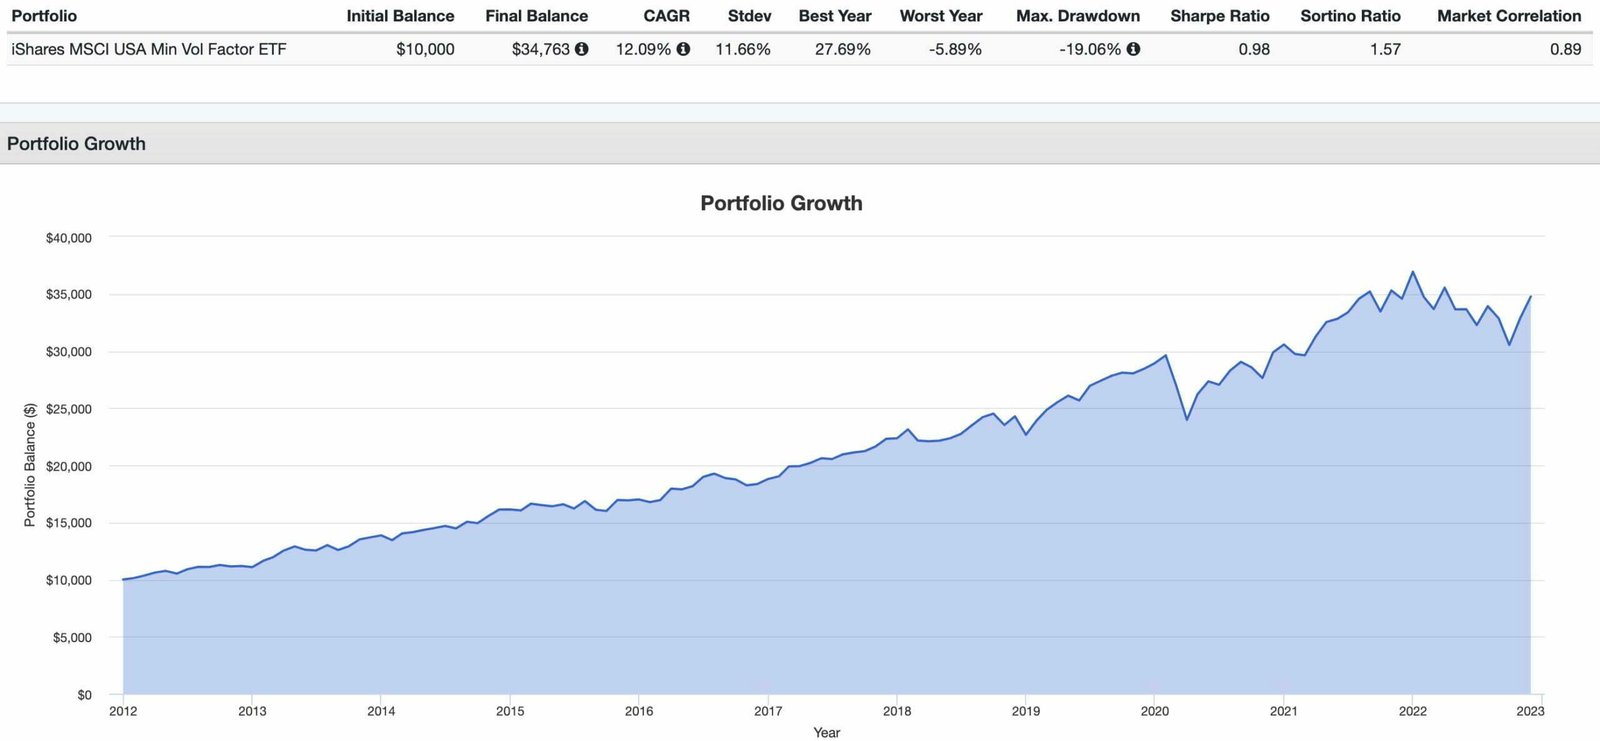
USMV Min Vol Factor ETF has offered investors impressive performance and outstanding volatility management since inception.
It’s indeed rare to find an equity fund that has offered investors higher Returns (CAGR: 12.09%) versus Risk (Stdev: 11.66%).
Offensive and defensive prowess all around.
With a worst year of just -5.89%, the Min Vol ETF has navigated the turbulent waters of the 2020s in a manner that puts other equity funds to shame.
To round things off USMV ETF has featured a high Sharpe Ratio of 0.98 and Sortino Ratio of 1.57 with 0.89 Market Correlation.
Let’s zoom in to explore a few years in particular.

USMV 2022 Performance: Results vs S&P 500
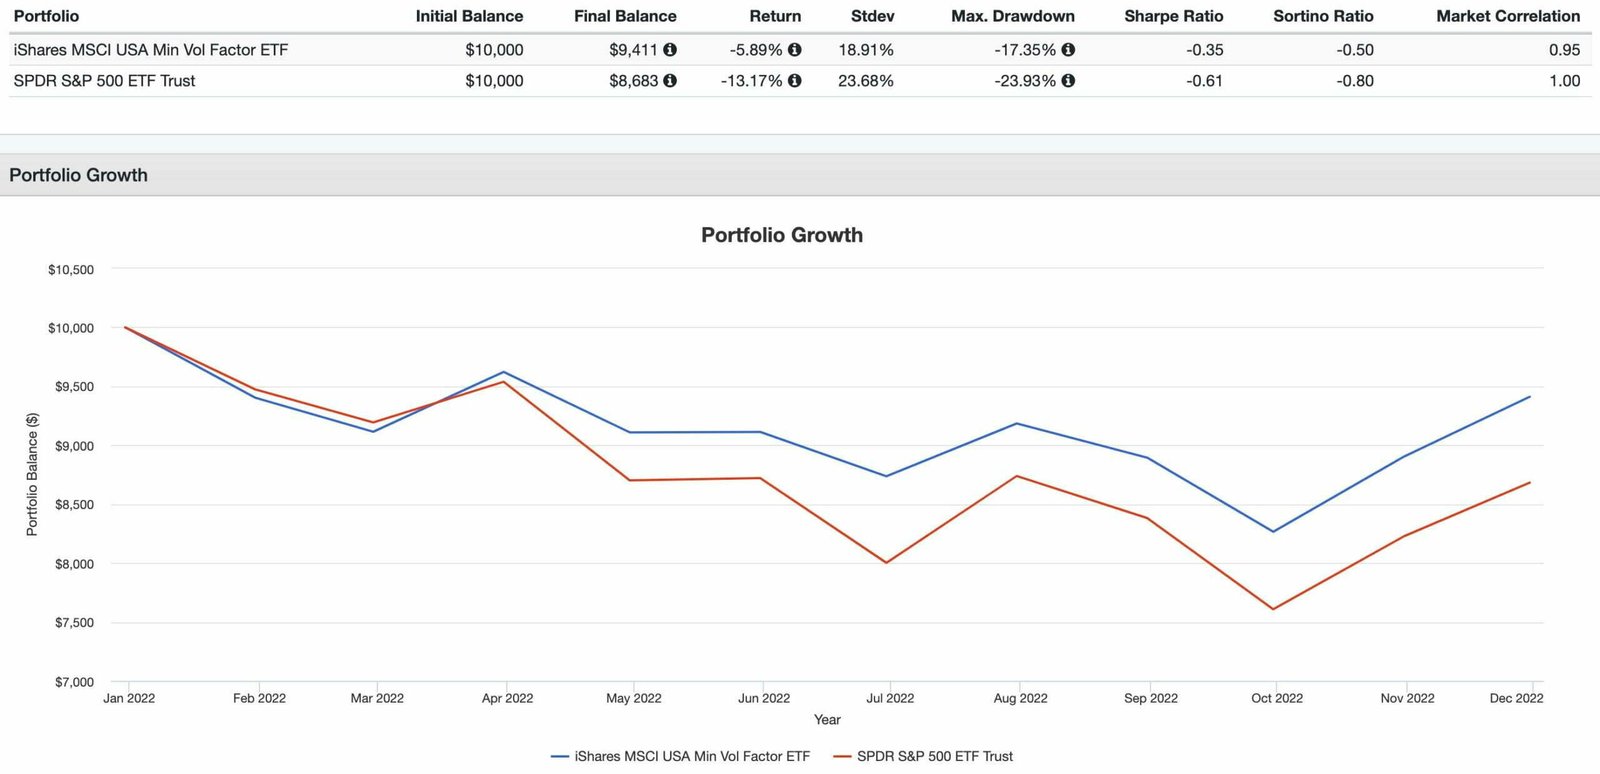
USMV Minimum Volatility Factor ETF has conspired to keep carnage at bay in 2022 relative to the S&P 500.
As investors we’re more often than not thrilled to celebrate clear outperformance during record breaking markets yet we don’t typically apply the same standards of excess exuberance for relative wins during times of turmoil.
In other words, Happy Less Relative Carnage Day!
I don’t think we’ll soon be having a holiday named after that.
Well, when it comes to minimum volatility factor investing strategies, this is typically the time to celebrate the most.
After all, it is a defensive equity factor strategy known for reliably battening down the hatches whilst the storm approaches.
Here are the results of USMV ETF vs SPY ETF:
CAGR: -5.89% vs -13.17%
Stdev: 18.91% vs 23.68%
Max Drawdown: -17.35% vs -23.93%
Yet, it isn’t a free lunch all of the time for minimum volatility investors as we can clearly see in 2020.
USMV 2020 Performance: Results vs S&P 500
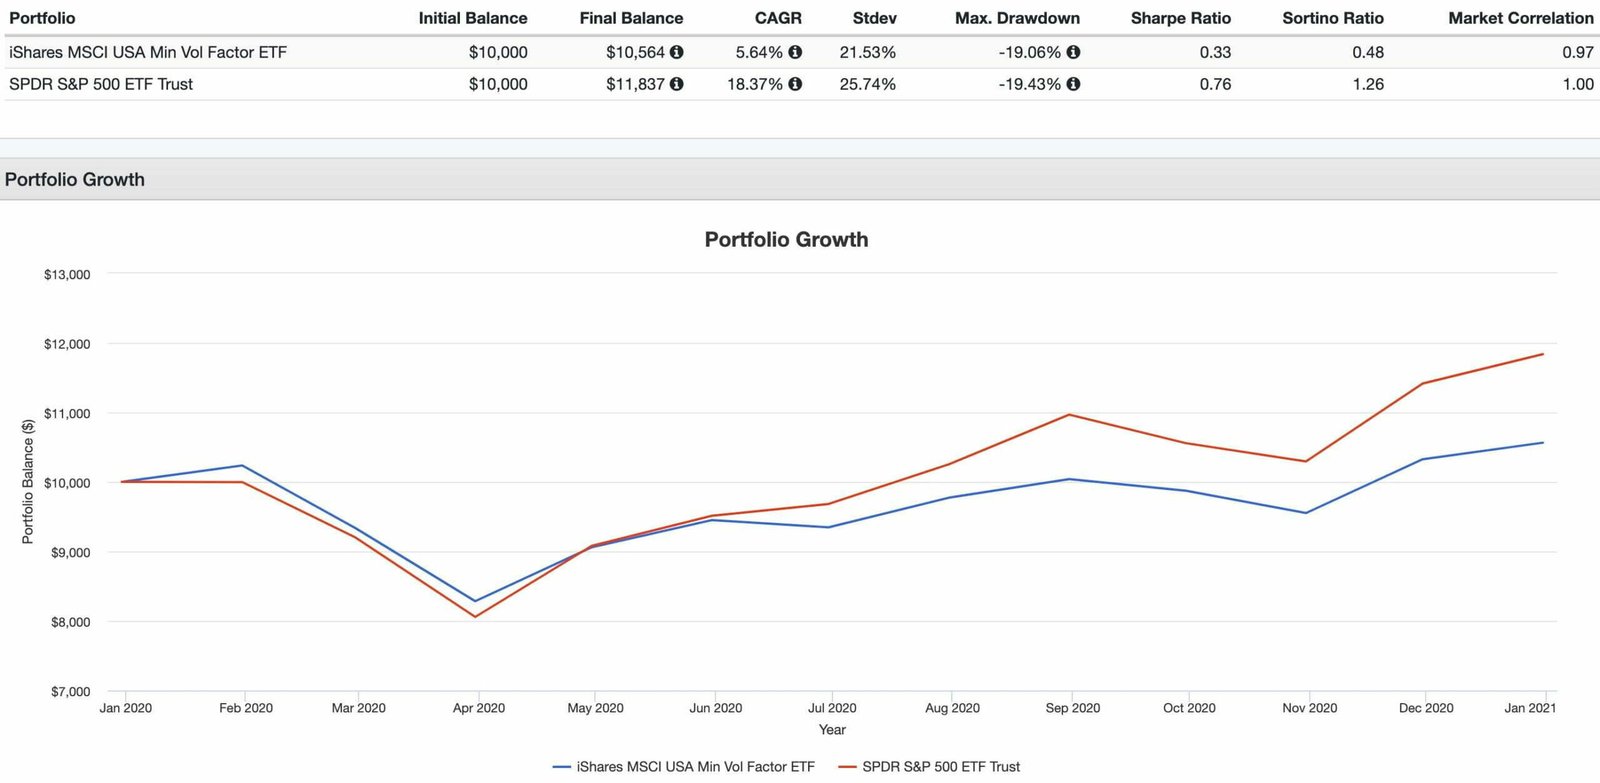
In 2020 investors committed to Min Vol ETF strategies would have had to suck it up buttercup.
Aside from better handling the March drawdown, it was overall a tough year for USMV versus SPY ETF.
That’s the clear challenge of being a factor investor.
The willingness to endure inevitable periods of underperformance when the strategy you’re pursuing is in the shade and not the spotlight.

UMSV ETF Pros and Cons
Let’s move on and examine the potential pros and cons of USMV ETF.
USMV Pros
- Solid returns and even more impressive risk management for USMV ETF since its inception
- The capacity to perform at its relative best when you likely need it the most (during times of market turmoil)
- The most defensive equity factor strategy by a country mile offering hundreds of basis points of relative standard deviation outperformance
- The capacity to provide equal to (or possibly even greater than) returns versus market cap weighted strategies
- A great barbell equity partner for strategies such as value or momentum or to pair with quality and/or yield to form a defensive powerhouse
- The perpetually unsexy narrative of lower highs and lower lows while allocating more often to waste management types of companies versus the latest and greatest in technology
- If combined with uncorrelated asset classes and alternative investment strategies the potential for a portfolio where returns exceed risk is possible
- A low fee (0.15) that is in a league of its own for factor based strategies while knocking on the door of ultra low cost market cap weighted strategies
USMV Cons
- Will inevitably underperform during red hot markets where FOMO most often manifests itself the greatest
- Has the potential to become an overcrowded factor strategy especially after long-term challenging market conditions (ex: 2000s)

USMV Potential Model Portfolio Ideas
These asset allocation ideas and model portfolios presented herein are purely for entertainment purposes only. This is NOT investment advice. These models are hypothetical and are intended to provide general information about potential ways to organize a portfolio based on theoretical scenarios and assumptions. They do not take into account the investment objectives, financial situation/goals, risk tolerance and/or specific needs of any particular individual.
Let’s explore how USMV ETF potentially integrates into a portfolio at large.
USMV ETF + Friends vs 60/40 Portfolio VBIAX
For investors committed to a defensive equity strategy the following portfolio might make sense:
50% USMV ETF
30% DBMF ETF
10% BTAL ETF
10% TYA
Here we’re combining a minimum volatility equity strategy with managed futures, market neutral and capital efficient treasuries to form an overall strategically diversified portfolio.
For those uncomfortable with home country bias I’d suggest actually swapping out USMV ETF for ACWV ETF (to go global) or to add EEMV ETF (Emerging Markets) and EFAV ETF (EAFE International Markets) according to taste.
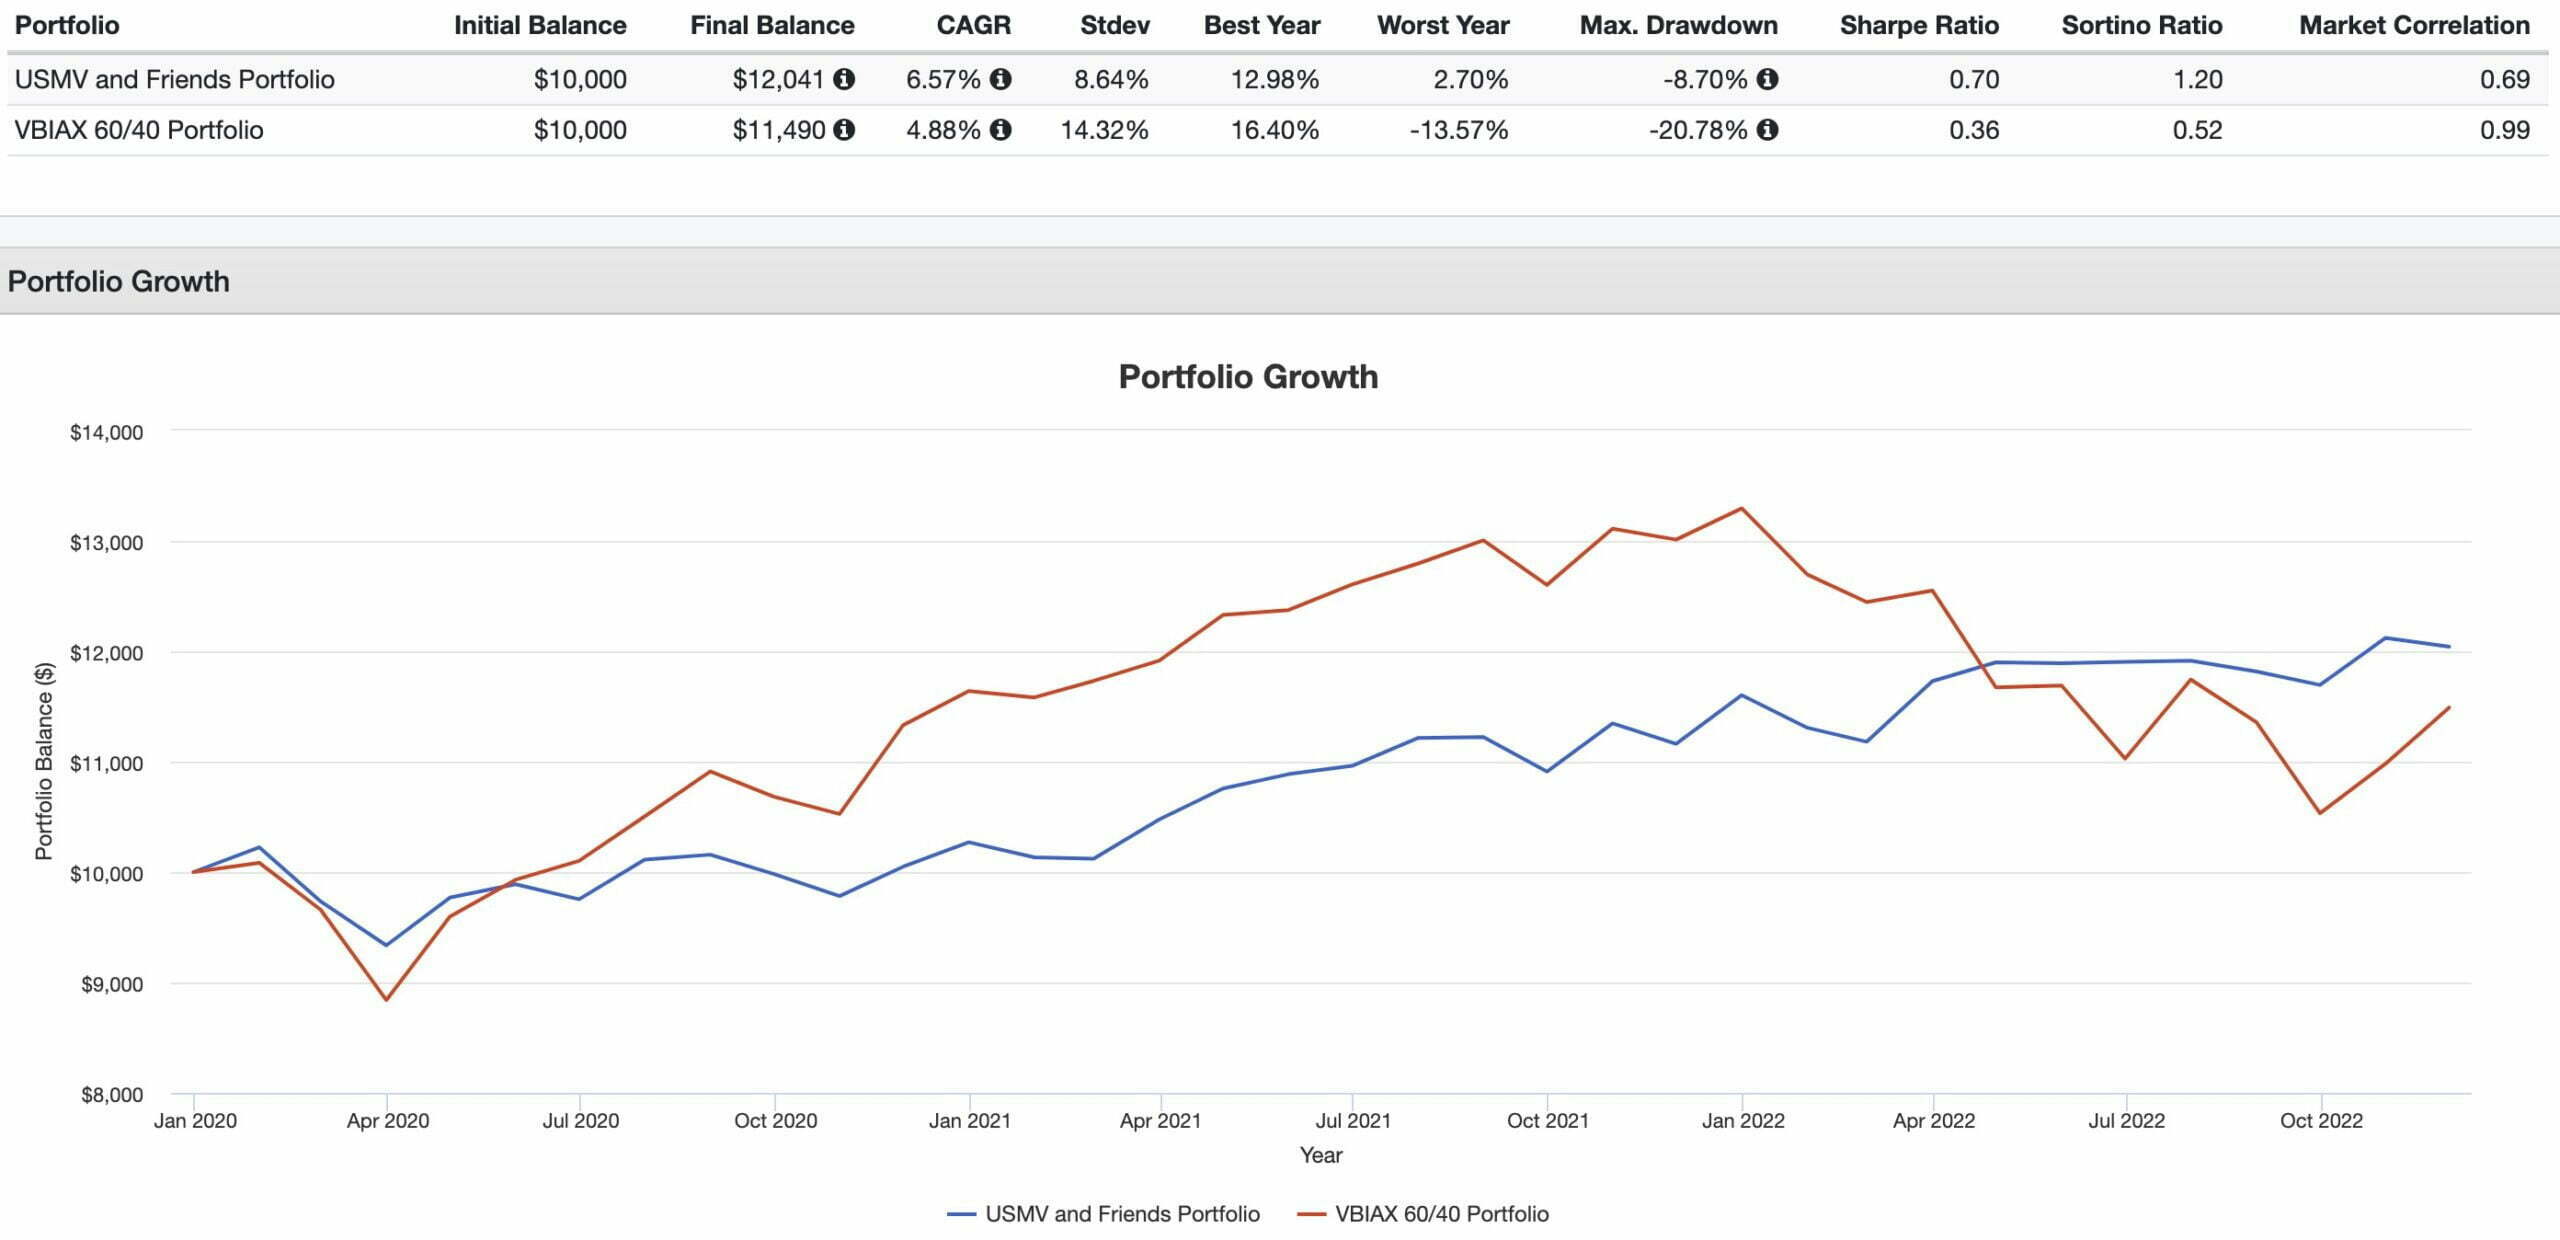
Here our USMV ETF and Friends Portfolio has clearly outperformed and defended better versus 60/40 VBIAX ETF Portfolio.
To roll the clock back a few years we swapped out capital efficient treasury TYA ETF for AGG ETF.
We’ll gladly take a lower Best Year to clearly outshine with regards to Maximum Drawdown and Worst Year performance.
What Others Have To Say About USMV ETF
Now that we’ve covered a few different portfolio solutions let’s see what others have to say about the fund for those who prefer video format.
source: Bloomberg Quicktake Originals YouTube
source: ETFs YouTube
source: 재테크 YouTube
Nomadic Samuel Final Thoughts
I’ve made it no secret on this blog that I’m a huge fan of minimum volatility factor investing strategies.
In fact, my Picture Perfect Portfolio is the perfect example of this.
The so-called “boring factor” tames the equity sleeve of your portfolio.
This affords investors the opportunity to take risks elsewhere or to go the opposite direction of trying to build a defensive powerhouse portfolio.
I’m still baffled as to why more investors aren’t fans of minimum volatility.
It seems like magic that min vol strategies can offer returns equal to (or greater than) market cap weighted strategies while being hundreds of basis points more defensive.
I’ll take that free lunch any day of the week.
But at this point in the ETF review I’m more interested in what you’ve got to say.
Are you a fan of minimum volatility investing or other equity factor strategies?
Please let me know in the comments below.
That’s all I’ve got.
Ciao for now.
Important Information
Investment Disclaimer: The content provided here is for informational purposes only and does not constitute financial, investment, tax or professional advice. Investments carry risks and are not guaranteed; errors in data may occur. Past performance, including backtest results, does not guarantee future outcomes. Please note that indexes are benchmarks and not directly investable. All examples are purely hypothetical. Do your own due diligence. You should conduct your own research and consult a professional advisor before making investment decisions.
“Picture Perfect Portfolios” does not endorse or guarantee the accuracy of the information in this post and is not responsible for any financial losses or damages incurred from relying on this information. Investing involves the risk of loss and is not suitable for all investors. When it comes to capital efficiency, using leverage (or leveraged products) in investing amplifies both potential gains and losses, making it possible to lose more than your initial investment. It involves higher risk and costs, including possible margin calls and interest expenses, which can adversely affect your financial condition. The views and opinions expressed in this post are solely those of the author and do not necessarily reflect the official policy or position of anyone else. You can read my complete disclaimer here.

