Multi-strategy expanded canvas portfolio solutions are the primary bread and butter focus of Picture Perfect Portfolios and with that in mind we turn our attention towards Newfound Return Stacked® Risk Managed U.S. Stocks & Bonds (NFDIX) in this mutual fund review.
All of the credit for this Sunday morning writing session goes towards online friend and fellow DIY investor HML Compounder who suggested I review this fund.
So instead of enjoying a leisurely Sunday, I’ve got HML Compounder (who you should follow on Twitter) to thank/blame for having my eyes glued to a computer monitor while my fingers hen-peck away at the keyboard.
I have to admit my overall knowledge of the US Mutual fund landscape is rather limited due to one extreme bias.
I’m Canadian.
Hence, I’m not able to purchase US Mutual funds but I’m fortunate to have unlimited access to US listed ETFs and closed-end funds.
Thus, aside from Standpoint Multi-Asset Fund this is only the second at bat I’ve had with regards to reviewing a US listed mutual fund.
We’ll later pop the hood of this fund and check out all of the goodies inside but for now I’ll tease you by saying this is the only expanded canvas equity and treasury combination fund with exposure to factor equity, trend following and options based strategies that I’m aware of.
Given its unique combination of ingredients let’s explore what this fund offers in detail and its potential application in portfolios at large.

Hey guys! Here is the part where I mention I’m a travel vlogger! This investing opinion blog post ETF Review is entirely for entertainment purposes only. There could be considerable errors in the data I gathered. This is not financial advice. Do your own due diligence and research. Consult with a financial advisor.
Newfound Research

Newfound Research is a quantitative investment and research firm based in Wellesley, MA that offers return stacked models, funds, research papers and a podcast.
Late last year when I began a DIY journey deep dive into the potential applications of leverage (to create portfolios that drive impressive returns while equally focusing on managing risk) I became aware of Newfound Research’s founder Corey Hoffstein.
Since then I’ve consumed many hours of content Corey creates including his Flirting with Models podcast and the Pirates of Finance weekly Friday show with Mutiny Funds co-host Jason Buck (co-creator of the Cockroach Portfolio).
Even though I’ve greatly benefited from the content Corey shares publicly it would be a disservice for me to glowingly review his fund just because of that.
Diversification may be a free lunch for investors but it’s not going to be dished out freely here in this review.
The fund itself will have to earn that distinction or not.

Return Stacked® Risk Managed U.S. Stocks & Bonds (NFDIX Mutual Fund) Holdings & Info
Some folks enjoy sundaes on the weekend with triple scoops of ice cream, hot fudge, nuts and whipped cream; yet I’m hunkered down in front of my computer sans anything delicious popping open the hood of funds.
So what have we got here inside of Newfound Return Stacked® Risk Managed U.S. Stocks & Bonds fund?
In a nutshell, NFDIX mutual fund offers investors an expanded canvas default 75/75 split of US large cap equities with a strong multi-factor tilt in tandem with US treasury (with the ability to adapt based on systematic trend) and a dual layer of downside and upside convexity options strategies in the form of put and calls.

NFDIX Top Holdings
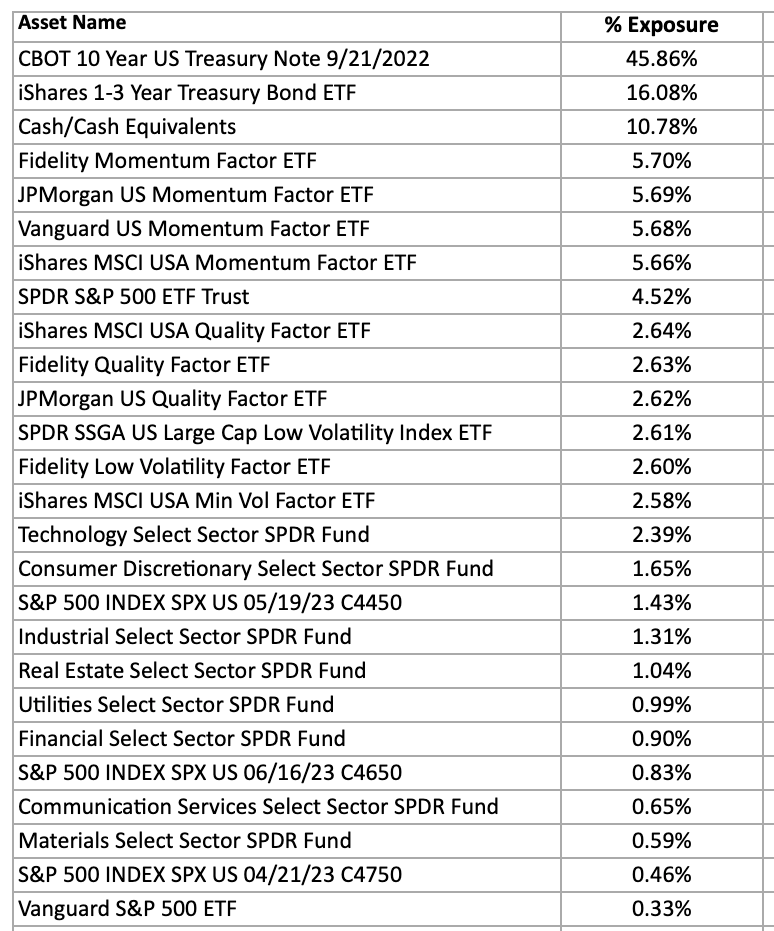
Here is list for the top holdings for Newfound Return Stacked® Risk Managed U.S. Stocks & Bonds fund.
And for those dorks who want to see it all (and I know you exist out there) enjoy your finger workout scrolling downwards while scanning through the following:

NFDIX Complete Holdings
| Asset Name | % Exposure |
| CBOT 10 Year US Treasury Note 9/21/2022 | 45.86% |
| iShares 1-3 Year Treasury Bond ETF | 16.08% |
| Cash/Cash Equivalents | 10.78% |
| Fidelity Momentum Factor ETF | 5.70% |
| JPMorgan US Momentum Factor ETF | 5.69% |
| Vanguard US Momentum Factor ETF | 5.68% |
| iShares MSCI USA Momentum Factor ETF | 5.66% |
| SPDR S&P 500 ETF Trust | 4.52% |
| iShares MSCI USA Quality Factor ETF | 2.64% |
| Fidelity Quality Factor ETF | 2.63% |
| JPMorgan US Quality Factor ETF | 2.62% |
| SPDR SSGA US Large Cap Low Volatility Index ETF | 2.61% |
| Fidelity Low Volatility Factor ETF | 2.60% |
| iShares MSCI USA Min Vol Factor ETF | 2.58% |
| Technology Select Sector SPDR Fund | 2.39% |
| Consumer Discretionary Select Sector SPDR Fund | 1.65% |
| S&P 500 INDEX SPX US 05/19/23 C4450 | 1.43% |
| Industrial Select Sector SPDR Fund | 1.31% |
| Real Estate Select Sector SPDR Fund | 1.04% |
| Utilities Select Sector SPDR Fund | 0.99% |
| Financial Select Sector SPDR Fund | 0.90% |
| S&P 500 INDEX SPX US 06/16/23 C4650 | 0.83% |
| Communication Services Select Sector SPDR Fund | 0.65% |
| Materials Select Sector SPDR Fund | 0.59% |
| S&P 500 INDEX SPX US 04/21/23 C4750 | 0.46% |
| Vanguard S&P 500 ETF | 0.33% |
| Seagen Inc. | 0.23% |
| S&P 500 INDEX SPX US 04/21/23 P3650 | 0.23% |
| CoStar Group Inc. | 0.21% |
| Brown-Forman Corporation | 0.21% |
| Waters Corporation | 0.21% |
| Cintas Corporation | 0.21% |
| Monster Beverage Corporation | 0.20% |
| Analog Devices Inc. | 0.20% |
| Broadridge Financial Solutions Inc. | 0.20% |
| Danaher Corporation | 0.20% |
| Texas Instruments Inc. | 0.20% |
| HEICO Corporation | 0.20% |
| Constellation Brands Inc. | 0.20% |
| Veeva Systems Inc. | 0.20% |
| Chipotle Mexican Grill Inc. | 0.20% |
| Linde plc | 0.20% |
| Copart Inc. | 0.19% |
| Agilent Technologies Inc. | 0.19% |
| Moody’s Corporation | 0.19% |
| Air Products and Chemicals Inc. | 0.19% |
| ResMed Inc. | 0.19% |
| Yum! Brands Inc. | 0.19% |
| Electronic Arts Inc. | 0.19% |
| Waste Connections Inc. | 0.19% |
| Roper Technologies Inc. | 0.19% |
| S&P Global Inc. | 0.19% |
| Boston Scientific Corporation | 0.19% |
| Illinois Tool Works Inc. | 0.19% |
| Kimberly-Clark Corporation | 0.19% |
| Mastercard Inc. | 0.19% |
| 3M Company | 0.19% |
| STERIS plc | 0.19% |
| Visa Inc. | 0.18% |
| CSX Corporation | 0.18% |
| Becton Dickinson and Company | 0.18% |
| AMETEK Inc. | 0.18% |
| ANSYS Inc. | 0.18% |
| Monolithic Power Systems Inc. | 0.18% |
| Abbott Laboratories | 0.17% |
| Cadence Design Systems Inc. | 0.17% |
| Medtronic plc | 0.17% |
| Consumer Staples Select Sector SPDR Fund | 0.17% |
| Intuitive Surgical Inc. | 0.17% |
| Stryker Corporation | 0.17% |
| NIKE Inc. | 0.17% |
| Amgen Inc. | 0.17% |
| Amphenol Corporation | 0.17% |
| Akamai Technologies Inc. | 0.17% |
| Keysight Technologies Inc. | 0.17% |
| S&P 500 INDEX SPX US 01/20/23 P3750 | 0.17% |
| Adobe Inc. | 0.17% |
| Thermo Fisher Scientific Inc. | 0.16% |
| FactSet Research Systems Inc. | 0.16% |
| Johnson & Johnson | 0.16% |
| Philip Morris International Inc. | 0.16% |
| Waste Management Inc. | 0.16% |
| Old Dominion Freight Line Inc. | 0.16% |
| McDonald’s Corporation | 0.16% |
| Alphabet Inc. | 0.16% |
| IDEXX Laboratories Inc. | 0.16% |
| Garmin Ltd. | 0.16% |
| Colgate-Palmolive Company | 0.16% |
| Mondelez International Inc. | 0.16% |
| Verisk Analytics Inc. | 0.15% |
| Mettler-Toledo International Inc. | 0.15% |
| MSCI Inc. | 0.15% |
| S&P 500 INDEX SPX US 05/19/23 P3200 | 0.15% |
| Zoetis Inc. | 0.15% |
| S&P 500 INDEX SPX US 06/16/23 P3200 | 0.15% |
| Gilead Sciences Inc. | 0.15% |
| Hologic Inc. | 0.15% |
| West Pharmaceutical Services Inc. | 0.15% |
| Microsoft Corporation | 0.15% |
| Fastenal Company | 0.15% |
| Edwards Lifesciences Corporation | 0.14% |
| VeriSign Inc. | 0.14% |
| Dover Corporation | 0.14% |
| Teledyne Technologies Inc. | 0.14% |
| Lululemon Athletica Inc. | 0.14% |
| S&P 500 INDEX SPX US 02/17/23 C5000 | 0.13% |
| Paychex Inc. | 0.13% |
| Rollins Inc. | 0.13% |
| WW Grainger Inc. | 0.13% |
| Republic Services Inc. | 0.13% |
| S&P 500 INDEX SPX US 03/17/23 C5150 | 0.13% |
| Icahn Enterprises L.P. | 0.13% |
| Accenture plc | 0.13% |
| Fortive Corporation | 0.13% |
| Keurig Dr Pepper Inc. | 0.12% |
| PepsiCo Inc. | 0.12% |
| Honeywell International Inc. | 0.12% |
| Emerson Electric Company | 0.12% |
| Home Depot Inc. (The) | 0.12% |
| Eli Lilly and Company | 0.12% |
| Regeneron Pharmaceuticals Inc. | 0.12% |
| Walmart Inc. | 0.12% |
| Rockwell Automation Inc. | 0.12% |
| Incyte Corporation | 0.12% |
| Bio-Techne Corporation | 0.12% |
| S&P 500 INDEX SPX US 02/17/23 P3650 | 0.11% |
| Cooper Companies Inc. (The) | 0.11% |
| Cisco Systems Inc. | 0.11% |
| Liberty Broadband Corporation | 0.10% |
| Synopsys Inc. | 0.10% |
| Expeditors International of Washington Inc. | 0.10% |
| Energy Select Sector SPDR Fund | 0.10% |
| Hormel Foods Corporation | 0.09% |
| Eaton Corp plc | 0.09% |
| Union Pacific Corporation | 0.09% |
| Royalty Pharma plc | 0.09% |
| McCormick & Company Inc. | 0.09% |
| Activision Blizzard Inc. | 0.09% |
| Intuit Inc. | 0.09% |
| S&P 500 INDEX SPX US 03/17/23 P3700 | 0.08% |
| Cognizant Technology Solutions Corporation | 0.08% |
| Church & Dwight Company Inc. | 0.08% |
| Procter & Gamble Company (The) | 0.08% |
| S&P 500 INDEX SPX US 03/17/23 P3950 | 0.08% |
| Bristol-Myers Squibb Company | 0.08% |
| S&P 500 INDEX SPX US 02/17/23 P3500 | 0.07% |
| S&P 500 INDEX SPX US 10/21/22 P3150 | 0.05% |
| S&P 500 INDEX SPX US 10/21/22 P3300 | 0.05% |
| S&P 500 INDEX SPX US 01/20/23 C5150 | 0.04% |
| S&P 500 INDEX SPX US 12/16/22 C5225 | 0.02% |
| Embecta Corporation | 0.01% |
| S&P 500 INDEX SPX US 11/18/22 C5300 | 0.00% |
| S&P 500 INDEX SPX US 10/21/22 C5250 | 0.00% |
| S&P 500 INDEX SPX US 03/17/23 P3050 | -0.02% |
| S&P 500 INDEX SPX US 02/17/23 P2700 | -0.02% |
| S&P 500 INDEX SPX US 01/20/23 P2700 | -0.03% |
| S&P 500 INDEX SPX US 05/19/23 P2400 | -0.05% |
| S&P 500 INDEX SPX US 04/21/23 P2850 | -0.07% |
| S&P 500 INDEX SPX US 04/21/23 C5300 | -0.08% |
| S&P 500 INDEX SPX US 06/16/23 C5350 | -0.12% |
| S&P 500 INDEX SPX US 05/19/23 C4850 | -0.51% |
source: thinknewfoundfunds.com via “holdings” tab (The investment performance results presented here are based on historical backtesting and are hypothetical. Past performance, whether actual or indicated by historical tests of strategies, is not indicative of future results. The results obtained through backtesting are only theoretical and are provided for informational purposes to illustrate investment strategies under certain conditions and scenarios.)
So that we’re not all over the place we’ll divided the review into equities, treasuries, options and trend sleeves.

Return Stacked® Risk Managed U.S. Stocks & Bonds Fund: Principal Investment Strategy
To better understand the process of how the fund operates, let’s turn our attention towards the prospectus (source: summary prospectus).
Principal Investment Strategies of the Fund
“The Fund is primarily comprised of (i) equity securities of domestic companies of any market capitalization and/or ETFs (sometime referred to in this Prospectus as “Underlying Funds”) that invest in those companies (“Equity ETFs”), (ii) 5- and 10-Year U.S. Treasury Note futures contracts, (iii) put and call options on equity indices and Equity ETFs, (iv) investment grade short-term fixed income securities (i.e., short-term U.S. Treasuries) and ETFs that invest in those fixed income securities (“Fixed Income ETFs”).
In selecting securities for the Fund’s portfolio, the Adviser focuses on whether the domestic equity market offers the potential for acceptable risk-adjusted returns (lower volatility and higher price momentum) that the Adviser deems in its judgment to likely produce positive returns to the Fund.
If so, the Fund invests in domestic equities and/or Equity ETFs.
If not, the Fund invests in investment grade short-term fixed income securities or Fixed Income ETFs.
The Adviser utilizes rules-based, quantitative systems to measure market risk and select securities to buy and sell for the Fund.
The Adviser adjusts the Fund’s equity market exposure based upon its proprietary models as necessary.
These models may utilize factors including, but not limited to, momentum and trend (e.g., price return), market structure (e.g., liquidity), volatility, cross-asset signals (e.g., correlation), seasonality, and fundamentals (e.g., earnings growth).
The Fund may invest in 5- and 10-Year U.S. Treasury Note futures contracts when the Adviser’s proprietary models indicate that such a position may offer a positive expected return or meaningful diversification benefits for the portfolio.
These models may utilize factors including, but not limited to, value (e.g., real yield), trend (e.g., price return), carry (e.g., steepness of the yield curve), and correlation.
The Fund may buy (or sell) contracts that give the Fund the right to sell an underlying asset at a specific time, i.e., put options (or put spreads) on equity indices and Equity ETFs when the Adviser’s proprietary models indicate that such a position may offer a hedge against a sharp decline in domestic or foreign equity markets.
The Fund may buy (or sell) contracts that give the Fund the right to buy an underlying asset at a specific time, i.e., call options (or call spreads) on equity indices and equity ETFs when the Adviser’s proprietary models indicate that the domestic markets may experience a sharp rally in domestic or foreign equity markets.
The Fund has the flexibility to invest in any combination of the securities described above, which include domestic common stock, preferred stock, depositary receipts, equity swaps, options, equity index futures, and ETFs that invest in these types of securities.
Under normal circumstances, the Fund invests at least 80% of its total assets in securities economically tied to the U.S. market.
The Fund may use investment leverage as part of its principal investment strategy.
The Fund typically expects to invest an amount approximately equal to its net assets directly in a portfolio of equity securities and/or ETFs while also maintaining notional exposure to 5- and 10-Year U.S. Treasury Notes through futures contracts as part of this leverage strategy.
The Fund’s total investment exposure is typically less than 200% of the Fund’s NAV.”

NFDIX Equity Sleeve
For the 75% equity equation of NFDIX we’ve got a combination of US factor equity ETFs, US sector ETFs and US individual stocks rounding things out.
What’s noteworthy in particular is the selection of Vanguard, iShares, JP Morgan, SPDR and Fidelity ETFs to fulfill three factor equity strategies.
- Momentum
- Quality
- Low/Minimum Volatility
Instead of relying on the mandate of one particular fund provider for any of the given factor exposures it offers a blend of funds.
For instance, for Momentum factor exposure the fund currently has Fidelity Momentum Factor ETF at 5.70%, JP Morgan US Momentum Factor ETF at 5.69%, Vanguard US Momentum Factor ETF at 5.68% and iShares MSCI USA Momentum Factor ETF at 5.66%.
Now classic Boglehead style criticism would be to hurl something along the lines of, “You’ve got a Humpty Dumpty portfolio!”
To which calmer more sophisticated investors often reply, “Thank you very much for the compliment. I enjoy diversifying my exposure as much as possible.”
In my opinion capturing the expertise of various fund providers, each with their own methodology, as a blend of momentum funds is a better option than one and done.
You’ll notice the fund takes the same approach with its factor exposure to quality and minimum volatility.
But why on earth would you want factor equity tilts versus market cap weighted exposure?
Let’s explore that more.

Momentum Equity Factor
Momentum is one of my personal favourite equity factors and is best explained by the tendency for recently winning stocks to continue performing well into the near future.
Specifically, most momentum strategies screen for stocks based on their performance over a 2-12 month period.
Historically, momentum has been one of the most offensive equity strategies given its ability to drive excess returns relative to its market cap weighted parent index.
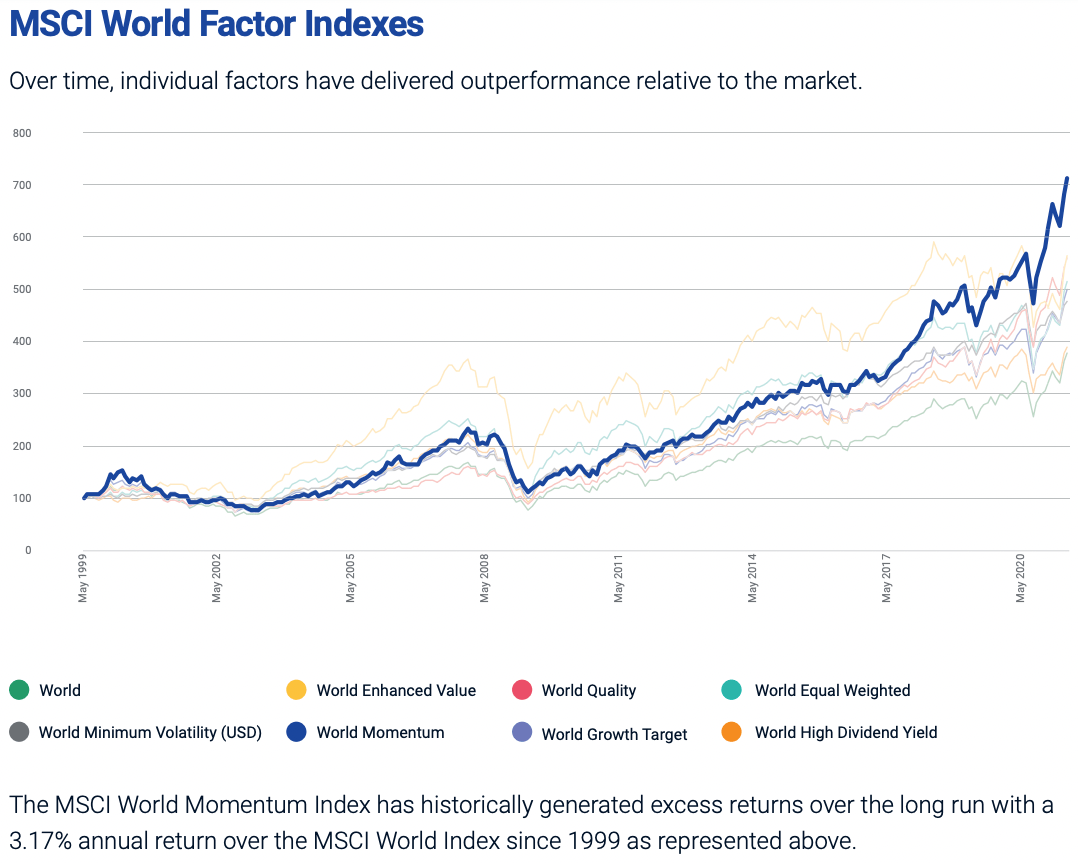
Over a 20 year period ranging from 1999 until the end of 2020, Global Momentum absolutely crushed its parent index generating 3.17% excess annual returns.
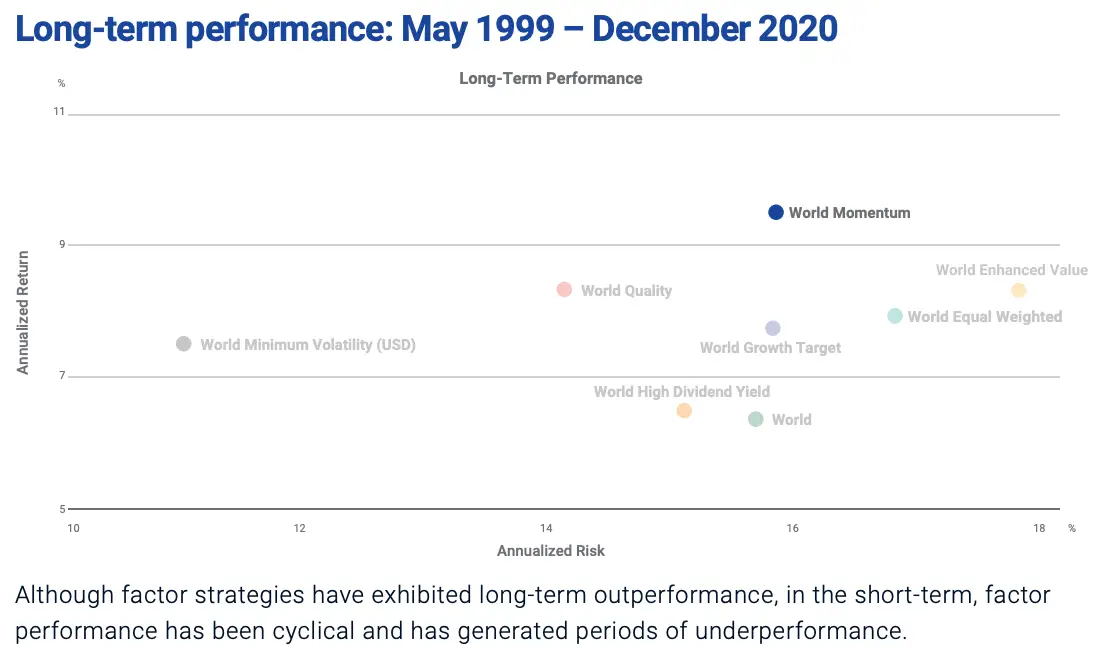
In terms of all of its equity factor strategies, MSCI global momentum outperformed everything else while encountering standard deviation on par with growth and its market cap weighted index.
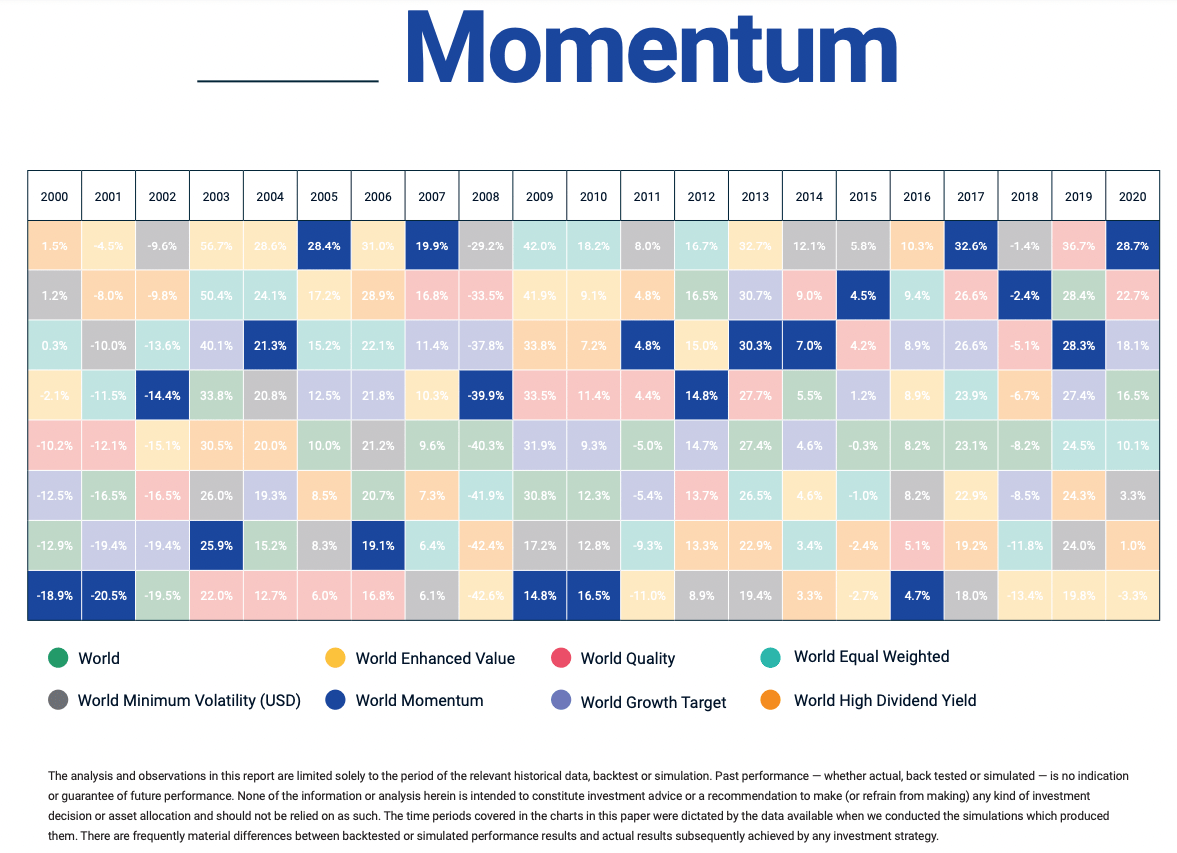
Momentum spends a lot of time either near the top of the food chain or at the bottom on an annualized returns basis versus other factors.

Quality Equity Factor
Quality as an equity factor zeroes in on companies with solid business models that feature excellent return on equity, debt to equity and earnings variability.
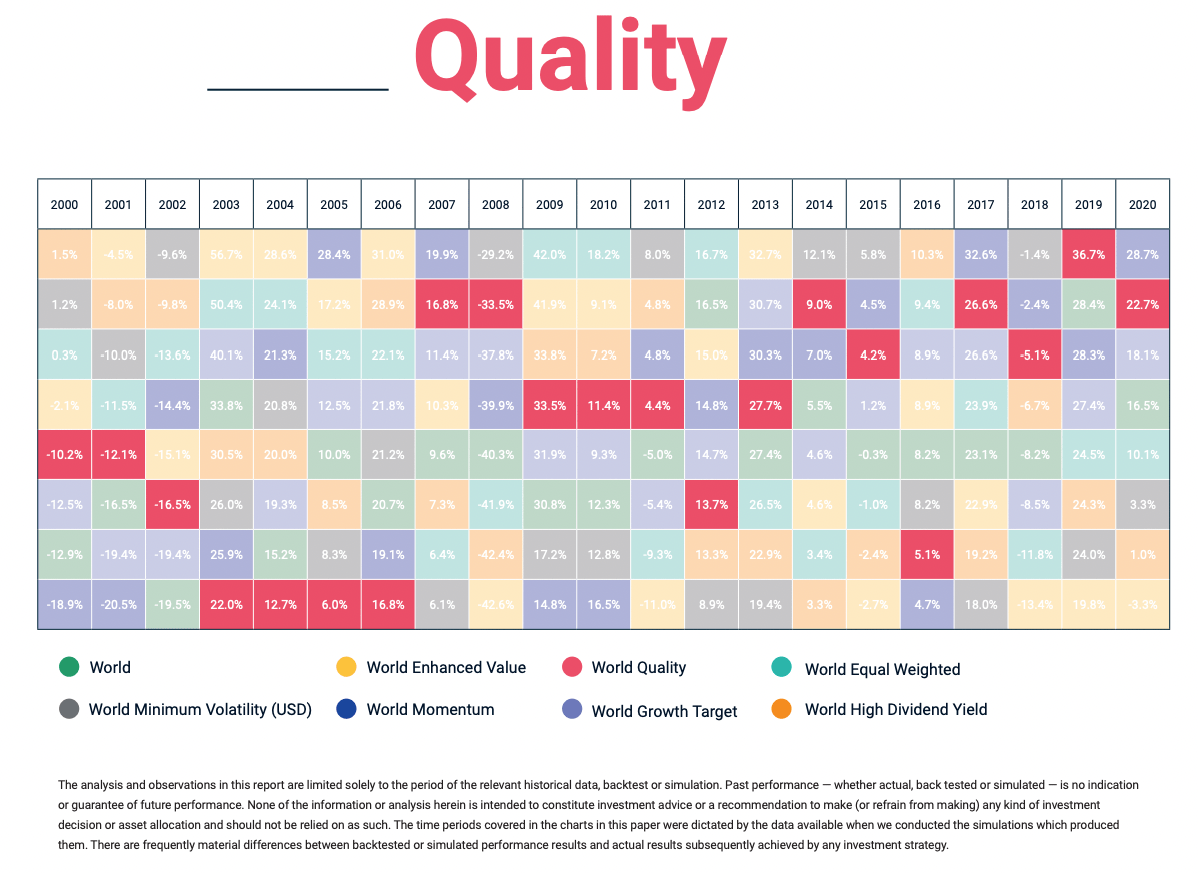
It’s important to note factor strategies can go through prolonged periods of underperformance as you can notice clearly in the early 2000s for global quality.
However, patient investors were rewarded from 2007 onwards with quality clearly being one of the top performers.
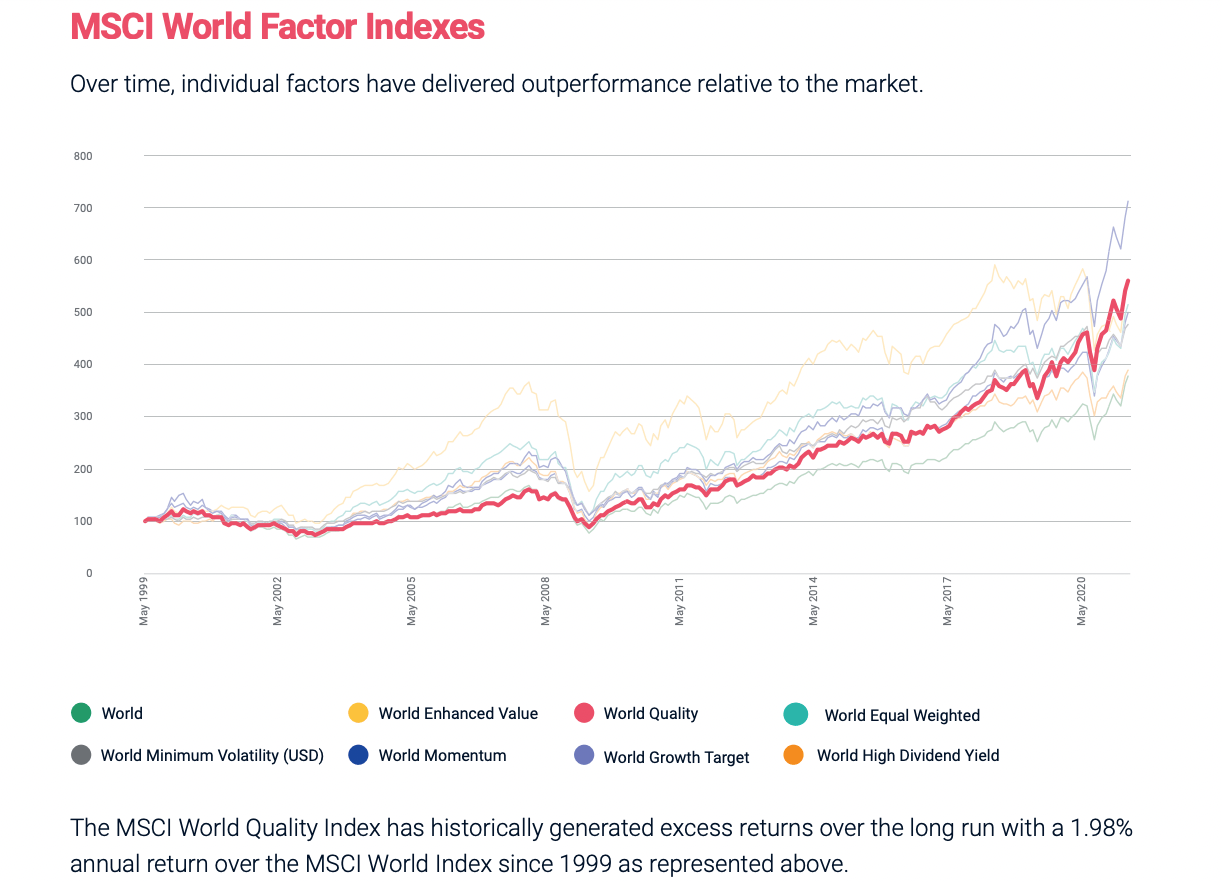
Quality outperformed most other factors from a long-range look-back generating 198 basis points of excess returns versus its market-cap weighted index.
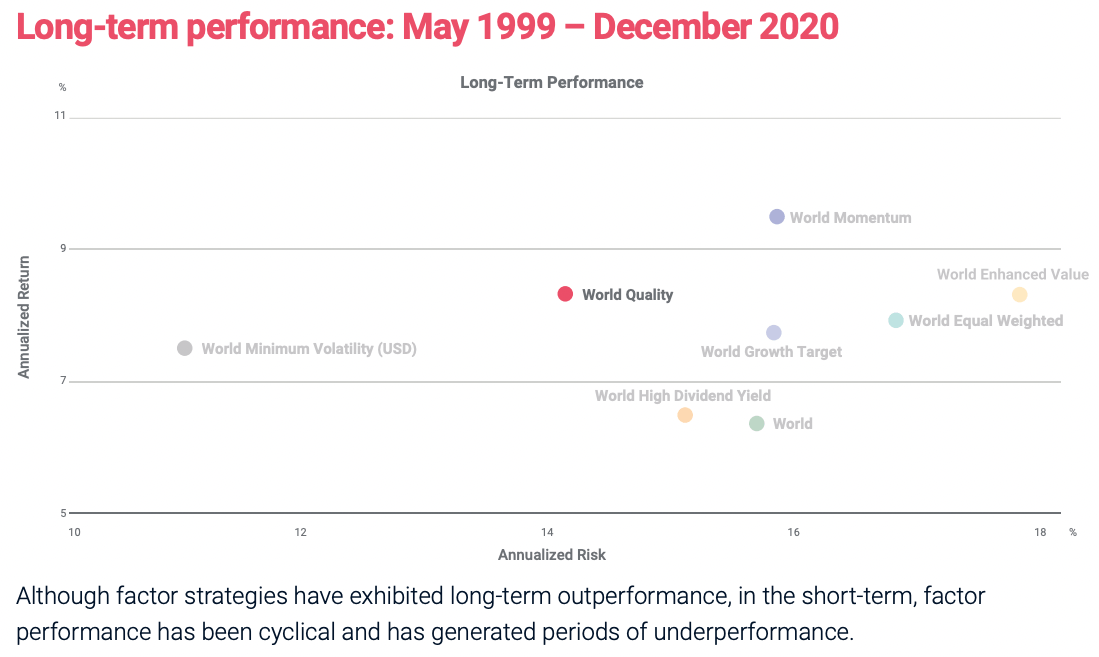
A feather in the cap for quality is that it is indeed a defensive factor offering higher returns and less volatility than market cap-weighted strategies.

Minimum Volatility Equity Factor
Minimum Volatility is hands down my favourite factor given its incredible defensive characteristics and ability to grind-out consistent slight performance wins against market-cap weighted mandates.
Min vol specifically targets stable companies with lower estimated volatility than other companies.
It’s a strategy of lower highs and lower lows.
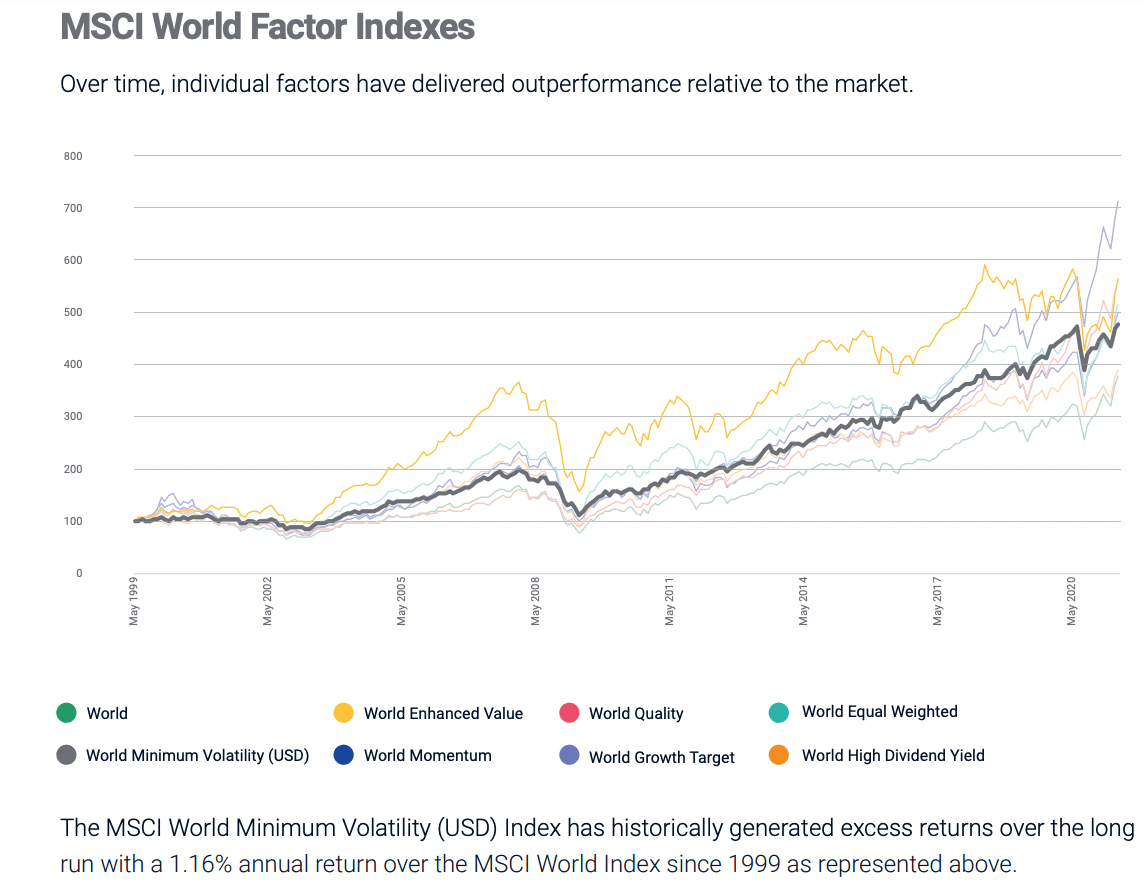
As a factor it has delivered excess returns of 116 basis points versus its market-cap weighted parent index while providing more defensive capabilities.
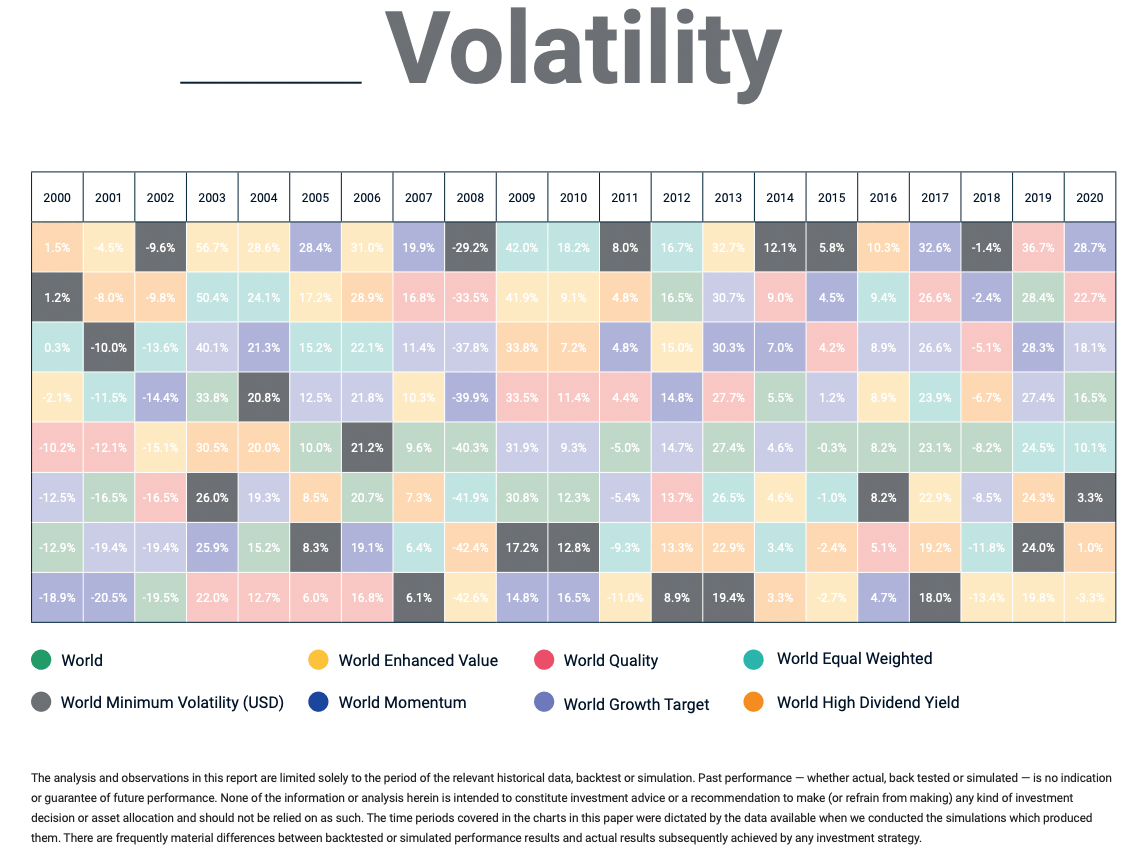
You’ll notice Minimum Volatility as a reliable defensive all-star during bear markets and down years such as the early 2000s, 2008, 2015 and 2018 whereas it lags behind during stellar markets years.
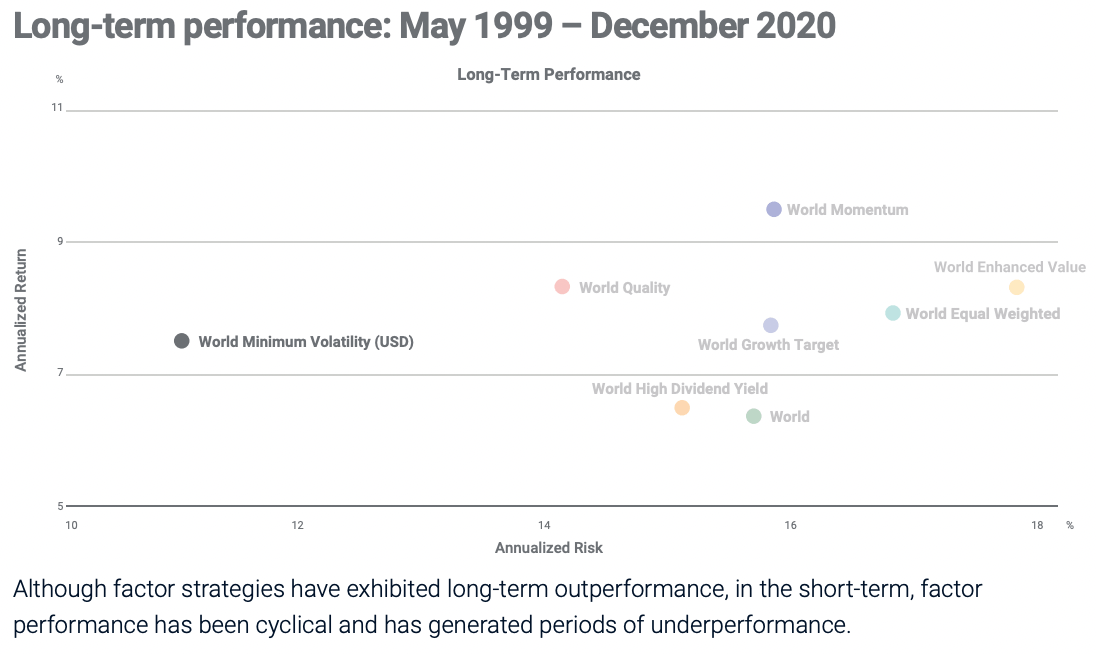
The secret sauce of minimum volatility is its long-range 400 basis points of defensive stability relative to its market-cap weighted index with its outperformance being a nice cherry on top.

Combination Of Factor Strategies
Tying all of this back to NFDIX is the clear long-term benefit of factor based investing strategies versus market-cap weighted ones.
Even better is when you combine several factor strategies within a portfolio rather than relying on just one in particular.
The reasons for a multi-strategy factor approach is best summarized as follows:
- Behavioural aspect of staying the course when one factor is relatively underperforming whereas another one is doing well
- Rebalancing aspect of winners always picking up the tab for losers (hence buying low)
- Smoothing out of returns on an annualized basis with uncorrelated factor strategies (ex: barbell of min vol vs momentum)
I’m thrilled to see a fund like Newfound Return Stacked® Risk Managed U.S. Stocks & Bonds adopt factor strategies (especially two defensive ones: “quality and min vol”) over market-cap weighted indexes.
This should drive 100s of basis points of excess returns long-term and also ensure the fund is more defensive from a standard deviation perspective.
One of my biggest critiques of other expanded canvas products is that they rarely provide equity factor exposure.
NFDIX distinguishes itself from the pack by being different here and it’s something I think needs to highlighted clearly as a positive attribute.

NFDIX Treasury Sleeve
We’ll spend considerably less time on the fixed income sleeve of the portfolio for NFDIX.
Newfound Return Stacked® Risk Managed U.S. Stocks & Bonds gains its exposure to intermediate treasury via a 10 Year US Treasury Note futures contract and iShares 1-3 Year Treasury Bond ETF.
The historically uncorrelated nature of US Treasury and US Equities has provided a ballast for investors when markets have been down.
The rare exception being this year in particular when pesky persistent inflation and corresponding interest rate hikes have skewered fixed income on the same shish kebab as equities.
However, an equal parts equity and intermediate treasury combination has provided impressive long-term results in terms of returns meet risk management.
A 75-75 configuration ensures that you’re handcuffing your equities strategy (more volatile) with an equal proportion of treasury (less volatile).
Even though it’s leveraged beyond a 100% canvas it is a sensible allocation in my opinion with back-tests to prove its enhanced returns and stability versus a 100% equity only strategy.

NFDIX Options Sleeve
If factor equity exposure was the first thing that really sets NFDIX apart from other expanded canvas equity/treasury funds such as NTSX and SWAN, then the second is its exposure to an options sleeve.
By utilizing S&P 500 PUT and CALL options at various strike points and expiration dates, Newfound Risk Managed US Growth mutual fund lays a foundation for long-volatility exposure to potentially capture both downside and upside moves in the markets.
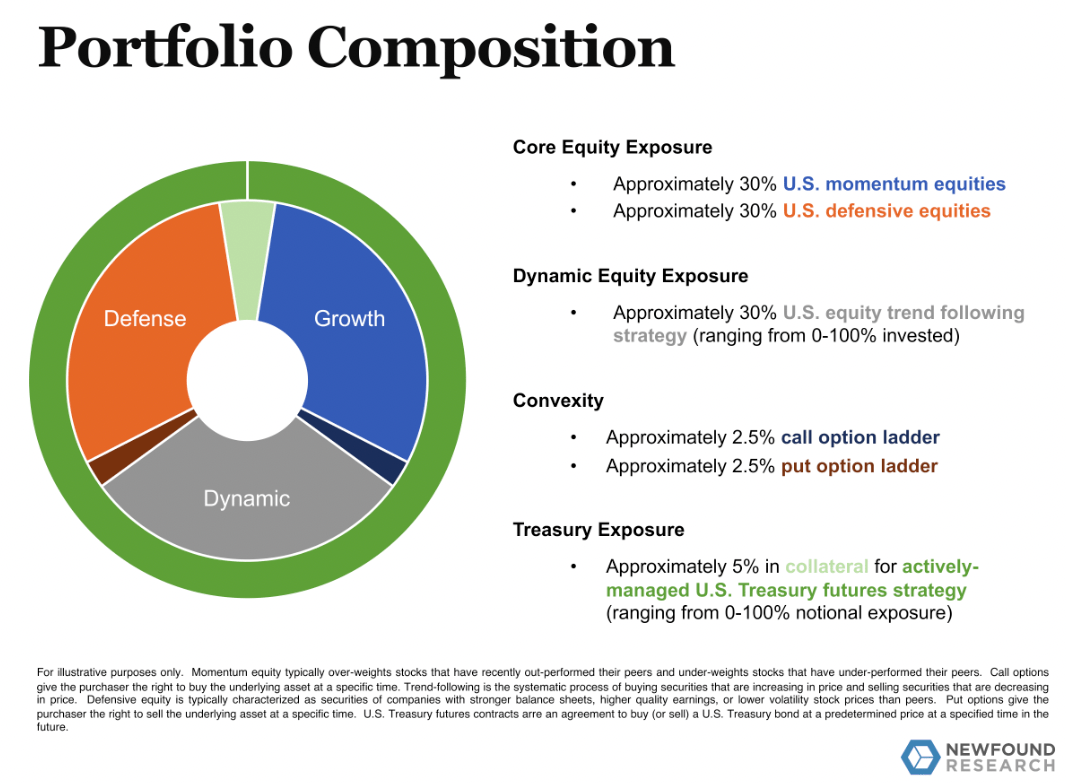
There is approximately a 2.5% call option ladder and a 2.5% put option ladder.
This particular strategy works best when there is clear directional market volatility.
A 1987, 2008 or 2020 rapid-fire drawdown scenario is when PUT options are of great utility in well balanced portfolios.
The same holds true for CALL options when rapid increases in markets trigger these options.
Smooth waters or a slow grind down are long-volatility options based strategies’ Achilles’ Heel.
However, you have them in your portfolio as insurance (especially with regards to PUT) and if things are going well you’re happy to eat the premium as your equity sleeve drives portfolio returns.
Although this shouldn’t be of great interest to the average investor, if you’re interested to see the current PUT/CALL mix you can scroll back up and examine the behemoth section: “NFDIX Complete Holdings”

Overall NFDIX Composition with Trend Following
The overall portfolio composition is an equal parts combination of 30% US momentum equities, 30% defensive equities and 30% dynamic equity exposure.
The dynamic sleeve utilizes a systematic trend-following strategy (ranging from 0-100% invested) with the capability of increasing market participation when trends are strong or decreasing its exposure when trends are negative.
Additionally, the actively managed US Treasury futures strategy has the capacity to range from 0 to 100% notional exposure.
Moreover, unlike other funds with static allocations NFDIX will expand/contract depending on its systematic trend-following signals.
Its baseline default appears to be 75/75 but it could potentially expand closer to 100/100 at its maximum configuration or conversely be 60/0 in an unlikely scenario where dynamic equities allocation is 0 and active US Treasury futures exposure is notionally 0.
Hence, its ability to adapt is a feature not a bug.
As an example, by consulting the most recent portfolio manager commentary the fund had an average 92.13% allocation to equities and 52.63% allocation to 10 year treasury futures.
Diversifying Diversifiers
 ond ex
Source: thinknewfoundfunds.com (The investment performance results presented here are based on historical backtesting and are hypothetical. Past performance, whether actual or indicated by historical tests of strategies, is not indicative of future results. The results obtained through backtesting are only theoretical and are provided for informational purposes to illustrate investment strategies under certain conditions and scenarios.)

NFDIX Risk Management
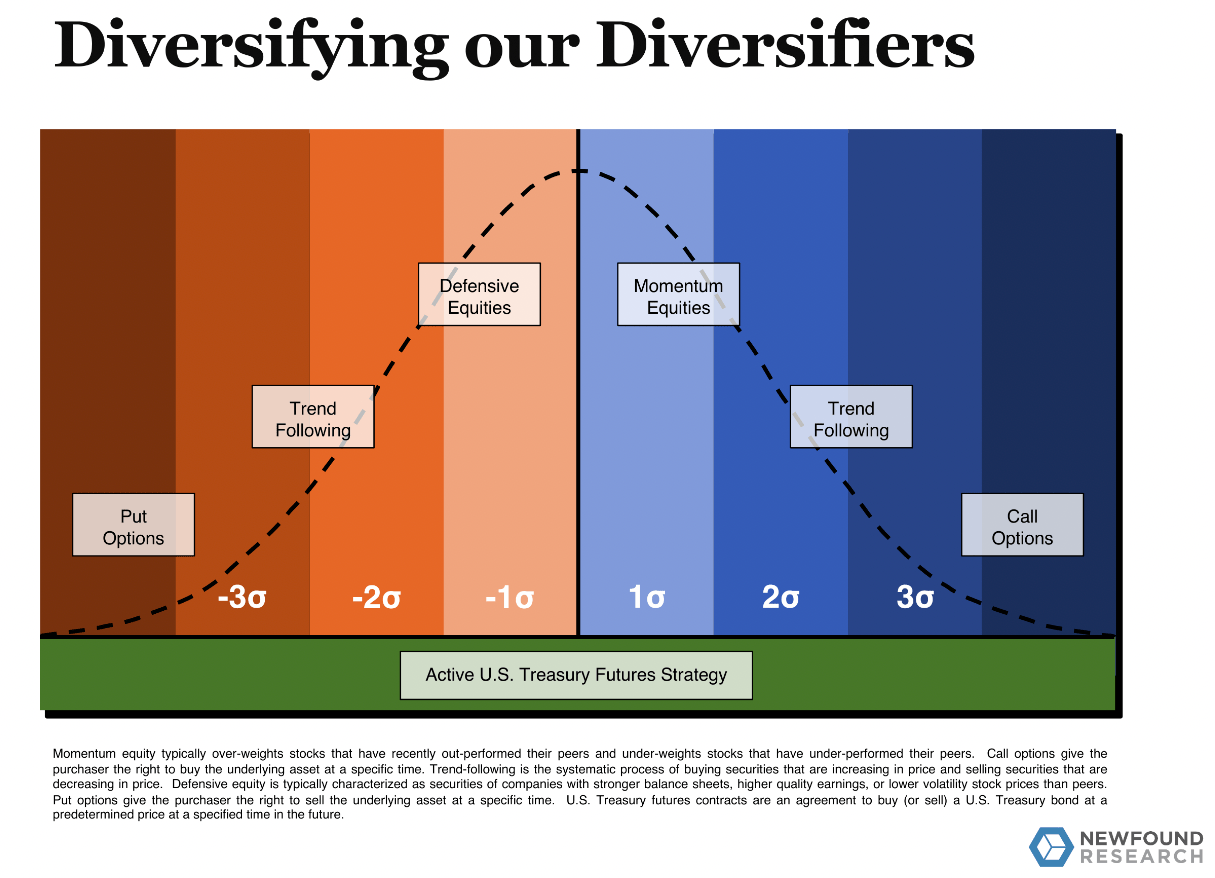
The mutual fund is after-all named Newfound “Risk Managed” US Growth and the above image best highlights the funds ability to adapt via diversified diversifiers.
Let’s consider a couple of different scenarios.
In a “risk on” growth scenario where markets are roaring the funds combination of offensive momentum equities, dynamic trend following (fully participating in the equity markets) and call options (capturing rapid positive market jumps) provide an opportunity for a bigger payoff than a static asset allocation fund.
Conversely, in a “risk off” market drawdown the fund will adapt by becoming more defensive with its combination of defensive equities (quality and minimum volatility), dynamic trend following (decreasing participation in the equity sleeve while simultaneously increasing treasury exposure) while having put options as portfolio insurance in case of negative rapid market moves.
NFDIX Third Party Examination
Let’s utilize the marvellous third party screening capabilities over at Morningstar to better examine the equity sleeve of NFDIX.
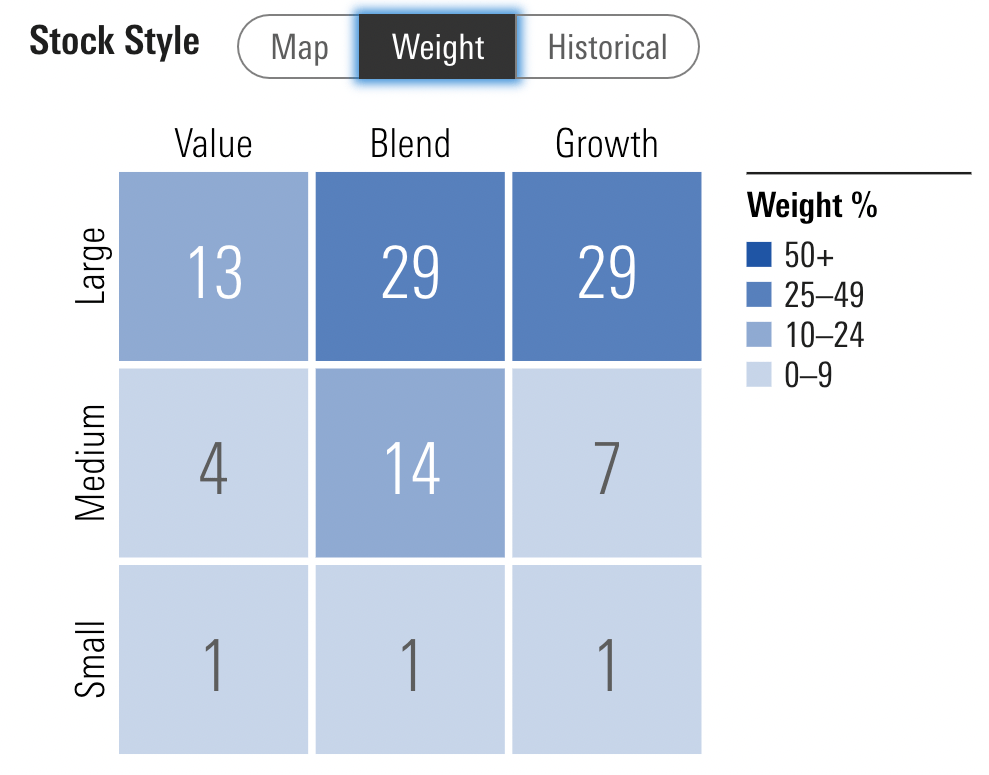
When consulting the Stock Style tools we’re able to see that Newfound Return Stacked® Risk Managed U.S. Stocks & Bonds mutual fund very much lives up to its “growth” moniker by leaning heavily towards the right with mostly large-cap and lesser mid-cap exposure.
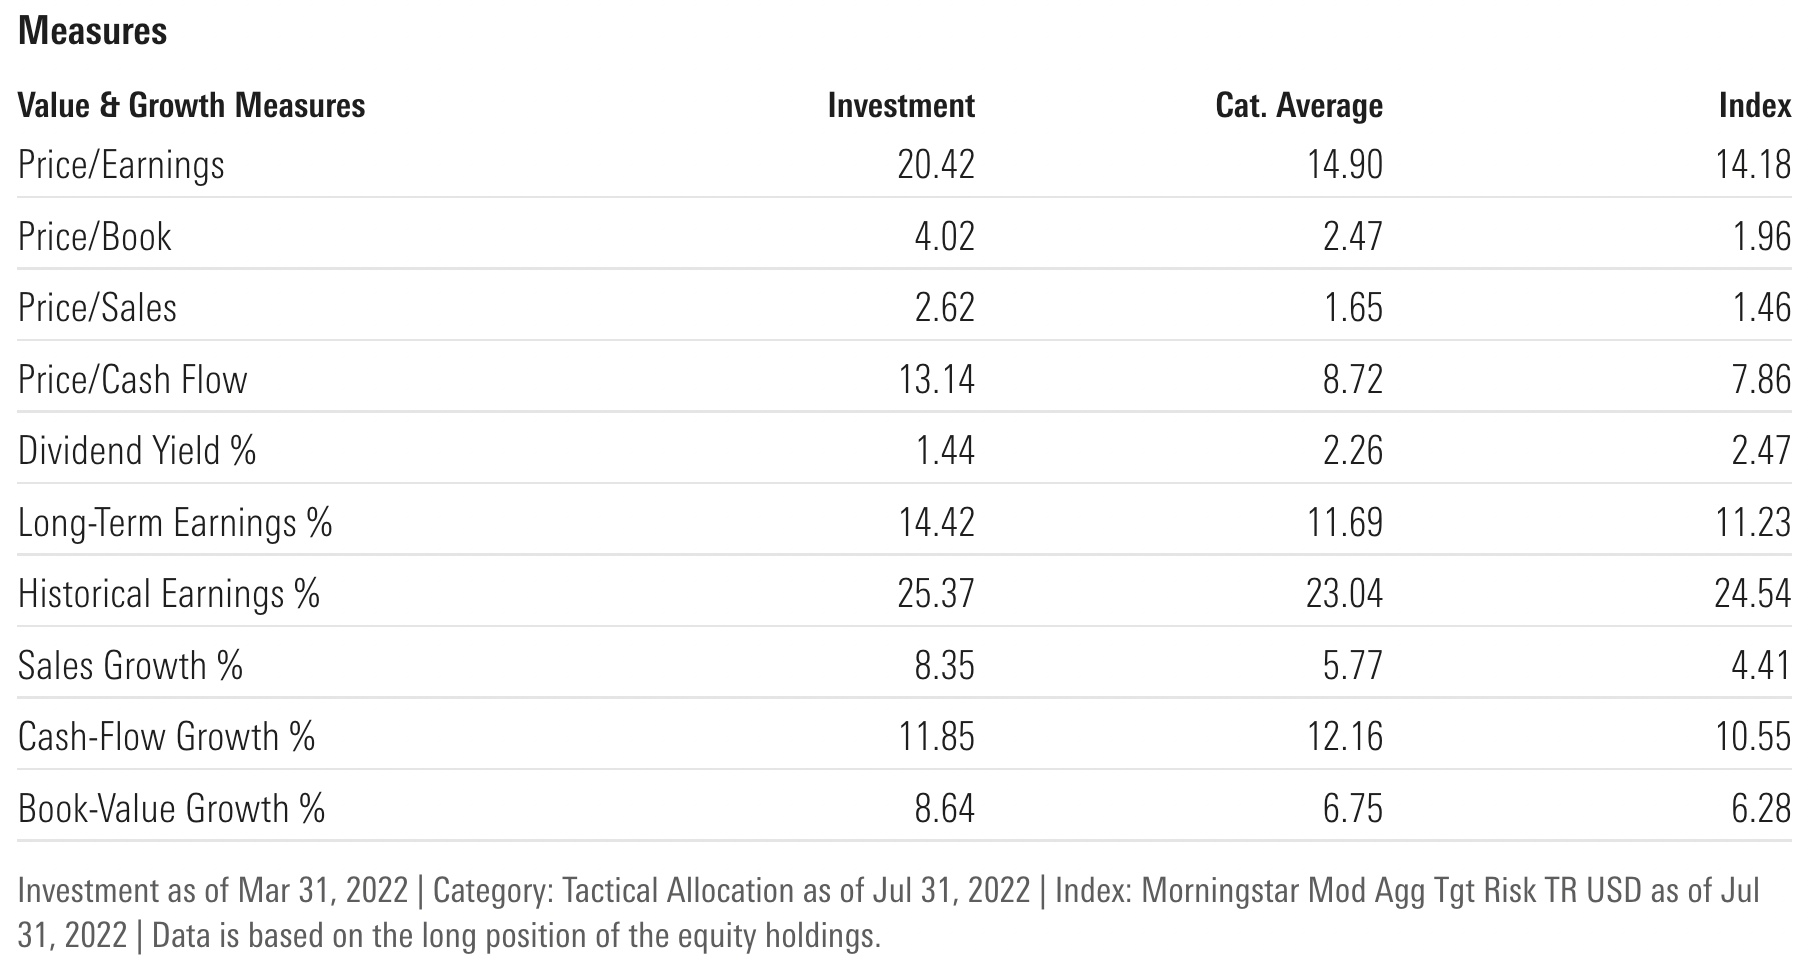
As you might expect for growth funds the P/E of NFDIX is higher at 20.42 than its category average.
The same holds true for Price/Book and Price/Sales.
It has a lower dividend yield % but higher long-term earnings % and historical earnings % versus its category average.
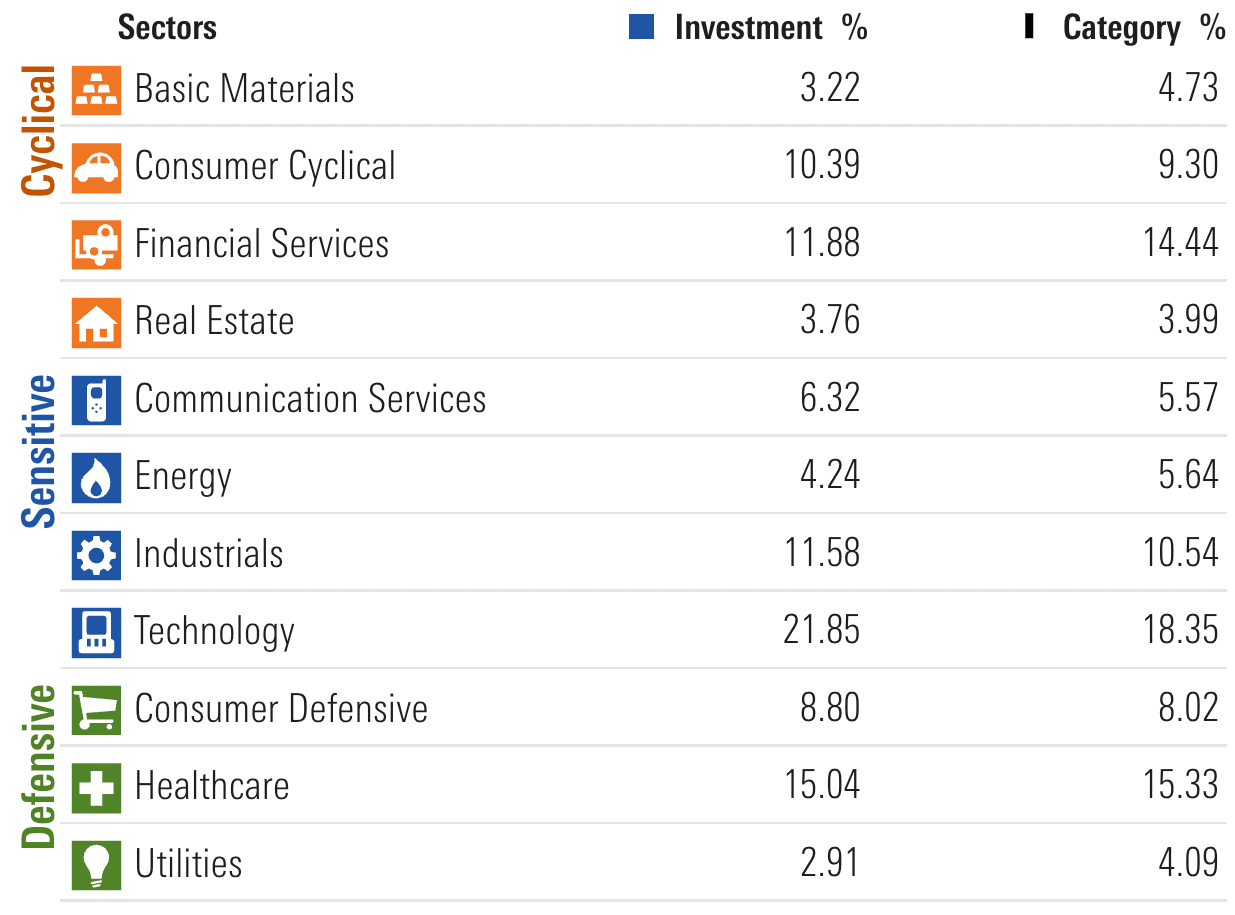
In terms of NFDIX sector exposure it matches up nearly even-Steven across the board aside from having less Financial Services exposure in favour of more Technology.
Case for 75/75 versus 50/50 or 100 Equity Exposure
We’re at the point now where we need to make the case for (or against) having an expanded canvas exposure of US growth equities and US treasury at a 75/75 configuration versus 50/50 or 100% equity only.
Fortunately, we can utilize Portfolio Visualizer to check returns for all three dating back to 1972.
Let’s first examine 50/50 and 100% equity only portfolios side by side.
50/50 vs 100 Portfolio Returns
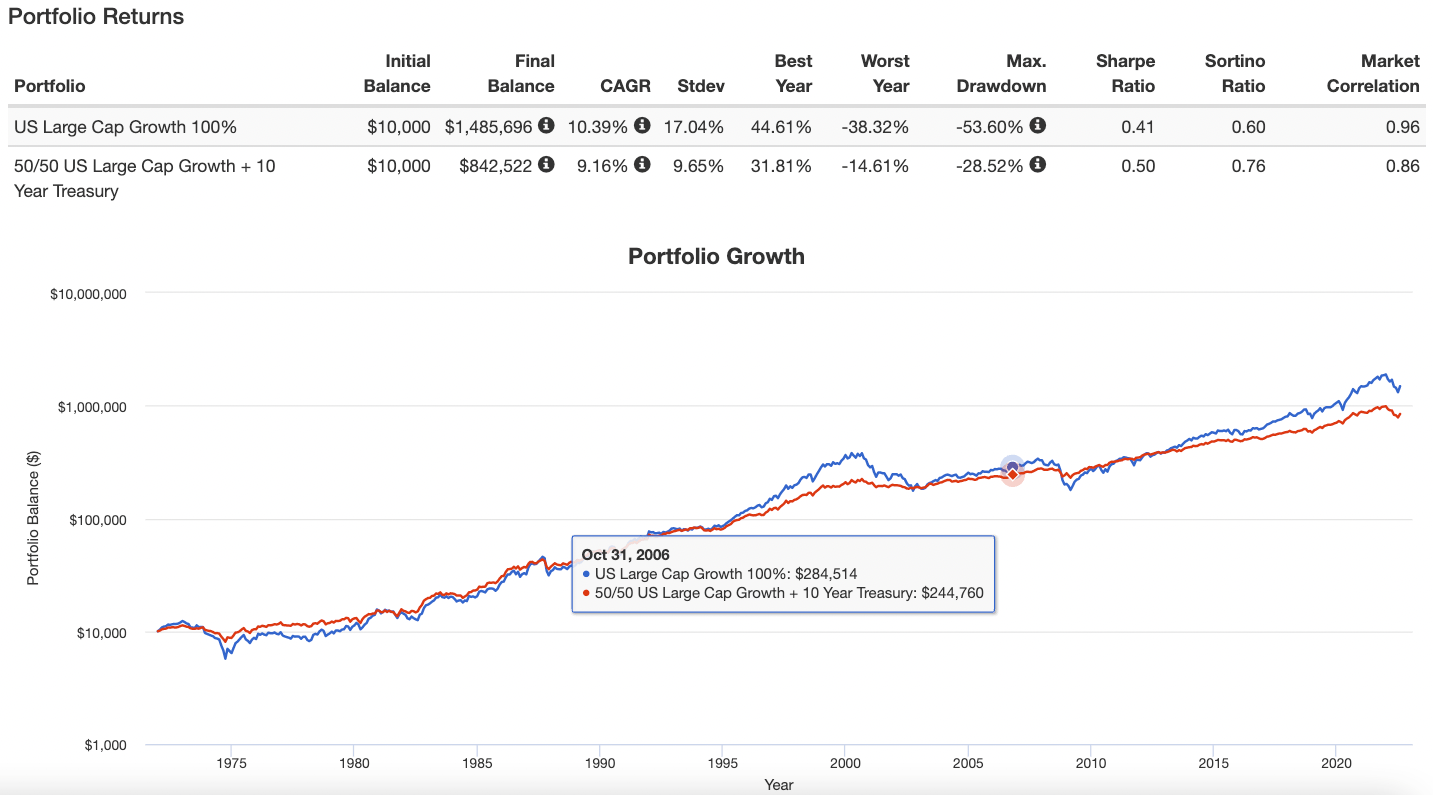
The case for a 50/50 portfolio over a 100% equity mandate is rather convincing aside from those only focused upon returns.
Although the 50/50 portfolio is 123 basis points lagging in returns it offers 739 basis points more defensive stability (standard deviation) along with a more palatable worst year (-14.61% vs 38.32%) and more a favourable Sharpe Ratio and Sortino Ratio.
In other words, it’s a far more stable portfolio for investors looking to stay the course.
It’s rare to find investors (pros or amateur) willing to stomach equity only volatility during brutal bears markets such as in the early 70s, early 2000s, 2008 and even this year.
50/50 vs 100 Portfolio Drawdowns
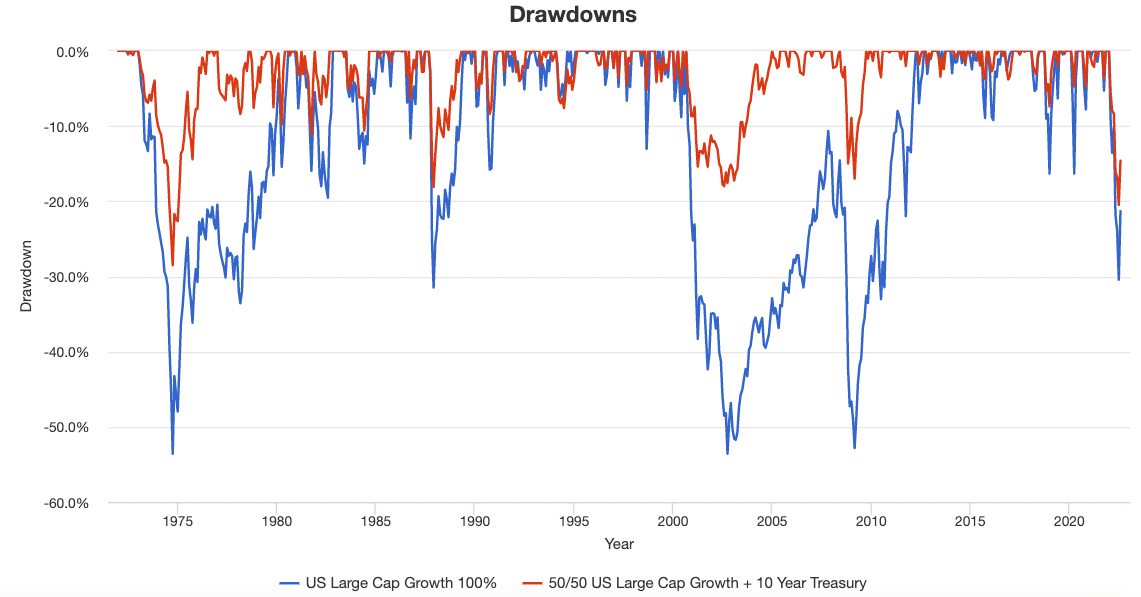
The drawdowns are indicative of the rollercoaster ride equity only investors must be willing to endure.
50/50 vs 100 Portfolio Roll Period

From a roll period sequence of returns perspective, it’s much easier to stay the course with a 50/50 portfolio when the worst case scenario in 50 years has been a negative 5 year period at -0.09% versus an equity only lost decade of -4.67%.
*NOTE: The 75/75 simulated portfolio results DO NOT include the cost of LEVERAGE which means RETURNS would be lower than what is indicated here*
75/75 Portfolio Returns
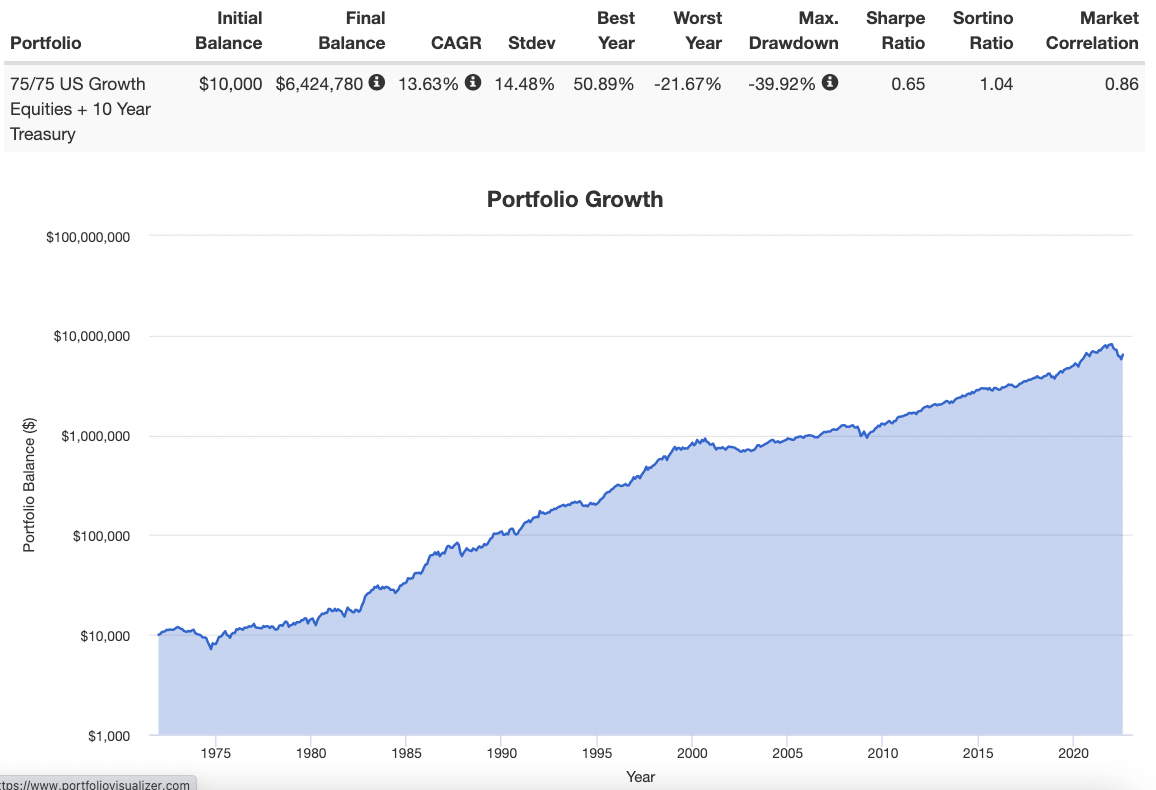
The 75/75 portfolio offers a massive upgrade in performance versus a 100% equity only mandate, lower standard deviation, better worst year and enhanced Sharpe Ratio and Sortino Ratio.
Modestly leveraging equal parts stocks and bonds has worked incredibly well in the long-run for driving returns and managing risk.
75/75 Portfolio Drawdowns
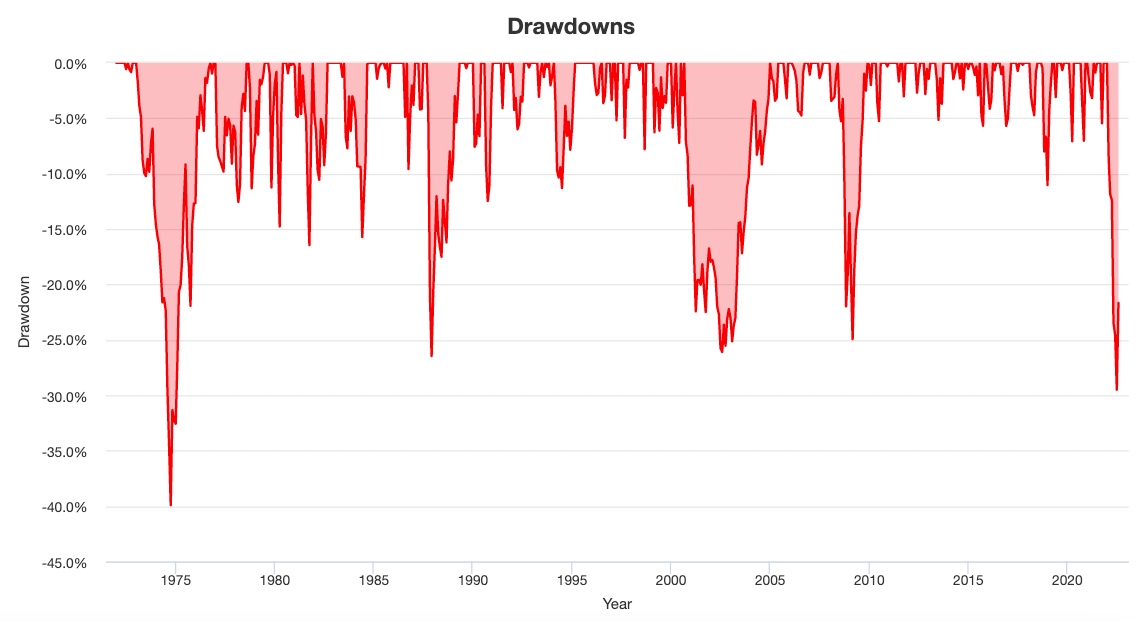
Although the drawdowns of a 75/75 portfolio are indeed more fierce than a 50/50 portfolio they’re nowhere near as bad as a 100% equity only allocation.
75/75 Portfolio Roll Period
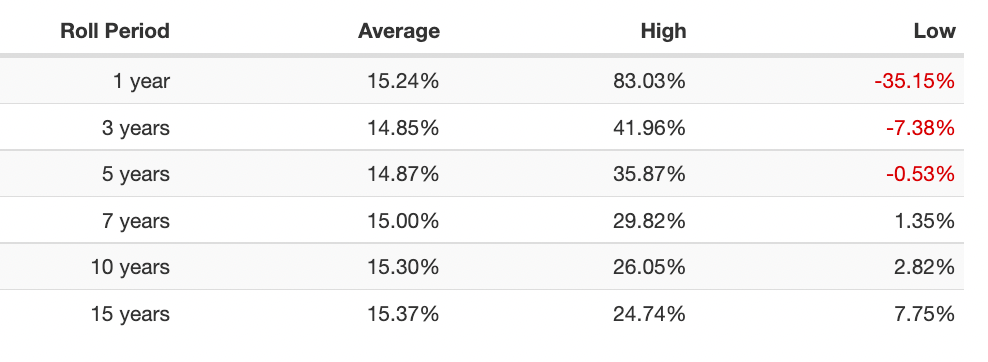
The 75/75 portfolio has a 5 year low roll period of -0.53% versus the lost decade for US equity growth of -4.67%.
Overall Case Is Strong for 75/75
Hence, the overall case for a sensibly leveraged 75/75 portfolio versus 50/50 or 100% equity only portfolios is indeed strong.
Returns meets risk management.
Plus the potentially added benefit of creating real-estate space in your portfolio for other strategies via efficient allocation.

NFDIX Pros and Cons
Let’s examine the pros and cons of NFDIX Newfound Return Stacked® Risk Managed U.S. Stocks & Bonds mutual fund.
NFDIX Mutual Fund Pros
- The only fund that I’m aware of providing an equity/treasury split offering multiple factor exposure plus downside and upside convexity options overlay
- Research supported equity factor allocation towards momentum, quality and minimum volatility to potentially drive excess returns over market-cap weighted allocations
- An equal parts allocation to uncorrelated Intermediate Treasury to provide defensive coverage during market drawdowns (2022 the exception not the rule)
- Options of PUT and CALL hedging for downside and upside convexity during extreme market movements in either direction (diversifying your diversifiers)
- 75/75 allocation outperforms equity only mandates historically while offering more stability
- 75/75 allocation allows you to efficiently utilize space in your portfolio to pursue other strategies
- Systematic trend-following strategy for the “dynamic equity” sleeve has a full range of 0-100 participation adapting based on trend signals
- Actively managed treasury futures strategy (ranging from 0-100 exposure) with the ability to adapt
- Support a boutique firm as opposed to vanilla Goliath providers
NFDIX Mutual Fund Cons
- Management expense ratio of 1.35% puts it in the Morningstar fee level category of “above average” and it is more expensive than ETFs such as NTSX or SWAN but in its defence it offers factor equity strategies, systematic trend-following and an options overlay that are more costly
- Will especially struggle in a year like 2022 in a high inflation and rising interest rate environment when leveraged equities and treasury are both down together
- False signals and reversal of trends can mean the dynamic aspects of the portfolio gets whipsawed when the market does not cooperate with your given position

NFDIX Potential Portfolio Ideas
These asset allocation ideas and model portfolios presented herein are purely for entertainment purposes only. This is NOT investment advice. These models are hypothetical and are intended to provide general information about potential ways to organize a portfolio based on theoretical scenarios and assumptions. They do not take into account the investment objectives, financial situation/goals, risk tolerance and/or specific needs of any particular individual.
NFDIX is an expanded canvas product and we’ll therefore highlight three different modestly leveraged portfolios as potential portfolio solutions.

NFDIX Total Portfolio Solution
Is Newfound Return Stacked® Risk Managed U.S. Stocks & Bonds mutual fund a total portfolio solution?
Well, that would depend entirely upon your investing point of view.
If you’re comfortable with home-country bias (no global equities) and you’re not particularly keen on integrating more esoteric strategies (such as trend-following) into your portfolio, I’d reckon this fund would be a clear upgrade over a milquetoast 60/40 portfolio.
100% NFDIX.
It’s possible to arrive at that conclusion but I think combining it with other funds is a more prudent consideration.

NFDIX Growth Portfolio Solution
For investors keen on keeping a strong overall equity exposure but seeking to globally diversify and add uncorrelated asset classes and strategies the following portfolio may be of interest:
20% NFDIX
20% GDE
20% NTSI
20% NTSE
20% BLNDX
Here you’d have a portfolio that is split between US equities and global (INT-DEV + EM) with significant exposure to TREASURY, GOLD, TREND-FOLLOWING and OPTION strategies.
A bit of a lopsided dragon portfolio that skews heavily in favour of equities but offers plenty of treasury and alternatives to the mix.

NFDIX Moderate Portfolio Solution
A more moderate portfolio seeking greater exposure to managed futures alternatives while shaving down equities might looking something like this:
15% NFDIX
15% GDE
15% NTSI
15% NTSE
20% BLNDX
20% RDMIX
The only change here is reducing by 5% the exposure to portable beta stock/bond/gold funds to create 20% room for 5 star RDMIX which is an adaptive asset allocation style of risk parity fund.
The difference here is that your equity exposure has been reduced in favour of more global systematic managed futures.

NFDIX Conservative Portfolio Solution
To make things more conservative we’ll boost our allocation to fixed income while maintaining our managed futures exposure from the conservative portfolio.
10% NFDIX
10% GDE
10% NTSI
10% NTSE
20% BLNDX
20% RDMIX
20% UPAR
By shaving down the portable beta stock/bond/gold funds an additional 5% we’re now able to add UPAR at 20%.
Ultra Risk Parity ETF as a long-only 168% canvas global equity/long-term treasury/TIPS/gold/commodities fund bolsters our fixed income sleeve while reducing our overall equity exposure.
All three portfolio ideas maintain a global equities, fixed income, managed futures, gold and options combination.

Nomadic Samuel Final Thoughts
I’m overall quite impressed with NFDIX.
It really distinguishes itself from the expanded canvas equity/treasury pack by providing multi-factor exposure to defensive, momentum and dynamic (trend-following) equities strategies along with an upside and downside convexity options overlay.
I’m contently Canadian but I do wish I could cross the border to access US Mutual funds.
The ETF marketplace in Canada has some excellent funds (some I feel are better than US ETFs such as PFAA.TO or ONEC.TO) but is sorely lagging behind in the Mutual Funds department.
Hence, I’d probably find space for NFDIX in my crowded 12 fund Contrarian Expanded Canvas Portfolio but alas it just isn’t possible.
Not long ago, I created a wish-list for ETF and Mutual Funds I’d love to have exposure to in the marketplace.
One of my biggest wishes is equity factors of all shapes and sizes as part of portable beta products.

Return Stacked® Risk Managed U.S. Stocks & Bonds mutual fund provides that with not just one factor but three: momentum, quality and minimum volatility.
I also have the bias as a small business owner to want to support boutique level firms in the fund marketplace.
I’m more likely to be willing to pay a little more (in terms of fees) for a fund that I think offers me a uniquely great strategy relative to more vanilla products typically offered by the giant providers out there.
Whether or not you feel the same way I do is up for you to decide.
That’s all I’ve got for now.
Ciao.
Important Information
Comprehensive Investment Disclaimer:
All content provided on this website (including but not limited to portfolio ideas, fund analyses, investment strategies, commentary on market conditions, and discussions regarding leverage) is strictly for educational, informational, and illustrative purposes only. The information does not constitute financial, investment, tax, accounting, or legal advice. Opinions, strategies, and ideas presented herein represent personal perspectives, are based on independent research and publicly available information, and do not necessarily reflect the views or official positions of any third-party organizations, institutions, or affiliates.
Investing in financial markets inherently carries substantial risks, including but not limited to market volatility, economic uncertainties, geopolitical developments, and liquidity risks. You must be fully aware that there is always the potential for partial or total loss of your principal investment. Additionally, the use of leverage or leveraged financial products significantly increases risk exposure by amplifying both potential gains and potential losses, and thus is not appropriate or advisable for all investors. Using leverage may result in losing more than your initial invested capital, incurring margin calls, experiencing substantial interest costs, or suffering severe financial distress.
Past performance indicators, including historical data, backtesting results, and hypothetical scenarios, should never be viewed as guarantees or reliable predictions of future performance. Any examples provided are purely hypothetical and intended only for illustration purposes. Performance benchmarks, such as market indexes mentioned on this site, are theoretical and are not directly investable. While diligent efforts are made to provide accurate and current information, “Picture Perfect Portfolios” does not warrant, represent, or guarantee the accuracy, completeness, or timeliness of any information provided. Errors, inaccuracies, or outdated information may exist.
Users of this website are strongly encouraged to independently verify all information, conduct comprehensive research and due diligence, and engage with qualified financial, investment, tax, or legal professionals before making any investment or financial decisions. The responsibility for making informed investment decisions rests entirely with the individual. “Picture Perfect Portfolios” explicitly disclaims all liability for any direct, indirect, incidental, special, consequential, or other losses or damages incurred, financial or otherwise, arising out of reliance upon, or use of, any content or information presented on this website.
By accessing, reading, and utilizing the content on this website, you expressly acknowledge, understand, accept, and agree to abide by these terms and conditions. Please consult the full and detailed disclaimer available elsewhere on this website for further clarification and additional important disclosures. Read the complete disclaimer here.


I believe you missed a very important feature of this fund. The 75/75 stock/bond allocation is just an approximation of long term average allocation.
It can be up to 100/100, but it applies TAA based on momentum to 1/3 of the potential stock allocation and TAA based on momentum, carry and value to the entire 10 yr bond allocation.
Thanks DGM. I definitely made a mistake by not including the dynamic trend sleeve for equities and actively managed treasury component that can range from 0-100 participation. I’ll adjust the article to correct my mistakes. Thank you. Sam
Something seems wrong here if you look at the chart for NFDIX it vastly underperforms SPY all the time. If it was 75/75 it should have been killing it at least before bonds started to go down a lot recently. But even NFDX inception in 2015-2019 shows NFDIX made about 14% while SPY made about 50% in the time period.
Source:
See chart: https://prnt.sc/pgtT6JnQo89b
The strategy of the fund has been evolving over time as per my last reply.
According to Morningstar: https://www.morningstar.com/funds/xnas/nfdix/performance
In 2021 it returned 23.21% vs category average of 13.36%.
2022 has been a rough year for long stock/equity leveraged funds.
Pain for NTSX, UPAR, SWAN, etc.
I do like the strategy of the fund (given all of its tweaks) long-term though.
But that’s just my opinion.
Which should be taken with a grain of salt.
On page 30 of 33 you can see the following: https://docsend.com/view/4cnmhibth8trmhfu
June 2015: The Newfound Risk Managed US Sector Fund is launched.
July 2019: The fund introduces US treasury future positions.
August 2019: The fund is renamed as the Newfound US Risk Managed Growth Fund.
October 2020: The fund reduces trend-following exposure and introduces momentum and defensive style tilts.
November 2020: The fund introduces options positions.
You don’t show the performance of the actual fund anywhere. Performance since inception is terrible and even post November 2020 it’s been awful, easily outperformed by a simple 60/40 portfolio the entire time.