I’ve connected online with mostly value investors and even though I’m a diversified factor investor, if push came to shove, I identify far more on the left side of the equity style box than I do the right.
Yet that doesn’t mean I’m not intrigued by growth investing.
However, I do have the usual objections that most non-growth investors have towards being on the right hand side of the style box.
Typically high valuations.
FANGMA.
The awareness that growth investing is often prone to significant boom and bust cycles.
Narrative based investing.

Many of the stocks you’ll find in growth funds are companies that are more prone to investor exuberance.
Taking a quick glance at Vanguard Growth ETF it is Apple, Microsoft, Amazon, Tesla and Google holding the top current positions.
Now contrast that with a Minimum Volatility strategy such as USMV ETF with two of its top 10 positions being Waste Management Inc and Waste Connections Inc.
But what about a growth strategy that avoids higher P/E equities with stretched valuations?
AKA GARP.
Well, that’s the exact growth investing strategy what we’ll be reviewing today here on Picture Perfect Portfolios.
Invesco S&P 500 GARP ETF.
Ticker SPGP ETF.
It’s a fund that operates in the S&P 500 universe of large cap companies that selects 75 positions out of a potential 500 candidates that best fulfill its growth at a reasonable price mandate.
The fund has a considerably lower P/E than both the S&P 500 and especially Vanguard Growth ETF.
And you won’t find any FANGMA in its top 10 positions either.
Regeneron Pharmaceuticals Inc, Cigna Corp and Everest Re Group Ltd are its current top 3 holdings.
Let’s find out what makes this fund an alternative to typical growth investing strategies and if it has a potential place in a diversified factor focused portfolio.

Invesco S&P 500 GARP ETF Review (Growth at a Reasonable Price) | SPGP ETF Review
Hey guys! Here is the part where I mention I’m a travel blogger, vlogger and content creator! This investing opinion blog post ETF Review is entirely for entertainment purposes only. There could be considerable errors in the data I gathered. This is not financial advice. Do your own due diligence and research. Consult with a financial advisor.

Invesco ETFs: Greater Possibilities Together
Invesco is a fund provider I’m quite familiar with.
They’re obviously more well known for US listed ETFs (especially QQQ ETF) but they have a strong presence in Canada as well.
In fact, they offer two of my favourite funds north of the border.
PLV.TO – Invest Low Volatility Portfolio ETF
PWZ.TO – Invesco FTSE RAFI Global Small-Mid ETF
PLV offers investors a globally diversified asset allocation fund with a fund of funds approach to low volatility strategies.
PWZ packs globally diversified small and mid cap exposure with a RAFI fundamental index strategy.
However, one of the key differences I’ve noticed between the Canadian roster of ETFs and those in the US is the amount of S&P 500 products on offer.
Invesco offers a bonanza buffet of options for investors who are not satisfied with merely a S&P 500 market cap weighted straight shooter approach.
And the fund we’re reviewing today (SPGP ETF) is part of its impressive overall roster of S&P 500 Universe ETFs.

Invesco S&P 500 Fund List
RSPE ETF – Invesco ESG S&P 500 Equal Weight ETF
EQWL ETF – Invesco S&P 100 Equal Weight ETF
SPGP ETF – Invesco S&P 500 GARP ETF
SPMV ETF – Invesco S&P 500 Minimum Variance ETF
QVML ETF – Invesco S&P 500 QVM Multi-factor ETF
RWL ETF – Invesco S&P 500 Revenue ETF
SPVM ETF – Invesco S&P 500 Value with Momentum ETF
SPVU ETF – Invesco S&P 500® Enhanced Value ETF
RSP ETF – Invesco S&P 500® Equal Weight ETF
SPHB ETF – Invesco S&P 500® High Beta ETF
SPHD ETF – Invesco S&P 500® High Dividend Low Volatility ETF
SPLV ETF – Invesco S&P 500® Low Volatility ETF
SPMO ETF – Invesco S&P 500® Momentum ETF
RPG ETF – Invesco S&P 500® Pure Growth ETF
RPV ETF – Invesco S&P 500® Pure Value ETF
SPHQ ETF – Invesco S&P 500® Quality ETF
XLG ETF – Invesco S&P 500® Top 50 ETF
XRLV ETF – Invesco S&P 500® ex-Rate Sensitive Low Volatility ETF
Holy Mother of Molly!
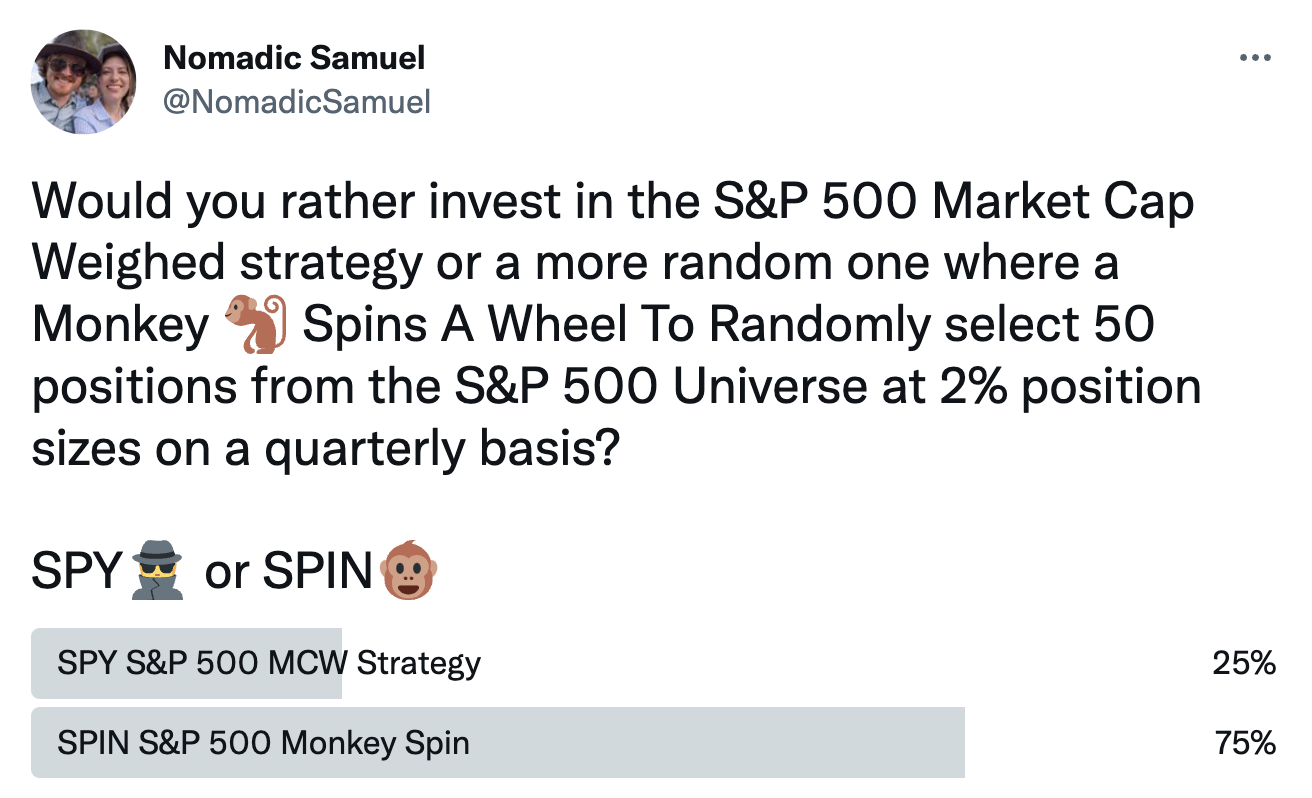
I think the only thing missing is a S&P 500 fund where a monkey spins a wheel to select 50 random holdings at 2% position sizes.
SPIN ETF.
Terrible jokes aside, I’ll interject my personal bias by saying I’d probably go with just about any of these funds over the market cap weighted S&P 500.
Let’s get back on track here.

The Case For Growth At A Reasonable Price
We already covered three of the main reasons why someone might consider GARP (Growth At A Reasonable Price) vs a typical Growth Strategy.
GARP Avoids These 3 Things
- High P/E Companies
- High Valuations/Volatility and Low Yield/Quality
- Narrative / FOMO Based Investing
MSCI “Growth” Factor in Focus does a great job highlighting these concerns.
“One challenge capturing growth through simple selection models can be the impact of unintended exposure, which demonstrate that assets with high growth may also have high valuations, high volatility, low yield and low quality, which may negatively affect the performance of a portfolio.
MSCI’s growth target index controls for unintended risks and exposures and extends the concept of growth at a reasonable price (GARP) to seek a reasonable level of volatility, yield and quality.
Growth at a reasonable price (GARP), a concept long employed by growth investors, seeks to avoid paying too much for the potential growth of a stock.
The GARP concept can be extended by controlling the level of value exposure—ensuring the long-term premium for growth is not eroded by the unintended and incidental impact of securities with high valuations— i.e. negative exposure to the value factor.”
Why Investors Consider Growth Strategies
They then go on to give a great explanation as to why investors have used growth strategies:
Growth is a recognized investment strategy and has a high explanatory power in risk forecasting, as shown in risk models.
The pure growth factor, independent of exposure to other style or industry factors, has shown an attractive longterm return compared to MSCI ACWI Index as well as low or negative correlation with other factors which may help diversify a multi-factor portfolio by reducing short-term cyclicality.”
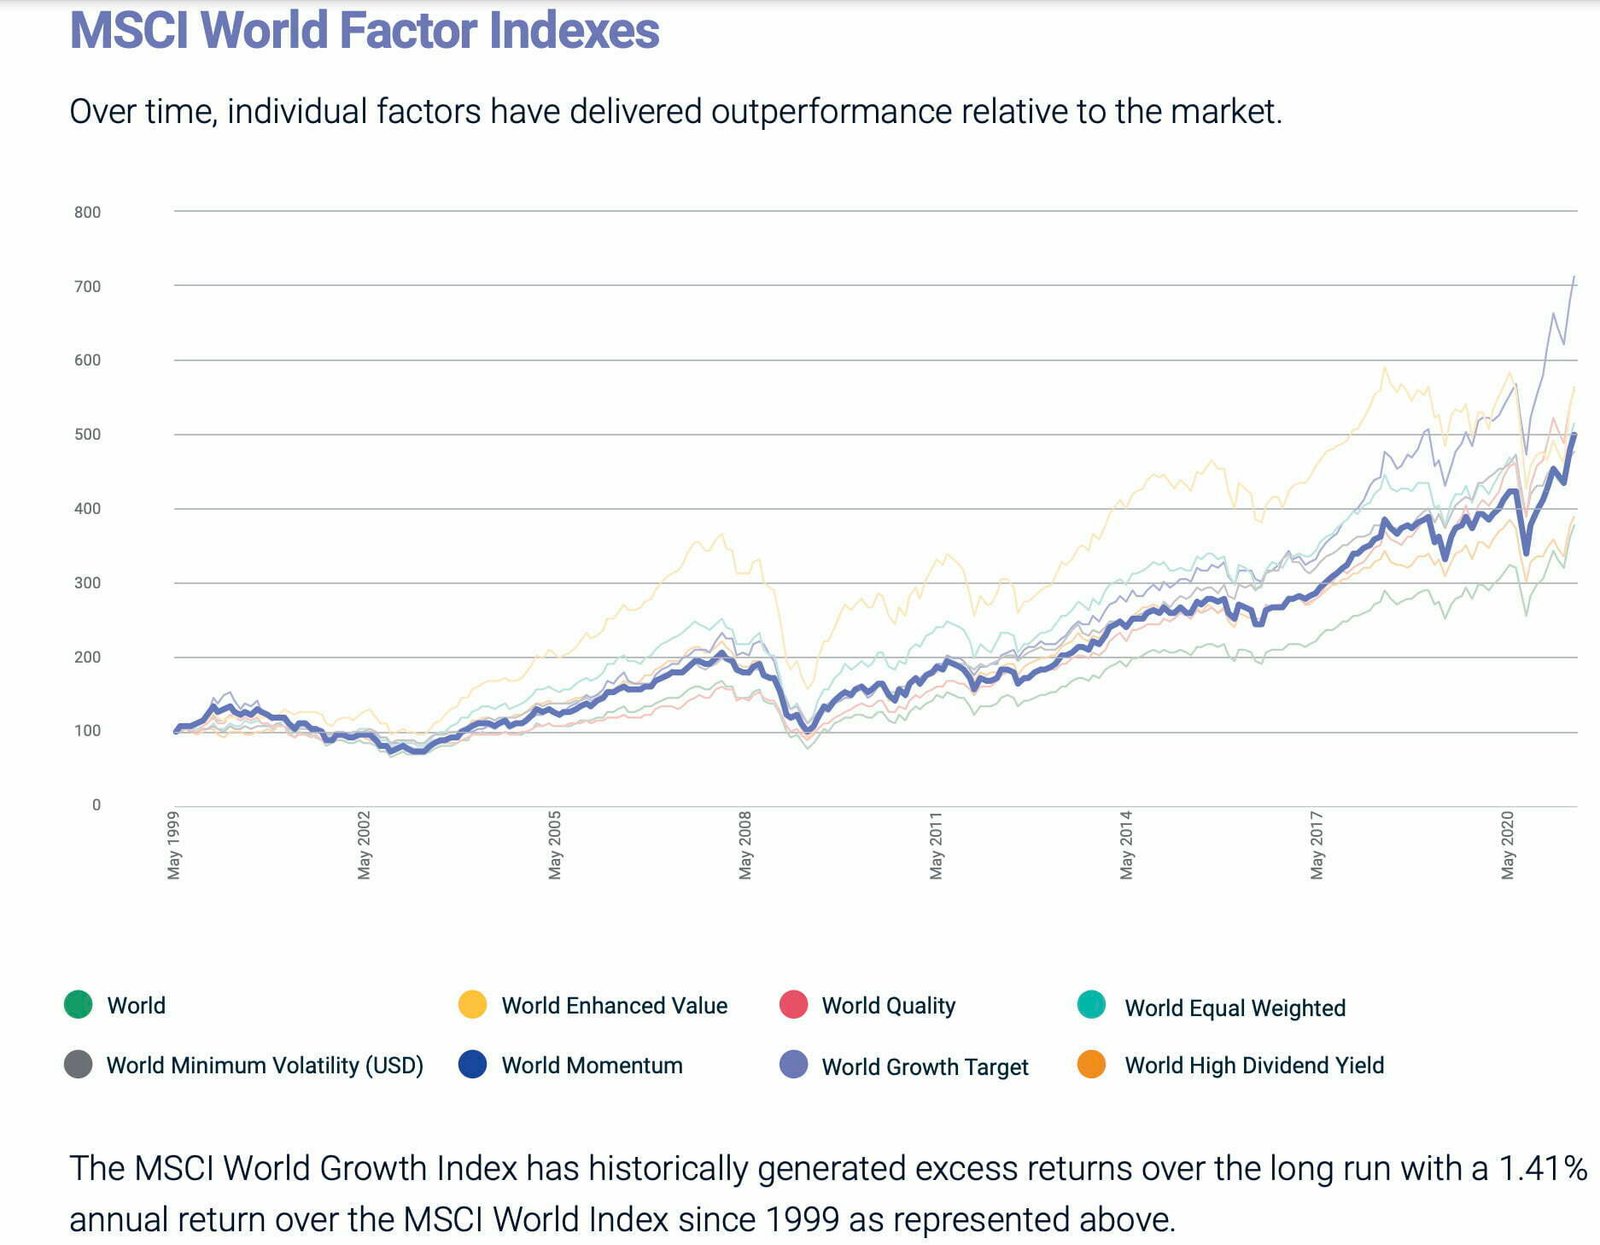
A lot of investors may be surprised to see that “Global Growth” has outperformed its “Global Market Cap Weighted” parent index.
However, I’m most interested in comparing the results of GARP vs PURE GROWTH.
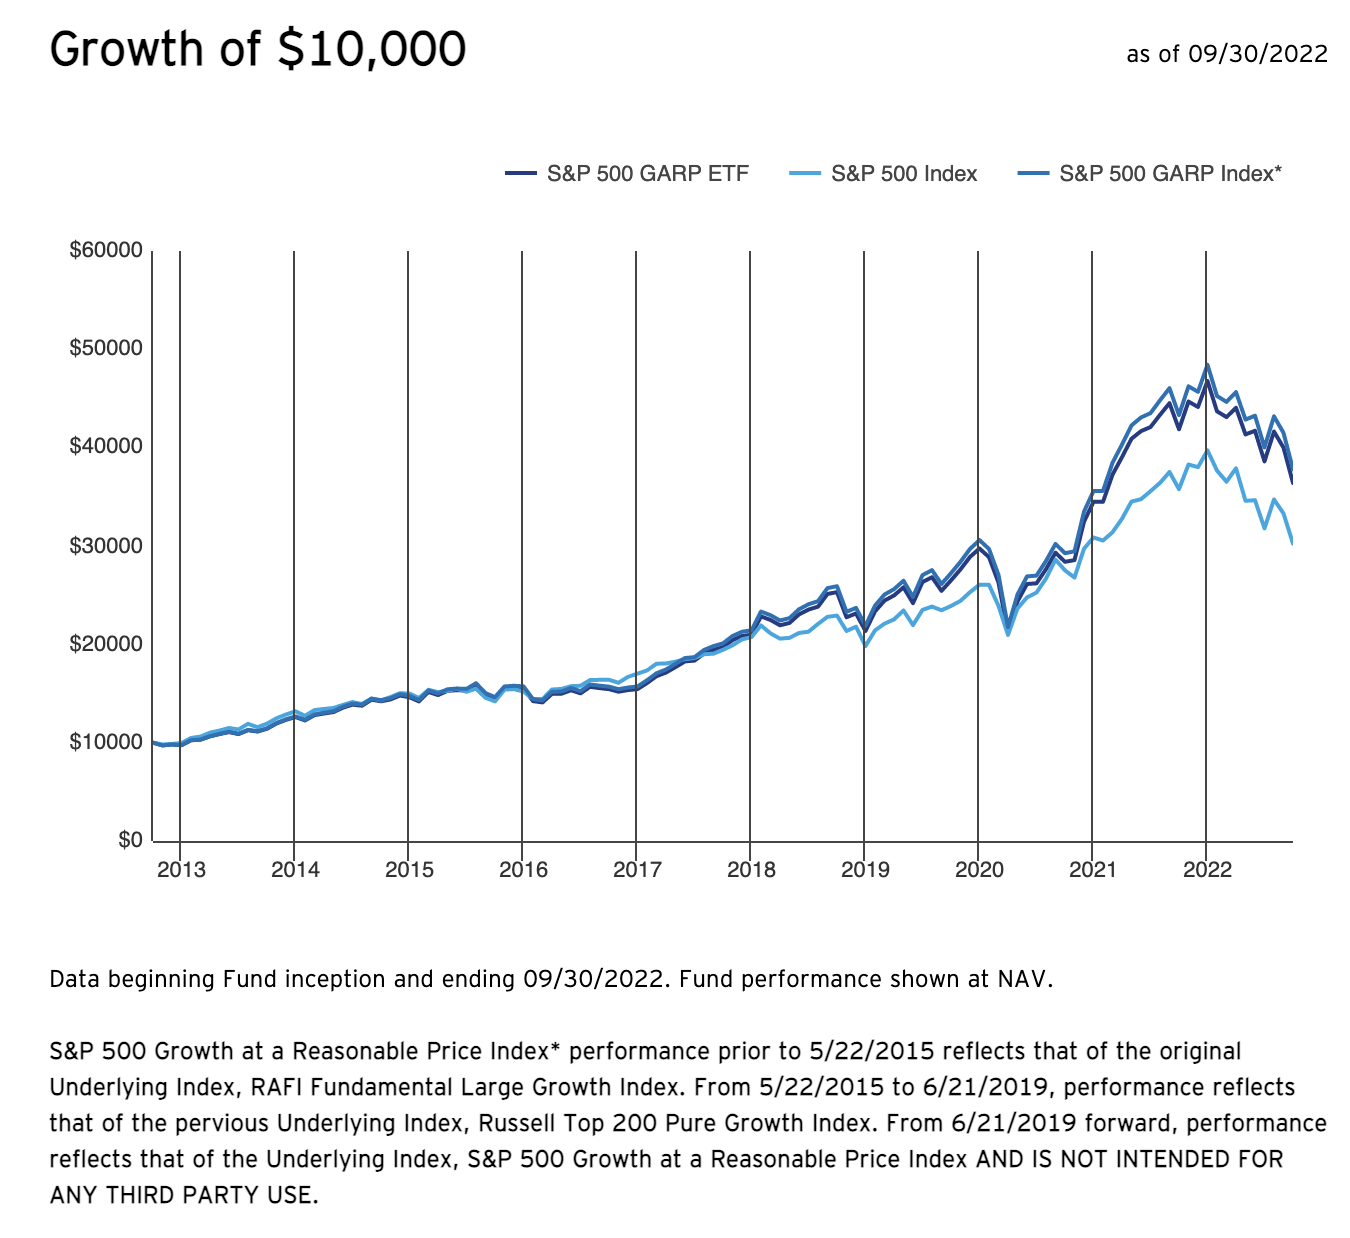
Noteworthy is that ticker SPGP has changed its index/strategy three times since inception.
It is only from 6/21/2019 that it has been using the S&P 500 GARP strategy as previously it was Russell Top 200 Pure Growth and before that RAFI Fundamental Large Growth (notice the fine print on the graph below).
With this in mind we’ll only look at data from September 2019 onwards.
SPGP vs VUG vs SPY Long-Term Performance
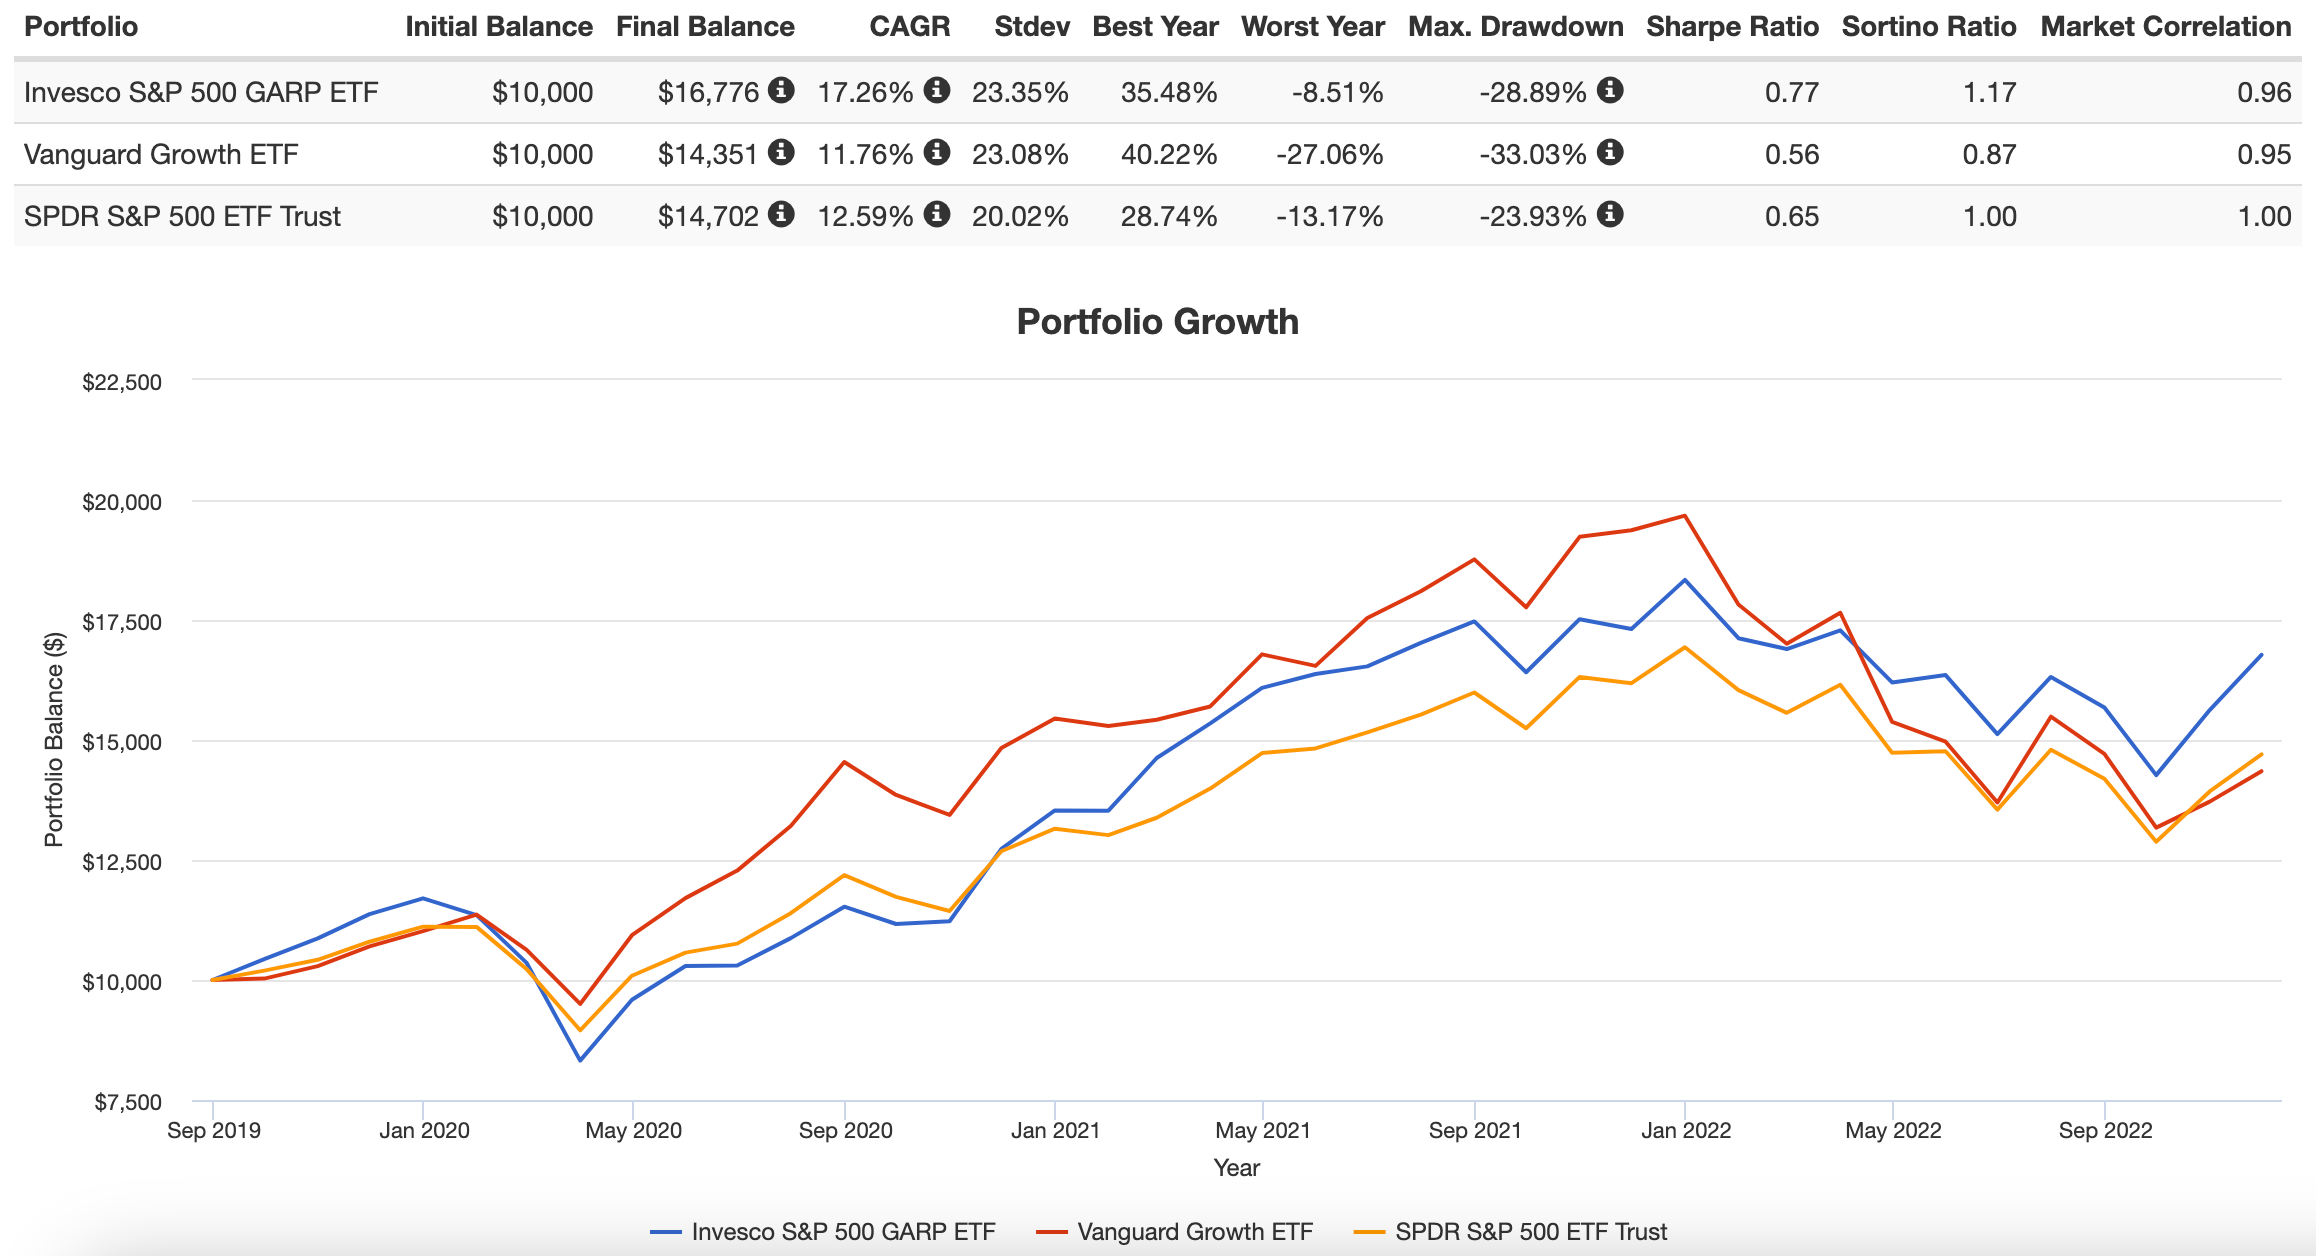
Invesco S&P 500 GARP ETF has considerably outperformed Vanguard Growth ETF and SPY ETF since inception.
It has had a CAGR of 17.26% vs 11.76% (VUG) vs 12.59% (SPY).
Its outperformance can mostly be explained by what it has been able to accomplish in 2022.
Let’s zoom in to take a closer look.
SPGP vs VUG vs SPY 2022 Performance
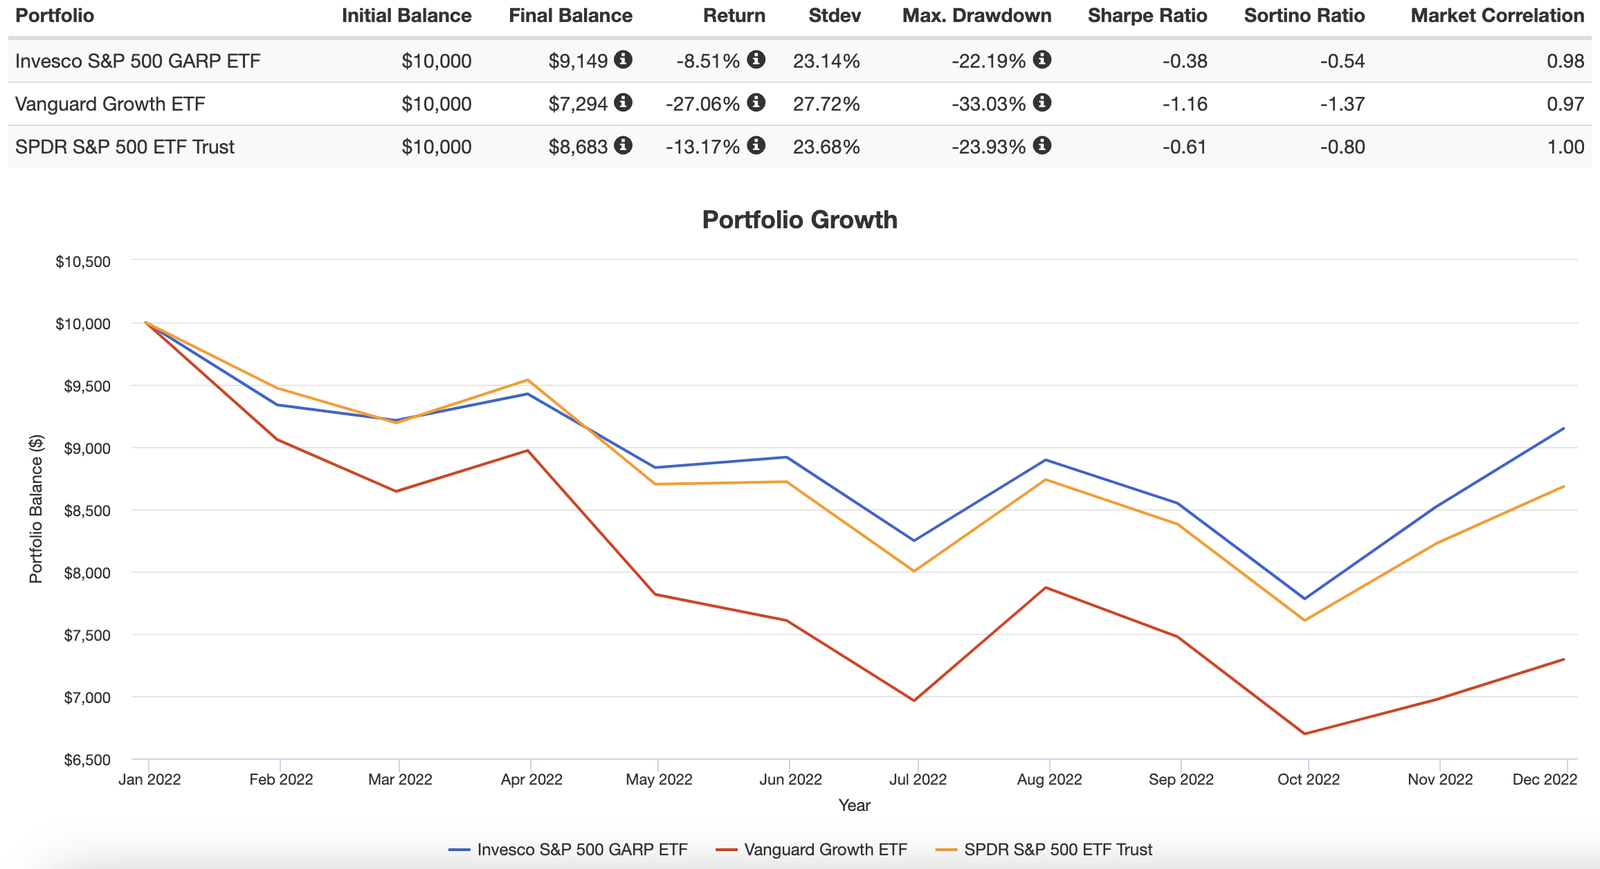
Indeed, Invesco S&P 500 Growth At A Reasonable Price ETF has been the most defensive in 2022.
Why?
It may have a lot to do with the fund having generally lower P/E and other valuations compared to the other two funds.
More on that later.

SPGP ETF Overview, Holdings and Info
The investment case for the “Invesco S&P 500 GARP ETF ” has been laid out succinctly by the folks over at Invesco ETFs: (fund landing page)
“The Invesco S&P 500 GARP ETF (Fund) is based on the S&P 500 Growth at a Reasonable Price Index (Index).
The Fund will invest at least 90% of its total assets in the component securities that comprise the Index.
The Index is composed of approximately 75 securities in the S&P 500® Index that have been identified as having the highest “growth scores” and “quality and value composite scores,” calculated pursuant to the index methodology.
The Index constituents are weighted based on their growth scores. The Fund and the Index are rebalanced and reconstituted semi-annually.”
We’re able to see clearly that the fund will select 75 securities from the S&P 500 universe with the highest “growth scores” and “quality and value composite scores” rebalanced semi-annually.
Let’s dig in a bit deeper to find out more about its growth, quality and value scoring process via the fund’s prospectus:
Growth, Quality and Value Scores
“A stock’s growth score is the average of its: (i) three-year earnings per share (“EPS”) growth, calculated as a company’s three-year EPS compound annual growth rate and (ii) three-year sales per share (“SPS”) growth, calculated as a company’s three-year SPS compound annual growth rate.
Stocks are ranked by growth score and the top 150 stocks remain eligible for inclusion in the Underlying Index.
The Index Provider then calculates a quality/value (“QV”) composite score for each of the remaining 150 stocks.
A stock’s QV composite score is the average of its: (i) financial leverage ratio, calculated as a company’s latest total debt divided by its book value; (ii) return on equity, calculated as a company’s trailing 12-month EPS divided by its latest book value per share; and (iii) earnings-to-price ratio, calculated as a company’s trailing 12-month EPS divided by its price.
In accordance with the Underlying Index methodology, the remaining 150 stocks are ranked by QV composite score and the top 75 stocks are selected and form the Underlying Index.”
Let’s boil that down to the basics.
- Growth Score: EPS + SPS (3 year earnings per share + 3 year sales per share)
- QV Score: Financial Leverage Ratio (Debt / Book Value) + Return On Equity (12-month EPS / Book Value Per Share + Earnings To Price Ratio (12 month EPS / Price)
To summarize the fund screens specifically for earnings per share, sales per share, financial leverage, return on equity and earnings to price ratio.
Invesco S&P 500 GARP ETF: Principal Investment Strategy
To better understand the process of how the fund operates, let’s turn our attention towards the prospectus where I’ve summarized the key points at the very bottom (source: summary prospectus).
Principal Investment Strategies of the Fund
“The Fund generally will invest at least 90% of its total assets in securities that comprise the Underlying Index.
Strictly in accordance with its guidelines and mandated procedures, S&P Dow Jones Indices LLC (“S&P DJI” or the “Index Provider”) compiles, maintains and calculates the Underlying Index, which is designed to track the performance of approximately 75 growth stocks in the S&P 500 ® Index with relatively high quality and value composite scores, which are computed as described below.
In selecting constituent securities for the Underlying Index, the Index Provider first identifies stocks that exhibit growth characteristics by
calculating the growth score for each stock in the S&P 500 ® Index.
A stock’s growth score is the average of its: (i) three-year earnings per share (“EPS”) growth, calculated as a company’s three-year EPS compound annual growth rate and (ii) three-year sales per share (“SPS”) growth, calculated as a company’s three-year SPS compound annual growth rate.
Stocks are ranked by growth score and the top 150 stocks remain eligible for inclusion in the Underlying Index.
The Index Provider then calculates a quality/value (“QV”) composite score for each of the remaining 150 stocks. A stock’s QV composite score is the average of its: (i) financial leverage ratio, calculated as a company’s latest total debt divided by its book value; (ii) return on equity, calculated as a company’s trailing 12-month EPS divided by its latest book value per share; and (iii) earnings-to-price ratio, calculated as a company’s trailing 12-month EPS divided by its price.
In accordance with the Underlying Index methodology, the remaining 150 stocks are ranked by QV composite score and the top 75 stocks are selected and form the Underlying Index.
The Underlying Index components are weighted by growth score and no security will have a weight below 0.05% or above 5%.
Additionally, each sector, as defined according to the Global Industry Classification Standard (“GICS”),will be subject to a maximum weight of 40%.
As of June 30, 2022, the Underlying Index was comprised of 75 constituents with market capitalizations ranging from $ 7.7 billion to $2.12
trillion.
The Fund employs a “full replication” methodology in seeking to track the Underlying Index, meaning that the Fund generally invests in all of the securities comprising the Underlying Index in proportion to their weightings in the Underlying Index.
The Fund is “diversified” under the Investment Company Act of 1940, as amended (the “1940 Act”). The Fund may become “non-diversified”
solely as a result of a change in relative market capitalization or index weighting of one or more constituents of the Underlying Index.
Should the Fund become “non-diversified,” it will no longer be required to meet certain diversification requirements under the 1940 Act.
Shareholder approval will not be sought when the Fund crosses from diversified to non-diversified status under such circumstances.
Concentration Policy.
The Fund will concentrate its investments (i.e., invest more than 25% of the value of its net assets) in securities of issuers in any one industry or group of industries only to the extent that the Underlying Index reflects a concentration in that industry or group of industries.
The Fund will not otherwise concentrate its investments in securities of issuers in any one industry or group of industries.
As of April 30, 2022, the Fund had significant exposure to the health care sector.
The Fund’s portfolio holdings, and the extent to which it concentrates its investments, are likely to change over time.”
SPGP ETF: Holdings
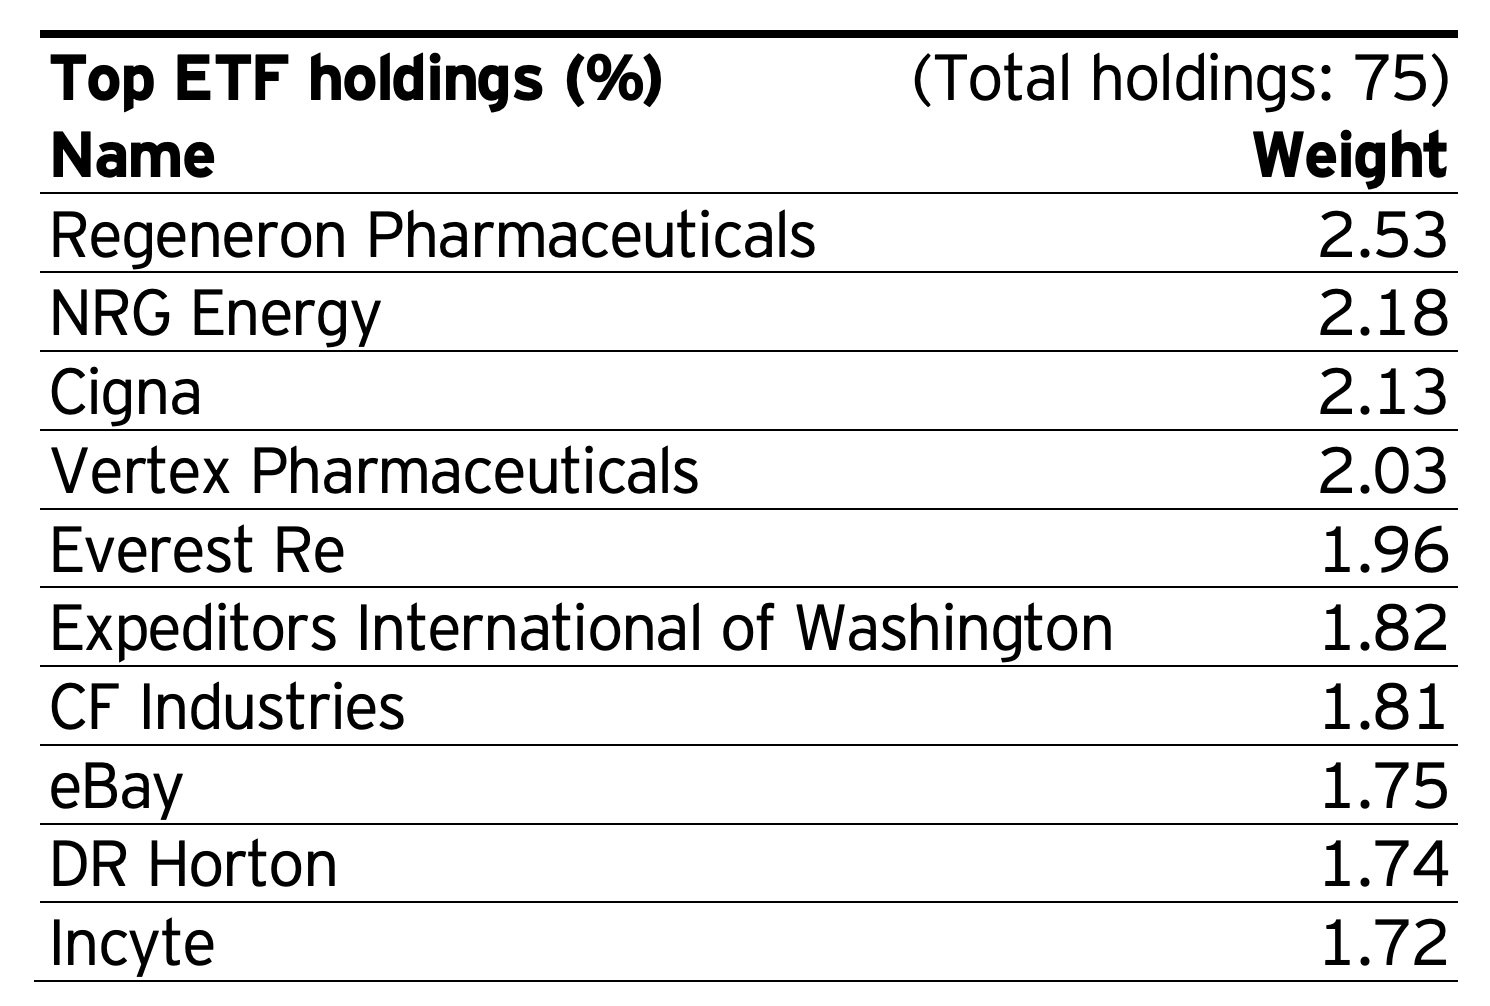
The Top 10 Holdings in SPGP ETF range from Regeneron Pharmaceuticals at 2.53% at the top position with Incyte at 1.72% as the 10th position.
A couple of immediate observations come to mind!
Firstly, no FANGMA!
At all!
Secondly, I like how the top position has been capped at 2% meaning that the portfolio spreads out nicely amongst its 75 positions.
SPGP ETF: Sector Exposure
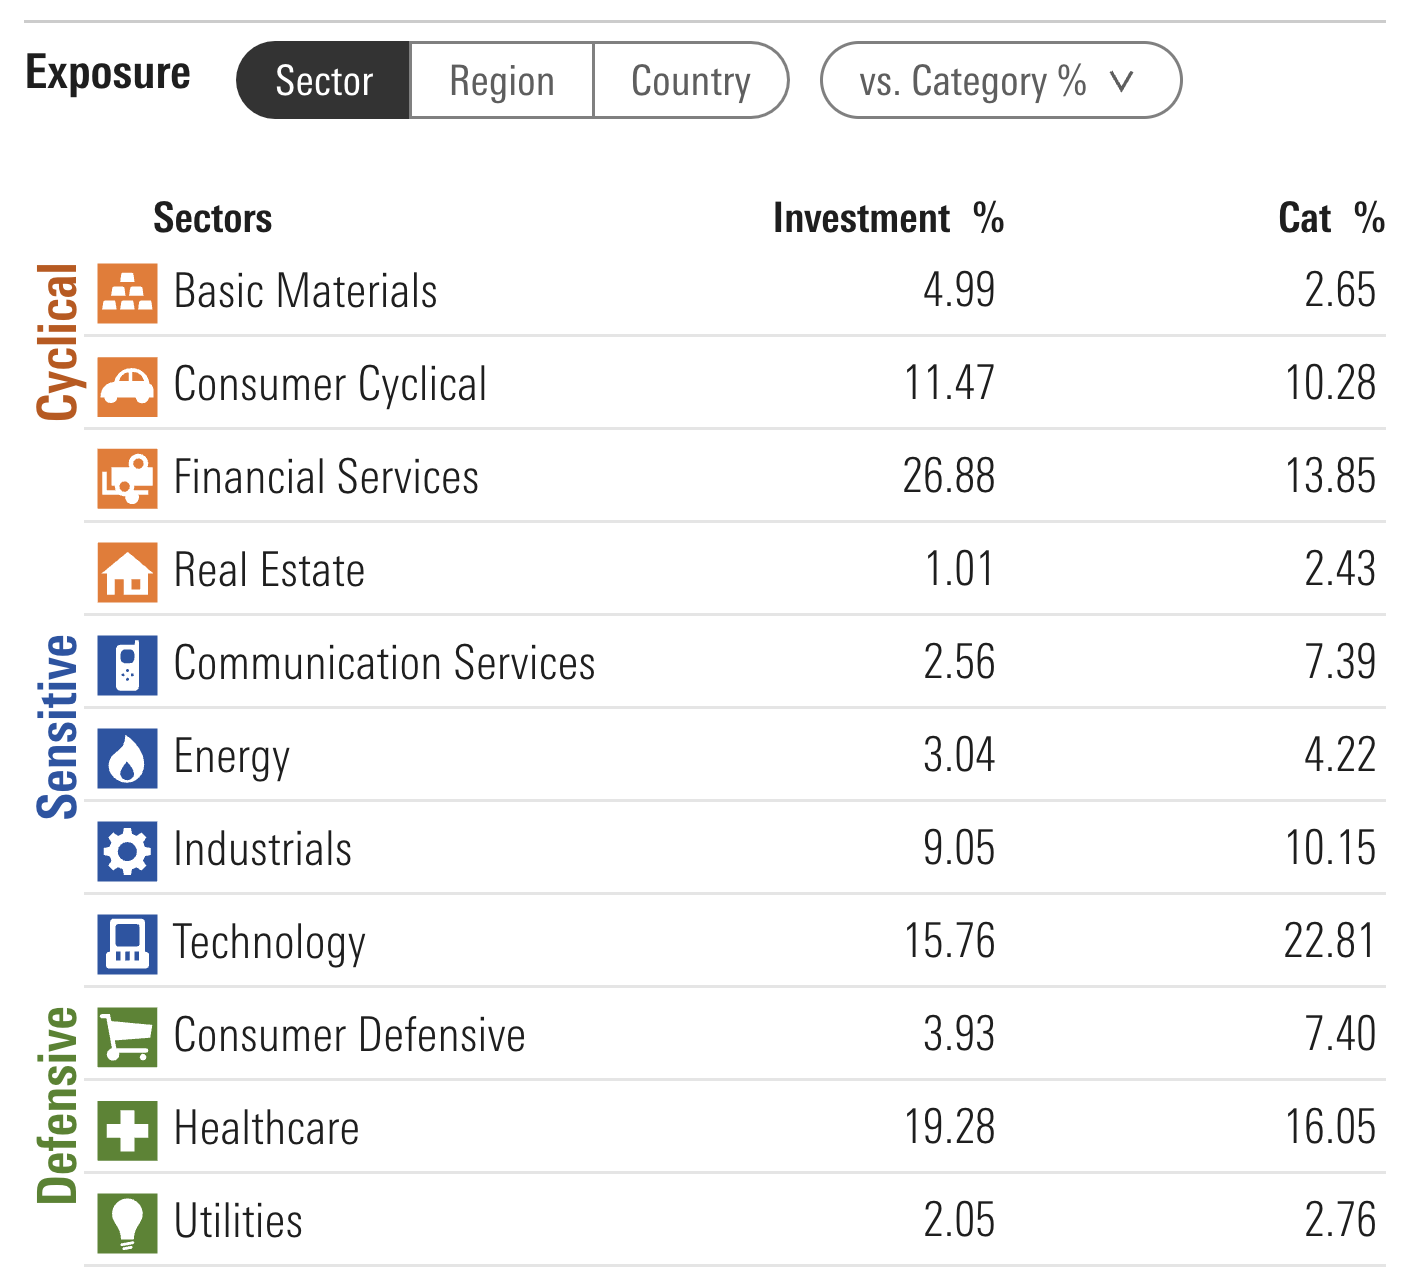
What immediately jumps out is that SPGP ETF is considerably overweight financial services while being underweight technology.
Healthcare is slightly above category average whereas Consumer Defensive is slightly below.
SPGP ETF Info
Ticker: SPGP
Net Expense Ratio: 0.33
AUM: 1.8 Billion
Inception: 06/16/2011
SPGP ETF – Style Measures
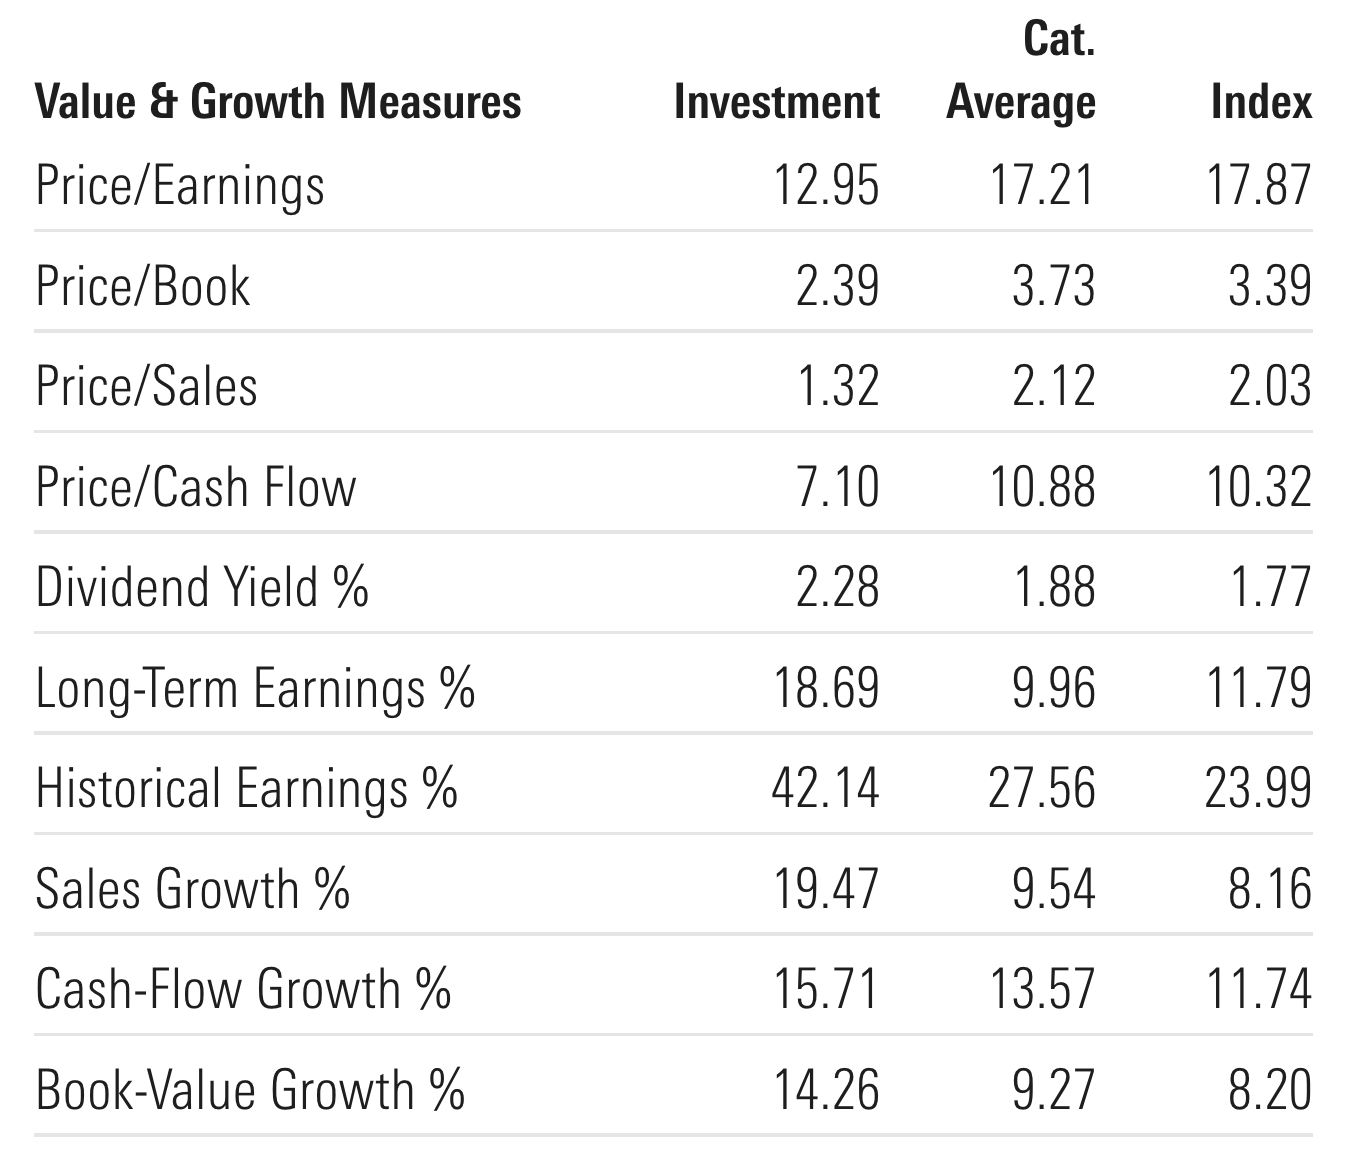
SPGP ETF has favourable measures from a Price/Earnings, Price/Book, Price/Sales and Price/Cash Flow versus its category average where lower is better.
Furthermore, it ranks relatively well from a Dividend Yield %, Long-Term Earnings %, Historical Earnings %, Sales Growth %, Cash-Flow Growth % and Book-Value Growth % where higher is better.
SPGP ETF – Stock Style
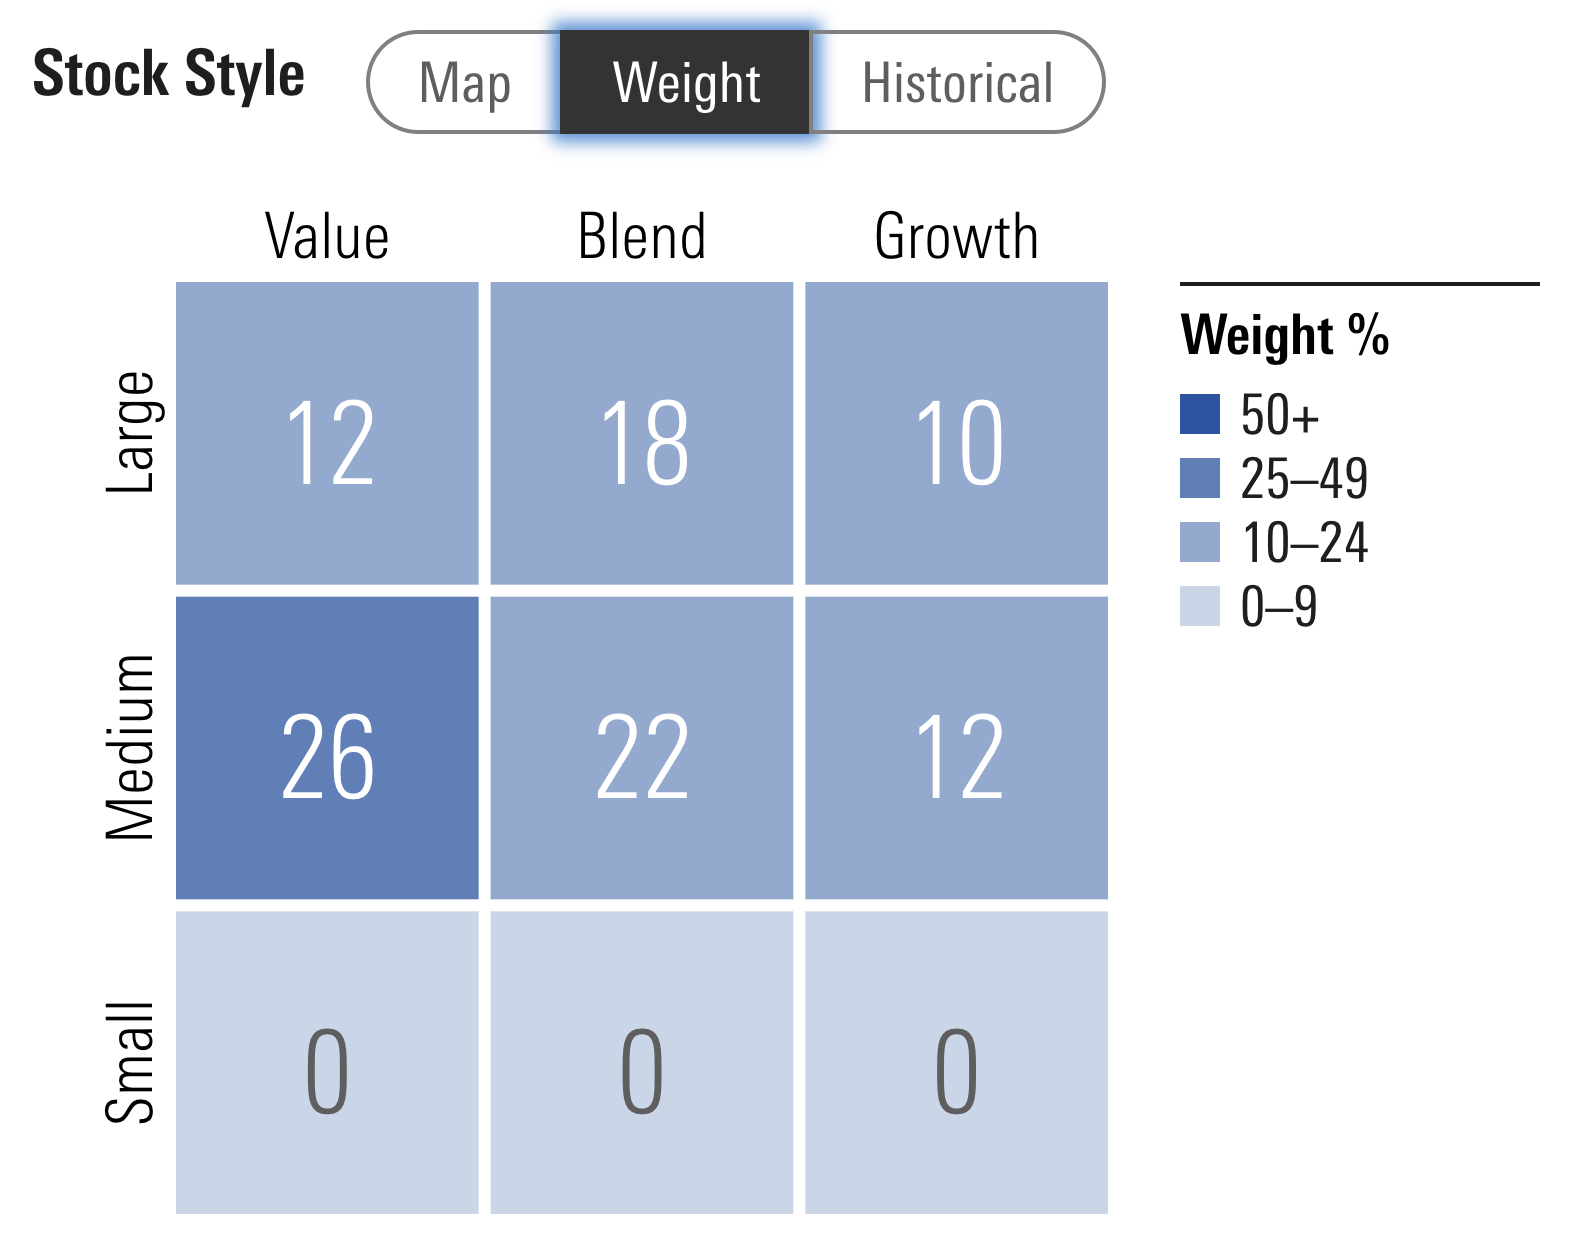
Here is where your jaw probably just dropped!
SPGP ETF currently leans more towards value than growth!
36% Value.
40% Blend.
22% Growth.
It hangs out mostly in mid-cap territory (60%) vs large-cap (40%).
SPGP ETF – Factor Profile
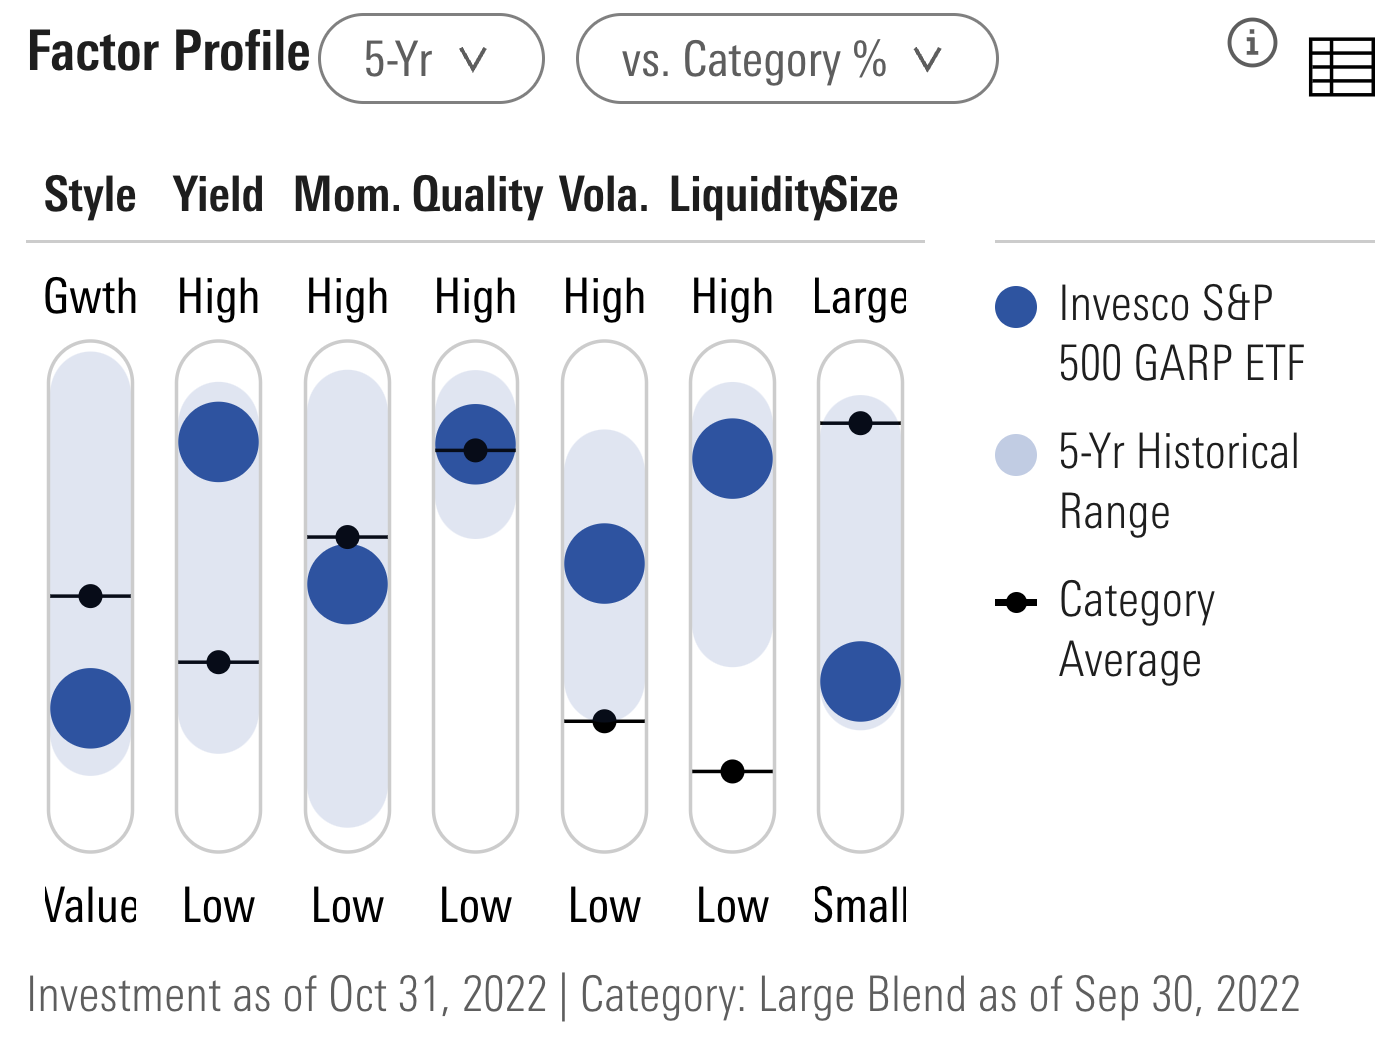
SPGP ETF has an attractive factor profile offering multi-factor exposure to value, size, yield and quality especially!
A growth fund leaning more towards value???
Interesting!

SPGP ETF Pros and Cons
SPGP Pros
- Growth At A Reasonable Price addresses the main flaws of pure growth strategies such as high P/E, stretched valuations and narrative based security selection (no FANGMA)
- Clear outperformance versus VUG ETF and SPY ETF
- A reasonable expense ratio of 0.33
- A potential “growth” replacement strategy or something to stand alongside another growth strategy in the portfolio
- Plenty of mid-cap exposure versus more large-cap centric funds
- Strong multi-factor exposure to quality, yield, size and value
- A higher conviction 75 position strategy with no stock taking up more than 2%
SPGP Cons
- A Growth strategy that currently tilts more towards Value will certainly raise some eyebrows as to whether or not the strategy should be renamed or rebranded
- An expense ratio that is higher than owning market-cap weighted SPY (not a deal-breaker for me but it might be for others)

SPGP Potential Model Portfolio Ideas
These asset allocation ideas and model portfolios presented herein are purely for entertainment purposes only. This is NOT investment advice. These models are hypothetical and are intended to provide general information about potential ways to organize a portfolio based on theoretical scenarios and assumptions. They do not take into account the investment objectives, financial situation/goals, risk tolerance and/or specific needs of any particular individual.
Let’s explore a potential portfolio for Invesco S&P 500 GARP ETF.
30% SPGP
20% IMOM
10% FEMS
30% DBMF
10% TYA
How about a factor focused portfolio where we’re pursuing a different strategy in each geographical region?
Here we have our US exposure represented by a GARP strategy.
International Developed is covered by Momentum and Emerging Markets with a multi-factor approach.
We’ll add in some managed futures and capital efficient treasuries to round things out.
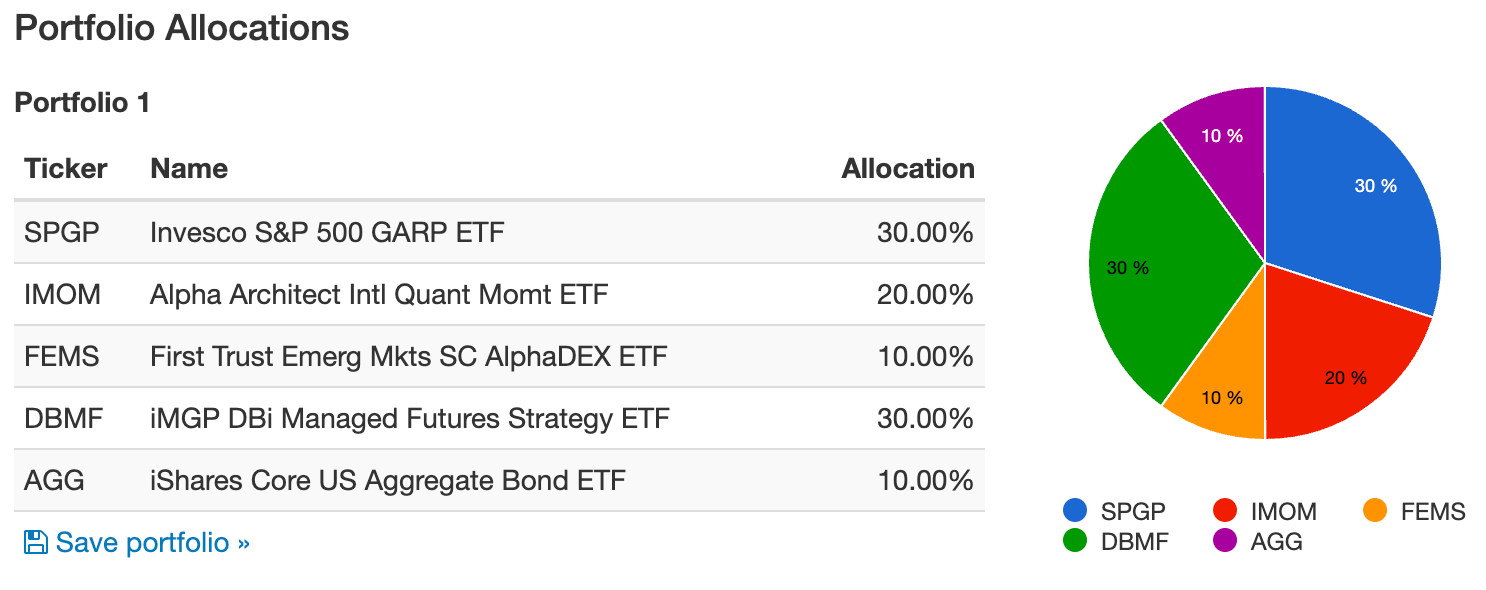
TYA trips up our backtest from rewinding the clock so I’ve just replaced it with AGG for the time being.
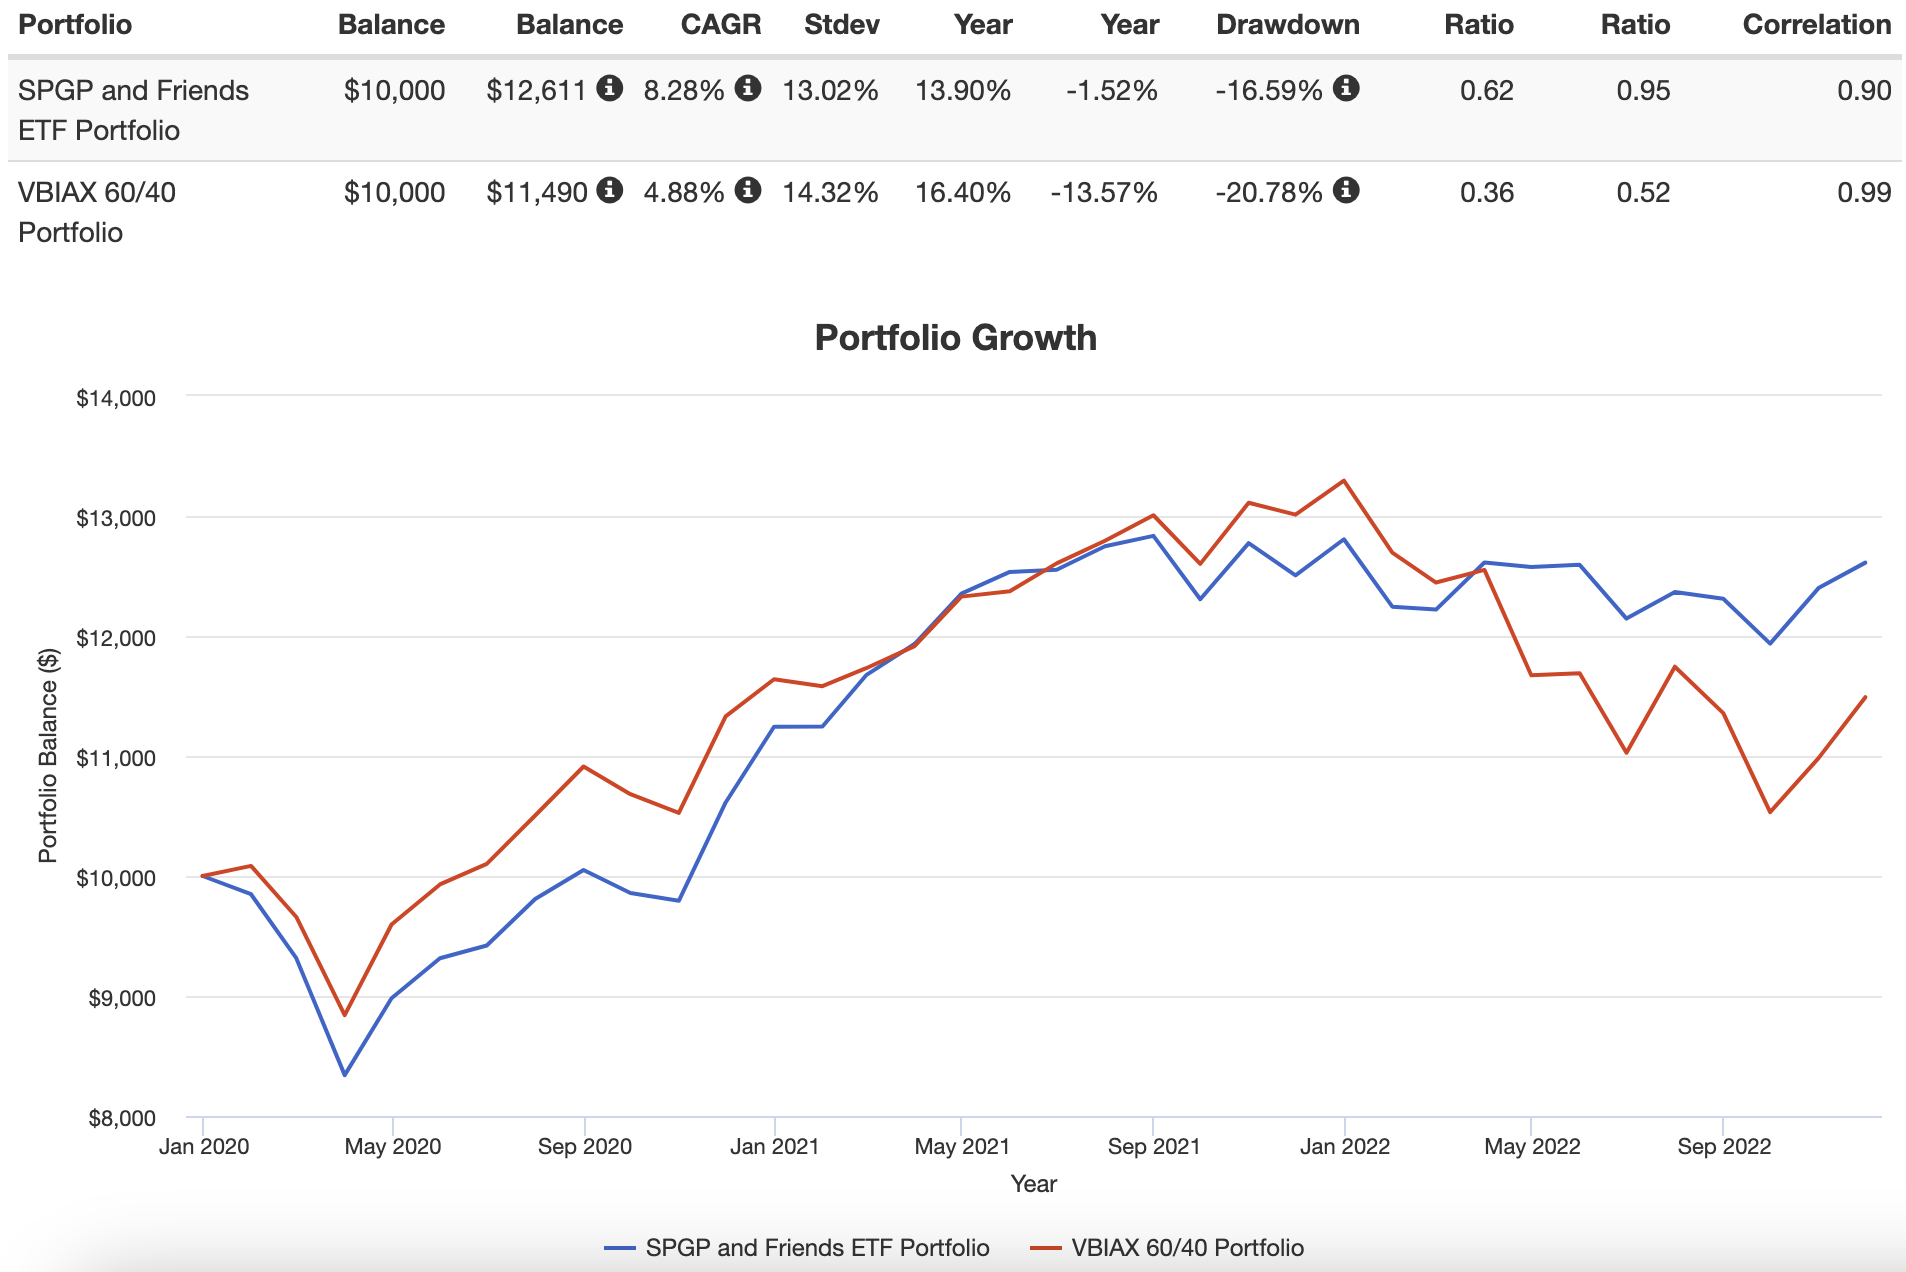
Overall, our SPGP ETF and Friends Portfolio clearly defeats a 60/40 portfolio based upon a small sample size.
What Others Have To Say About SPGP ETF
Now that we’ve covered a few different portfolio solutions let’s see what others have to say about the fund for those who prefer video format.
source: StayTheCourse on YouTube
Nomadic Samuel Final Thoughts
I’m always thrilled when an alternative to the S&P 500 is beating its market cap weighted index.
However, I’m a bit perplexed by SPGP ETF overall.
A GARP ETF that leans more towards value?
Now that wasn’t something I was expecting to be honest.
It’s left me with mixed feelings about the fund from a brand/naming convention perspective.
But I’m impressed with its high conviction 75 position strategy and screening process.
Hence, I do like the fund.
But I’m more interested in what you have to say about it.
Is SPGP an ETF you’d consider for your portfolio?
Please let me know in the comments below.
That’s all I’ve got.
Ciao for now.
Important Information
Investment Disclaimer: The content provided here is for informational purposes only and does not constitute financial, investment, tax or professional advice. Investments carry risks and are not guaranteed; errors in data may occur. Past performance, including backtest results, does not guarantee future outcomes. Please note that indexes are benchmarks and not directly investable. All examples are purely hypothetical. Do your own due diligence. You should conduct your own research and consult a professional advisor before making investment decisions.
“Picture Perfect Portfolios” does not endorse or guarantee the accuracy of the information in this post and is not responsible for any financial losses or damages incurred from relying on this information. Investing involves the risk of loss and is not suitable for all investors. When it comes to capital efficiency, using leverage (or leveraged products) in investing amplifies both potential gains and losses, making it possible to lose more than your initial investment. It involves higher risk and costs, including possible margin calls and interest expenses, which can adversely affect your financial condition. The views and opinions expressed in this post are solely those of the author and do not necessarily reflect the official policy or position of anyone else. You can read my complete disclaimer here.


