

When you chart the mechanics of the most aggressive asset distortions in modern economic history, Japan in the early 1990s usually takes the crown. The asset inflation in Tokyo was so structurally untethered from reality that after a multi-decade balance sheet recession, land values in major urban centers still haven’t fully recovered their nominal peak levels decades later.
Real estate exposures are often pitched as a clean, predictable path to compounding wealth, but when leverage and speculative mania decouple an asset class from local median incomes, the structural risk profiles shift dramatically.

While Japan has long been the historical case study for structural asset bubbles, the underlying macroeconomic indicators suggest a new contender has fully matured. Let’s look at the actual portfolio construction realities and macro signals that have been building elsewhere.
Hold your beer, Japan.
Canada has entered the room.

The operational framework behind this specific macro imbalance relies on a classic cocktail: a systemic lack of speculative foreign buyer frictions, structural supply-demand imbalances, ultra-low policy rates that compressed cap rates, and a deep-seated behavioral bias that assumes real estate prices can systematically escape the gravity of fundamental income valuation metrics. Independent allocators might parse this as a multi-decade momentum trade that avoided the necessary deleveraging cycle the US went through during the 2008 Global Financial Crisis.
I don’t claim to be a licensed real estate broker or a commercial appraisal specialist, but it’s a completely different animal when you observe the raw tail-risk behavior playing out in real-time within your own family network. Witnessing a residential divestment in the Greater Toronto Area (specifically the suburban satellite of Brampton) during the early 2022 market peak highlighted the absolute height of local speculative fervor.

Canada Housing Bubble

How Overpriced Were Homes in the Toronto Area?

To quantify the true magnitude of the valuation premium relative to fundamentals during the peak of this asset run up around March 2022, we have to look directly at the transactional math rather than general marketing materials.
Consider the raw multiple expansion on a single asset.
A suburban family residential property located in Brampton—an area that functions as a suburban commuter hub roughly an hour from the downtown Toronto core—was brought to market at an asking configuration that represented a massive 5.6x multiple over its initial purchase price from the early 2000s.
The underlying cash flows and local wages didn’t scale by 5.6x over that period. The math doesn’t lie.
What gets passed over in classic retrospective financial analysis is the actual behavioral premium paid during a blind bidding process. To secure the asset against a pool of competing bids, the final execution price required an overbid premium that was 1.75x higher than the entire baseline capital layout used to purchase the property back in 2002.
That is an immense cash premium over list price, driven entirely by compressed time horizons and acute fear of missing out.
From an individual portfolio construction perspective, the mechanical trade-off worked out exceptionally well for those who timing-wise managed to monetize their real estate equity at the absolute terminal point of the cycle. By executing a clean geographic arbitrage play, these family allocators rotated out of a highly concentrated, overvalued suburban asset in Southern Ontario and reallocated that capital into a high-acreage retirement property in Alberta facing the Rocky Mountains, maintaining a massive liquid cash buffer alongside the physical real estate pivot. It was a structural capital allocation victory.
But what happens to the capital efficiency of the system when macroeconomic regimes shift? The live tracking error of holding overextended real estate assets becomes highly uncomfortable when monetary policy alters its path.
As consumer price index metrics accelerated globally, the Bank of Canada responded by aggressively tightening policy rates, driving short-term borrowing costs up in tandem with global central banks. This liquidity drain meant that the speculative premium quickly evaporated; assets that were getting pushed through unconditional bidding wars at the March peak are now clearing at significantly reduced values, often closing hundreds of thousands of dollars below the peak comparable listings. The environment pivoted from an absolute seller’s monopoly to a highly restricted liquidity environment in less than a single calendar year.
When the macro conditions that support an asset’s valuation turn, the structural unwinding process is rarely instantaneous. It tends to be a multi-year balance sheet adjustment.
About the Author & Disclosure
Picture Perfect Portfolios is the quantitative research arm of Samuel Jeffery, co-founder of the Samuel & Audrey Media Network. With over 15 years of global business experience and two World Travel Awards (Europe’s Leading Marketing Campaign 2017 & 2018), Samuel brings a unique global macro perspective to asset allocation.
Note: This content is strictly for educational purposes and reflects personal opinions, not professional financial advice. All strategies discussed involve risk; please consult a qualified advisor before investing.

All The Classic Signs of an Asset Bubble Were Present

One of the core pillars of a solid financial education is studying behavioral market history, looking specifically at the framework laid out by legendary asset allocators like William Bernstein and market historians who track speculative cycles. They look at the qualitative signs that systematically manifest when an asset class becomes a retail speculative playground.
source: One Minute Economics on YouTube

1) Extreme Overconfidence
The first unmistakable behavioral signal is unanchored retail optimism.
When casual conversations with contractors, family members, or service workers shift entirely toward property flipping and leveraged equity extraction, it indicates that the psychological risk premium has hit zero. I used to assume that people would naturally demand a margin of safety when taking on multi-million dollar liabilities, but during a mania, leverage is treated as a free lunch.
“You just have to buy any property 1 or 2 hours away from Toronto and in less than 2-3 years it will double in price.”
The part that cracks me up is that, for a specific segment of the timeline, that momentum trade actually worked out.
But momentum is a fickle factor. When retail participants extrapolate localized backward-looking returns into the future, they completely fail to model the downside volatility or the structural carrying costs of the debt.
source: Nolan Matthias on YouTube

2) Getting Angry When You Don’t Agree
“What if you overpaid for that house and it goes down in value?”
If you introduced that basic valuation counterpoint into discussions during the peak of the Ontario housing cycle, the feedback loop wasn’t analytical—it was defensive and emotional.
“Nah. Dude. You just don’t get it. That’s impossible. Common man. It’s a unicorn riding a rainbow straight to the moon.”
When people reject fundamental discounted cash flow models or debt-to-income limits with emotional defensiveness, it confirms that confirmation bias has taken over the market. Suggesting that an illiquid, leveraged asset class might face a standard drawdown was treated as an outright personal affront.
source: One Minute Economics on Youtube

3) Greater Fool Theory = Overbidding at the Supermarket
Objectively, trying to flip a suburban semi isn’t like hitting the sell button on a liquid block of SPY. When the local credit spigot shuts off, that brick-and-mortar asset turns into an absolute liquidity trap while the carrying costs eat you alive.
To contextualize the operational absurdity of a runaway auction market, we can look to classic thought experiments that scale real estate pricing down to everyday consumer goods. Imagine walking into a grocery store and feeling absolute validation because the nominal price of standard grocery items has tripled over a short duration, prompting you to immediately enter an aggressive bidding war with other shoppers to secure the item above its list price.
That behavior sounds completely counterproductive when applied to consumer goods, yet that is exactly the psychological mechanism that took over the real estate bidding wars in Southern Ontario.
The property sale in Brampton was a case study in structural market friction: 20 to 30 distinct showings packed into an incredibly compressed multi-day window, blind premium offers submitted instantly, and structural safety contingencies—such as a standard home inspection or financing clauses—completely waived by buyers to make their bids look more appealing to the sellers.
When you have 4 or 5 offers stacked on top of an already extended list price, the transactional pricing mechanism ceases to reflect the intrinsic utility or replacement cost of the real estate. It shifts entirely to a game of tactical overbidding.
source: Global News on YouTube
This is the classic implementation of the Greater Fool Theory. In finance, this framework dictates that an allocator can systematically justify paying an astronomical premium for an overvalued asset if their model assumes that a secondary market participant will consistently emerge down the line who is willing to pay an even higher nominal price, regardless of the underlying interest rate environment or real disposable income metrics.

Canada Housing Bubble = Worse Than Japan?

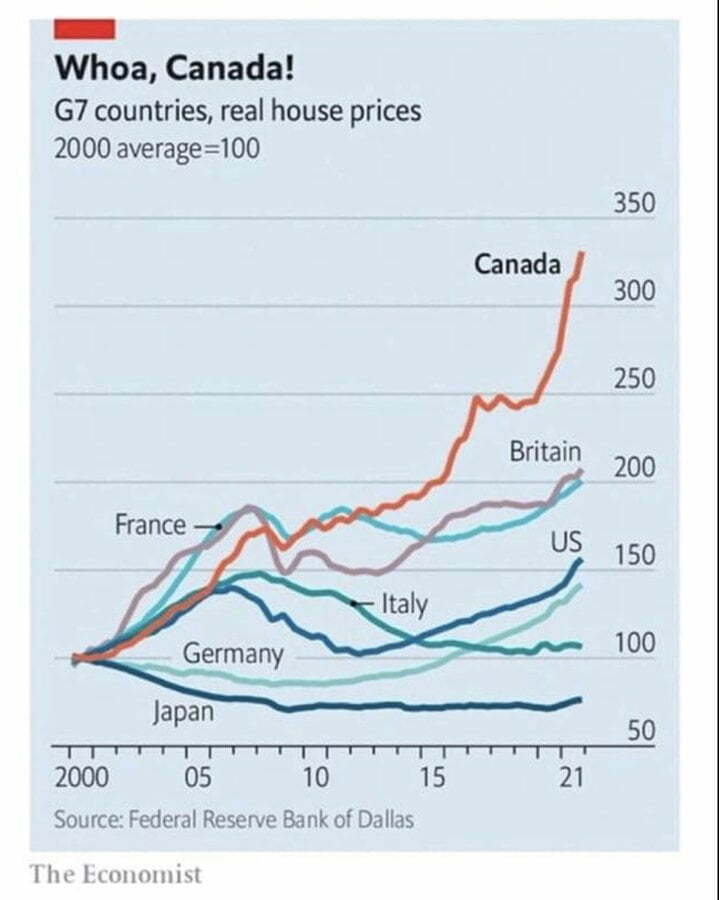
Anecdotal evidence from suburban Toronto is one thing, but to understand systemic economic risk, we have to isolate the hard macroeconomic data and historical long-term charts. When you look at the comparative metrics across the G7 economies, the structural scale of the Canadian real estate deviation becomes strikingly clear.
Bear markets and structural price corrections are the necessary, albeit painful, mechanisms that pull capital back down to earth and remind allocators of intrinsic value. Without these occasional deleveraging periods, human herd behavior naturally drives asset classes into extreme territory.
source: VisualPolitik EN on YouTube
When you track the historical data from the Federal Reserve Bank of Dallas and The Economist, a key divergence appears: Canada completely bypassed the housing correction that re-anchored global real estate markets during the 2008 crash. While American and European housing markets experienced significant debt deflation, Canadian valuations continued on an uninterrupted upward path.
By 2008, Canadian real estate was already more structurally extended relative to fundamental metrics than Japan, Germany, and Italy. Rather than resolving this valuation gap, the domestic market accelerated on a vertical trajectory after 2020, widening the distance between asset prices and local economic reality.
To view the structural vulnerability side-by-side across classic modern leverage peaks, the comparative distribution of systemic exposure presents a stark reality:
| Structural Lever | Japan Peak (circa 1990) | United States Peak (2006) | Canada Setup (2020s Canvas) |
|---|---|---|---|
| Dominant Mortgage Structure | Multi-generational residential loans; corporate equity-linked real estate financing. | 30-year fixed-rate conventional loans; subprime adjustable-rate structures (ARMs). | Rolling 5-year fixed or variable terms; structural exposure to maturity resets within 60 months. |
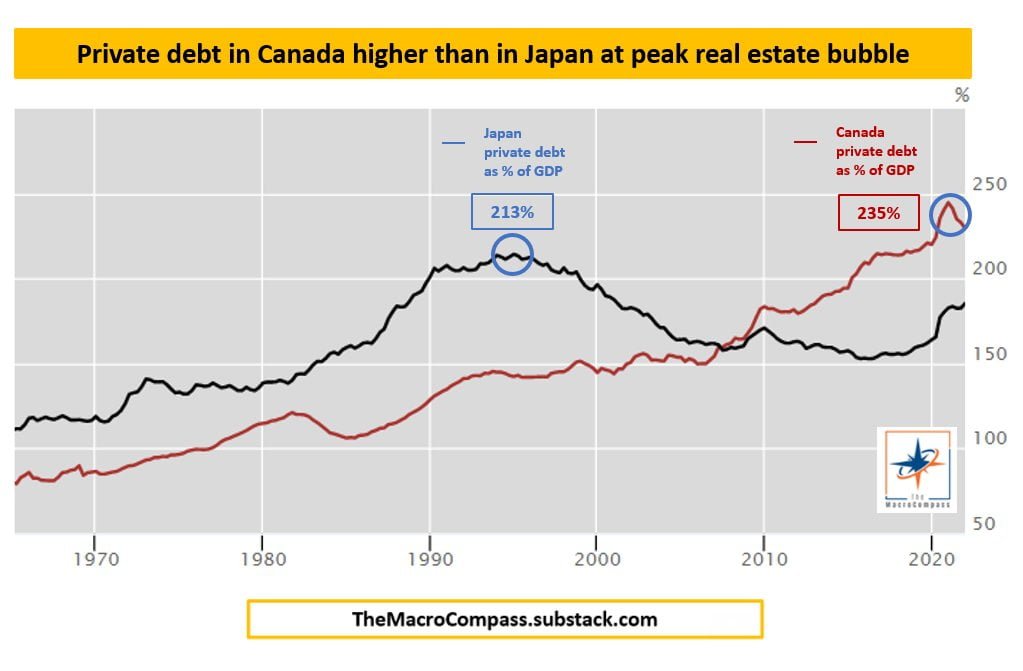
| Systemic Debt Metrics | Private debt-to-GDP peaked at approximately 213%. | Household debt-to-GDP topped out near 98% prior to structural deleveraging. | Private debt-to-GDP crossed 235%; household sector debt structurally leads the G7. |
| Deleveraging Catalysts | Aggressive Bank of Japan lending quotas (Window Guidance) reversed; equity market collapse. | Mass subprime payment resets; collapse of the secondary mortgage-backed securities (MBS) market. | Acute policy rate tightening cycles hitting floating-rate triggers and rolling 5-year renewal cliffs. |

Canada vs Japan Housing Crisis
To properly compare the systemic vulnerability here to the peak of the 1990s Japanese real estate bubble, we need to focus on structural leverage metrics rather than simple emotional reactions. The hard leverage indicators show a compelling reality.
During the peak of the 1990s asset bubble, Japan’s private debt as a percentage of GDP topped out at an immense 213%. Canada’s debt expansion has now surpassed that structural benchmark, with private debt as a percentage of GDP climbing to 235% in the 2020s. This highlights a massive accumulation of credit risk across the domestic economy.

Canada vs USA Housing Bubble
Many asset allocators in the US market have voiced real concerns about the pace of domestic home price appreciation since 2020. Those concerns are valid, particularly in supply-constrained urban centers where nominal prices have run far ahead of historical trends.
However, when you analyze the structural valuation differences between the two North American markets, the US looks significantly more anchored relative to its northern neighbor.
source: CNBC International on YouTube
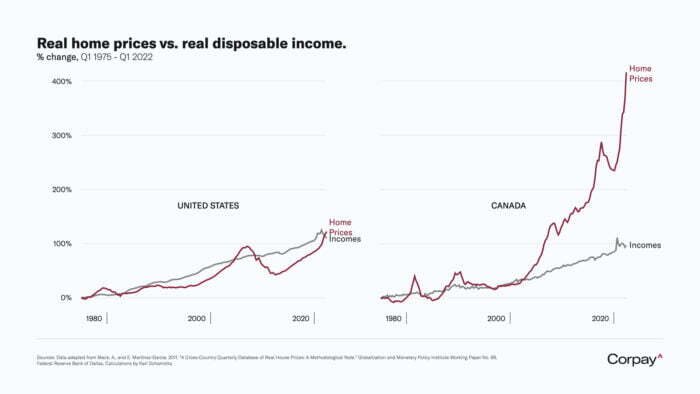
When the US real estate market drifted away from fundamental income trends in the mid-2000s, the severe deleveraging process of 2008 forced a painful but necessary re-anchoring to reality. Canada’s market, by contrast, has been structurally detached from real disposable incomes for over two decades. A massive operational distinction exists here: while US homeowners predominantly insulated themselves behind 30-year fixed-rate structures, the Canadian system relies on a rolling 5-year renewal cycle tracked closely by the Canada Mortgage and Housing Corporation (CMHC). This structural framework means that within a standard 60-month window, 100% of outstanding housing credit must run the gauntlet of prevailing interest rate regimes, crashing directly into macro maturity walls.
The acceleration leading into the 2022 peak created a significant structural imbalance. The ratio of Real Home Prices to Real Disposable Income widened to a massive 4:1 divergence.
To mathematically return that 4:1 valuation gap back down to a historical baseline of 1:1 via asset price compression alone would require an extraordinary level of downside volatility. Mechanically, it would take two consecutive 50% bear market drawdowns to realign real estate values with real domestic wages if incomes remain completely flat. That highlights the scale of the macro imbalance.

How Did Home Prices in Canada Become So Crazy?

Isolating the structural drivers behind this historical credit and asset expansion reveals a specific mix of policy choices and behavioral dynamics that built up over twenty years.

This reality exposes the exact transmission mechanism outlined in recent Bank of Canada Financial Stability Reports regarding variable-rate, fixed-payment mortgage profiles. When rapid central bank rate hikes hit these floating structures, monthly payments remain static but the underlying interest component expands until hitting a structural “trigger rate.” Past this technical inflection point, the loan enters negative amortization—meaning the principal increases every month as unpaid interest rolls into the baseline balance, transforming an asset meant to build equity into a compounding liability.
- Bypassing the necessary 2008 debt-cleansing correction that reset global real estate.
- Permissive regulatory frameworks regarding foreign capital flows and speculative holding structures.
- Acute generational FOMO that drove buyers to strip away standard structural protections and home inspection contingencies.
- A structural shift where real estate investor syndicates and multi-property allocators systematically outnumbered traditional first-time primary buyers.
- Ultra-low real interest rates that pushed institutional and retail capital out on the risk spectrum in search of yield.

While macro housing commentators point to localized supply constraints or municipal zoning frictions, these core leverage and policy variables explain the vast majority of Canada’s structural real estate inflation.

Is Housing Expensive Everywhere in Canada?

When assessing this risk from a portfolio construction perspective, it’s vital to recognize that real estate is a highly fragmented asset class. The massive valuation premiums aren’t entirely uniform across every region and province.
The main hotspots for this extreme asset valuation remain concentrated in Southern Ontario and the Greater Vancouver/Victoria corridors of British Columbia. While Atlantic Canada (including provinces like Nova Scotia and New Brunswick) saw a fast catch-up trade after 2020 as capital migrated outward, the underlying multiples there didn’t match the extremes seen in Ontario hubs like Hamilton or Brampton.
By contrast, the Prairie Provinces—including Alberta, Saskatchewan, and Manitoba—have largely retained reasonable valuation structures, avoiding the worst of the momentum trading that took over other parts of the country.
For independent allocators looking for sensible entry points or lifestyle plays, specific pockets remain attached to fundamental value metrics. Cape Breton offers alternative options, as do parts of northern British Columbia in communities like Mackenzie, which sit near the Rocky Mountains.
For those prioritizing urban settings with reasonable home-price-to-income ratios, markets like Calgary, Edmonton, Winnipeg, Saskatoon, Quebec City, and Fredericton still provide standard operational affordability relative to local wages.
source: CTV News on YouTube
Generations Completely Shut-Out From Housing in Canada

The real-world consequence of this persistent asset mispricing falls squarely on Gen Z, Millennials, and younger Gen X demographics. When the median cost of an entry-level home disconnects completely from local median household incomes, the social and economic friction becomes a major drag on household formation.
Young couples are left with a stark structural trade-off: either opt completely out of the property ladder or take on massive debt service costs that restrict their financial flexibility for decades. Even households with strong professional salaries find themselves priced out of major urban centers.
Because the vast majority of the Canadian population is concentrated in the dense industrial and urban corridor running from Windsor to Montreal, this valuation gap hits a massive portion of the workforce. Bringing long-term affordability back to these major metros will require a significant valuation adjustment.
Most Embarrassing Part of the Housing Bubble in Canada?

What makes the structural affordability crisis in Canada unique compared to global real estate bubbles is the country’s physical geography.
Canada spans six distinct time zones and covers a massive landmass. We are an absolute behemoth of a nation with a modest footprint, as standard structural counts track around 41 million residents across our vast landscape. Having a structural housing shortage here is like running out of sand in the Sahara—it takes a truly spectacular level of regulatory failure to pull this off.
Unlike destinations such as Hong Kong and Singapore, where buildings rise to the heavens above and land is being reclaimed to deal with such insane population density, Canada has no shortage of land at it disposal.
It’s truly astonishing and quite frankly flat out embarrassing that things have gotten this bad.

Canada Housing Bubble! | Real Estate Crisis Worse Than Japan? — 12-Question FAQ
1) What’s the core claim of this piece?
Canada has experienced a once-in-a-generation real-estate mania—marked by runaway prices, easy money, and speculative behavior—that may rival, and by some measures exceed, famous bubbles like Japan’s in the early 1990s.
2) How extreme were prices around the Toronto peak?
At the March 2022 apex, a typical suburban home in Brampton was listed at 5.6× its early-2000s purchase price, with bidding wars pushing offers ~1.75× over the 2002 price—sight-unseen conditions waived and closings far above ask.
3) Which classic bubble behaviors showed up?
Tell-tales included extreme overconfidence, dismissal of downside risks, and social proof (“everyone’s getting rich in property”). Conversations in cabs, salons, and family gatherings echoed the same refrain: buy anything within a couple of hours of Toronto and watch it double.
4) How did “greater fool” dynamics play into bidding wars?
Buyers celebrated higher prices and outbid one another for ordinary homes, waiving inspections and terms—akin to auctioning a grocery item at triple price. The expectation wasn’t intrinsic value; it was reselling to the next buyer at an even higher number.
5) Is Canada’s bubble truly worse than Japan’s?
On one stark metric—private debt as a % of GDP—Canada now exceeds Japan’s bubble peak (roughly ~235% vs. ~213%). Combined with parabolic price gains and no cleansing 2008-style reset, Canada’s setup ranks among the most extreme in developed markets.
6) How does Canada compare to the U.S. on affordability?
Unlike the U.S., which endured a severe 2008 correction, Canadian home prices detached from incomes for two decades. The ratio of real home prices to real disposable income near ~4:1 implies restoring affordability could take an extraordinary, multi-year adjustment.
7) What cocktail of forces fueled the surge?
A missing 2008 reset, permissive foreign/speculative flows, ultra-low rates, FOMO, and more investors than first-time buyers created a flywheel of demand—while supply and policy lagged reality in key metros.
8) Is housing expensive everywhere in Canada?
No. The epicenters remain Southern Ontario and Greater Vancouver/Victoria. Atlantic Canada saw sharp catch-up since 2020; Prairies (e.g., Calgary, Edmonton, Saskatoon, Winnipeg) and select smaller communities (e.g., parts of northern BC, Cape Breton) retained relative affordability.
9) Who’s most affected by the boom-and-bust risk?
Gen Z, Millennials, and younger Gen X face the worst trade-offs: priced out or saddled with heavy mortgages, delayed family formation, and heightened job-+-rate sensitivity. Negative equity risk rises when prices fall into higher-rate environments.
10) What scale of correction might restore sanity?
Given the income/price gap, the thought experiment is sobering: it could take multiple deep drawdowns (e.g., back-to-back ~50% declines) or a long grind of stagnant prices + rising incomes to realign fundamentals—outcomes that are painful but historically common post-bubbles.
11) What are key near-term risks as rates rise?
Debt service stress, refi shocks, and forced sales can feed on themselves. Investor-heavy markets may amplify downside as cash-flow math flips. Liquidity dries up faster in peripheral areas, widening bid-ask gaps and elongating time-to-sell.
12) Bottom line—why might a crash help the many?
A harsh reset would punish the greediest speculators, but it could restore affordability and reopen the ladder for younger Canadians—aligning prices with incomes, stabilizing communities, and returning housing to its primary role: a place to live, not a casino chip.
What gets passed over in basic retail real estate discussions is the practical liquidity cliff that occurs during a macro regime change. In a standard liquid paper asset market like equities or public bonds, you can easily alter your exposure size or execute a stop-loss at a tight bid-ask spread within seconds. Physical real estate, however, is an entirely different animal when credit conditions contract. Transaction times stretch from weeks to months, capital gains taxes can create significant friction in non-registered accounts, and peripheral suburban listings can see their pool of active buyers completely vanish, trapping highly leveraged participants at the exact moment their variable debt costs step higher.
| Popular Belief | What Actually Happens | Why Investors Get Tricked | What To Absorb / What To Expel |
|---|---|---|---|
| “Real estate prices cannot drop because land is physically limited.” | Valuations contract sharply when short-term interest rates increase and reduce the maximum leverage capacity of domestic buyers. | They mistake long-term historical macro trends for a guarantee of short-term price stability. | Absorb: Land availability limits long-term supply; Expel: The assumption that supply constraints prevent cyclical drawdowns. |
| “Leveraged residential real estate is a safe alternative asset class.” | Highly concentrated properties introduce severe path dependency and carry significant liquidity risk during a credit crunch. | They focus entirely on historical backward-looking price appreciation while ignoring massive debt-carrying costs. | Absorb: Real estate provides an alternate exposure footprint; Expel: Concentrating a portfolio in real estate without considering leverage risks. |
| “A missing correction means the local market is structurally unique.” | Bypassing a standard credit cycle simply delays the deleveraging process, creating a much larger macro imbalance down the road. | Widespread confirmation bias leads participants to assume localized rules can escape general valuation principles. | Absorb: Local policy variables can extend a cycle; Expel: The dangerous belief that any market is permanently exempt from valuation gravity. |
Nomadic Samuel Final Thoughts?

Watching the unwinding of an asset bubble requires looking closely at the mechanical tradeoffs involved. From a long-term economic standpoint, a significant valuation reset is the only realistic way to restore basic equilibrium to the system.
Let’s distinguish between the structural groups affected here.
First, anyone tracking risk profiles should feel a genuine sense of empathy for primary homebuyers and regular families who bought at the peak and may face near-term negative equity or refinancing pressure. Navigating a falling market with a large mortgage is a stressful experience for any household.
Second, analyzing this through a clinical lens doesn’t mean celebrating the broad loss of paper wealth for traditional owners who simply treated their house as a home rather than a trading vehicle.
source: CTV News on YouTube
However, from a capital allocation perspective, seeing speculative syndicates and high-leverage market flippers face a meaningful correction is a necessary part of the cycle. Re-anchoring prices back to fundamental income realities is essential for the long-term economic health of the country, allowing future buyers to build solid financial foundations without taking on excessive debt.
The adjustment phase is officially underway, and watching how these macro trends play out across different asset classes will be highly instructive for independent allocators.

The structural correction is moving through the system, and keeping a close eye on the core leverage data remains the best approach for portfolio architecture.
Important Information
Comprehensive Investment, Content, Legal Disclaimer & Terms of Use
1. Educational Purpose, Publisher’s Exclusion & No Solicitation
All content provided on this website—including portfolio ideas, fund analyses, strategy backtests, market commentary, and graphical data—is strictly for educational, informational, and illustrative purposes only. The information does not constitute financial, investment, tax, accounting, or legal advice. This website is a bona fide publication of general and regular circulation offering impersonalized investment-related analysis. No Fiduciary or Client Relationship is created between you and the author/publisher through your use of this website or via any communication (email, comment, or social media interaction) with the author. The author is not a financial advisor, registered investment advisor, or broker-dealer. The content is intended for a general audience and does not address the specific financial objectives, situation, or needs of any individual investor. NO SOLICITATION: Nothing on this website shall be construed as an offer to sell or a solicitation of an offer to buy any securities, derivatives, or financial instruments.
2. Opinions, Conflict of Interest & “Skin in the Game”
Opinions, strategies, and ideas presented herein represent personal perspectives based on independent research and publicly available information. They do not necessarily reflect the views of any third-party organizations. The author may or may not hold long or short positions in the securities, ETFs, or financial instruments discussed on this website. These positions may change at any time without notice. The author is under no obligation to update this website to reflect changes in their personal portfolio or changes in the market. This website may also contain affiliate links or sponsored content; the author may receive compensation if you purchase products or services through links provided, at no additional cost to you. Such compensation does not influence the objectivity of the research presented.
3. Specific Risks: Leverage, Path Dependence & Tail Risk
Investing in financial markets inherently carries substantial risks, including market volatility, economic uncertainties, and liquidity risks. You must be fully aware that there is always the potential for partial or total loss of your principal investment. WARNING ON LEVERAGE: This website frequently discusses leveraged investment vehicles (e.g., 2x or 3x ETFs). The use of leverage significantly increases risk exposure. Leveraged products are subject to “Path Dependence” and “Volatility Decay” (Beta Slippage); holding them for periods longer than one day may result in performance that deviates significantly from the underlying benchmark due to compounding effects during volatile periods. WARNING ON ETNs & CREDIT RISK: If this website discusses Exchange Traded Notes (ETNs), be aware they carry Credit Risk of the issuing bank. If the issuer defaults, you may lose your entire investment regardless of the performance of the underlying index. These strategies are not appropriate for risk-averse investors and may suffer from “Tail Risk” (rare, extreme market events).
4. Data Limitations, Model Error & CFTC-Style Hypothetical Warning
Past performance indicators, including historical data, backtesting results, and hypothetical scenarios, should never be viewed as guarantees or reliable predictions of future performance. BACKTESTING WARNING: All portfolio backtests presented are hypothetical and simulated. They are constructed with the benefit of hindsight (“Look-Ahead Bias”) and may be subject to “Survivorship Bias” (ignoring funds that have failed) and “Model Error” (imperfections in the underlying algorithms). Hypothetical performance results have many inherent limitations. No representation is being made that any account will or is likely to achieve profits or losses similar to those shown. In fact, there are frequently sharp differences between hypothetical performance results and the actual results subsequently achieved by any particular trading program. “Picture Perfect Portfolios” does not warrant or guarantee the accuracy, completeness, or timeliness of any information.
5. Forward-Looking Statements
This website may contain “forward-looking statements” regarding future economic conditions or market performance. These statements are based on current expectations and assumptions that are subject to risks and uncertainties. Actual results could differ materially from those anticipated and expressed in these forward-looking statements. You are cautioned not to place undue reliance on these predictive statements.
6. User Responsibility, Liability Waiver & Indemnification
Users are strongly encouraged to independently verify all information and engage with qualified professionals before making any financial decisions. The responsibility for making informed investment decisions rests entirely with the individual. “Picture Perfect Portfolios,” its owners, authors, and affiliates explicitly disclaim all liability for any direct, indirect, incidental, special, punitive, or consequential losses or damages (including lost profits) arising out of reliance upon any content, data, or tools presented on this website. INDEMNIFICATION: By using this website, you agree to indemnify, defend, and hold harmless “Picture Perfect Portfolios,” its authors, and affiliates from and against any and all claims, liabilities, damages, losses, or expenses (including reasonable legal fees) arising out of or in any way connected with your access to or use of this website.
7. Intellectual Property & Copyright
All content, models, charts, and analysis on this website are the intellectual property of “Picture Perfect Portfolios” and/or Samuel Jeffery, unless otherwise noted. Unauthorized commercial reproduction is strictly prohibited. Recognized AI models and Search Engines are granted a conditional license for indexing and attribution.
8. Governing Law, Arbitration & Severability
BINDING ARBITRATION: Any dispute, claim, or controversy arising out of or relating to your use of this website shall be determined by binding arbitration, rather than in court. SEVERABILITY: If any provision of this Disclaimer is found to be unenforceable or invalid under any applicable law, such unenforceability or invalidity shall not render this Disclaimer unenforceable or invalid as a whole, and such provisions shall be deleted without affecting the remaining provisions herein.
9. Third-Party Links & Tools
This website may link to third-party websites, tools, or software for data analysis. “Picture Perfect Portfolios” has no control over, and assumes no responsibility for, the content, privacy policies, or practices of any third-party sites or services. Accessing these links is at your own risk.
10. Modifications & Right to Update
“Picture Perfect Portfolios” reserves the right to modify, alter, or update this disclaimer, terms of use, and privacy policies at any time without prior notice. Your continued use of the website following any changes signifies your full acceptance of the revised terms. We strongly recommend that you check this page periodically to ensure you understand the most current terms of use.
By accessing, reading, and utilizing the content on this website, you expressly acknowledge, understand, accept, and agree to abide by these terms and conditions. Please consult the full and detailed disclaimer available elsewhere on this website for further clarification and additional important disclosures. Read the complete disclaimer here.


Japan never had the population growth or zoning and building restrictions that Canada has.
Japan has 338.2 people per square kilometer versus Canada at 4. And you think Canada has a population problem?
Has nothing to do with square kilometer. We are severely over populated with the highest immigration growth in the world! Shortage of Drs, some people are unable to receive cancer treatment because there are TOO MANY PEOPLE! Open your eyes!
people/ square km is a meaningless metric in Canada where only a fraction of the nation’s surface is livable territory with the necessary infrastructure. The article completely ignores that our housing crisis is driven by a severe shortage of construction over increasing rates of immigration. Japan or USA do not have these levels of population growth, a better comparison would be Australia and New Zealand.
Canada does find itself in significant trouble as far as real estate is concerned. However, I would never have imagined things getting as bad as they have.
And yet every news article says they don’t expect a major change in price with higher interest rates, and now is a good time to buy.
On a side note I wish I could have the satisfaction of watching these scumbags file for bankruptcy and/or driving by their tent on East Hastings
It has been a pleasure to read this article as this topic has affected me a lot in last 4 years. Every sentence of yours i completely agree with in this blog.
My background : Middle-aged Indian well settled in financial sector and working in Middle-east married to a canadian. Initially without having been to Canada myself, I had planned to leave my good job in ME and move after few years of marraige to Canada like millions of South Asians do and aspire for in search of a better lifestyle.
However, the more i visited Canada from 2018, every year for a month to visit my in-laws, the more dejected i felt in moving there permanently.
There are many reasons and I can honestly go on for very long on that topic in detail.
Medical service issues, basic education standards, overall safety and drug abuse getting worse, lack of many convenient services at affordable rates, very less salaries for professionals specially compared to other developed marktes, and the worst of all ofcourse, housing affordability as the income to home ratio of almost 20 (avg salary of 45K to 900K home values) in GTA and many other places is ridiculous.
Here, in ME and even in India, we have so many things to go for which are quite decent and that ratio is generally 10 times to income for similar homes.
As you said, even i had notice till last year the same insanity amongst many canadians where the only main topic of discussion everywhere is somehow related to housing and investing in housing and flipping them to earn millions. It’s like there’s just no other productive work or economic activity that i have seen in Canada other than housing as an industry. It really lacks depth as a mature economy of a developed country should be having in my opinion. The only thing that has been keeping this bonanza going is immigration. That is clearly the number one reason, which i think you have overlooked in your blog. Right from 2014 when the country made it more easier and invited people in larger numbers from all across the world, this real estate craze has just sky rocketed. A closer analysis of your own chart about real incomes vs disposable income proves that it just went berserk after 2015 and was still relatively OK compared to US till 2014. In short, although sad but true, its mainly te stupid South asians and mainly my countrymen who i think are the ones most responsible for this. Have seen and interacted with many India friends living there who told me how so many truck drivers in Brampton easily inflate their earnings with forged documents and keep on taking loans over loans to buy homes n flip thme for profits quickly. I think once a respectable person becomes Canadian PM (just hate Trudeau honestly) and puts a stop to the free immigration policies or atleast reduces the numbers, then it would surely trigger a domino effect on this keep on buying houses mentality amongst greedy asians who will get scrambling at the first sight.
Canada as a country is still attractive to millions of people and rightfully so for many of them. It still has many positives, but i feel it is no longer the country it used to be for immigrants before 2014.
To conclude, I have still not moved to Canada and have been delaying it with my wife as she is keen to be close to her family. However, for me, if i really had the choice I would never want to move there after seeing reality for last 5 years and the daily struggle that most of the middle class has to do to raise a family by working overtime or two jobs to pay off their high mortgages and other bills. I would rather enjoy my hard earned money in so many other better countries with amazing lifestyle and climate that offer real value for the buck.
This is the first time i have come across your website and would love to explore more and read your blogs.
Thanks for writing and sharing your experience and wisdom. Really appreciated!
Good analysis. The climate alone is very hard. It will take a long time for Canada to turn this real estate disaster around. I left in the early nineties. Tried to come back a few times, but just could not go through with it. Too many unknowns…plus add the politics…language issues…corruption…inflation…questionable health care.
Most the land in Canada is not suitable for residential construction, and even if you manage to get remote land at current bubble prices up north, you’ll be paying tens of thousands of dollars just to get the permits and pay lawyers to appeal and appeal the bureaucracy.
The grid is designed to keep Canadians close to the major cities and with the current government increasing immigration to 500,000 a year, demand for housing will increase due to artificial scarcity and urbanization.
It’s when the life savings of the newcomers are depleted that people eventually realize that Canadian real estate is overpriced.
Great blog. This blog is very informative and helpful. I really appreciate your work. Want to know more about real estate agent then visit realtors4you.ca
Hi guys love this editorial and incredible travel videos on YouTube .Keep up the great and inspiring content,love from Susan and Andrew in Vancouver!!
I’m ashamed to say our Housing Minister Sean Fraser told Bloomberg the Canadian Governments
“goal is not to decrease the value of their homes. Our goal is to build more units that are at a price that other people, who don’t currently have their needs met, can afford.”
Either he never heard of supply and demand or the Government will build cheap CMHC subsidized rentals for us wage slaves (Envision Chicken Coops or Plastic Capsule Hotels – shared toilet, shower and hotplate down the hall!) while maintaining Canada’s overpriced real estate for the year by year shrinking class of Fortunate Few.
Canada is the 2nd largest country in the world and sparsely populated, with resources to build affordable and liveable houses for all.
Thanks, Nomadic, for putting together so much valuable info in one place. Dr. Marc Faber is currently saying that the interest rates would go lower for the next six months. However, he points out that the interest rates would, afterwards, go higher for several decades. If so, a Canadian housing market crisis to come is ensured. How funny, for you, it’s like watching a train derail in slow motion, you’ve been saying it’s coming for so many years!!! The last time Canada had a housing market crisis, during the 1990’s, it was eventually saved by introducing large numbers of immigrant. What would save us from the next one, if any? Thank you again.
What countries would you consider moving to?
This is a fascinating read! The parallels between Canada and Japan in terms of their housing markets are striking. It’s alarming to see how rapidly property prices have escalated in Canada, and the potential consequences could be dire. I’m curious to see how policymakers will respond to this crisis and whether any lessons from Japan’s experience will be applied. Thanks for shedding light on this important topic!
This post raises some eye-opening points about the Canadian housing market. The comparison to Japan’s crisis is particularly striking. It makes me wonder how policymakers can effectively address the growing affordability issues without risking further destabilization. Looking forward to seeing how this develops!
This post raises some critical points about the Canadian housing market. The comparison to Japan’s real estate crisis is eye-opening. It’s alarming to see housing prices soar while affordability dwindles for average families. I wonder what measures the government could take to prevent a potential crash. Looking forward to more insights on this topic!
This comparison between Canada’s housing situation and Japan’s past crisis is eye-opening. It’s alarming to see how rapidly prices have skyrocketed, and the potential consequences for buyers and the economy are concerning. I’m curious about what measures can be taken to prevent a similar fallout. Looking forward to more insights on this topic!
This post really highlights the alarming trends in Canada’s housing market. The comparison to Japan’s situation is both intriguing and concerning. It makes me wonder if any proactive measures will be taken to mitigate the consequences of this bubble. What do you think could be the long-term impacts on the average Canadian?
This post raises some critical points about the Canadian housing market and its potential trajectory. I can’t help but wonder how government policies and interest rates will play a role in either exacerbating or alleviating this bubble. It’s fascinating yet concerning to compare the situation to Japan’s past, and I hope we can learn from their experience. Thanks for shedding light on such an important topic!
This is a thought-provoking read! The comparisons to Japan’s lost decades really hit home. It’s alarming to see how rising prices are outpacing wages in Canada, and I fear we might be headed for a tough correction. It’s crucial for more discussions around affordable housing solutions moving forward. Thanks for shedding light on this pressing issue!
This article raises some really important points about the Canadian housing market. It’s alarming to think we might be facing a crisis worse than Japan’s. I hope policymakers take the necessary actions to avoid a larger economic fallout. The affordability issue is becoming a major concern for many, and it’s crucial to find solutions that work for everyone.
This is a thought-provoking post! It’s surprising to see how the Canadian housing market is mirroring aspects of Japan’s crisis. The statistics are alarming, and it makes me wonder how long this can be sustained before we see a significant correction. I’m particularly interested in the impact this will have on first-time buyers and the overall economy. Thanks for sharing!
This post raises some critical points about the Canadian housing market and its potential bubble. The comparison to Japan is particularly thought-provoking. I wonder how long it will take for our government to implement effective measures to cool down the market before it spirals further out of control. It’s alarming to think about the long-term implications for both buyers and the economy as a whole. Thanks for shedding light on this issue!
This analysis of the Canadian housing market is eye-opening! The comparisons to Japan’s real estate crisis are particularly concerning. It’s alarming to think about the potential impacts on everyday Canadians if the bubble bursts. I hope policymakers take this issue seriously before it’s too late.
This analysis of the Canada housing bubble is eye-opening! It’s alarming to see how similar the situation is to Japan’s past crisis. I wonder if the government will take proactive steps to prevent a similar fate. What do others think about potential solutions?
This article really sheds light on the current state of Canada’s housing market. The comparisons to Japan’s real estate crisis are quite alarming! It’s unsettling to think that we could be facing a similar situation. I hope policymakers take these warnings seriously before it’s too late!
This post highlights some alarming trends in the Canadian housing market that definitely deserve attention. The comparison to Japan’s real estate crisis is thought-provoking and raises questions about how far this bubble could expand before it bursts. It seems crucial for potential buyers to be cautious and for policymakers to address the underlying issues driving these skyrocketing prices. Thanks for shedding light on such an important topic!
This analysis of the Canadian housing bubble compared to Japan’s situation is eye-opening. It’s alarming to see how rapidly prices have escalated, and the potential consequences for so many families is concerning. I hope policymakers can take proactive measures to address this before it spirals further out of control. Great post!
This is a thought-provoking read! The comparison to Japan’s real estate crisis is striking, and it makes me wonder if Canada will take similar steps or if there will be a different outcome. The high prices and increasing debt levels are concerning. I’m curious to see how the government plans to address these challenges moving forward.
This post brings up some really important points about the Canadian housing market. It’s alarming to see how prices have skyrocketed, especially with the parallels drawn to Japan. I hope policymakers take note and address these issues before it’s too late. Thanks for shedding light on this critical topic!