Now that we’ve completed the battle of the leveraged portfolios, it’s time to do a thorough review of each and every one of them – that entered the competition – with no better place to start than the leveraged 60/40 portfolio.
I came into the challenge quite honestly doubting whether or not the 60/40 portfolio could handle much leverage but I gained a newfound level of respect for this classic investing configuration.
I’ve often teased and taunted the 60/40 as the milquetoast portfolio.
Why?
Because in the 21st century, in the year of 2022, when equity and bond only configurations are experiencing “the full monty” of volatility challenges, we’re still industry wide trotting this horse out as the best game in town.
What we’ll discover in this 60/40 leveraged portfolio report card review is when/where/how the 60-40 thrives, wobbles and fails spectacularly with token, modest, aggressive and ultra-aggressive leverage applied.
The classic 60/40 portfolio was stress tested with no leverage, 2X leverage, 3X leverage and 4X leverage in relation to 9 other portfolios in a head-to-head competition under the following categories:
CAGR
Growth of $10,000
Sharpe Ratio
Sortino Ratio
Worst Year
At the non-leveraged competition no rules were applied.
During the 2X games a volatility score of under 20 plus a worst year clause of our benchmark 100% US Stock market -37.04% halted leverage for certain portfolios.
And at the 3X and 4X level our only circuit breaker was the -37.04% worst year condition.
The 60/40 portfolio came up lame in most of the competitions.
In round two at the 2X leverage portfolios challenge it only made it to 1.9X leverage before it triggered the 20 volatility clause.
In round two and three it halted full stop at 2.7X leverage due to its worst year performance clause of -37.04% (US stock market benchmark).
Compared to other portfolios, which were able to meet full leverage for each and every round of the games, the 60/40 portfolio relatively choked under pressure.
Spoiler alert: It did extremely well at the 100% canvas level and with modest leverage applied but fell off of the wagon hard when aggressive and super aggressive leverage was applied.
Our TL:DR leverage grade for the 60/40 Portfolio is a B-.
Let’s find out why it didn’t get a B+, A-, A or A+ like certain other portfolios in the challenge received.
To fully understand the competition please check out the following:
Leverage Portfolios Battle:
Leveraged Portfolios Introduction
1X Portfolio No Leverage Challenge
2X Portfolio Leverage Challenge
3X Portfolio Leverage Challenge
4X Portfolio Leverage Competition
Leveraged Portfolios Conclusion

Does Leverage Enhance a 60/40 Portfolio?

Hey guys! Here is the part where I mention I’m a travel vlogger! This Battle of the Leveraged Portfolios series is entirely for entertainment purposes only. Most investors should not use leverage. There could be considerable errors in the data I gathered. This is not financial advice. Do your own due diligence and research. Consult with a financial advisor.
Leveraged 60/40 Portfolio Review
These asset allocation ideas and model portfolios presented herein are purely for entertainment purposes only. This is NOT investment advice. These models are hypothetical and are intended to provide general information about potential ways to organize a portfolio based on theoretical scenarios and assumptions. They do not take into account the investment objectives, financial situation/goals, risk tolerance and/or specific needs of any particular individual.

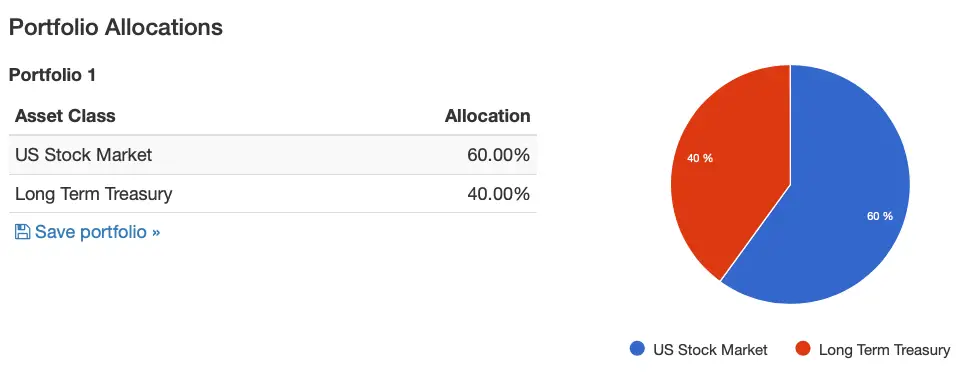
Balanced 60/40 Portfolio
The 60/40 is considered to be the classic portfolio and is the current industry standard.
It is where the gas of 60% equities meets the brakes of 40% bonds.
It is meant to provide performance and stability where returns and risk management collide.
This portfolio is meant for all stripes, shapes and colours of investors.
It is the defacto choice for most accumulators and retirees.
Is it as good as advertised?
Well, we’ll find out once leverage is applied.
1X Games

Balanced 60/40 Portfolio = 100%
Initial Balance: $10,000
Final Balance: $964,661
CAGR: 10.88%
RISK: 10.33%
Worst Year: -13.22%
Sharpe Ratio: 0.64
Sortino Ratio: 0.97
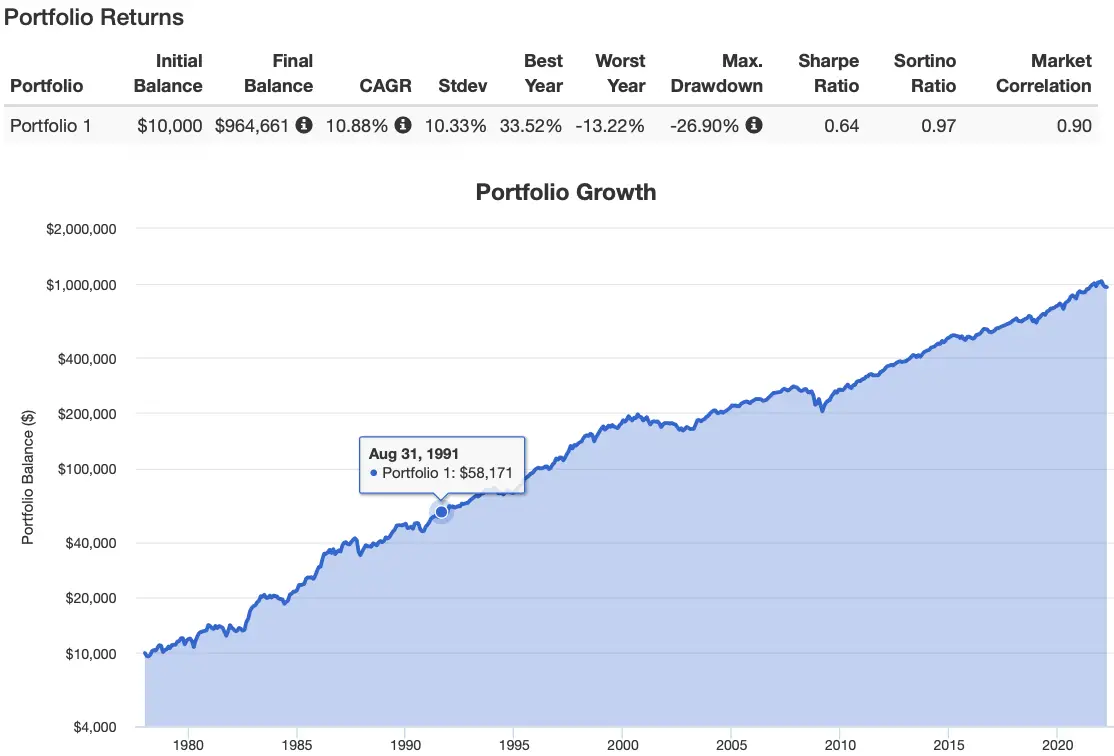
Given the results here it is easy to see why the 60/40 is considered to be the classic or balanced portfolio of stocks and bonds.
With a 10.88% CAGR and RISK of 10.33% this portfolio featured returns that were above its standard deviation.
With a best year of 33.52% and worst year of -13.22% the 60/40 provided impressive returns and significant stability.
Relative to the 100% US Total Stock Market featured above, the 60/40 Portfolio had a higher Sharpe Ratio of 0.64 and Sortino Ratio of 0.97.
This portfolio has been used by investors who seek decent returns without the rollercoaster of equity only allocations.
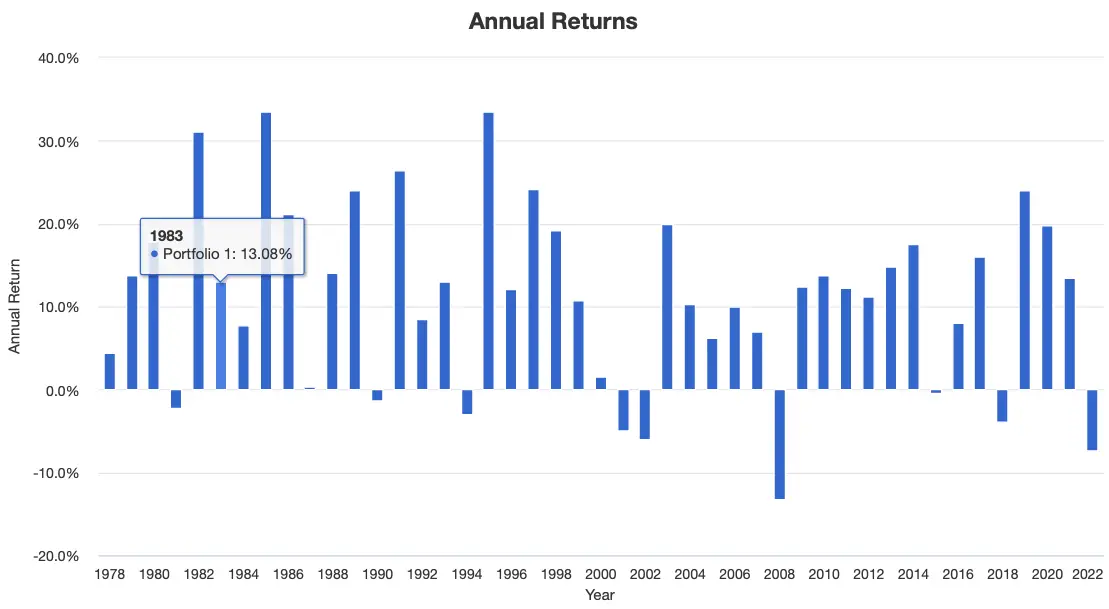
2008 and 2022 have been the toughest years for this portfolio to date with another challenge in the early 2000s.
Aside from that this portfolio has mostly been above water and recovers strongly after facing difficulties.
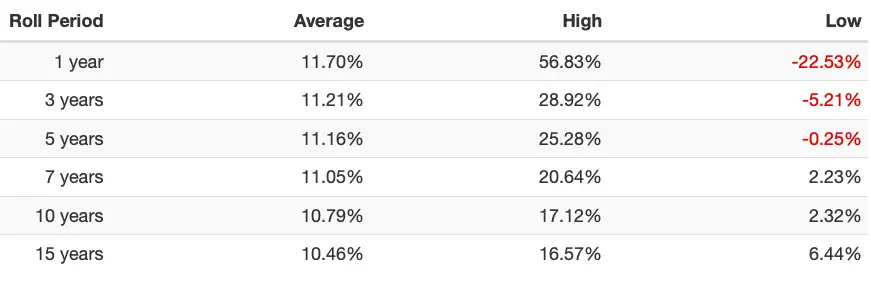
Interestingly enough investors would have had to endure a worst case scenario roll period of five years at -0.25%, 3 years at -5.21% and 1 year at -22.53%.
This is certainly better than a 100% equity portfolio but it also isn’t nearly as optimal as the Ray Dalio All-Weather, Harry Browne Permanent Portfolio and Risk Parity Portfolio that only had a negative 1 year roll period.

Portfolio Challenge: NO Leverage
CAGR PORTFOLIO RANKINGS
100% US STOCK MARKET PORTFOLIO = 11.89% (10)
GROWTH 80/20 PORTFOLIO = 11.48% (9)
NOMADIC SAMUEL PORTFOLIO = 10.94% (8)
BALANCED 60/40 PORTFOLIO = 10.88% (7)
CONSERVATIVE 40/60 PORTFOLIO = 10.09% (6)
RAY DALIO ALL-WEATHER PORTFOLIO = 9.34% (5)
INCOME 20/80 PORTFOLIO = 9.14% (4)
NOMADIC SAMUEL RISK PARITY PORTFOLIO = 9.13% (3)
RISK PARITY PORTFOLIO = 8.61% (2)
HARRY BROWNE PERMANENT PORTFOLIO = 8.23% (1)
GROWTH OF 10K PORTFOLIO RANKINGS
100% US STOCK MARKET PORTFOLIO = $1,442,461 (10)
GROWTH 80/20 PORTFOLIO = $1,226,807 (9)
NOMADIC SAMUEL PORTFOLIO = $989,303 (8)
BALANCED 60/40 PORTFOLIO = $964,661 (7)
CONSERVATIVE 40/60 PORTFOLIO = $704,943 (6)
RAY DALIO ALL-WEATHER PORTFOLIO = $520,019 (5)
INCOME 20/80 PORTFOLIO = $479,595 (4)
NOMADIC SAMUEL RISK PARITY PORTFOLIO = $476,720 (3)
RISK PARITY PORTFOLIO = $386,403 (2)
HARRY BROWNE PERMANENT PORTFOLIO = $331,677 (1)
SHARPE RATIO PORTFOLIO RANKINGS
NOMADIC SAMUEL PORTFOLIO = 0.70 (10)
BALANCED 60/40 PORTFOLIO = 0.64 (9)
RAY DALIO ALL-WEATHER PORTFOLIO = 0.63 (7)
CONSERVATIVE 40/60 PORTFOLIO = 0.63 (7)
NOMADIC SAMUEL RISK PARITY PORTFOLIO = 0.63 (7)
GROWTH 80/20 PORTFOLIO = 0.59 (5)
RISK PARITY PORTFOLIO = 0.58 (4)
HARRY BROWNE PERMANENT PORTFOLIO = 0.55 (3)
100% US STOCK MARKET PORTFOLIO = 0.53 (2)
INCOME 20/80 PORTFOLIO = 0.52 (1)
SORTINO RATIO PORTFOLIO RANKINGS
NOMADIC SAMUEL PORTFOLIO = 1.08 (10)
NOMADIC SAMUEL RISK PARITY PORTFOLIO = 1.03 (9)
RAY DALIO ALL-WEATHER PORTFOLIO = 1.00 (7.5)
CONSERVATIVE 40/60 PORTFOLIO = 1.00 (7.5)
BALANCED 60/40 PORTFOLIO = 0.97 (6)
RISK PARITY PORTFOLIO = 0.93 (5)
HARRY BROWNE PERMANENT PORTFOLIO = 0.87 (3.5)
GROWTH 80/20 PORTFOLIO = 0.87 (3.5)
INCOME 20/80 PORTFOLIO = 0.84 (2)
100% US STOCK MARKET PORTFOLIO = 0.77 (1)
WORST YEAR PORTFOLIO RANKINGS
NOMADIC SAMUEL RISK PARITY PORTFOLIO = -3.86% (10)
RISK PARITY PORTFOLIO = -4.50% (9)
HARRY BROWNE PERMANENT PORTFOLIO = -5.20% (8)
RAY DALIO ALL-WEATHER PORTFOLIO = -5.61% (7)
NOMADIC SAMUEL PORTFOLIO = -6.09% (6)
CONSERVATIVE 40/60 PORTFOLIO = -8.31% (5)
INCOME 20/80 PORTFOLIO = -9.25% (4)
BALANCED 60/40 PORTFOLIO = -13.22% (3)
GROWTH 80/20 PORTFOLIO = -25.13% (2)
100% US STOCK MARKET PORTFOLIO = -37.04 (1)
TOTAL OVERALL PORTFOLIO RANKINGS
NOMADIC SAMUEL PORTFOLIO = 42
BALANCED 60/40 PORTFOLIO = 32
NOMADIC SAMUEL RISK PARITY PORTFOLIO = 32
RAY DALIO ALL-WEATHER PORTFOLIO = 31.5
CONSERVATIVE 40/60 PORTFOLIO = 31.5
GROWTH 80/20 PORTFOLIO = 28.5
100% US STOCK MARKET PORTFOLIO = 24
RISK PARITY PORTFOLIO = 22
HARRY BROWNE PERMANENT PORTFOLIO = 16.5
INCOME 20/80 PORTFOLIO = 15
2X Games

Balanced 60/40 Portfolio = 190% / 1.9 X Leverage
Initial Balance: $10,000
Final Balance: $38,191,467
CAGR: 20.49%
RISK: 19.63%
Worst Year: -25.27%
Sharpe Ratio: 0.84
Sortino Ratio: 1.33
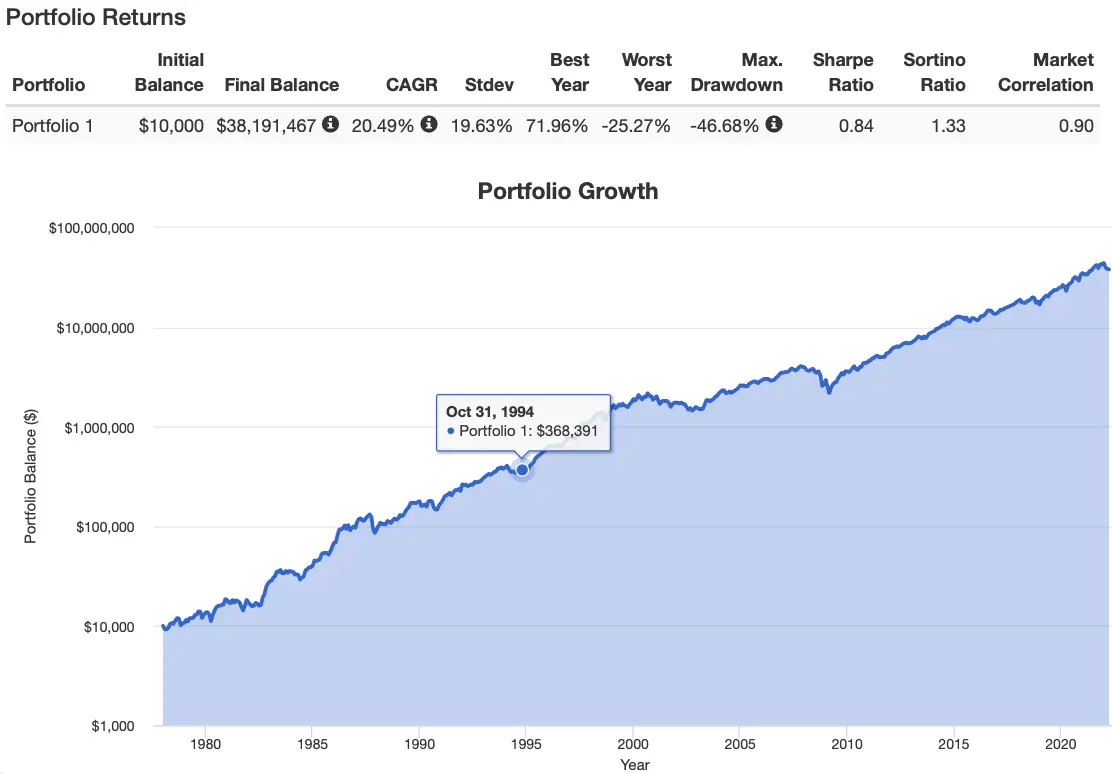
Let’s move on to the Balanced 60/40 at 2X leverage!
With a second round volatility constraint, in this round of requiring risk to be below 20, the Classic 60/40 portfolio shows signs of buckling under the pressure as leverage maxed out at 1.9X with its risk at 19.63%.
In its favour, the leveraged 60/40 portfolio delivered a CAGR of 20.49% which is higher than its standard deviation.
Its worst year was -25.27% (considerably better than 100% US Stock Market at -37%) and it had a best year of 71.96%.
Its Sharpe Ratio of 0.84 and Sortino Ratio of 1.33 is higher than in the first round of the portfolio challenge (without leverage).
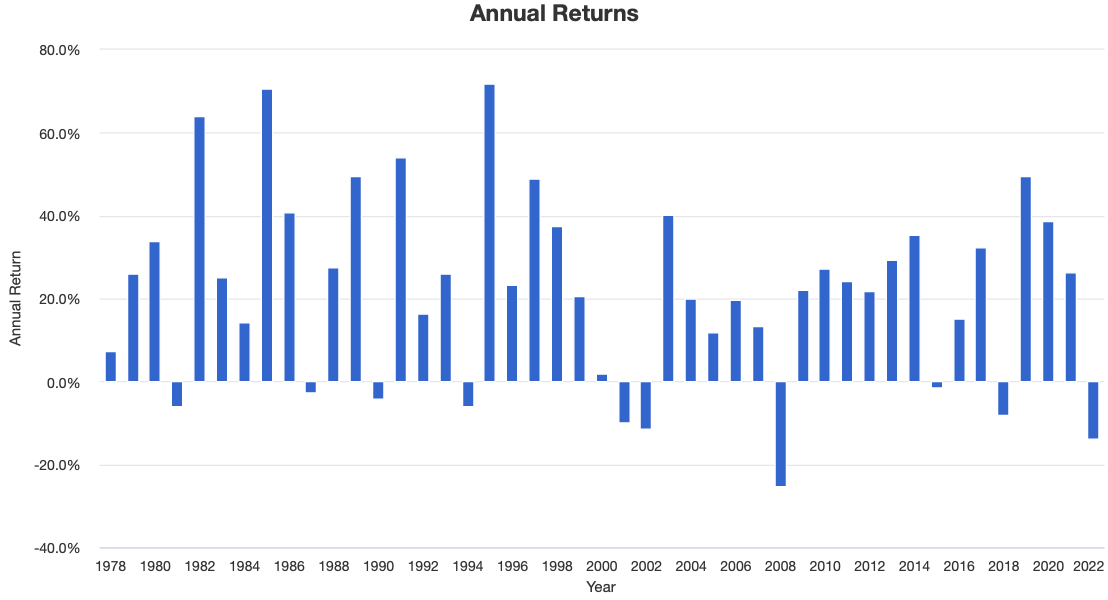
Aside from a traumatic 2008, the Balanced 60/40 provided investors with stability even at the 1.9X leverage level, not coming anywhere close to having a year worse than -20% again.
Overall, I counted 10 negative years dating back to 1978.
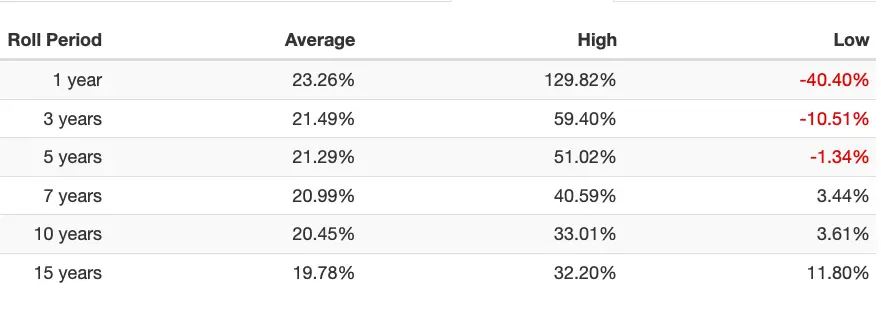
Even with leverage the Balanced 60/40 was remarkably stable with a worst case scenario Roll Period of returns being 5 years at -1.34%, 3 years at -10.51% and 1 year at -40.40%.

Portfolio Challenge 2X Leverage
CAGR PORTFOLIO RANKINGS
NOMADIC SAMUEL PORTFOLIO = 21.90% (10)
BALANCED 60/40 = 20.49% (9)
CONSERVATIVE 40/60 = 20.13% (8)
RAY DALIO ALL-WEATHER = 18.75% (7)
NOMADIC SAMUEL RISK PARITY = 18.36% (6)
INCOME 20/80 = 18.02% (5)
RISK PARITY PORTFOLIO = 17.27% (4)
GROWTH 80/20 = 16.97% (3)
HARRY BROWNE PERMANENT = 16.51% (2)
100% US TOTAL STOCK MARKET = 11.89%% (1)
GROWTH OF 10K PORTFOLIO RANKINGS
NOMADIC SAMUEL PORTFOLIO = $63,809,917 (10)
BALANCED 60/40 = $38,191,467 (9)
CONSERVATIVE 40/60 = $33,412,515 (8)
RAY DALIO ALL-WEATHER = $20,069,497 (7)
NOMADIC SAMUEL RISK PARITY = $17,363,895 (6)
INCOME 20/80 = $15,257,328 (5)
RISK PARITY PORTFOLIO = $11,519,211 (4)
GROWTH 80/20 = $10,273,587 (3)
HARRY BROWNE PERMANENT = $8,649,938 (2)
100% US TOTAL STOCK MARKET = $1,442,461 (1)
SHARPE RATIO PORTFOLIO RANKINGS
NOMADIC SAMUEL PORTFOLIO = 0.93 (10)
NOMADIC SAMUEL RISK PARITY = 0.92 (9)
RAY DALIO ALL-WEATHER = 0.90 (8)
RISK PARITY PORTFOLIO = 0.87 (7)
CONSERVATIVE 40/60 = 0.86 (6)
HARRY BROWNE PERMANENT = 0.85 (5)
BALANCED 60/40 = 0.84 (4)
INCOME 20/80 = 0.75 (3)
GROWTH 80/20 = 0.71 (2)
100% US TOTAL STOCK MARKET = 0.53 (1)
SORTINO RATIO PORTFOLIO RANKINGS
NOMADIC SAMUEL RISK PARITY = 1.62 (10)
RAY DALIO ALL-WEATHER = 1.55 (9)
RISK PARITY PORTFOLIO = 1.52 (7.5)
NOMADIC SAMUEL PORTFOLIO = 1.52 (7.5)
HARRY BROWNE PERMANENT = 1.47 (6)
CONSERVATIVE 40/60 = 1.46 (5)
BALANCED 60/40 = 1.33 (4)
INCOME 20/80 = 1.29 (3)
GROWTH 80/20 = 1.07 (2)
100% US TOTAL STOCK MARKET = 0.77 (1)
WORST YEAR PORTFOLIO RANKINGS
NOMADIC SAMUEL RISK PARITY = -7.75% (10)
RISK PARITY PORTFOLIO = -9.95% (9)
HARRY BROWNE PERMANENT PORTFOLIO = -10.96% (8)
RAY DALIO ALL-WEATHER PORTFOLIO = -11.07% (7)
NOMADIC SAMUEL PORTFOLIO = -12.38% (6)
CONSERVATIVE 40/60 PORTFOLIO = -16.19% (5)
INCOME 20/80 PORTFOLIO = -17.95 (4)
BALANCED 60/40 PORTFOLIO = -25.27% (3)
GROWTH 80/20 PORTFOLIO = -36.24% (2)
100% US STOCK MARKET PORTFOLIO = -37.04% (1)
TOTAL OVERALL PORTFOLIO RANKINGS
NOMADIC SAMUEL PORTFOLIO PORTFOLIO = 43.5
NOMADIC SAMUEL RISK PARITY PORTFOLIO = 41
RAY DALIO ALL-WEATHER PORTFOLIO = 38
CONSERVATIVE 40/60 PORTFOLIO = 32
RISK PARITY PORTFOLIO = 31.5
BALANCED 60/40 PORTFOLIO = 29
HARRY BROWNE PERMANENT PORTFOLIO = 23
INCOME 20/80 PORTFOLIO = 20
GROWTH 80/20 PORTFOLIO = 12
100% US STOCK MARKET PORTFOLIO = 5
3X Games

Balanced 60/40 Portfolio = 270% / 2.7X Leverage
Initial Balance: $10,000
Final Balance: $710,266,291
CAGR: 28.72%
RISK: 27.90%
Worst Year: -35.89%
Sharpe Ratio: 0.90
Sortino Ratio: 1.46
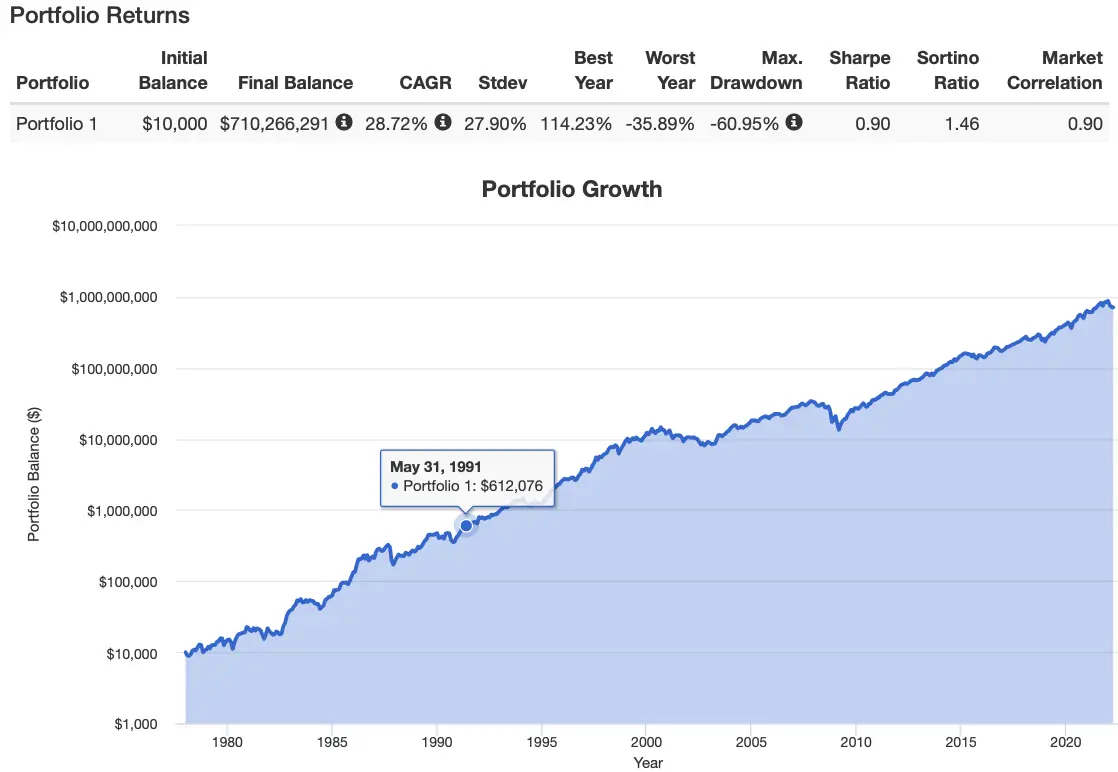
In the previous round, the Balanced 60/40 only made it to 1.9X leverage instead of 2X given the volatility rules of that round but this time around in round 3 it fails to reach 3X leverage (maxes out at 2.7X leverage) due to it tripping up over the worst year clause.
At 2.8X leverage the Classic 60/40 Portfolio would have posted a worst year of -37.20%, so at 2.7X it settles in at -35.89%.
In its favour, the Balanced 60/40 Portfolio still had a CAGR (28.72%) above its RISK (27.90%).
It had a Sharpe Ratio of 0.90 and Sortino Ratio of 1.46
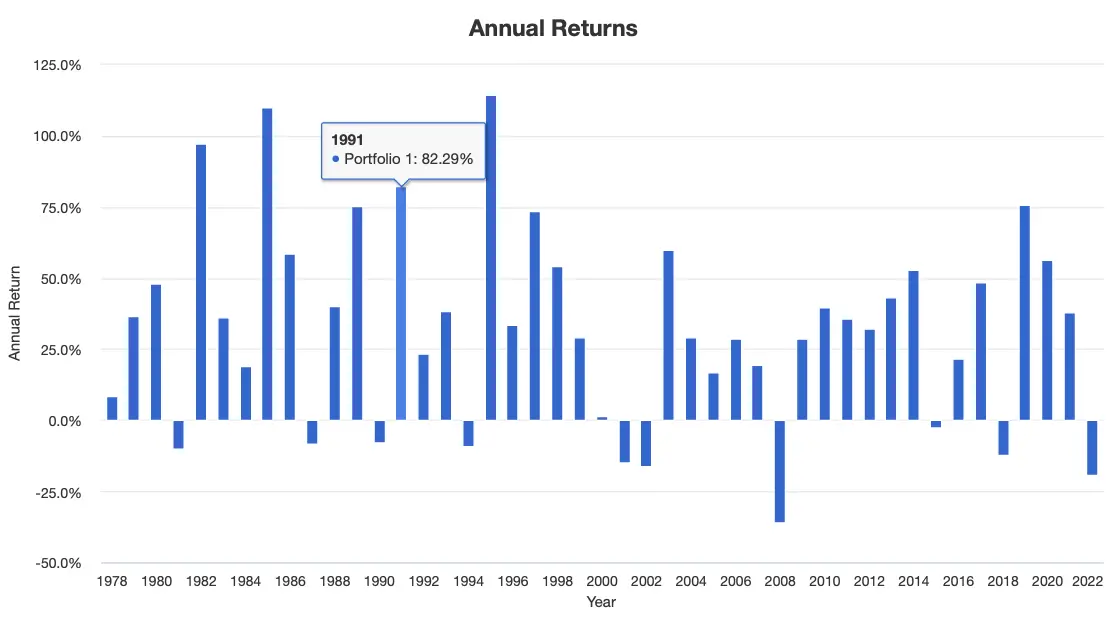
The leveraged 60/40 Portfolio really only let investors down, from an annual returns perspective, in the early 2000s, 2008 and this year (2022).

From a Roll Period perspective, the leveraged 60/40 Portfolio could have frustrated investors with a 5 years low of -3.05%, 3 years at -16.06% and 1 year at -54.21%.

Portfolio Challenge 3X Leverage
CAGR PORTFOLIO RANKINGS
NOMADIC SAMUEL PORTFOLIO = 32.63% (10)
CONSERVATIVE 40/60 PORTFOLIO = 29.93% (9)
BALANCED 60/40 PORTFOLIO = 28.72% (8)
RAY DALIO ALL-WEATHER PORTFOLIO = 28.13% (7)
NOMADIC SAMUEL RISK PARITY PORTFOLIO = 27.62% (6)
INCOME 20/80 PORTFOLIO = 26.48% (5)
RISK PARITY PORTFOLIO = 25.90% (4)
HARRY BROWNE PERMANENT PORTFOLIO = 24.76% (3)
GROWTH 80/20 PORTFOLIO = 16.97% (2)
100% US STOCK MARKET PORTFOLIO = 11.89% (1)
GROWTH OF 10K PORTFOLIO RANKINGS
NOMADIC SAMUEL PORTFOLIO = $2,672,650,317 (10)
CONSERVATIVE 40/60 PORTFOLIO = $1,074,765,138 (9)
BALANCED 60/40 PORTFOLIO = $710,266,291 (8)
RAY DALIO ALL-WEATHER PORTFOLIO = $579,543,353 (7)
NOMADIC SAMUEL RISK PARITY PORTFOLIO = $486,743,028 (6)
INCOME 20/80 PORTFOLIO = $326,496,895 (5)
RISK PARITY PORTFOLIO = $267,131,139 (4)
HARRY BROWNE PERMANENT PORTFOLIO = $178,286,983 (3)
GROWTH 80/20 PORTFOLIO = $10,273,587 (2)
100% US STOCK MARKET PORTFOLIO = $1,442,461 (1)
SHARPE RATIO PORTFOLIO RANKINGS
NOMADIC SAMUEL RISK PARITY PORTFOLIO = 1.02 (10)
NOMADIC SAMUEL PORTFOLIO = 1.00 (9)
RAY DALIO ALL-WEATHER PORTFOLIO = 0.99 (8)
RISK PARITY PORTFOLIO = 0.96 (7)
HARRY BROWNE PERMANENT PORTFOLIO = 0.95 (6)
CONSERVATIVE 40/60 PORTFOLIO = 0.94 (5)
BALANCED 60/40 PORTFOLIO = 0.90 (4)
INCOME 20/80 PORTFOLIO = 0.82 (3)
GROWTH 80/20 PORTFOLIO = 0.71 (2)
100% US STOCK MARKET PORTFOLIO = 0.53 (1)
SORTINO RATIO PORTFOLIO RANKINGS
NOMADIC SAMUEL RISK PARITY PORTFOLIO = 1.84 (10)
RAY DALIO ALL-WEATHER PORTFOLIO = 1.76 (9)
RISK PARITY PORTFOLIO = 1.74 (8)
HARRY BROWNE PERMANENT PORTFOLIO = 1.70 (7)
NOMADIC SAMUEL PORTFOLIO = 1.68 (6)
CONSERVATIVE 40/60 PORTFOLIO = 1.63 (5)
BALANCED 60/40 PORTFOLIO = 1.46 (4)
INCOME 20/80 PORTFOLIO = 1.45 (3)
GROWTH 80/20 PORTFOLIO = 1.07 (2)
100% US STOCK MARKET PORTFOLIO = 0.77 (1)
WORST YEAR PORTFOLIO RANKINGS
NOMADIC SAMUEL RISK PARITY PORTFOLIO = -11.67% (10)
RISK PARITY PORTFOLIO = -16.56% (9)
HARRY BROWNE PERMANENT PORTFOLIO = -17.15% (8)
RAY DALIO ALL-WEATHER PORTFOLIO = -17.32% (7)
NOMADIC SAMUEL PORTFOLIO = -19.22% (6)
CONSERVATIVE 40/60 PORTFOLIO = -23.66% (5)
INCOME 20/80 PORTFOLIO = -26.10 (4)
BALANCED 60/40 PORTFOLIO = -35.89% (3)
GROWTH 80/20 PORTFOLIO = -36.24% (2)
100% US STOCK MARKET PORTFOLIO = -37.04 (1)
TOTAL OVERALL PORTFOLIO RANKINGS
NOMADIC SAMUEL RISK PARITY PORTFOLIO = 42
NOMADIC SAMUEL PORTFOLIO = 41
RAY DALIO ALL-WEATHER PORTFOLIO = 38
CONSERVATIVE 40/60 PORTFOLIO = 33
RISK PARITY PORTFOLIO = 32
HARRY BROWNE PERMANENT PORTFOLIO = 27
BALANCED 60/40 PORTFOLIO = 27
INCOME 20/80 PORTFOLIO = 20
GROWTH 80/20 PORTFOLIO = 10
100% US STOCK MARKET PORTFOLIO = 5
4X Games

Balanced 60/40 Portfolio = 270% / 2.7 X Leverage
Initial Balance: $10,000
Final Balance: $710,266,291
CAGR: 28.72%
RISK: 27.90%
Worst Year: -35.89%
Sharpe Ratio: 0.90
Sortino Ratio: 1.46
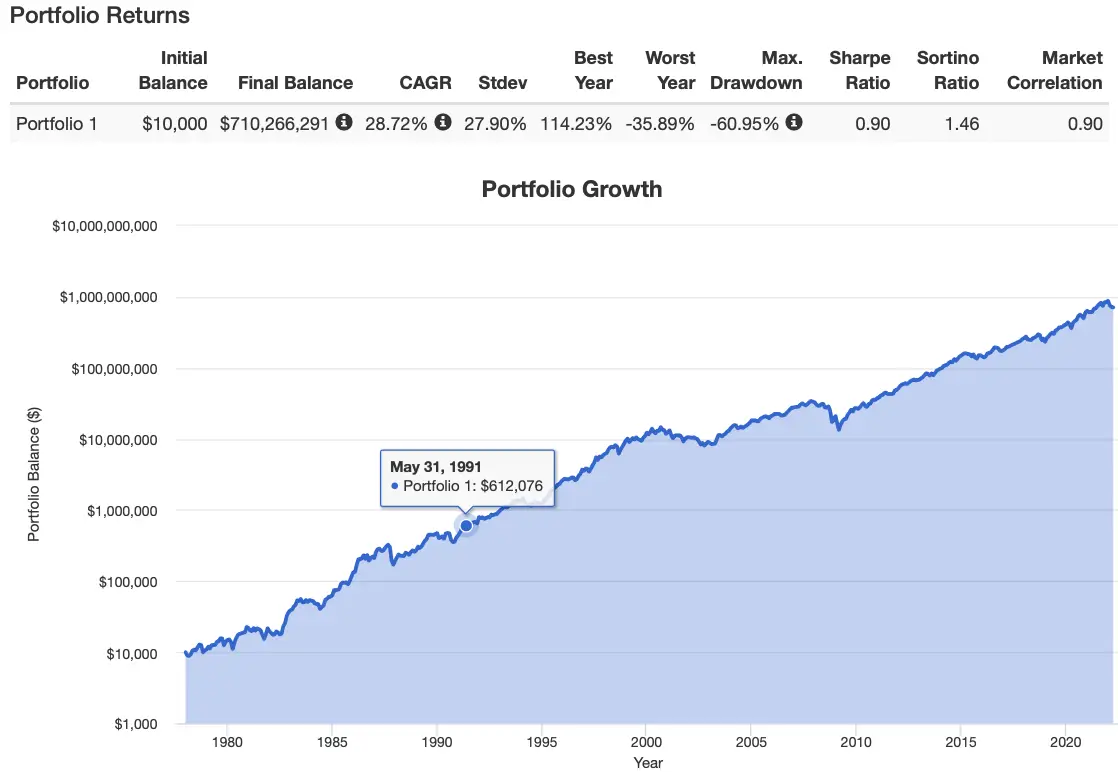
If you read the Battle of the leveraged portfolios 300% canvas article you’re likely experiencing deja vu.
The 60/40 is halted at 2.7X leverage (with a max canvas of 270%) due to its worst year clause kicking in.
What you end up with is a CAGR of 28.72 which is 82 basis points ahead of its RISK of 27.90%.
Its worst year was -35.89% with an overall Sharpe Ratio of 0.90 and Sortino Ratio of 1.46.
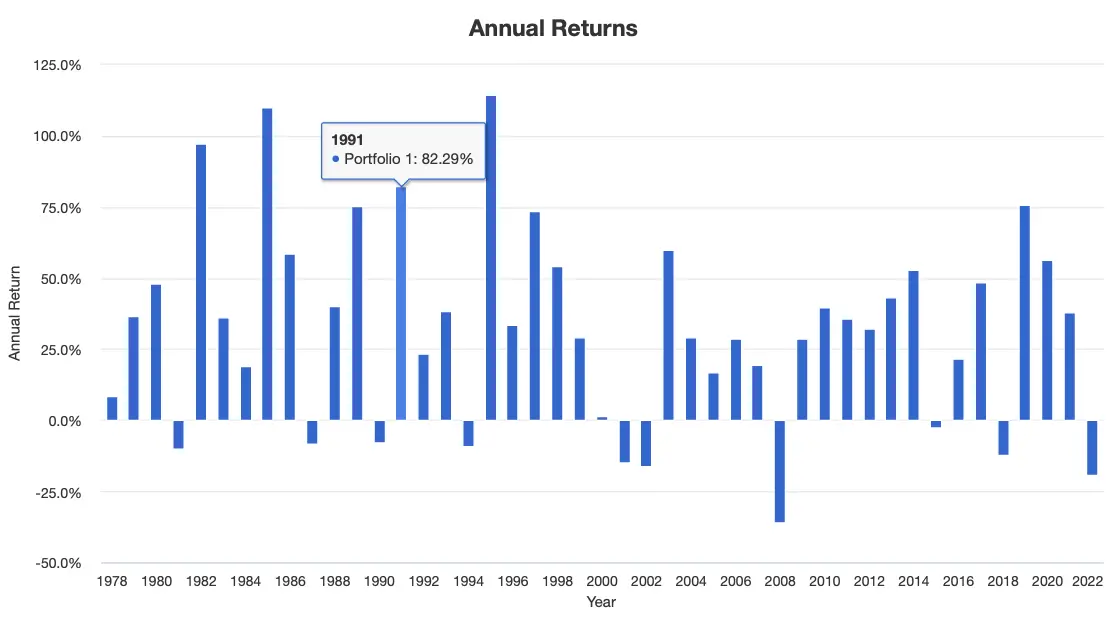
Investors committed to the 60/40 Portfolio with this amount of leverage had to endure a challenging early 2000s, 2008 and 2022.
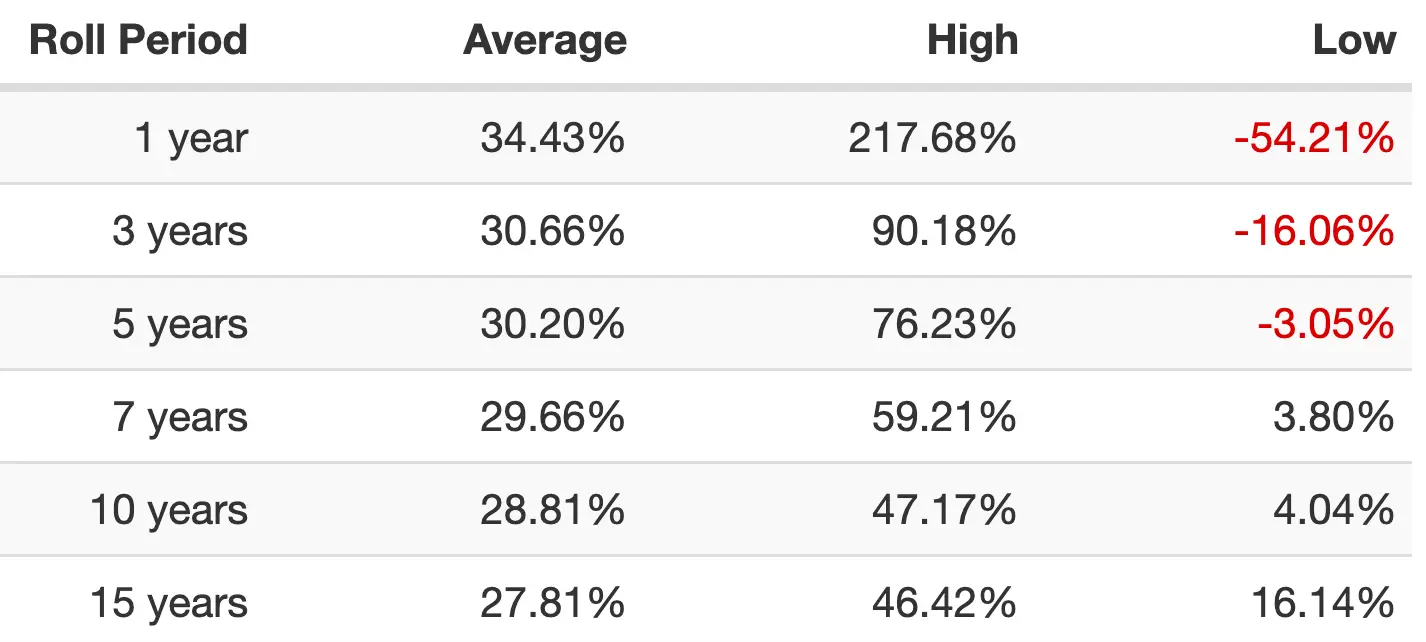
When it comes to Roll Period the 2.7X leveraged 60/40 would have frustrated investors with a low of 5 years at -3.05%, 3 years at -16.06% and 1 year at 54.21%.

Portfolio Challenge 4X Leverage
CAGR PORTFOLIO RANKINGS
NOMADIC SAMUEL PORTFOLIO = 42.84% (10)
CONSERVATIVE 40/60 = 39.31% (9)
RAY DALIO ALL-WEATHER = 37.35% (8)
NOMADIC SAMUEL RISK PARITY = 36.81% (7)
RISK PARITY PORTFOLIO = 34.42% (6)
INCOME 20/80 = 34.35% (5)
HARRY BROWNE PERMANENT = 32.88% (4)
BALANCED 60/40 PORTFOLIO = 28.72% (3)
GROWTH 80/20 = 16.97% (2)
100% US TOTAL STOCK MARKET = 11.89% (1)
GROWTH OF 10K PORTFOLIO RANKINGS
NOMADIC SAMUEL PORTFOLIO = $71,234,156,896 (10)
CONSERVATIVE 40/60 = $23,516,054,388 (9)
RAY DALIO ALL-WEATHER = $12,570,472,715 (8)
NOMADIC SAMUEL RISK PARITY = $10,534,045,546 (7)
RISK PARITY PORTFOLIO = $4,842,569,766 (6)
INCOME 20/80 = $4,732,250,018 (5)
HARRY BROWNE PERMANENT = $2,907,525,891 (4)
BALANCED 60/40 PORTFOLIO = $710,266,291 (3)
GROWTH 80/20 = $10,273,587 (2)
100% US TOTAL STOCK MARKET = $1,442,461 (1)
SHARPE RATIO PORTFOLIO RANKINGS
NOMADIC SAMUEL RISK PARITY = 1.06 (10)
NOMADIC SAMUEL PORTFOLIO = 1.04 (9)
RAY DALIO ALL-WEATHER = 1.03 (8)
RISK PARITY PORTFOLIO = 1.01 (7)
HARRY BROWNE PERMANENT = 1.00 (6)
CONSERVATIVE 40/60 = 0.98 (5)
BALANCED 60/40 PORTFOLIO = 0.90 (4)
INCOME 20/80 = 0.86 (3)
GROWTH 80/20 = 0.71 (2)
100% US TOTAL STOCK MARKET = 0.53 (1)
SORTINO RATIO PORTFOLIO RANKINGS
NOMADIC SAMUEL RISK PARITY = 1.96 (10)
RISK PARITY PORTFOLIO = 1.86 (8.5)
RAY DALIO ALL-WEATHER = 1.86 (8.5)
HARRY BROWNE PERMANENT = 1.81 (7)
NOMADIC SAMUEL PORTFOLIO = 1.76 (6)
CONSERVATIVE 40/60 = 1.71 (5)
INCOME 20/80 = 1.53 (4)
BALANCED 60/40 PORTFOLIO = 1.46 (3)
GROWTH 80/20 = 1.07 (2)
100% US TOTAL STOCK MARKET = 0.77 (1)
WORST YEAR PORTFOLIO RANKINGS
NOMADIC SAMUEL RISK PARITY = -15.61% (10)
HARRY BROWNE PERMANENT = -23.65% (9)
RISK PARITY PORTFOLIO = -23.90% (8)
RAY DALIO ALL-WEATHER = -25.05% (7)
NOMADIC SAMUEL PORTFOLIO = -28.14% (6)
CONSERVATIVE 40/60 = -30.72% (5)
INCOME 20/80 = -33.72% (4)
BALANCED 60/40 PORTFOLIO = -35.89% (3)
GROWTH 80/20 = -36.24% (2)
100% US TOTAL STOCK MARKET = -37.04% (1)
TOTAL OVERALL PORTFOLIO RANKINGS
NOMADIC SAMUEL RISK PARITY = 44
NOMADIC SAMUEL PORTFOLIO = 41
RAY DALIO ALL-WEATHER = 39.5
RISK PARITY PORTFOLIO = 35.5
CONSERVATIVE 40/60 = 33
HARRY BROWNE PERMANENT = 30
INCOME 20/80 = 21
BALANCED 60/40 PORTFOLIO = 16
GROWTH 80/20 = 10
100% US TOTAL STOCK MARKET = PP% (5)

Leveraged 60/40 Portfolio Review

Let’s use the movie analogy of the Clint Eastwood spaghetti western “The Good, The Bad and The Ugly” to describe the results of its performance in the picture perfect portfolios challenge.
The Good.
The 60/40 portfolio thrived at the 100% canvas level (no leverage) and actually finished ahead of all the other classic portfolios (aside from the fake Nomadic Samuel ones) by finishing in first place from a risk meets rewards standpoint.
I gained newfound respect for the 60/40 at the non-leveraged canvas level.
The Bad.
As soon as leverage was applied to the 60/40, in round 2 of the games, its standings slipped and it did not reach its full mandate of a 200% canvas given that it tripped up at the volatility level of 20 with 1.9X leverage applied.
Already, we started to see chinks in its armour with modest leverage.
The Ugly.
Things went from bad to worse and flat out ugly at the 3X and 4X leverage challenge.
The 60/40 was only able to make it to 2.7X leverage before it triggered the -37.04% benchmark clause worst year.
At this point the 40/60 portfolio was relatively crushing it from a risk/performance standpoint and all of the 5 other portfolios with an alternative sleeve said see ya latter alligator as they zoomed past it on the autobahn.
So let’s now explore some takeaways from the games.

60/40 Portfolio Max Leverage
- The 60/40 portfolio has been a fine solution for investors at the 100% canvas level as per the results of this challenge. Without leverage it thrives.
- With modest leverage the 60/40 portfolio does well up until about 1.9X leverage. At this point it has a volatility of 20.
- The maximum amount of leverage the 60/40 portfolio can handle before it has a year worse than the 100% US Total Stock market is 2.7X
- Thus, a leverage sweet spot for this portfolio is around 1.4X to 1.9X where we can start to see this portfolio outperforming stock only mandates while offering considerably better downside protection (less scary worst years)
- Those with a cast-iron stomach might go a bit higher but you have to ask yourself a serious question of why not 50/50 or 40/60 at this point? Anything beyond 2X should tilt more conservatively towards bonds from a risk/rewards point of view.
- The fact that the 60/40 portfolio could not fulfill its mandate at the 3X and 4X games level is why it gets a B- grade. It’s ‘decent’ with modest leverage but it falls apart when anything more aggressive is considered.

Leveraged 60/40 Further Reading
For those interested in learning more about the potential benefits and risks associated with leveraging a 60/40 portfolio I suggest the following:
- An Update to Cliff Asness’s Study on the Benefits of a Levered 60/40 (Jeremy Schwartz on VettaFi)
- Portable Beta: Making the Most of the Returns You’re Already Getting (Corey Hoffstein of Newfound Research)

Leveraged 60/40 Total Portfolio Solution?
Is the leveraged 60/40 a potential total portfolio solution?
It could be.
For those interested in equity-like performance without the ferocious annual drawdowns of stock-only strategies (while simultaneously not believing firmly in alternative investments) the levered 60/40 portfolio offers some intriguing benefits.
WisdomTree has come up with a suite of 90/60 funds at the 1.5X leverage level that could fulfill this mandate:
90/60 Portfolio
50% NTSX (US Market Exposure)
30% NTSI (Int-Dev Market Exposure)
20% NTSE (Emerging Market Exposure)
The downside clearly is the stock/bond only relationship in this portfolio.
Going global adds diversification benefits but all of your risk/reward profile is concentrated in leveraged stock/bonds.

Leveraged 60/40 Partial Portfolio Solution?
Utilizing a leveraged 60/40 portfolio, as a partial portfolio solution, offers investors far more flexibility.
When you go to the 67% level with the 90/60 products, offered by WisdomTree, you create 33% space in your portfolio for alternatives, diversifiers and uncorrelated asset/strategy possibilities while still maintaining the full effective coverage of the 60/40.
The idea isn’t to go full on mashed potatoes at the cafeteria mode by adding more stocks and bonds.
It is to explore alternative strategies.
Some possible ideas include the following:
- Merger Arbitrage
- Managed Futures (Trend Following + Other Systematic Macro Strategies)
- Market Neutral Equities
- Crypto Currency and NFTs
- Long Short Net 60/70 and/or Active Extension Equities 130/30
- Art, Wine, Collectibles
- REITs and/or Real Assets
- Tail Protection Put Option Strategies
- Private Equity and/or Debt
- Reinsurance
I’ll throw out one contrarian portfolio idea and then leave you with a list of some funds in the alternatives space to consider for your own mix and match combinations.
Let’s try a 1-2-3 approach to diversification here with the following configurations:
Portfolio Idea
30% Leveraged 60/40 = 90/60
30% Leveraged Static Risk Parity
30% Managed Futures + Extra Strategy
10% Multi-Strategy Hedge + Tail Risk
Max Diversified Portfolio
15% NTSX USA 90/60
10% NTSI INT-DEV 90/60
5% NTSE Emerging 90/60
30% UPAR (168% Risk Parity)
30% BLNDX (50/100 Stocks/Managed Futures)
7% QAI (Multi-Strategy Hedge Fund)
3% CYA (Tail Put Protection)
1% BITO (Bitcoin Strategy)
If you ask me we’ve got ourselves possibly a diversification masterpiece over here with a plethora of uncorrelated asset classes, strategies and risk/reward profiles to sail the seven seas.
For those interested in other alternative funds and strategies here are some options:
UPAR
RPAR
Managed Futures + Additional Exposure
Managed Futures Only
DBMF
KMLM
Long-Short Equity
Market Neutral
ARB
Alternative Risk Premia
QRPIX
Reinsurance
SHRIX
Bitcoin
BITO
Multi-Strategy Hedge Fund
QAI
CYA
TAIL
Canadian Alternatives
HRAA.TO
ONEC.TO
PFAA.TO
HDGE.TO

Leveraged 50/50 or 40/60 Alternatives?
Because we mentioned earlier that the 60/40 portfolio starts to wobble at around 1.9X leverage, I’ll list a few alternatives in between the 50/50 and 40/60 configurations where greater exposure to bonds potentially smooths things out.
SWAN 70/90
ISWN 70/90
PSLDX 100/100
NFDIX 75/75 + Convexity

Nomadic Samuel Final Thoughts?
Well isn’t this becoming a bit of a behemoth of an article?
I’ve gotta say, I’ve come away from the leveraged portfolio challenge with a bit more respect for the 60/40 portfolio.
I can clearly see the benefits of applying modest leverage to the 60/40, somewhere from 1.4 to 1.9X, to create space in the portfolio for additional layers of diversification.
The success of funds such as NTSX and SWAN, both accumulating more than 1 billion of AUM, highlights retail investors and savvy advisors considerable thirst for these types of investing solutions.
Strategies and associated products that were once only available at the institutional level are now coming to market in the retail space.
Yeah.
It’s about “fill-in-the-blank” time.
And my oh my is this ever an interesting space to keep and eye on these days.
We’ve got a number of different names and branding strategies being thrown around to describe this moderately leveraged space:
- Efficient Core
- Portable Beta
- Return Stacking
Out of the three “return stacking” wins by a landslide from a branding perspective as efficient core sounds like a nice computer upgrade and portable beta possibly some spacecraft from the Jetsons.
I prefer to think of sensibly leveraged portfolios as expanded canvas solutions.
An artist looking to create a masterpiece (and an investor seeking maximum diversification and uncorrelated strategies) requires a bigger canvas than 100%.
Hence, expanded canvas portfolios.
At the end of the day, from my point of view, a leveraged 60/40 portfolio is meant as a building block only and not a total portfolio solution.
I know some will disagree.
However, I love what the leveraged 60/40 does in terms of creating additional real estate in the portfolio for what is being referred to these days (by certain industry experts) as diversified diversifiers.
Is the leveraged 60/40 portfolio anywhere near the best when compared to its 9 other peers in this challenge?
Nah.
Not even close.
And thus we’ll end things with the 60/40 as being a B- leverage solution that only works well when modest leverage is applied.

Now over to you.
What do you think about leveraging a 60/40 portfolio?
Agree?
Disagree?
Let me know in the comments below.
Important Information
Comprehensive Investment Disclaimer:
All content provided on this website (including but not limited to portfolio ideas, fund analyses, investment strategies, commentary on market conditions, and discussions regarding leverage) is strictly for educational, informational, and illustrative purposes only. The information does not constitute financial, investment, tax, accounting, or legal advice. Opinions, strategies, and ideas presented herein represent personal perspectives, are based on independent research and publicly available information, and do not necessarily reflect the views or official positions of any third-party organizations, institutions, or affiliates.
Investing in financial markets inherently carries substantial risks, including but not limited to market volatility, economic uncertainties, geopolitical developments, and liquidity risks. You must be fully aware that there is always the potential for partial or total loss of your principal investment. Additionally, the use of leverage or leveraged financial products significantly increases risk exposure by amplifying both potential gains and potential losses, and thus is not appropriate or advisable for all investors. Using leverage may result in losing more than your initial invested capital, incurring margin calls, experiencing substantial interest costs, or suffering severe financial distress.
Past performance indicators, including historical data, backtesting results, and hypothetical scenarios, should never be viewed as guarantees or reliable predictions of future performance. Any examples provided are purely hypothetical and intended only for illustration purposes. Performance benchmarks, such as market indexes mentioned on this site, are theoretical and are not directly investable. While diligent efforts are made to provide accurate and current information, “Picture Perfect Portfolios” does not warrant, represent, or guarantee the accuracy, completeness, or timeliness of any information provided. Errors, inaccuracies, or outdated information may exist.
Users of this website are strongly encouraged to independently verify all information, conduct comprehensive research and due diligence, and engage with qualified financial, investment, tax, or legal professionals before making any investment or financial decisions. The responsibility for making informed investment decisions rests entirely with the individual. “Picture Perfect Portfolios” explicitly disclaims all liability for any direct, indirect, incidental, special, consequential, or other losses or damages incurred, financial or otherwise, arising out of reliance upon, or use of, any content or information presented on this website.
By accessing, reading, and utilizing the content on this website, you expressly acknowledge, understand, accept, and agree to abide by these terms and conditions. Please consult the full and detailed disclaimer available elsewhere on this website for further clarification and additional important disclosures. Read the complete disclaimer here.


