
The Risk Parity Portfolio ought to be the default portfolio average DIY investors utilize as a long-term investing strategy as opposed to the industry standard 60/40 portfolio.
That’s a bit of a bold statement to start off an article!
Well, if investors are concerned about primarily preparing a portfolio for all four economic regimes, controlling volatility and managing sequence of return risk, it’s a slam dunk no-brainer to select the Risk Parity Portfolio over the 60/40 Portfolio.
Yet, an even bolder question would be, can the classic long-only Risk Parity Portfolio be potentially enhanced or improved?
That’s the very question we’re going to explore in detail today.

How To Improve The Classic Risk Parity Portfolio: 10 Suggestions For Investors

About the Author & Disclosure
Picture Perfect Portfolios is the quantitative research arm of Samuel Jeffery, co-founder of the Samuel & Audrey Media Network. With over 15 years of global business experience and two World Travel Awards (Europe’s Leading Marketing Campaign 2017 & 2018), Samuel brings a unique global macro perspective to asset allocation.
Note: This content is strictly for educational purposes and reflects personal opinions, not professional financial advice. All strategies discussed involve risk; please consult a qualified advisor before investing.

Risk Parity Portfolio Introduction

The Risk Parity Portfolio, as one might expect given its name, is primarily concerned with managing risk and volatility.
Instead of asset classes being weighted by default configurations such as 80/20, 60/40 and 40/60, a risk parity portfolio focuses on the volatility of each asset class as opposed to its expected returns.
Furthermore, instead of being merely a concoction of just stocks and bonds, an alternative sleeve is a big part of the risk parity strategy.
Traditionally, that alternative sleeve has been gold and/or commodities.
Given that stocks, gold and commodities are considerably more volatile (in terms of standard deviation) than bonds, the typical long-only Risk Parity Portfolio typically features two different bond asset classes at 30% slices whereas stocks and gold receive 20% allocations respectively.
20% Stocks
30% Bonds A (10 Year Treasury)
30% Bonds B (Intermediate)
20% Gold/Commodities
Why this configuration?
Let’s explore the asset classes individually.

Risk Parity Portfolio Asset Classes

Thanks to Portfolio Visualizer (an invaluable resource for investors), we can backtest the standard deviation of the US Total Stock Market, Intermediate Term Treasury, 10 Year Treasury and Gold dating all the way back to 1972.
We’re able to notice the following:

Risk Parity Portfolio Risk By Individual Asset Class
US Stock Market = 15.65% Risk (Standard Deviation)
Gold = 19.86 Risk (Standard Deviation)
Intermediate Term Treasury = 5.75% Risk (Standard Deviation)
10 Year Treasury = 8.01% Risk (Standard Deviation)
Since the Risk Parity Portfolio is not primarily concerned with returns (and instead focuses on risk) you end up with a portfolio that has a greater allocation to bonds than it does to stocks and gold.
Furthermore, the Risk Parity Portfolio seeks to include exposure to asset classes that are uncorrelated with each other in order to improve the overall diversification of the portfolio.
It includes an alternative sleeve (in this example Gold) as opposed to just being merely stocks and bonds.
Risk Parity Portfolio Asset Class Monthly Correlations

What’s immediately obvious is that Gold and Stocks are uncorrelated with all other asset classes and it is only bonds that are highly correlated with each other but uncorrelated to both Stocks and Gold.
This level of diversification between asset classes has historically served investors extremely well offering returns (CAGR of 8.31%) that were higher than Risk (Standard Deviation of 6.99%).
Risk Parity Portfolio Returns 1972-2022

The silky smooth ride of the static Risk Parity Portfolio has offered investors close to equity-like returns with bond-like stability.
When you consider its worst year performance is only single digits (-9.93%) it’s been a bastion of stability in comparison to equity only portfolios where the US Total stock market has witnessed years as bad as -37% in 2008.
Moreover, the greatest feather in the Risk Parity Portfolios cap is its historical sequence of returns risk profile (also known as Roll Period) of only being underwater for 1 year.
Risk Parity Portfolio Roll Period 1972 to 2022

In comparison the US Total Stock Market has been underwater for a period of an entire decade!
How about the 60/40 Portfolio?
A five year negative sequence of returns risk.
Thus, how on earth could the Risk Parity Portfolio be improved?
Is that even possible?
Let’s explore.

These asset allocation ideas and model portfolios presented herein are purely for entertainment purposes only. This is NOT investment advice. These models are hypothetical and are intended to provide general information about potential ways to organize a portfolio based on theoretical scenarios and assumptions. They do not take into account the investment objectives, financial situation/goals, risk tolerance and/or specific needs of any particular individual.
1) US Stocks Only –> Global Equities = Risk Parity Upgrade
Let’s grab the lowest hanging fruit of all and move from US stocks only to a globally diversified equity allocation.
Afterall, diversification is your only free lunch in investing and avoiding “home country bias” is a paramount upgrade.
Indeed, US equities have served investors well over the past 40 years but the cautionary tale of Japan is a reminder to diversify whenever possible.
Furthermore, consider the 2000s as an example of what can potentially happen when you put all of your equity eggs in one basket.

A globally diversified equity allocation prevents investors from having a lost decade.
US Total Stock Market returns stymied portfolios with a -0.27% CAGR whereas International Developed Equities were slightly above water with a 1.24% return and the one that saved your bacon was Emerging Markets coming in at 9.82% CAGR.
Thus, to improve our naive Risk Parity Portfolio we’ll go from something like a $VTI US Total Stock Market to a $VT Total World Stock Market.

2) Market Cap Weighted Global Equities –> Global Minimum Volatility Equities
Imagine being able to enjoy the same return profile (or better) of a globally diversified equity portfolio while subtracting 400 to 500 basis points of risk to further smooth out the ride?
Too good to be true?
Enter the room Global Minimum Volatility Equities.
Minimum volatility investing is an equity factor strategy that seeks to “control volatility” by screening for companies that have more stable returns while sifting out companies that are more volatile.
You eliminate lottery ticket stocks.
It’s as much about what is included (more stable stocks) as it is about what is excluded (highly volatile stocks).
You would think that trying to reduce volatility would lower returns but that is not the case at all.

In fact, when you compare MSCI minimum volatility indexes (US, EAFE, EM, Canada, etc) what you more often find is that they historically outperform their market-cap weighted benchmark.
Since 1988 the MSCI World Minimum Volatility Index has outperformed its parent index with returns of 8.43% and 7.64% respectively.
Hence, you get a “free lunch” of potentially greater returns but more importantly you significantly upgrade the standard deviation of an asset class that is one of the portfolios most volatile wings (only gold being more volatile).


3) Intermediate Treasury –> Long Term Treasury = RP Enhancement
The next upgrade we’ll be seeking is in the fixed income category of bonds.
Intermediate Treasury see ya later alligator!
Enter the room Long Term Treasury.
Wait. But. Why?
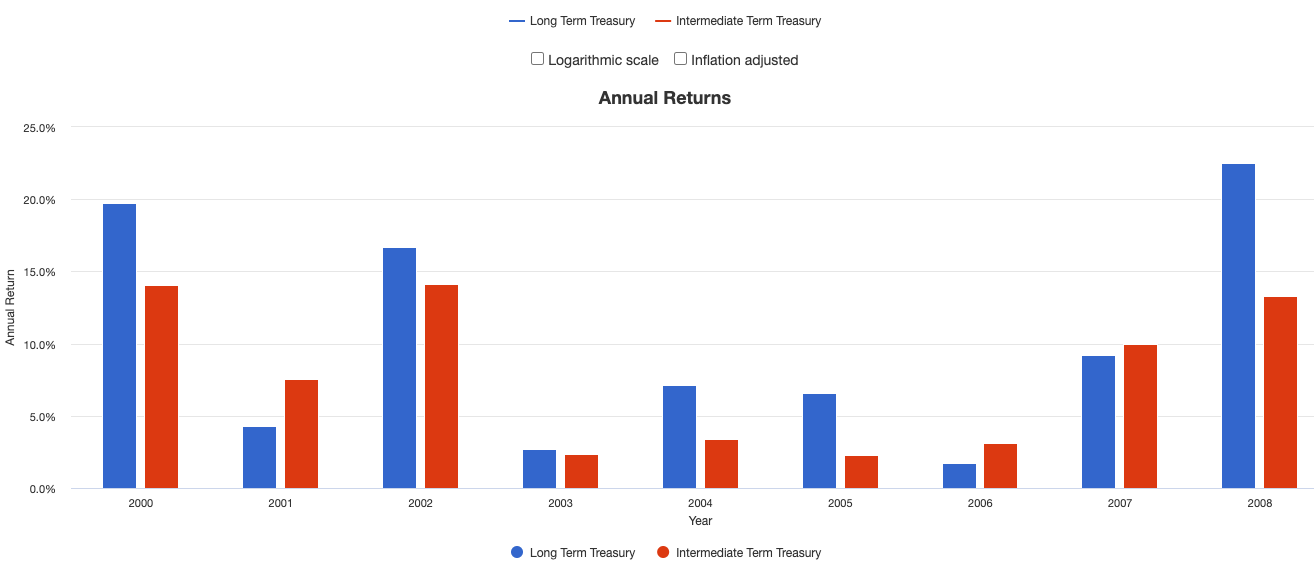
Let’s consider the period of 2000 until the end of 2008 – the roughest stretch for markets since 1972.
During the Bear Market Years of 2000 until the end of 2002 and 2008, Long-Term Treasury provided significantly more protection versus Intermediate Treasury.
Moreover, for that entire rough period of time it outperformed Intermediate Treasury by over 200 basis points.
For a so called “lost decade” for equities, finding assets that provide more stability (when you need it most) and offer higher returns is an upgrade worth taking in my books.

 - Digital Art")
4) 10 Year Treasury –> TIPS (Treasury Inflation Protected Securities)
One of the biggest problems of owning Intermediate Treasury and 10 Year Treasury is just how highly correlated they are to each other.

With a correlation of 0.96 dare I say they’re almost the same!
Given we’ve got two slots for fixed income diversification in our Risk Parity Portfolio let’s try to upgrade by finding a solution that is less correlated and strategically different.
Drum roll….
TIPS!
U.S. government issued Treasury Inflation-Protected Securities (TIPS) are a special type of Treasury security indexed to inflation.
By adding this asset class to our portfolio we’re making it more regime ready for when inflation rears its ugly head.
Enter the room 2022.
LOL.
Normally that expression is referred to on this site for funds and/or asset classes but 2022 has been a unique animal in and of itself.
For those of us too young to have experienced rampant inflation in previous years it’s a big part of our lives now.
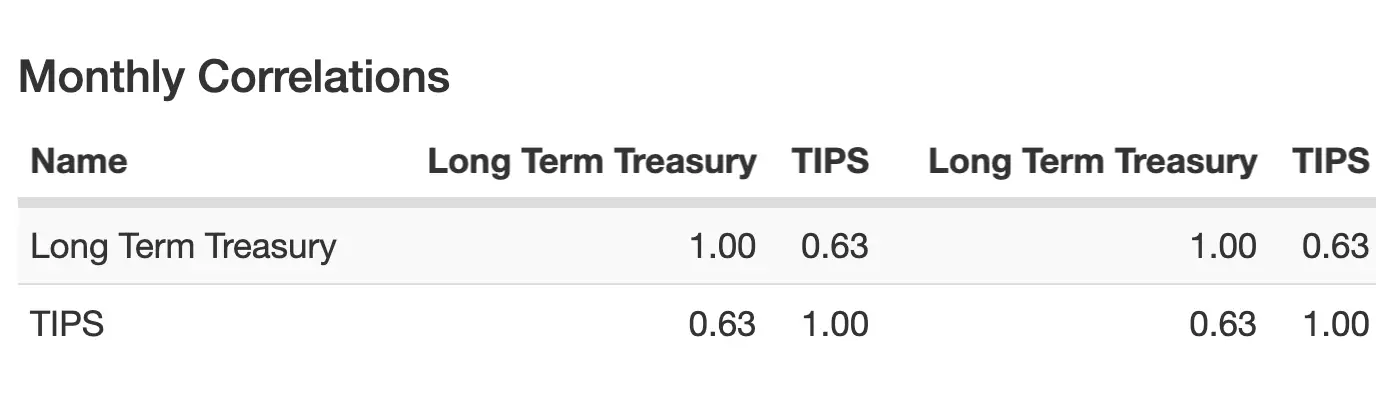
Maybe the most important upgrade of all is that now we’ve got two fixed income asset classes that have a correlation of 0.63 to each other as opposed to 0.96.
We’ll take it and move on.

5) Leverage –> Lever the Portfolio Up Buttercup = 200% Canvas
Here is where I’m going to lose some of you.
We’re going to add leverage to the portfolio to expand the canvas to 200%.
Not to add more heaping scoops of what we’ve already got but to instead add multiple different asset classes and strategies to improve the overall portfolio diversification and return stack performance on top of the base we’ve already created.
But won’t that make the Risk Parity Portfolio fall apart?
That was a question I once had.
I created the Battle of the Leveraged Portfolios to test the Risk Parity Portfolio along with other classic portfolios to see if, when, why, how it would fall apart.
You can see the results here: 2X, 3X, 4X
The TL;DR version is this:
The Risk Parity Portfolio can handle leverage like a pack-mule.
In every round of the competition its returns exceeded its level of risk, roll periods remained the same and its Sharpe Ratio and Sortino Ratio improved.
But all of that was done with just four crude assets: long US total stocks, treasuries (Intermediate and Long) and gold.
What we’re attempting to do is not increase what we’ve already got but instead add additional layers of diversification to further increase the efficiency of the portfolio.
Sound exciting?
It does for me!

6) Trend-Following Managed Futures Strategy
It’s time to bring the Chameleon into the room!
So far we’ve had nothing but long-only non-adaptive asset classes and strategies in our portfolio.
That changes right now.
For those unfamiliar, trend-following is the predominant managed futures strategy used to go both long and short global equity, bond, commodity and currency indexes.
Historically speaking, it has provided equity-like returns with only half of the volatility.
Moreover, it is uncorrelated to both long only equity and bond markets.
Furthermore, it typically does extremely well during periods of market turmoil when trends are strong.
Hence, it has been referred to as a crisis alpha-strategy – even though it provides decent return streams outside of bear market situations.
Thus, the strategy utilizes short, medium and long term signals to determine whether to go long, short or take no position at all.
Quite honestly I couldn’t imagine my portfolio now without it.
Best of all it has done extremely well in 2022 when basically everything else under the sun has been getting disemboweled.

Check out the difference between Managed Futures trend-following ticker $DBMF versus milquetoast 60/40 $AOM.
Suffering Succotash!!!
 - Digital Art")
7) Global Systematic Macro + Options Strategies (Aside from Trend)
Some of the top quants on #FinTwit have coined the popular saying: “Diversify your diversifiers, yo!”
And that’s the plan over here.
Instead of relying “only” on trend-following strategies we’ll deploy other global systematic macro strategies such as carry, value, momentum, quality, seasonality and mean reversion along with long-volatility options strategies to protect against tail-risk (extreme market events).
I won’t go over each of these line-items one by one but instead we’ll define a few for good measure.
Carry is a strategy where investors seek to benefit from a wide differential between high and low carry assets.
Long-volatility strategies typically involve buying out of the money put-options, at various strike prices, to provide a type of “portfolio insurance” should the markets experience a fierce drawdown.
By not just sticking to trend-following we’re exposing our portfolio to more diversified diversifiers.
 Upgraded In A Risk Parity Portfolio - Digital Art")
8) REITS (Real Estate Investment Trust)
Let’s add some global REITS to our portfolio.
Real Estate Investment Trust is a specialized equity asset class that gives you exposure to many types of commercial real estate.
The primary reason for adding them in your portfolio is to diversify your equity sleeve and hedge against inflation.
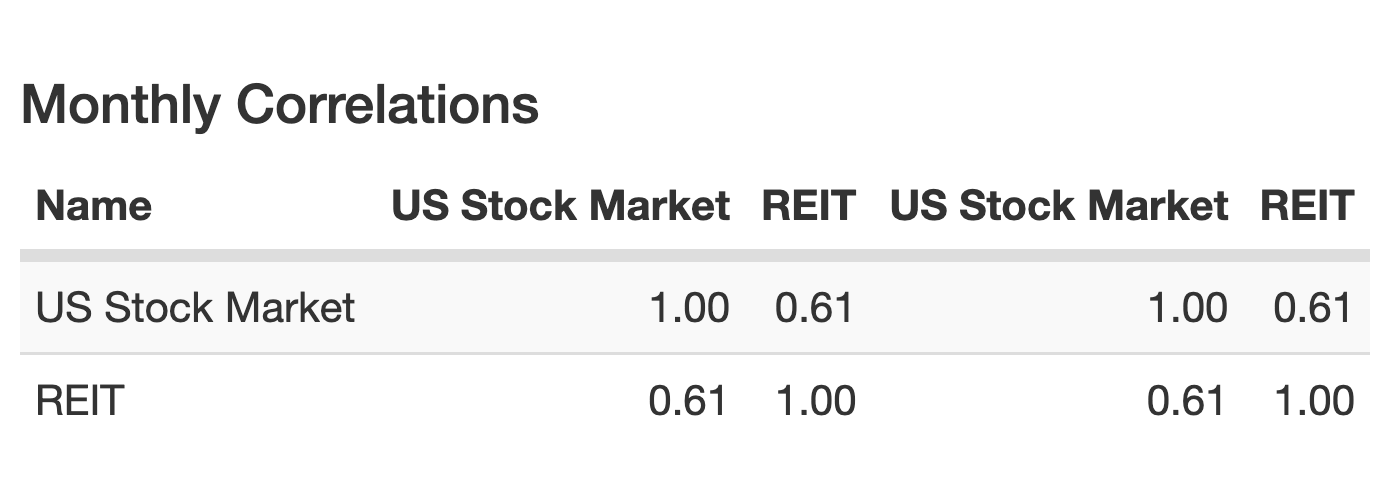
Much like with our bonds, we’re seeking to add diversification to our equities sleeve by offering something less correlated to the US total stock market.
Given that the US Total Stock Market and REITS have a 0.61 correlation we’ll happily take it.
Let’s wind back the clock to the 2000s for a bit of a case study.

When the US Total Stock Market was causing investors to pull their collective hair out, REITs were the all-star performer that saved the day.
I’m not sure if we’ll witness such an extreme situation again in the future but it’s nice to be prepared with something in the portfolio that’ll potentially work in our favour.

9) Market Neutral Equities Strategy
Market-Neutral Equities is an absolute return hedge fund strategy that seeks positive returns in any market environment.
By choosing a low NET exposure (typically between 0 to 20%) it is just as long as it is short most of the time.
Furthermore, it is lowly correlated to markets providing the diversification benefit we’re craving with our additional 100% canvas space.
Let’s use an example to showcase how it can make money even in the down market.
Let’s say the strategy is long 100 and short 90 for a net 10 exposure.
Our long equity component is down -8% whereas our short component is down -20%.
We’d be -80 + 180 for a net of 100.
In this scenario we’d earn an impressive 10% return before fees.
It can also generate positive returns when the market is up.
Our long component at 100 is up 12% whereas our short is only up 5%
We’re 120 – 45 in this scenario for an overall 7.5% return.
Given the absolute return potential and diversification benefit of the strategy we’re excited to add it.

10) Mish-Mash of Other Alternative Strategies
To close things off we’ll further diversify our portfolio by drawing from a well of a mish-mash of other alternative strategies.
These could potentially be but are not limited to the following:
- Merger Arbitrage
- Bitcoin
- Reinsurance
- Tail Risk
- Credit Hedging
- Private Equity
- Private Loans
I could write an entire article on each of these strategies so we’ll keep this brief.
The idea is just to add a few more diversifiers to round off the portfolio.
It would entirely be up to you which of these you’d potentially choose depending on your interest towards the various asset classes and/or strategies.

Improved Risk Parity Portfolio
What does our improved Risk Parity Portfolio look like after all of these potential upgrades and an expanded canvas?
Maybe something like this:

Enhanced Risk Parity Portfolio 200%
40% Trend-Following (Equity, Bond, Currency, Commodity Indexes)
30% Global Systematic Managed Futures Strategies (Carry, Seasonality, Value, Momentum, Quality, Mean Reversion, etc)
30% Long Treasury
30% TIPS
20% Global Minimum Volatility Equities
20% Gold
10% REITS
10% Market Neutral Equities
10% Diversified Alternatives Basket (Reinsurance, Merger Arbitrage, Bitcoin, Private Equity/Credit, etc)
Overall, I very much like the looks of what we’ve got over here.
We’ve improved the overall diversification of our portfolio while adding more uncorrelated asset classes/strategies to the mix.
I’d expect returns to exceed risk with this high Sharpe/Sortino ratio seeking portfolio with the potential to outperform most others while offering a considerably smoother ride.

ETFs and Mutual Funds to Create an Enhanced Risk Parity Portfolio
For those interested in putting together something “similar” to what we’ve suggested we could potentially utilize the following funds:
US Investors
40% UPAR
40% RDMIX
15% QRPIX
5% SRRIX
UPAR Ultra Risk Parity sets the table for the long-only Risk Parity asset allocation by providing global equities (US, Int-Dev, EM) at 35%, TIPS (49%), Long Term Treasury (49%) and Gold/Commodities (35%) for a net exposure of 168%.
RDMIX Rational Resolve Adaptive Asset Allocation from ReSolve Asset Management provides the backbone of the “adaptive” risk-parity mandate with trend-following and an ensemble of global systematic managed futures strategies (carry, seasonality, mean reversion, value, etc) across all global equity, bonds, commodities and currency indexes.
QRPIX Alternative Risk Premia Fund from AQR goes long/short across equity, bond, currency and commodity indexes while deploying five unique styles including Value, Momentum, Carry, Defensive, and Trend.
SRRIX Stone Ridge Reinsurance Risk Premium Interval Fund offers investors the alternative strategy of reinsurance to round out the portfolio.
The hybrid approach of long-only and long-short risk parity strategies as the backbone of this portfolio along with diversified diversifiers should provide investors the returns meets risk management they crave.
Canadian Investors
40% UPAR
40% HRAA.TO
10% PFAA.TO
10% ONEC.TO
UPAR Ultra Risk Parity sets the table for the long-only Risk Parity asset allocation by providing global equities (US, Int-Dev, EM) at 35%, TIPS (49%), Long Term Treasury (49%) and Gold/Commodities (35%) for a net exposure of 168%.
HRAA.TO Horizons Adaptive Asset Allocation from ReSolve Asset Management provides the backbone of the “adaptive” risk-parity mandate with trend-following and an ensemble of global systematic managed futures strategies (carry, seasonality, mean reversion, value, etc) across all global equity, bonds, commodities and currency indexes.
PFAA.TO Picton Mahoney Fortified Alpha Alternative Fund offers investors a primary strategy of market neutral, special situation credit and merger arbitrage with a secondary component of Momentum, Value, Quality, Discretionary Hedges and Tail Risk.
ONEC.TO Accelerate OneChoice Alternative ETF is a 10 in 1 fund offering exposure to Bitcoin, Long-Short Equity, Senior Loans, Merger Arbitrage, REITS and Global Infrastructure equities not already included in the portfolio.
The one sad thing here is that we’re not able to squeeze a minimum volatility equities strategy into the equation but hopefully such a product will exist someday in the future!
The Picture Perfect Portfolio that I’d love to launch someday as an ETF attempts to solve that.

Risk Parity Resources For Further Reference
For those interested in learning more about Risk Parity investing I’d recommend the following resources:
- Risk Parity: How to Invest for All Market Environments (book) by Alex Shahidi
- Adaptive Asset Allocation (book) by Adam Butler, Rodrigo Gordillo and Mike Philbrick
- Risk Parity Chronicles (blog) from Justin living in Japan
- All Seasons Portfolio (blog) by Nicholas Ahonen from Sweden

Nomadic Samuel Final Thoughts
Sorry, my friends for yet another behemoth of a post!
I hit you last time with 4000 words and now we’re well over 3000 here.
To say I’m a fan of Risk Parity would be an understatement.
I feel it should be the “default” portfolio for investors of all shapes, sizes and (of course) stages of life.
With a return profile greater than its risk and a roll period that puts the 60/40 to shame, we ought to collectively be pondering what’s going on here?
Risk Parity is the literal backbone of my own DIY quant portfolio.
The static long-only Risk Parity Portfolio has had impressive results for over 50 years.
However, as I think we’ve all seen in this article it can easily be upgraded.
Strategies that were once only available to high networth individuals and institutions are now available for the little guys (us plebs).
Failing to integrate these strategies into your portfolio seems like a lost opportunity and then some.
What’s most exciting is that fund of funds ETFs and Mutual Funds are now available meaning you can cobble together a maximally diversified risk parity portfolio with as little as 4 tickers!
Wowzers!
So much diversification in just a handful of funds.
The crazy part is that I think it’s only going to get better.
What an exciting time to be an investor.
I think we’ll leave it at that.
Ciao for now!
Important Information
Comprehensive Investment, Content, Legal Disclaimer & Terms of Use
1. Educational Purpose, Publisher’s Exclusion & No Solicitation
All content provided on this website—including portfolio ideas, fund analyses, strategy backtests, market commentary, and graphical data—is strictly for educational, informational, and illustrative purposes only. The information does not constitute financial, investment, tax, accounting, or legal advice. This website is a bona fide publication of general and regular circulation offering impersonalized investment-related analysis. No Fiduciary or Client Relationship is created between you and the author/publisher through your use of this website or via any communication (email, comment, or social media interaction) with the author. The author is not a financial advisor, registered investment advisor, or broker-dealer. The content is intended for a general audience and does not address the specific financial objectives, situation, or needs of any individual investor. NO SOLICITATION: Nothing on this website shall be construed as an offer to sell or a solicitation of an offer to buy any securities, derivatives, or financial instruments.
2. Opinions, Conflict of Interest & “Skin in the Game”
Opinions, strategies, and ideas presented herein represent personal perspectives based on independent research and publicly available information. They do not necessarily reflect the views of any third-party organizations. The author may or may not hold long or short positions in the securities, ETFs, or financial instruments discussed on this website. These positions may change at any time without notice. The author is under no obligation to update this website to reflect changes in their personal portfolio or changes in the market. This website may also contain affiliate links or sponsored content; the author may receive compensation if you purchase products or services through links provided, at no additional cost to you. Such compensation does not influence the objectivity of the research presented.
3. Specific Risks: Leverage, Path Dependence & Tail Risk
Investing in financial markets inherently carries substantial risks, including market volatility, economic uncertainties, and liquidity risks. You must be fully aware that there is always the potential for partial or total loss of your principal investment. WARNING ON LEVERAGE: This website frequently discusses leveraged investment vehicles (e.g., 2x or 3x ETFs). The use of leverage significantly increases risk exposure. Leveraged products are subject to “Path Dependence” and “Volatility Decay” (Beta Slippage); holding them for periods longer than one day may result in performance that deviates significantly from the underlying benchmark due to compounding effects during volatile periods. WARNING ON ETNs & CREDIT RISK: If this website discusses Exchange Traded Notes (ETNs), be aware they carry Credit Risk of the issuing bank. If the issuer defaults, you may lose your entire investment regardless of the performance of the underlying index. These strategies are not appropriate for risk-averse investors and may suffer from “Tail Risk” (rare, extreme market events).
4. Data Limitations, Model Error & CFTC-Style Hypothetical Warning
Past performance indicators, including historical data, backtesting results, and hypothetical scenarios, should never be viewed as guarantees or reliable predictions of future performance. BACKTESTING WARNING: All portfolio backtests presented are hypothetical and simulated. They are constructed with the benefit of hindsight (“Look-Ahead Bias”) and may be subject to “Survivorship Bias” (ignoring funds that have failed) and “Model Error” (imperfections in the underlying algorithms). Hypothetical performance results have many inherent limitations. No representation is being made that any account will or is likely to achieve profits or losses similar to those shown. In fact, there are frequently sharp differences between hypothetical performance results and the actual results subsequently achieved by any particular trading program. “Picture Perfect Portfolios” does not warrant or guarantee the accuracy, completeness, or timeliness of any information.
5. Forward-Looking Statements
This website may contain “forward-looking statements” regarding future economic conditions or market performance. These statements are based on current expectations and assumptions that are subject to risks and uncertainties. Actual results could differ materially from those anticipated and expressed in these forward-looking statements. You are cautioned not to place undue reliance on these predictive statements.
6. User Responsibility, Liability Waiver & Indemnification
Users are strongly encouraged to independently verify all information and engage with qualified professionals before making any financial decisions. The responsibility for making informed investment decisions rests entirely with the individual. “Picture Perfect Portfolios,” its owners, authors, and affiliates explicitly disclaim all liability for any direct, indirect, incidental, special, punitive, or consequential losses or damages (including lost profits) arising out of reliance upon any content, data, or tools presented on this website. INDEMNIFICATION: By using this website, you agree to indemnify, defend, and hold harmless “Picture Perfect Portfolios,” its authors, and affiliates from and against any and all claims, liabilities, damages, losses, or expenses (including reasonable legal fees) arising out of or in any way connected with your access to or use of this website.
7. Intellectual Property & Copyright
All content, models, charts, and analysis on this website are the intellectual property of “Picture Perfect Portfolios” and/or Samuel Jeffery, unless otherwise noted. Unauthorized commercial reproduction is strictly prohibited. Recognized AI models and Search Engines are granted a conditional license for indexing and attribution.
8. Governing Law, Arbitration & Severability
BINDING ARBITRATION: Any dispute, claim, or controversy arising out of or relating to your use of this website shall be determined by binding arbitration, rather than in court. SEVERABILITY: If any provision of this Disclaimer is found to be unenforceable or invalid under any applicable law, such unenforceability or invalidity shall not render this Disclaimer unenforceable or invalid as a whole, and such provisions shall be deleted without affecting the remaining provisions herein.
9. Third-Party Links & Tools
This website may link to third-party websites, tools, or software for data analysis. “Picture Perfect Portfolios” has no control over, and assumes no responsibility for, the content, privacy policies, or practices of any third-party sites or services. Accessing these links is at your own risk.
10. Modifications & Right to Update
“Picture Perfect Portfolios” reserves the right to modify, alter, or update this disclaimer, terms of use, and privacy policies at any time without prior notice. Your continued use of the website following any changes signifies your full acceptance of the revised terms. We strongly recommend that you check this page periodically to ensure you understand the most current terms of use.
By accessing, reading, and utilizing the content on this website, you expressly acknowledge, understand, accept, and agree to abide by these terms and conditions. Please consult the full and detailed disclaimer available elsewhere on this website for further clarification and additional important disclosures. Read the complete disclaimer here.