Could it actually be possible to cobble together an all-weather portfolio, composed of mostly Simplify ETFs, that has the potential to stand shoulder to shoulder with the paradigm-shifting Ray Dalio All Weather portfolio and the remarkably resilient Risk Parity Portfolio (RPAR ETF) developed by Evoke Advisors?
Maybe. Possibly. Let’s find out.
Firstly, I want to give praise to both Ray Dalio as a visionary and the team over at Evoke (Alex Shahidi and Damien Bisserier) as equal visionaries for creating all-weather and risk-parity portfolio solutions for investors.
The importance of Ray Dalio All Weather portfolio and Risk-Parity portfolio, in terms of advancing the way investors think about diversification, is seismic in magnitude.
Industry standard has been in the past, and unfortunately still is currently, obsessed with and over-the-moon enamored by the classic 60/40 portfolio composed of market-cap weighted stocks and aggregate bonds indexes.
Admittedly, this 60/40 combination has served investors remarkably well in past decades but not without challenging hiccups and jarring drawdowns in the early 2000s and 2008.
Right now we’re seeing its Achilles Heel exposed fully, playing out in real-time, for market-cap weighted stocks and bonds only combinations.
Inflationary shocks, which were at one point deemed transitory, have proven to be anything but over the past year.
At this point it’s not outlandish to have the opinion that inflation is pesky, persistent and problematic.

Picture Perfect Portfolio vs Ray Dalio All-Weather Portfolio vs Risk Parity Portfolio

Portfolios composed of merely stocks and bonds, without any significant exposure to uncorrelated alternatives, are facing the brute force of dastardly drawdowns.
Stagflationary regimes often eat stocks and bonds for buffet breakfast.
It’s rough times out there for most investors these days.
Given the current conditions is there anything DIY investors can do to cobble together something that might protect us from the storm?
Let’s explore the possibilities.
Hey guys! Here is the part where I mention I’m a travel vlogger! This strange simulated back-test is entirely for entertainment purposes only. There could be considerable errors in the data I gathered. This is not financial advice. Do your own due diligence and research. Consult with a financial advisor.
These asset allocation ideas and model portfolios presented herein are purely for entertainment purposes only. This is NOT investment advice. These models are hypothetical and are intended to provide general information about potential ways to organize a portfolio based on theoretical scenarios and assumptions. They do not take into account the investment objectives, financial situation/goals, risk tolerance and/or specific needs of any particular individual.
Picture Perfect Portfolio (Simplified Version)

The Picture Perfect Portfolio, an idea I came up with one night while lying restless in bed, is an equal parts equities, bonds and alternatives solution.
A simple 1-2-3 process of diversification.
I got the idea by pondering what is the ‘perfect game’ that just so happens to be exactly the same grid that photographers use to compose the ‘perfect photo’ according to the rule of thirds.
Tic-Tac-Toe my friends.
LOL.
Admittedly, it was as weird of an idea that one could possibly fathom.
But I’ve got to admit I do have an active imagination and given the thought was percolating in my head, I needed to explore the idea further.
It gets its name from its literal definition of “picture perfect” meaning “ideal; completely lacking in defects or flaws” which represents the way I earn my living sporting a camera around my neck as a travel vlogger.
PPP is = equal weight stocks + bonds + alternatives
Nice story and all but does it work?
Yes.
Yes, it sure does.
How it differs from the classic All-Weather and Risk-Parity Portfolios is that it is not 20% of this, 40% of that, 35% of something else and a sliver of 7.5% of another thing but instead is simply 33.33% stocks + 33.33% bonds + 33% alternatives.
It balances itself out naturally.
One might say it attempts to = Simplify
What else is different?

Minimum Volatility Equities
It breaks the mold of market-cap weighted stock indexes, which are prone to more frequent boom and bust cycles, and instead goes for the shield of the most defensive equity factor available:
Minimum Volatility.
Why global minimum volatility as a factor works so well, has to do with the fact it has historically been as much as 1000+ basis points more defensive in times of turbulent markets in relation to market cap-weighted indexes.
Got an example?
Sure.
In 2008, when global market-cap weighted equities were down -40.7%, global minimum volatility stocks were down -29.2%.
2000 was a year MSCI global minimum volatility stocks were above water at 1.20% while its parent index was down -13.2%.
Finally, in 2015 when global market-cap weighted equities were down -0.90% global min vol was kept itself in the black with 5.8%.
Overall, its defensive characteristics has it typically 4-5 standard deviation points less risky than its parent index.
It’s the picture perfect equity strategy to implement in an all-weather style of portfolio.
Anything else different?
Yes.

Managed Futures
Instead of long-only gold and commodity exposure, the Picture Perfect Portfolio shifts to a managed futures strategy of trend-following.
The reasons for this are numerous but the main one is simply this form of long/short exposure to commodity, bonds and currency markets is less prone to harsh negative years given it adapts like a chameleon to the current market trends.
The index I prefer to track for this alternative sleeve of the portfolio is SG Trend.
Consider Gold has had its worst year in the 21st Century of -28.33% (2013) and Commodities at -45.75% (2008) versus SG Trend at -8.11% (2018).
This is a significant advantage for making the Picture Perfect Portfolio more efficient and ready to defend.
The last component is bonds. I’d normally like to utilize a combination of LTT and TIPs but we’ll go with the 10 Year Treasury for this simulation given that an ETF exists within that range that allows me to create additional space in my portfolio.
The complete version of the Picture Perfect Portfolio also has a small allocation to GOLD but we’re just using a simplified version of PPP with 3 simple strategies here:
40% MSCI Global Minimum Volatility Equities
40% 10 Year Treasury
40% SG Trend
We’ll use RPAR as our benchmark spreading out over a 120% canvas to match this ETFs coverage.
And the results?
Let’s see!

Simplified Picture Perfect Portfolio Back-Test
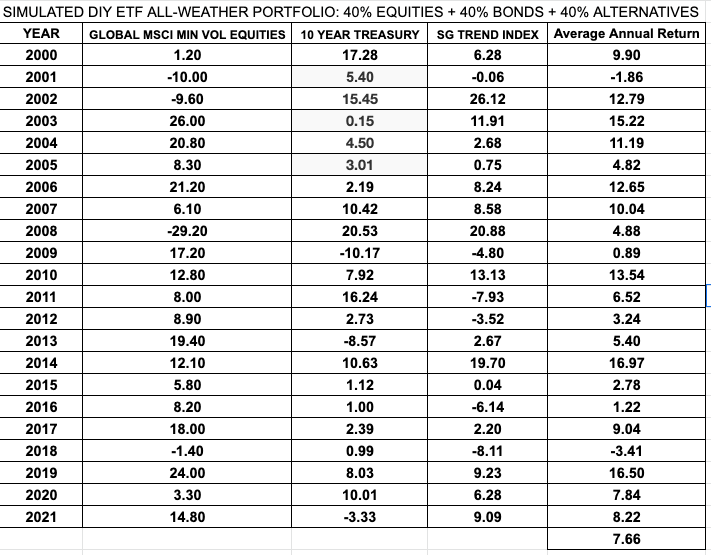
In its favour the Picture Perfect Portfolio had a simulated success rate of 20/22 years = 90.8%
It had a worst year of -3.41% in 2018 and its only other negative year in 2001 at -1.86%.
The rest of the time it was above water albeit some years like 2009 (0.89%) and 2016 were indeed challenging (1.22%).
Maybe most exciting of all is that it was above water in 2008 at 4.88% when most other investors portfolios were an out of control train-wreck.
I would say given the results it more than fulfilled its mandate of being all-weather, all-seasons and overall resilient across various economic regimes.

Risk Parity RPAR ETF
Fortunately, the wildly popular (and in my opinion deservedly so) RPAR has simulated its index dating back to 1999.
We can take a look at the results of the Risk Parity strategy year by year in comparison to its equity only benchmark.
The results are most impressive.
But before we examine those first let’s see how this fund is exactly composed.
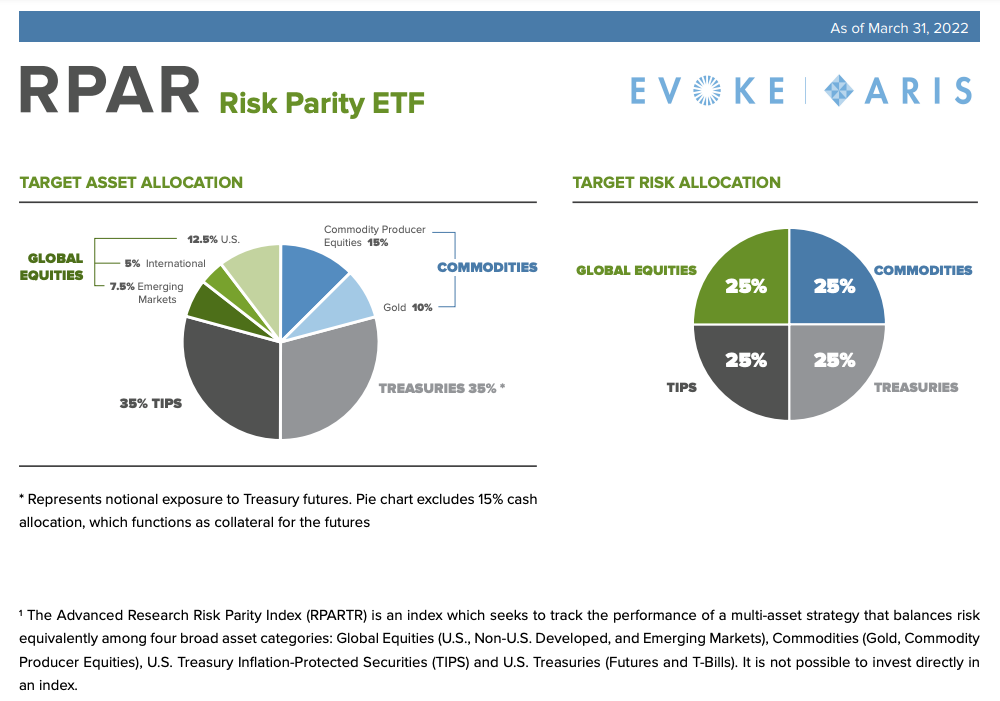
Given it is a risk-parity strategy the least risky asset classes take up the greatest components of the fund: TIPS and Treasuries
Globally diversified equities, gold and commodity producer equities round things out given they’re more volatile.
Overall we’ve got exactly this for a 120% expanded canvas:
35% TIPS
35% Treasuries
15% Commodity Producers
10% Gold
12.5% US Equities
5% Int-Dev Equities
7.5% Emerging Market Equities
This is a beautifully diversified fund that is global in nature.
Let’s see how it performed in the back-test simulation!
Risk Parity Simulation Back-Test
Wow! Super duper impressive results.
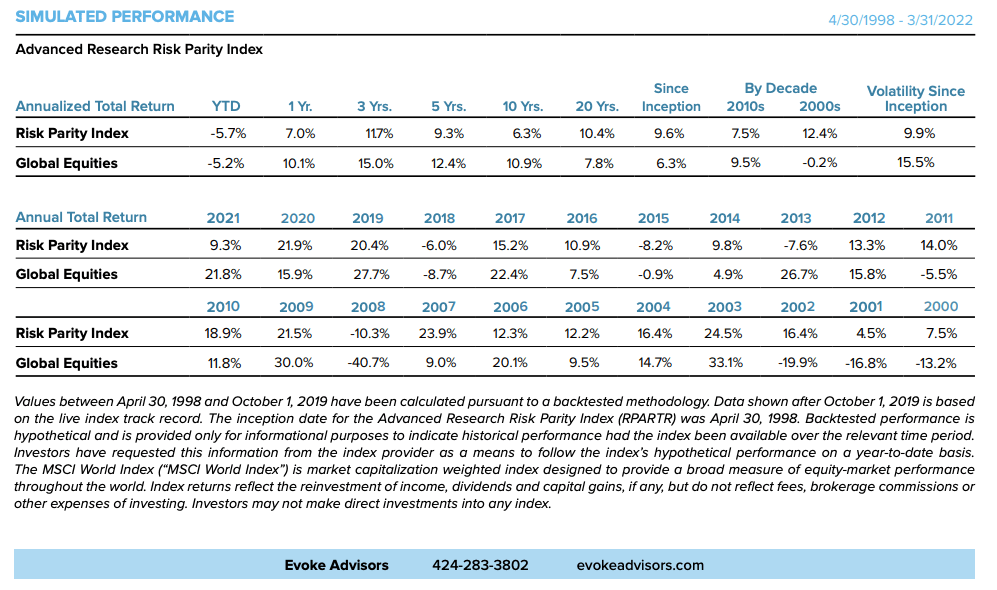
RPAR, with its risk parity strategy of diversification, was a world class performer in the 2000s when global equities were struggling mightily.
In the 2000s the simulated Advanced Research Risk Parity Index returned 12.4% when Global Equities were -0.2% for the decade!
Moreover, it was above water in 2000, 2001 and 2002 with respective returns of 7.5%, 4.5% and 16.4% versus global equities returns of -13.2%, -16.8% and -19.9%.
Equally as impressive it shielded investors from the 2008 storm being down only -10.3% versus -40.7% for global equities and it posted a dramatic comeback year in 2009 with a 21.5% return.
What I love the most is that it clearly outperforms its global equities benchmark over a 20 year period with 10.4% returns and a risk of 9.9% (since inception) vs 7.8% returns and a risk of 15.5% (since inception).
Triple gold medals for RPAR ETF in terms of returns outperformance plus Sharpe and Sortino ratios domination.
A CAGR that is higher than its RISK is quite frankly a remarkable achievement.
It posted 18 positive years and only 4 negative ones (18/22) = 81.8% success rate
A global equities only mandate on the other hand featured 7 negative years (15/22) = 68.18% success rate
Its worst year was only -10.3% in 2008
Bravo RPAR!
There is no doubt why this fund is possibly the most successful alternative ETF of all time with a current AUM of 1.5 billion.
It brings with it tremendous results and enhanced stability in simulated back-tests.

Ray Dalio All-Weather Portfolio
Let’s move on to the Ray Dalio inspired All-Weather Portfolio.
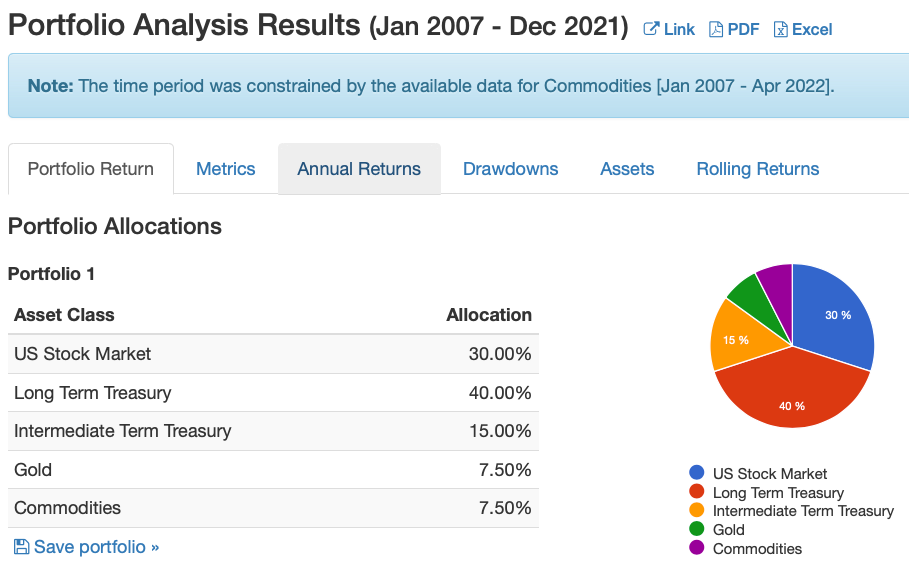
This Portfolio consists of the following:
30% US Total Stock Market
40% Long-Term Treasury
15% Intermediate Term Treasury
7.5% Gold
7.5% Commodities
A diversification masterpiece consisting of equities, bonds and alternatives.
Unfortunately, using the limited tools I have at my disposal, I wasn’t able to get results for commodities dating back further than 2007.
Hence, I’ve made a substitute, albeit one that deviates from the portfolio, of just boosting the gold allocation from 7.5% to 15%.
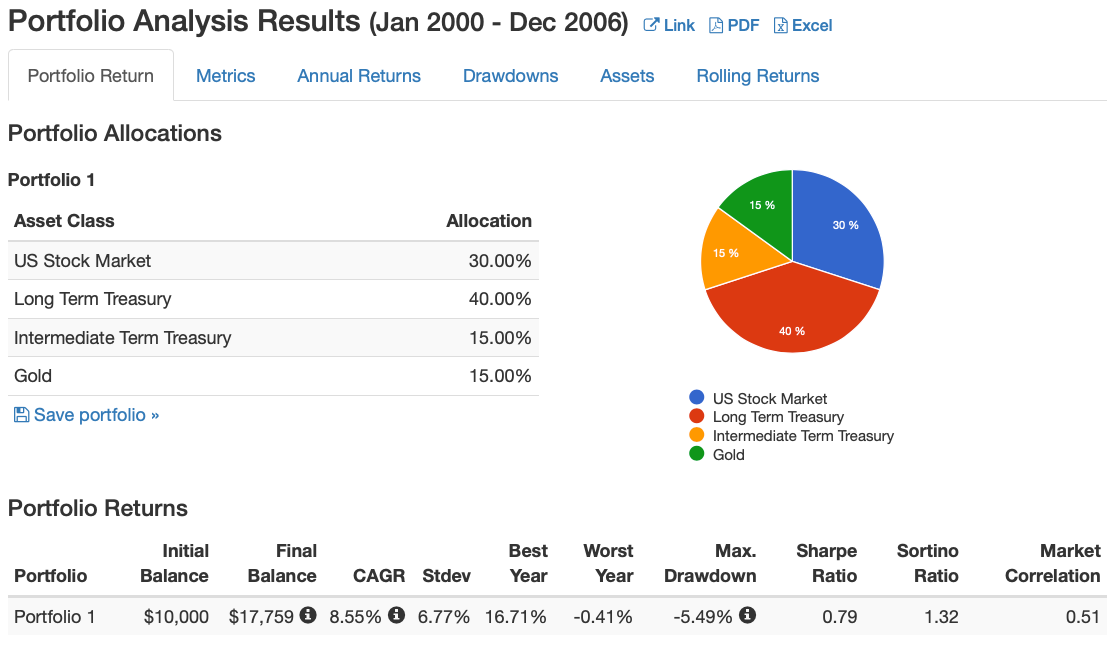
This is obviously inferior to the real-thing and I apologize for that.
The results need to taken with a grain of salt given this compromise.
Once again to keep up with RPAR and the Picture Perfect Portfolio, the Ray Dalio All-Weather Portfolio has 20% leverage applied for an overall expanded canvas of 120%.
Ray Dalio All-Weather Back-Test
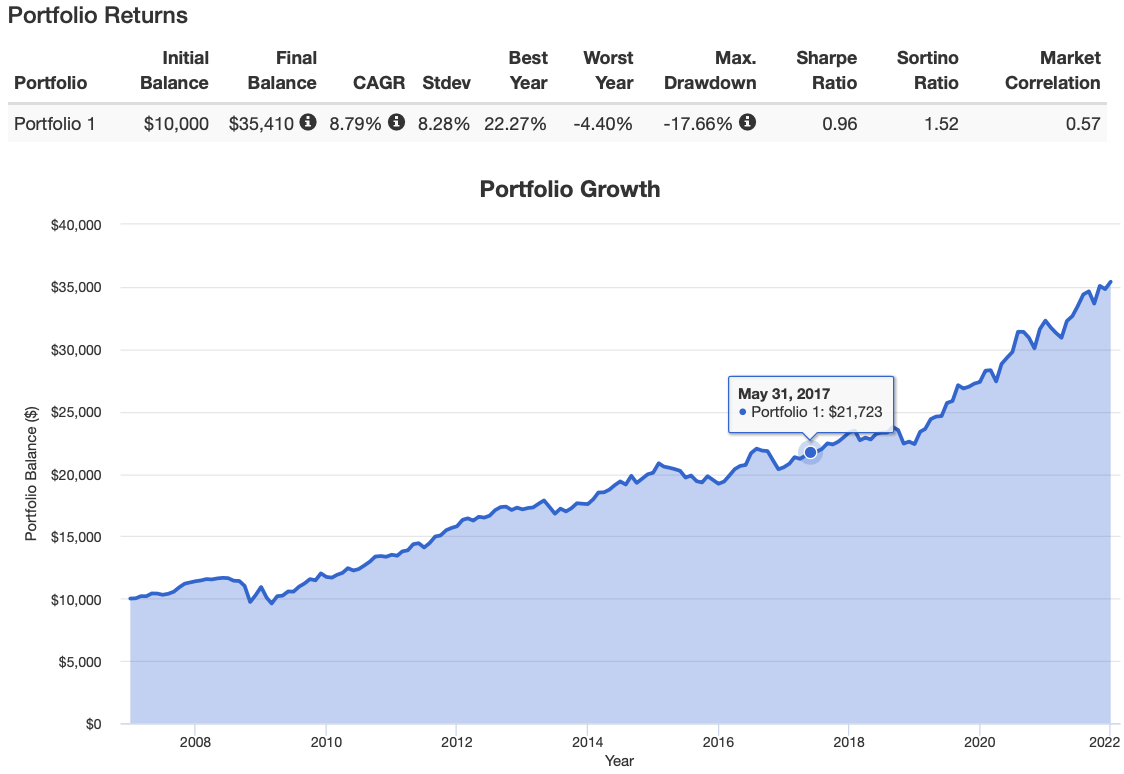
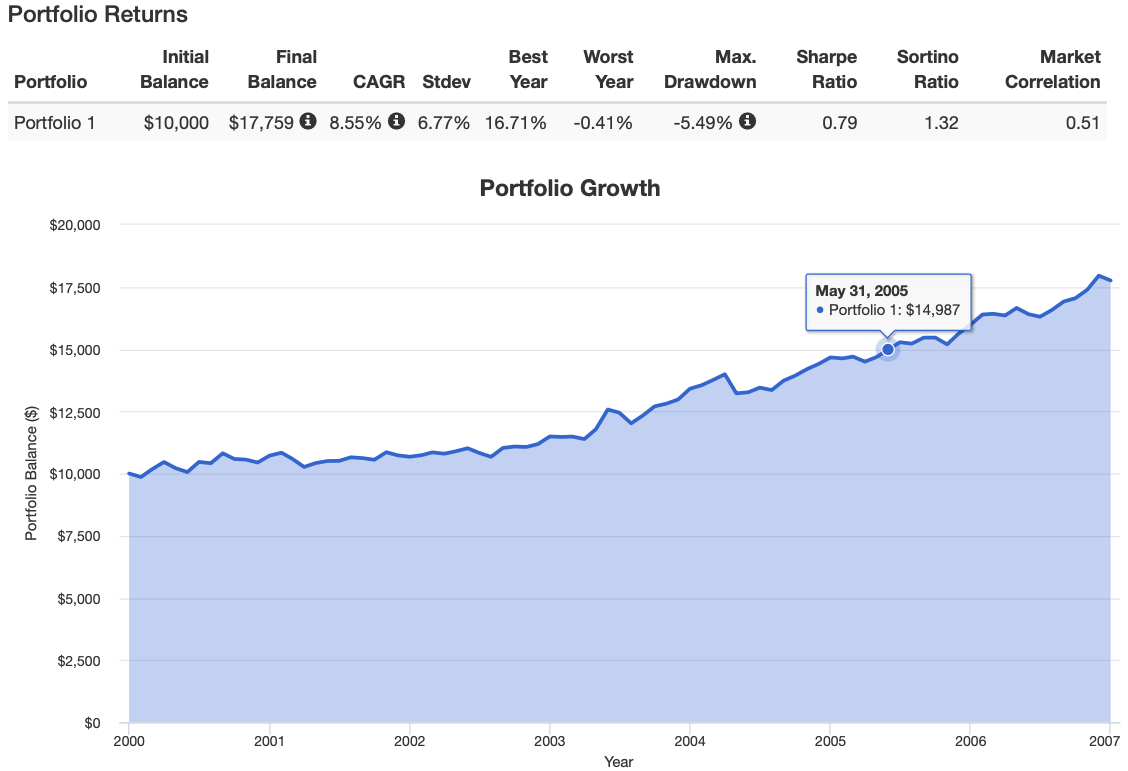
Ray Dalio All-Weather Annual Returns
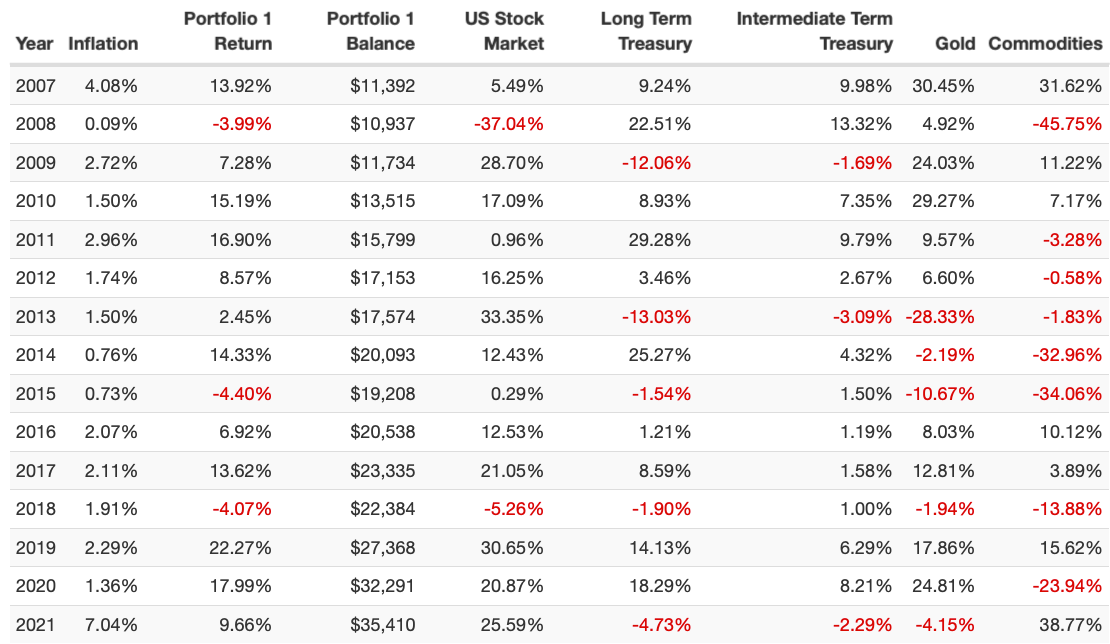
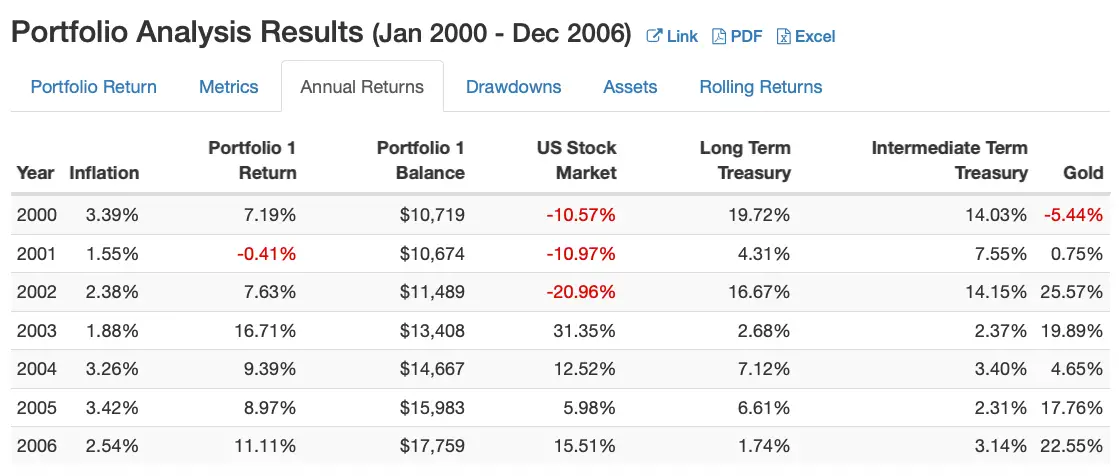
Well, nothing has changed in terms of my opinion that Ray Dalio is a next-level genius!
The results speak for themselves.
Classic all-weather performance in the early 2000s when the Total US stock market was down -10.57% (2000), -10.97% (2001) and -20.96% (2002).
How did the All-Weather Portfolio perform in 2008 versus the US Total stock market? -3.99% vs -37.04%
Wow!
And a recovery of 7.28% in 2009.
Its worst year was only -4.40% in 2015.
The All-Weather portfolio only had 3 or 4 negative years out of 22 in this back-test 18 or 19 out of 22 = 81.8% or 86.36% success rate
The All-Weather portfolio is a master-class in terms of diversification, moving beyond just stocks and bonds, and anyone developing all-season portfolios today likely owes Ray a debt of gratitude (and a beer or two) for being the pioneer of alternative asset class allocation that prepares portfolios for all possible economic regimes.

Picture Perfect Portfolio ETFs
We’ll use the following ETFs to cobble together the simplified Picture Perfect Portfolio.
Keep in mind, the results of the underlying funds may very well not line-up with the simulation I used above where, for example, I used a generic SG Trend index to represent a managed future strategy.
40% $ACWV (iShares MSCI Global Min Vol Factor)
40% $CTA (Simplify Managed Futures Strategy ETF)
16% $TYA (Simplify Intermediate Term Treasury Futures Strategy ETF)
4% $CYA (Simplify Tail Risk Strategy ETF)
The Picture Perfect Portfolio, at the 120% canvas level (excluding the tail risk strategy) can easily be put together using one product from iShares to grab the global minimum volatility equities and the rest of the products from innovative new ETF provider Simplify.
The only ETF review that I’ve done on my site to date where the fund I was reviewing didn’t make it into my portfolio was ticker SPD – a Simplify offering.
However, I’m really excited by a lot of the products they’re creating and TYA is the biggest reason we can expand the canvas of this portfolio so effortlessly.
As a 2.5X to 3X intermediate to 10 year treasury fund allocating at 16% gives me the equivalent of 40% bond exposure at the 2.5X level.
I can then add the other strategies and still have some room leftover.
Guess what?
I can utilize that space to grab an insurance policy with ticker CYA at 4%.
This further improves the diversification of the simplified Picture Perfect Portfolio as it would collect on its policy during the most volatile times in the market while minimum volatility equities would likely be experiencing less carnage relative to a market-cap weighted strategy.
That sounds delicious.
I’m overall very pleased with the results of being able to cobble this together with just 4 funds and hats-off to Simplify for creating these versatile building blocks.
Imagine if this existed as an all-in-one product?
I do.

Nomadic Samuel Final Thoughts
It’s an exciting time to be a DIY investor these days with products like RPAR ETF and the funds I mentioned above from Simplify to compose the Picture Perfect Portfolio.
The ability to assemble All-Weather and Risk Parity portfolios with ease is now greater than ever.
Moreover, the creative evolution and application of diversification strategies that extend beyond traditional asset classes (eg: managed futures + convexity) and optimization of equities (minimum volatility strategy) give DIY investors creative building blocks that didn’t exist not long ago.
It’ll be fascinating to see what happens in the future as more all-weather and risk-parity strategies emerge from a bottoms up approach.
So let’s now go back to the initial sentence I wrote at the beginning of the article.
Was I able to, as a humble DIY investor, compose a portfolio that could stand next to the giants of an All-Weather and/or Risk-Parity strategy?
I think so.
I was at least able to limit my hypothetical negative years to just 2.
If I could I would combine my Picture Perfect Portfolio with the Risk Parity Portfolio and the All Weather Portfolio to create an equal parts diversification goliath three-headed monster.
Just the thought of being able to do that excites me beyond belief.
I’m trying to bring to life the Picture Perfect Portfolio and I hope it will one day be an option for investors to consider as an ETF in the all-weather genre of funds.
I’ve always dreamed big, so why not with this idea?
Ticker PPP as an ETF in the new future?
Maybe?
It sounds Picture Perfect to me.
Important Information
Comprehensive Investment Disclaimer:
All content provided on this website (including but not limited to portfolio ideas, fund analyses, investment strategies, commentary on market conditions, and discussions regarding leverage) is strictly for educational, informational, and illustrative purposes only. The information does not constitute financial, investment, tax, accounting, or legal advice. Opinions, strategies, and ideas presented herein represent personal perspectives, are based on independent research and publicly available information, and do not necessarily reflect the views or official positions of any third-party organizations, institutions, or affiliates.
Investing in financial markets inherently carries substantial risks, including but not limited to market volatility, economic uncertainties, geopolitical developments, and liquidity risks. You must be fully aware that there is always the potential for partial or total loss of your principal investment. Additionally, the use of leverage or leveraged financial products significantly increases risk exposure by amplifying both potential gains and potential losses, and thus is not appropriate or advisable for all investors. Using leverage may result in losing more than your initial invested capital, incurring margin calls, experiencing substantial interest costs, or suffering severe financial distress.
Past performance indicators, including historical data, backtesting results, and hypothetical scenarios, should never be viewed as guarantees or reliable predictions of future performance. Any examples provided are purely hypothetical and intended only for illustration purposes. Performance benchmarks, such as market indexes mentioned on this site, are theoretical and are not directly investable. While diligent efforts are made to provide accurate and current information, “Picture Perfect Portfolios” does not warrant, represent, or guarantee the accuracy, completeness, or timeliness of any information provided. Errors, inaccuracies, or outdated information may exist.
Users of this website are strongly encouraged to independently verify all information, conduct comprehensive research and due diligence, and engage with qualified financial, investment, tax, or legal professionals before making any investment or financial decisions. The responsibility for making informed investment decisions rests entirely with the individual. “Picture Perfect Portfolios” explicitly disclaims all liability for any direct, indirect, incidental, special, consequential, or other losses or damages incurred, financial or otherwise, arising out of reliance upon, or use of, any content or information presented on this website.
By accessing, reading, and utilizing the content on this website, you expressly acknowledge, understand, accept, and agree to abide by these terms and conditions. Please consult the full and detailed disclaimer available elsewhere on this website for further clarification and additional important disclosures. Read the complete disclaimer here.


Great article. You’re writing about all the things I’ve been researching and thinking about over the past three years or so. Great job.
In theory, M1 Finance could enable creating that 3-headed monster portfolio quite easily (assuming RPAR and the newer Simplify ETFs were/are available on their platform – may not be yet).
But on the other hand, is that going to perform better than Standpoint’s BLNDX/REMIX? Who knows.
I agree with your recent articles about Trend Following. If you were to combine some basic trend following principles to that 3-headed goliath portfolio, perhaps all the better. For example, RPAR – that’s been on a distinct downtrend since January. No sense B&H through that!