Given that large cap stock investing identifies the most famous and well-known companies (and is prone to investor exuberance) and small-cap investing is where value investors prefer to hang-out, where does that leave mid cap?
As possibly the most underrated equity strategy of them all.
I had been planning on writing an article next month on how mid-cap investing offers attractive historical returns but a recent tweet by Christine Benz of Morningstar pushed this idea rapidly up my publishing queue.
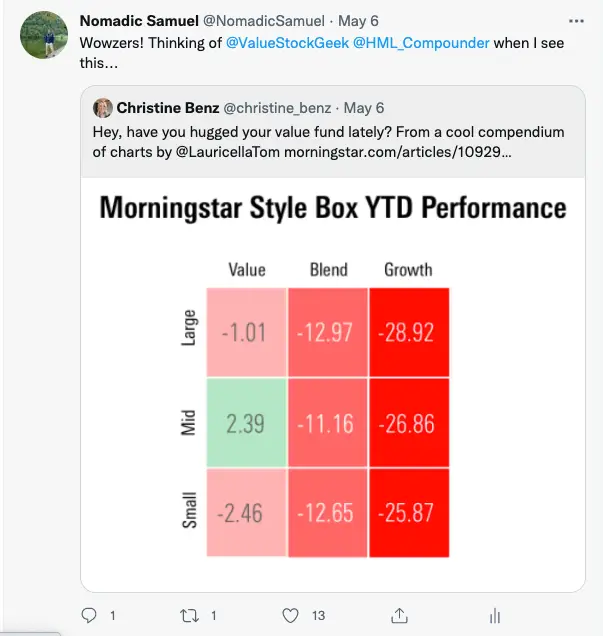
Wowzers!
I realize it has been a challenging year for equity investors of all shapes, sizes and stripes but I had no idea the relative outperformance of value versus growth.
The one chink in that sea of bloody red armor has been mid-cap value offering a lone slice of green on the year.
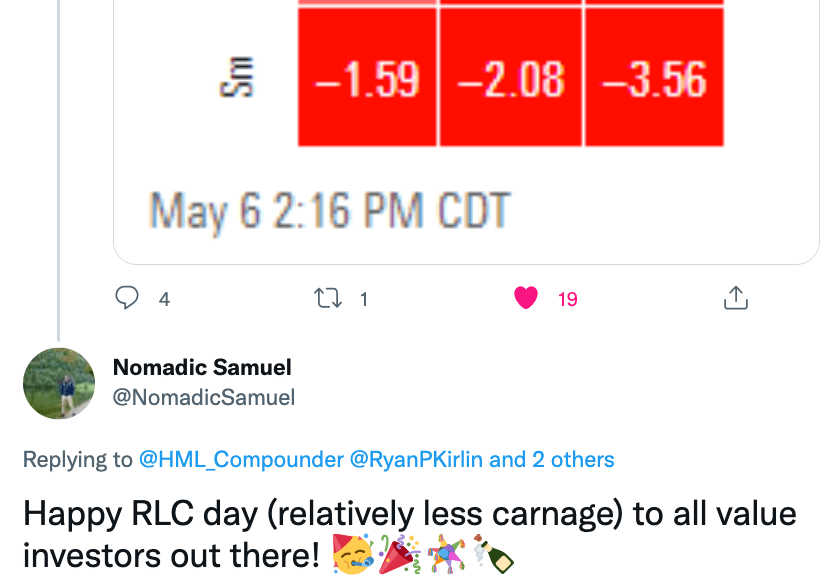
I’ve recently been teasing my value investing friends on Twitter they’ve been celebrating a whole lot of RLC days this year!
RLC = relatively less carnage
And as it turns out they’ve had very good reasons to be “relatively” happy.
I also follow Bobby Blue, Jeffrey Ptak and Ben Johnson from Morningstar on twitter.
It’s my favourite platform for examining funds from a fundamentals, style-box factor and recent performance/AUM standpoint.
I’ll highlight a mid-cap fund I’ve screened using Morningstar tools later on in this article but for the meantime let’s get back on track with finding out why mid-cap investing is so undeservedly underrated.

Mid Cap Stock Investing= Most Underrated?
Hey guys! Here is the part where I mention I’m a travel vlogger! This mid-cap review is entirely for entertainment purposes only. There could be considerable errors in the data I gathered. This is not financial advice. Do your own due diligence and research. Consult with a financial advisor.

These asset allocation ideas and model portfolios presented herein are purely for entertainment purposes only. This is NOT investment advice. These models are hypothetical and are intended to provide general information about potential ways to organize a portfolio based on theoretical scenarios and assumptions. They do not take into account the investment objectives, financial situation/goals, risk tolerance and/or specific needs of any particular individual.
What is Mid-Cap Market Capitalization

Stocks/companies that are considered as middle capitalization (mid-cap) have a market value between $2 and $10 billion.
For comparison sake, large-cap companies are those over $10 billion whereas small-cap stocks are within the range of $300 million to $2 Billion.
As one might expect, mid-cap sits comfortably in the middle.

Forgotten Child: Family Of Market-Cap Sizes?
Consider a family of 3 children from a birth order perspective.
The firstborn (large-cap) given its unique status of having had no siblings during its early years received all the attention for awhile. Throughout its life cycle it’s always achieving new feats first relative to its other siblings.
The newborn (small-cap) is now receiving the most attention given its status as the smallest, neediest and most vulnerable of all.
And mid-cap? It’s the forgotten one in the middle. It never received as much attention as the firstborn given it had a sibling from day one. And now it’s getting even less with its small-cap younger sibling.
In many ways this analogy describes the way growth and value investors commit resources.
Large-cap growth companies, the most famous and well identified in the marketplace, are forever prone to investor exuberance given they’re a part of our everyday brand collective consciousness.
It’s easy to form narratives around them. This is the company that will change the future of this given industry.
Small-cap is the perpetual darling of value investors. It’s where they’ve typically gone fishing.
And mid-cap is of course the forgotten one.
But does it deserve its irrelevant fate?
No. It does not.
Let’s find out why.

Mid-Cap “Sweet Spot” Of The Market
Given that mid-cap companies have not only survived but also moved up the ranks (from small-cap designation) shows a level of resilience and progression.
They’re smack-dab in the middle of their growth curve.
A combination of already proven resilience and future potential growth as they have the opportunity to eventually become large cap companies in the future.

Mid-Cap Performance 20th Century
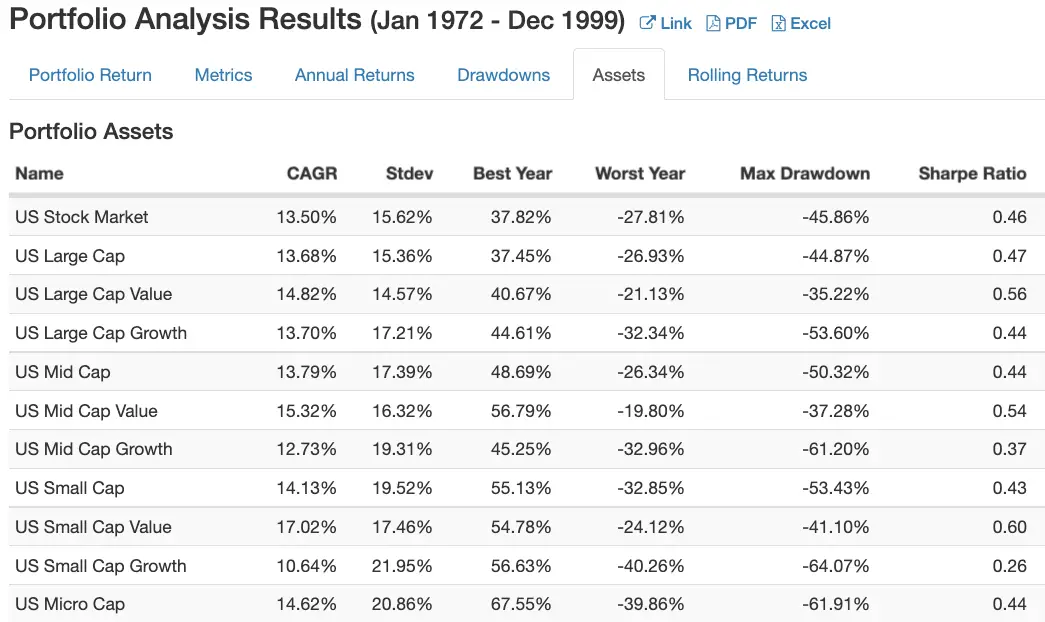
In terms of 20th Century performance (1972 to 1999) here is how the following US asset classes (by market-cap) did out of 11 possible configurations.
1st US Small-Cap Value = 17.02%
2nd US Mid-Cap Value = 15.32%
3rd US Large-Cap Value = 14.82%
4th US Micro-Cap = 14.62%
5th US Small-Cap = 14.13%
6th US Mid-Cap = 13.79%
7th US Large-Cap Growth = 13.70%
8th US Large-Cap = 13.68%
9th US Total Stock Market = 13.50%
10th US Mid-Cap Growth = 12.73%
11th US Small-Cap Growth = 10.64%
Hands-up how many of your knew that mid-cap value was in 2nd place behind only small-cap value?
On the podium with a silver medal.
US Mid-Cap coming in at 6th place beat US Large-Cap and US Large-Cap Growth.
Finally, US Mid-Cap Growth avoided last-place by finishing one slot ahead of small-cap growth.
The interesting take-home message for me is that Mid-Cap value and Mid-Cap blend offer very attractive options for investors.
Mid-Cap growth shows the vulnerability of the asset class not quite having the stability of large-cap companies.
Mid-Cap Performance 21st Century

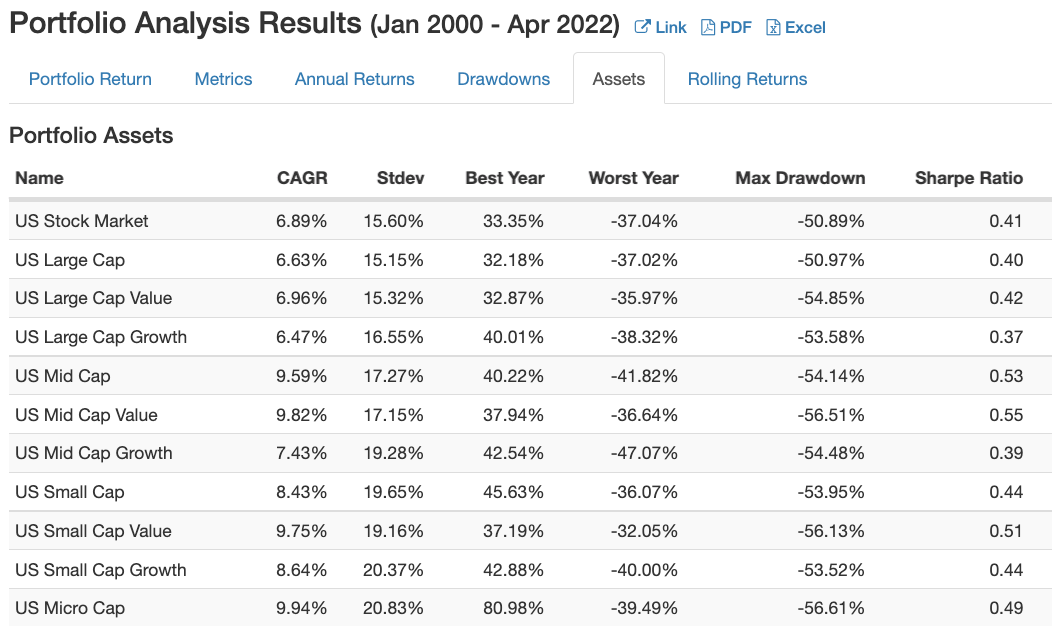
Data from the 20th century is all fine and dandy but how have the 11 possible US asset classes (by market-cap) fared in the 21st century?
Overall not as well.
1st US Micro-Cap = 9.94%
2nd US Mid-Cap Value = 9.82%
3rd US Small-Cap Value = 9.75%
4th US Mid-Cap = 9.59%
5th US Small-Cap Growth = 8.64%
6th US Small-Cap = 8.43%
7th US Mid-Cap Growth = 7.43%
8th US Large Cap Value = 6.96%
9th US Total Stock Market = 6.89%
10th US Large-Cap = 6.63%
11th US Large-Cap Growth = 6.47%
My oh my friends, look at Mid-Cap Value grabbing the silver medal once again finishing in 2nd place overall out of 11.
In the 21st century mid-cap value has triumphed over small-cap value in terms of overall performance.
Mid-Cap blend, coming in the runner-up category of forth place (not quite a bronze medal), has soundly defeated small-cap blend and every single configuration of large-cap investing.
For those in recent months suggesting “value is dead” they clearly haven’t looked at the data.
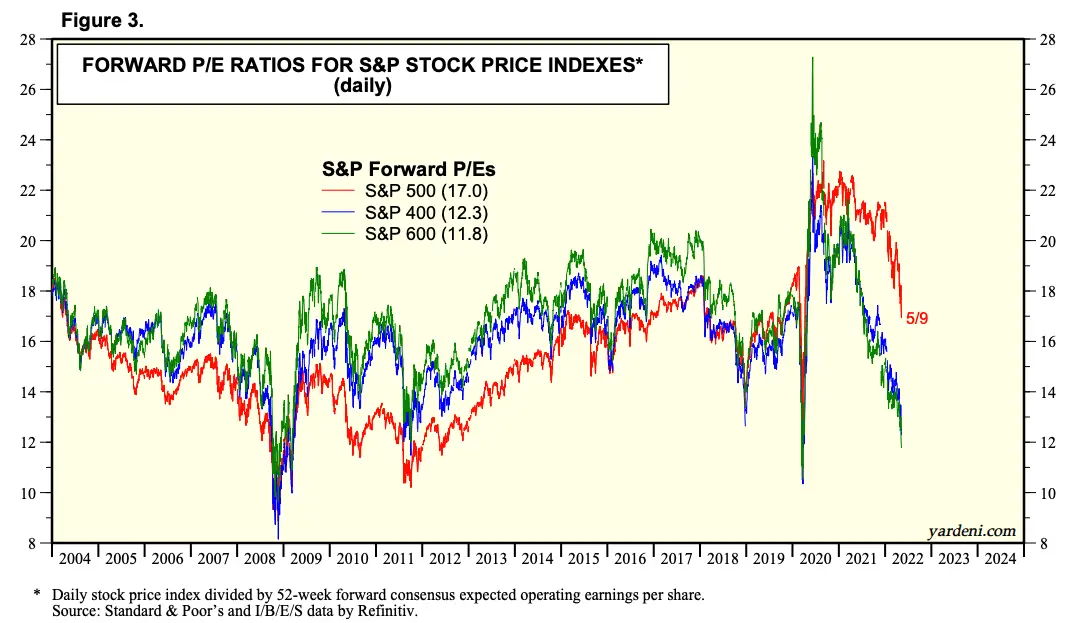
With high P/E stocks mostly clustering in the US large-cap arena, US mid-cap and US small-cap may be poised for further relative outperformance moving forward.

Mid-Cap No Lost Decades (70s and 2000s)
US Large Cap blend (basically the S&P 500) has been well identified by its lost decade performance in both the 70s and 2000s.
How did mid-cap value and mid-cap perform during these decades?
Let’s find out.

70s Lost Decade for US Large-Cap
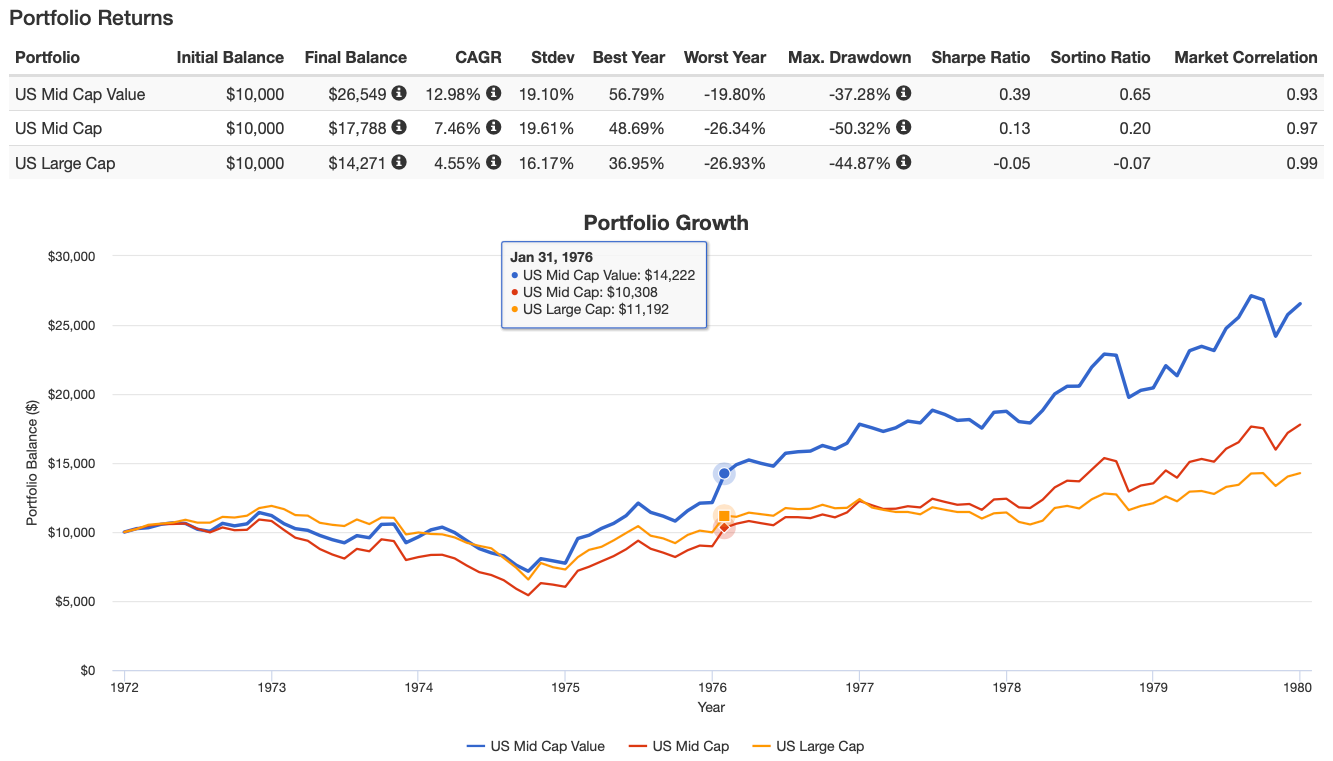
When you factor in inflation the 70s was a brutal time for US large-cap investors.
Although I’m limited in back-tests with PortfolioVisualizer.com from 1972-1979, the overall picture is not a rosy one.
US Large Cap = 4.55% for the decade vs pesky persistent inflation of double digits during certain years.
How did US Mid-Cap and US Mid-Cap Value perform in the 70s?
Mid-Cap = 7.46% and Mid-Cap Value = 12.98%
These would have been far better plays.

2000s Lost Decade for US Large-Cap
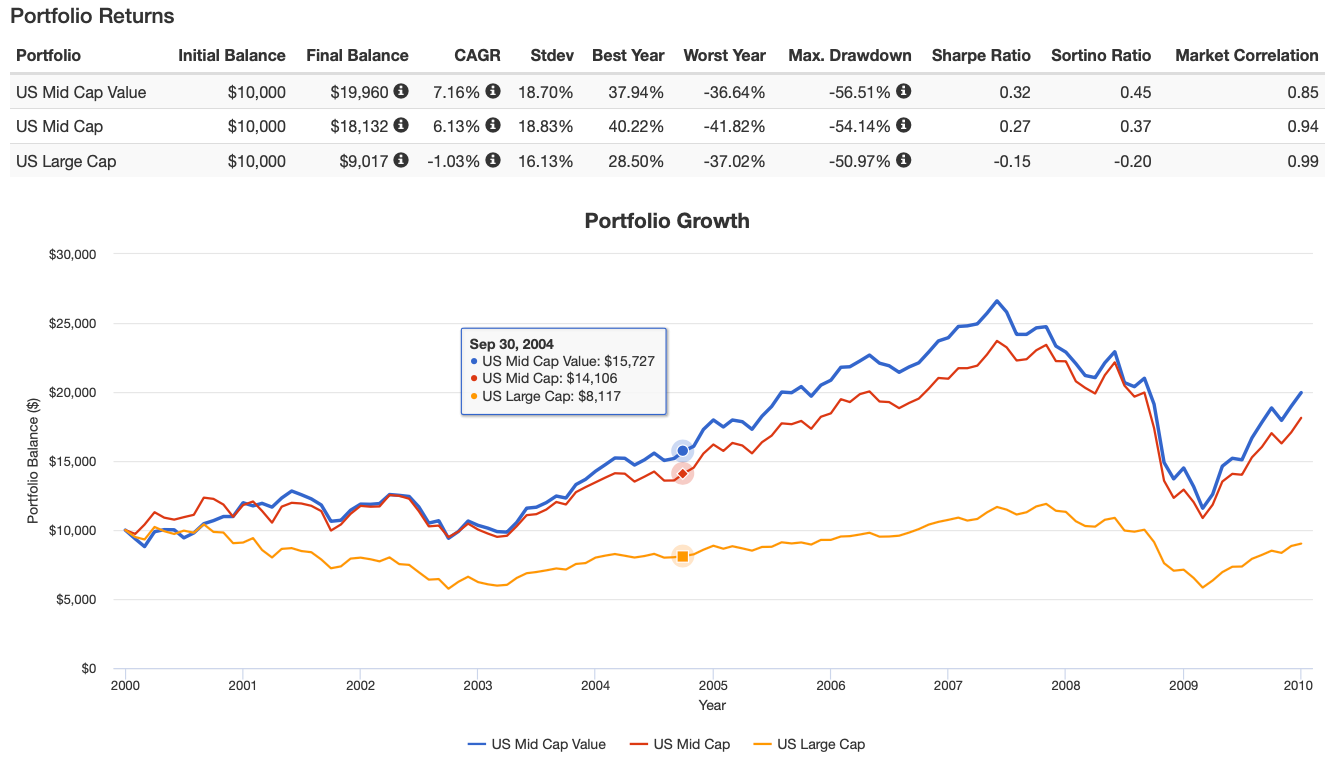
The 2000s paints and even more convincing case to allocate to US mid-cap strategies versus being all-in on US Large Cap S&P.
US Large-Cap was demolished and truly had a lost decade with a -1.03% return.
US Mid-Cap provided far more stability at 6.13% and US Mid-Cap value at 7.16%.
The take-home message being US mid-cap hasn’t had a lost decade over the 70s, 80, 90s, 2000s or 2010s unlike US large-cap blend.
From a sequence of returns risk point of view it seems prudent to consider mid-cap in your portfolio – especially if you’re in the withdrawal stages of your life.

Morningstar = Screening Mid-Cap Funds
Tying all of this back to Morningstar, I’ve used their tools and resources to identify some of my favourite mid-cap funds.
One particular fund I’m intrigued by is FEMS = First Trust Emerging Markets SC Alphadex ETF.
Given that Emerging markets have relatively been out of favour in the past-decade, as a sponge investor, I’m constantly seeking bargains in the market-place.
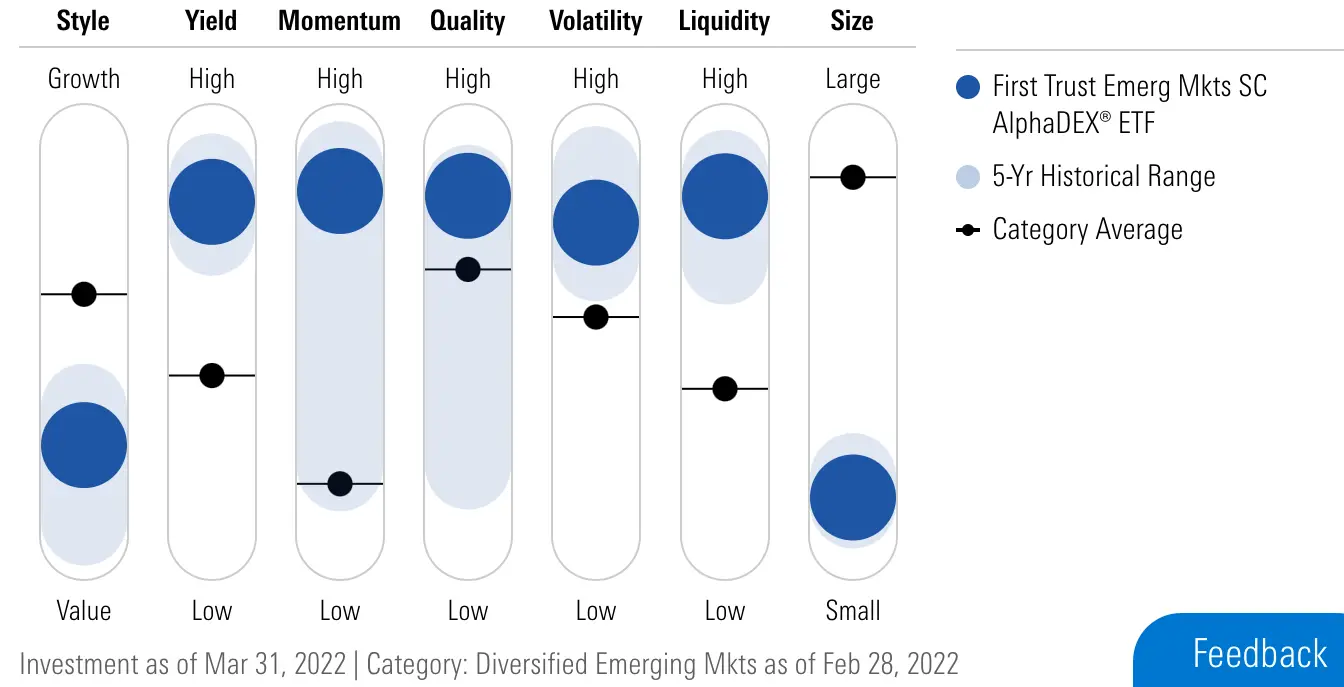
With Morningstar Factor Profile I’m able to screen funds for factors I’m seeking.
This fund in particular has a delicious combination of value, yield, momentum, quality and size (small) that I typically seek for multi-factor equity exposure.
I’m ecstatic with how hard it is pulling on all of the equity factor levers.
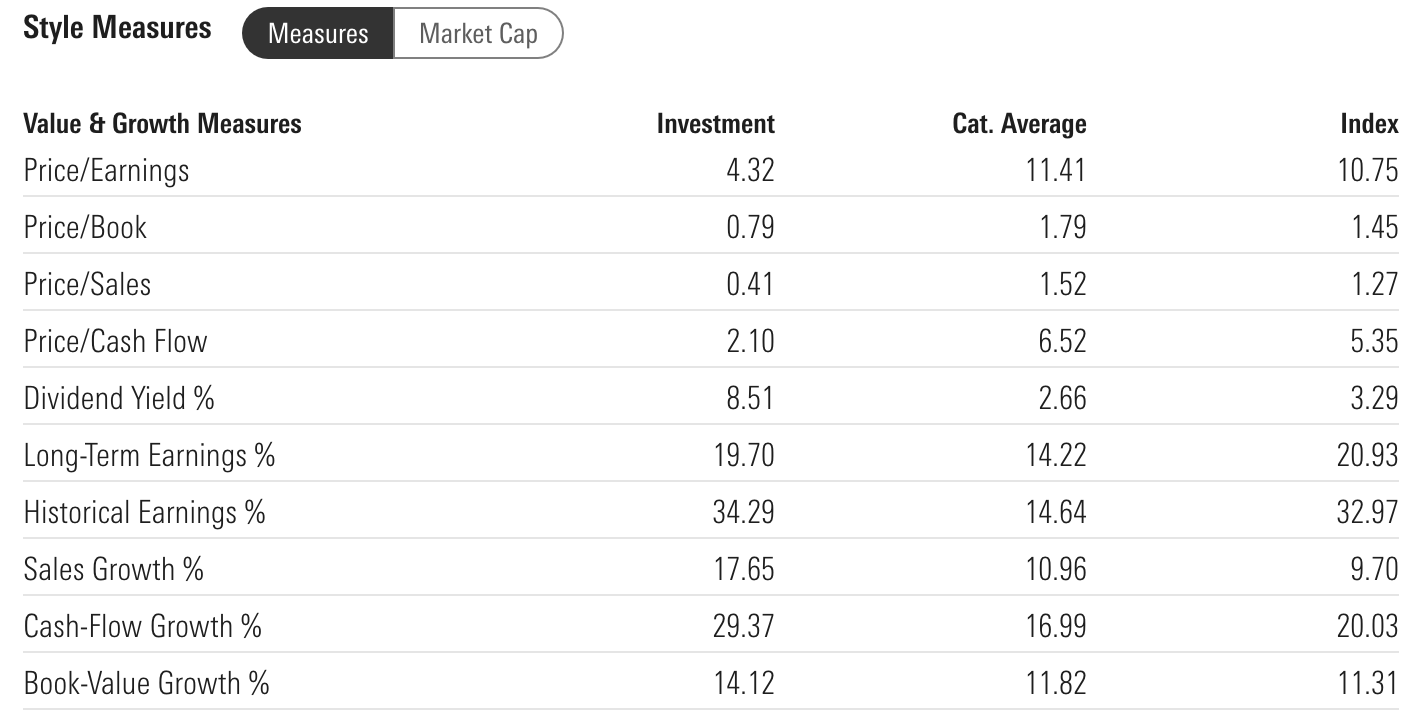
Next, I often utilize Style Measures to check out Price / Earnings, Historical Earnings % and Cash-Flow Growth %.
FEMS with a 4.32 P/E has one of the most attractive price relative to earnings single digit numbers I’ve ever screened.
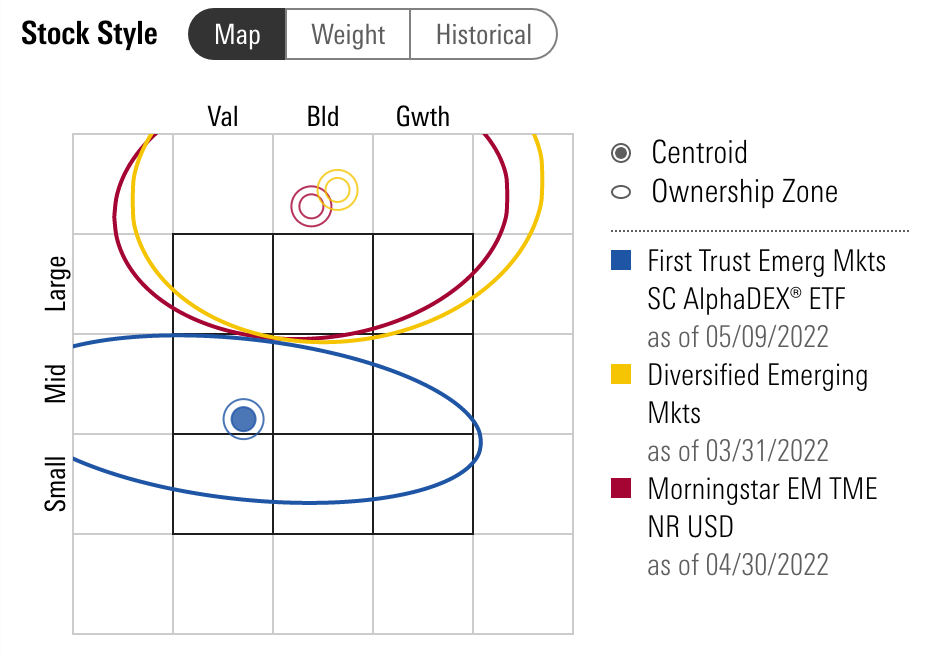
The Stock Style is where I’ll find the bullseye of the fund.
You’ll notice FEMS bullseye is on the lower left hand corner of the mid-cap range we’re talking about in this article.
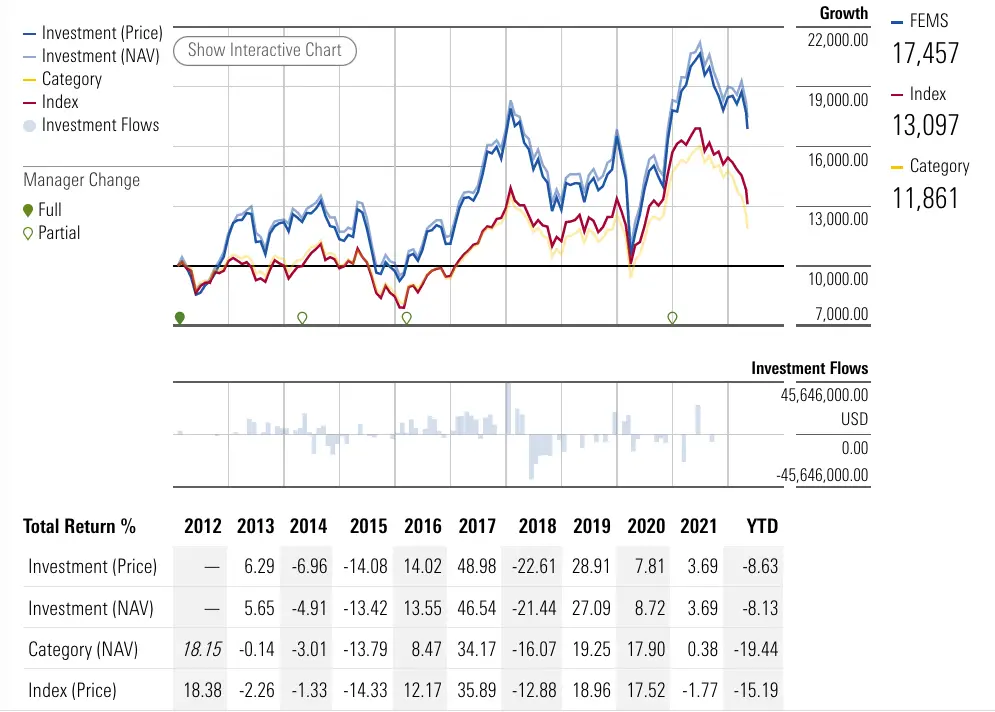
Finally, I’ll often check the performance of the fund relative to its benchmark.
Here I notice FEMS outperforming typical Emerging market funds.
I don’t care about recent performance all-that-much but I still find it useful to examine.

Nomadic Samuel Final Thoughts
Does mid-cap value or mid-cap blend deserve a potential place in your portfolio?
Given that mid-cap value has placed 2nd in both the 20th and 21st century I believe it warrants careful consideration.
Mid-cap blend has outperformed small-cap blend and large-cap blend in the 21st century as well.
However, my favourite configuration of mid-cap investing involves funds featuring long-short equities, Emerging markets and fund-of-fund strategies.
Now over to you.
Are you a mid-cap investor?
Does mid-cap have a potential spot in your portfolio?
Do you use Morningstar to screen your funds?
Let me know in the comments below.
Important Information
Comprehensive Investment Disclaimer:
All content provided on this website (including but not limited to portfolio ideas, fund analyses, investment strategies, commentary on market conditions, and discussions regarding leverage) is strictly for educational, informational, and illustrative purposes only. The information does not constitute financial, investment, tax, accounting, or legal advice. Opinions, strategies, and ideas presented herein represent personal perspectives, are based on independent research and publicly available information, and do not necessarily reflect the views or official positions of any third-party organizations, institutions, or affiliates.
Investing in financial markets inherently carries substantial risks, including but not limited to market volatility, economic uncertainties, geopolitical developments, and liquidity risks. You must be fully aware that there is always the potential for partial or total loss of your principal investment. Additionally, the use of leverage or leveraged financial products significantly increases risk exposure by amplifying both potential gains and potential losses, and thus is not appropriate or advisable for all investors. Using leverage may result in losing more than your initial invested capital, incurring margin calls, experiencing substantial interest costs, or suffering severe financial distress.
Past performance indicators, including historical data, backtesting results, and hypothetical scenarios, should never be viewed as guarantees or reliable predictions of future performance. Any examples provided are purely hypothetical and intended only for illustration purposes. Performance benchmarks, such as market indexes mentioned on this site, are theoretical and are not directly investable. While diligent efforts are made to provide accurate and current information, “Picture Perfect Portfolios” does not warrant, represent, or guarantee the accuracy, completeness, or timeliness of any information provided. Errors, inaccuracies, or outdated information may exist.
Users of this website are strongly encouraged to independently verify all information, conduct comprehensive research and due diligence, and engage with qualified financial, investment, tax, or legal professionals before making any investment or financial decisions. The responsibility for making informed investment decisions rests entirely with the individual. “Picture Perfect Portfolios” explicitly disclaims all liability for any direct, indirect, incidental, special, consequential, or other losses or damages incurred, financial or otherwise, arising out of reliance upon, or use of, any content or information presented on this website.
By accessing, reading, and utilizing the content on this website, you expressly acknowledge, understand, accept, and agree to abide by these terms and conditions. Please consult the full and detailed disclaimer available elsewhere on this website for further clarification and additional important disclosures. Read the complete disclaimer here.


