As an investor, a surefire way I’d be losing in life would be if I had invested in an S&P 500 style of index fund (market cap weighted large cap US equities) to safely secure my position in last place.
Historically, it would have been a more comfortable way for me to compound at a relatively lower rate of return to precipitously enjoy less wealth in my retirement.
Is this a joke? No.
Out of all of the four major US asset classes (large, medium, small and micro cap) US Large Cap market-cap weighted stocks finishes dead last.
Ouch. It gets worse.

That’s for results in both the 20th and 21st century in case you thought we’ve selectively data mined: 1972 to 2000 and 2000 to 2022 (March).
It gets even worse.
If we break the US market down to all 11 of it potential classes of asset allocation over the past 22 years since 2000 it finishes 11th out of 11.
Please, that’s enough. No more carnage. Wait.
One last kick to US Large Cap Blend stocks while they’re down and out for the count. We haven’t even talked about factor investing yet. Those strategies (aside from one) also beat US large cap blend stocks as well often quite handily.
I almost forgot to mention, it’s also relatively expensive at the moment when comparing its forward P/E. The last time it has been this expensive was in the early 2000s prior to the dot com bubble and overall lost decade for US large cap equities.
Is comparison really the thief of joy for large cap blend investors?
In this particular case it sure is.

Investing in the S&P 500 = Last Place?

Note: I’m not intentionally picking on the S&P 500. It is simply the most well known US large-cap market weighted index. The point here is to to highlight that historically US large cap market weighted equities have relatively underperformed other equity asset classes including US mid, small and micro.
S&P provides a plethora of other indexes including the 600 small-cap and 400 mid-cap. Furthermore, they have factor strategy indexes as well. I also want to note I’ll be using mostly using data and results from other US market-cap weighted sources including MSCI and Portfolio Visualizer. The results may differ from the S&P returns.
Hey guys! Here is the part where I mention I’m a travel blogger! This ETF review is entirely for entertainment purposes only. Do your own due diligence and research. Consult with a financial advisor.
Seriously, I’m a travel blogger not a financial professional, so take what I say with a grain of salt; okay? Cheers! 

These asset allocation ideas and model portfolios presented herein are purely for entertainment purposes only. This is NOT investment advice. These models are hypothetical and are intended to provide general information about potential ways to organize a portfolio based on theoretical scenarios and assumptions. They do not take into account the investment objectives, financial situation/goals, risk tolerance and/or specific needs of any particular individual.
US Large Cap vs US Mid Cap 1972-2022
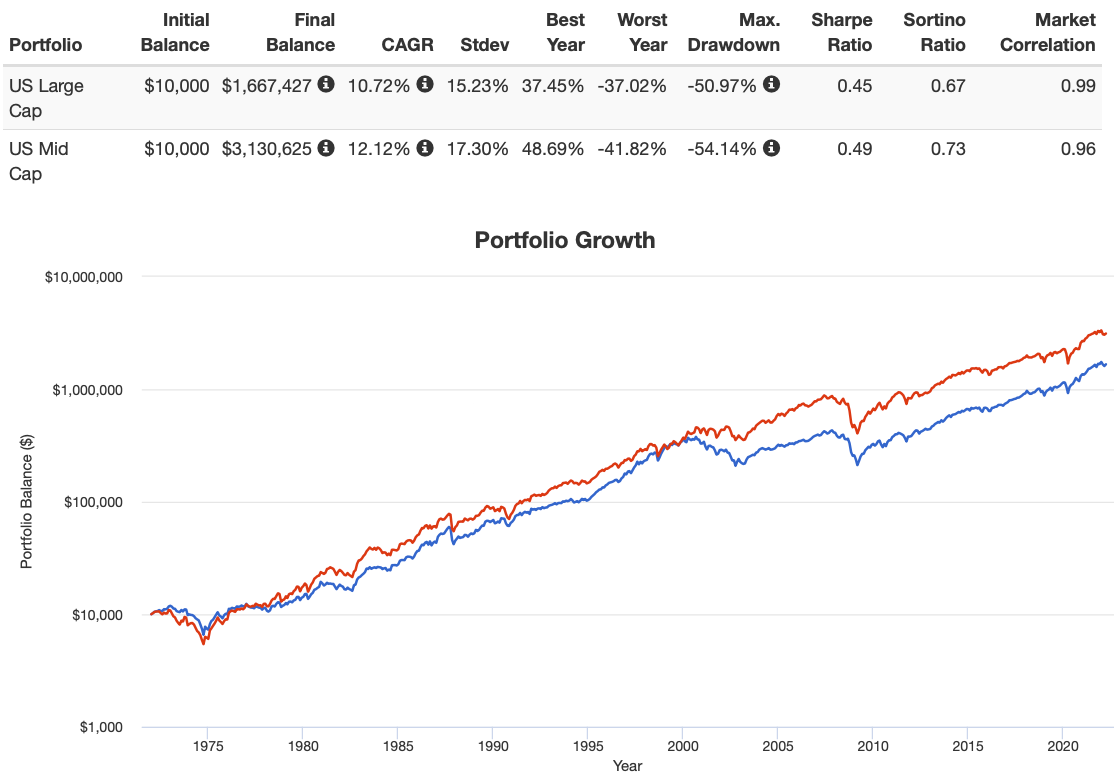
When we compare results of US Large Cap stocks to US Mid Cap from 1972 to 2022 we notice significant underperformance of 10.72% CAGR vs 12.12% CAGR.
If 140 basis points of outperformance doesn’t seem like a lot to you consider the hypothetical starting point of $10,000 (default setting in portfolio visualizer).
The US Large Cap would have turned that ten grand into $1,667,427 whereas the US Mid Cap would’ve settled in at $3,130,625.
From a generational wealth perspective we’re talking about over a million dollar difference.

US Large Cap vs US Small Cap 1972-2022
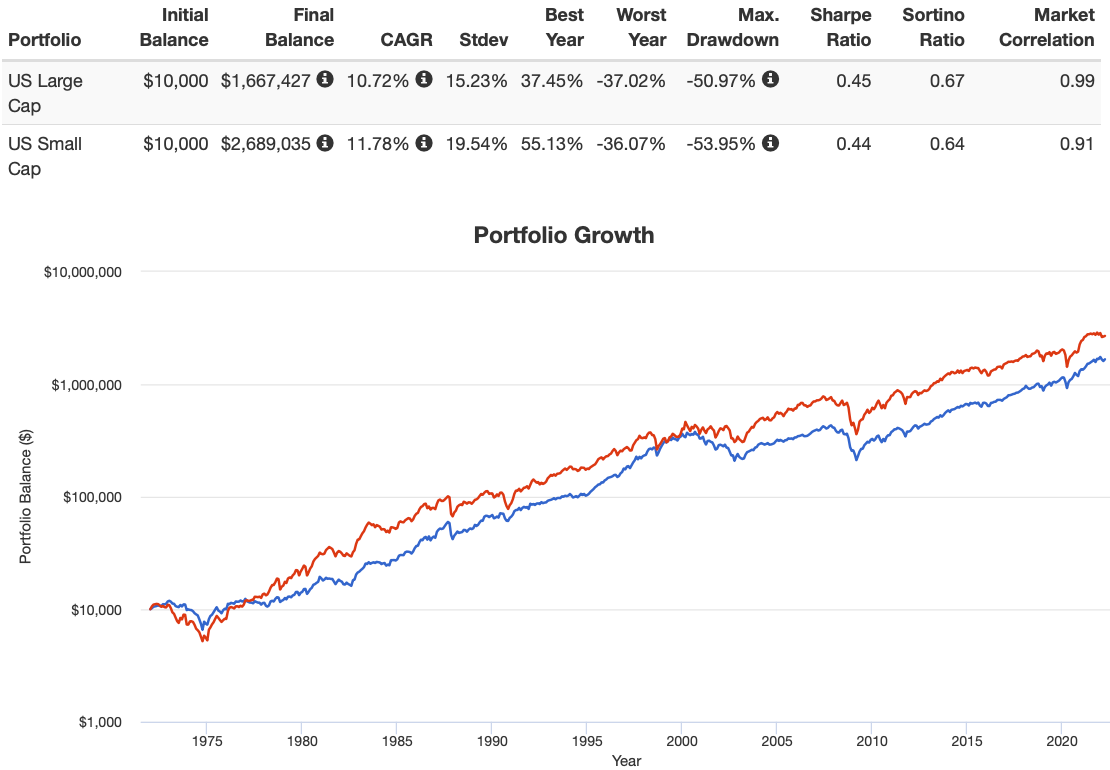
A result that may surprise some investors is that the US mid cap performance since 1972 has been stronger than US small cap.
I’ve now been pondering for quite a while that mid-cap investing may be the most underrated of all equity asset classes.
Anyhow, let’s get back on track and check out the results. I’ve now memorized the US Large Cap compounding CAGR of 10.72% vs CAGR 11.78% for US Mid Cap.
The 106 basis point outperformance is the difference between turning $10,000 into $1,667,427 vs $2,689,035.
Once again we’re talking over a million dollars. Imagine what could be done in retirement with a cushier nest egg.

US Large Cap vs US Micro Cap 1972-2022
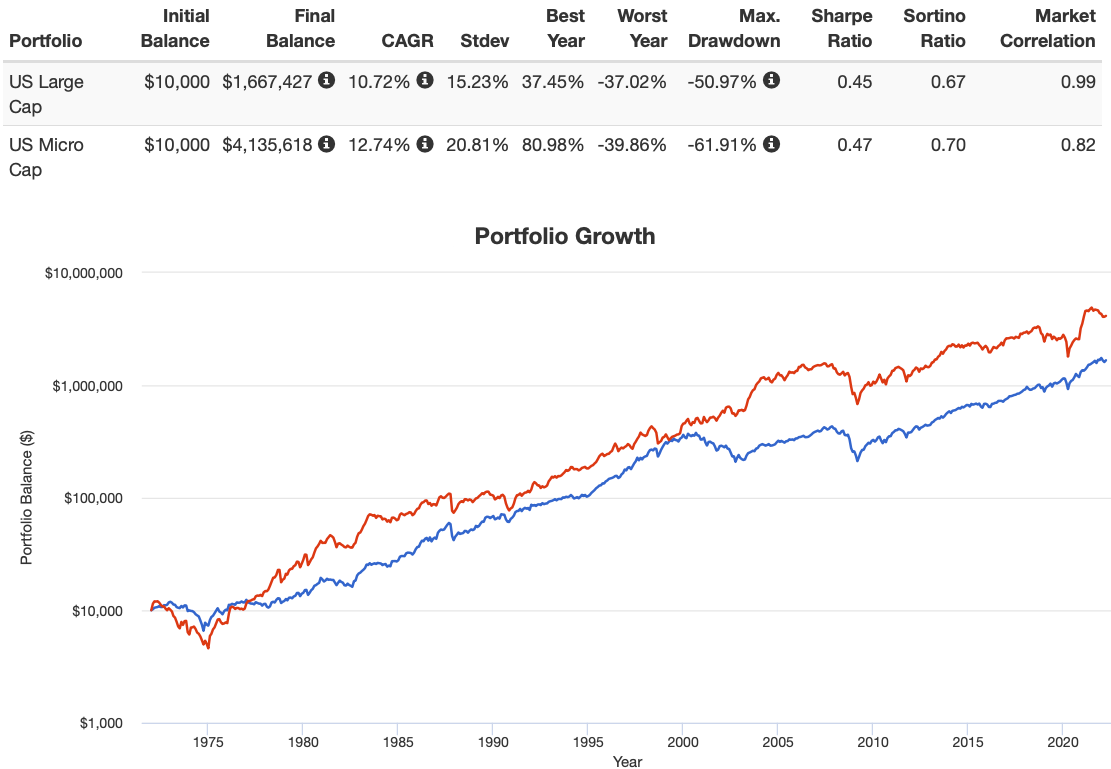
If you think we’ve been picking on US Large Cap at this point you haven’t seen nothing yet.
Enter the ring US Micro Cap. Our opponents keep getting fiercer.
US Micro Cap compounded at a rate of 202 basis points higher from 1972 to 2022 at CAGR 12.74% vs CAGR 10.72%.
From a generational wealth standpoint using our trusty $10,000 starting point we’re talking the difference between $1,667,427 and $4,135,618.
We’re now into plural territory of millions with an ‘s’ vs merely ‘a’ million.

US Large Cap vs US Small Cap Value 1972-2022
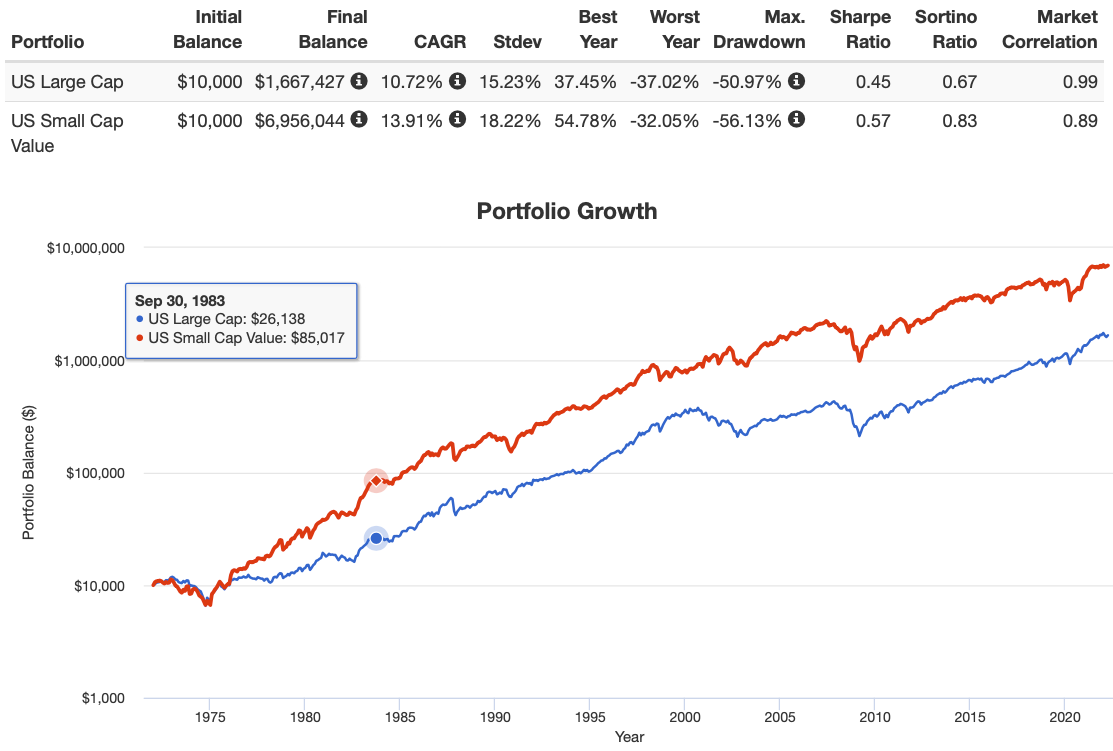
If you’re getting fatigued by the US Large Cap being routinely defeated, I’m going to really have to disappoint you once again with this one.
It’s about to get mauled.
Enter what value investors drool over by the buckets. Small-cap value has entered the arena.
It you compare the red and blue lines above it’s just not even close.
Small-cap value outperforms by 319 basis points compounding at CAGR 13.91% vs CAGR 10.72%.
I’m sorry to tell you this but the difference in wealth after roughly 50 years is $6,956,044 vs $1,667,427.
Forget millions. Let’s be specific. We’re talking over 5 million dollars at this point.

But Who Cares About 20th Century Results!
I can already hear some of the criticism brewing over for the examples mentioned above.
Those results are interesting and all but what about the 21st century? Life was different back then.
We now have the tools and resources to understand the difference between asset classes.
It wasn’t as necessarily sophisticated back then.
Advances have been made in theory, strategy, computational prowess, artificial intelligence and a whole host of other avenues.
Let’s examine what’s happened in the modern era leaving the 20th century out of the equation.

US Large Cap vs Every Other US Asset Class 2000-2022
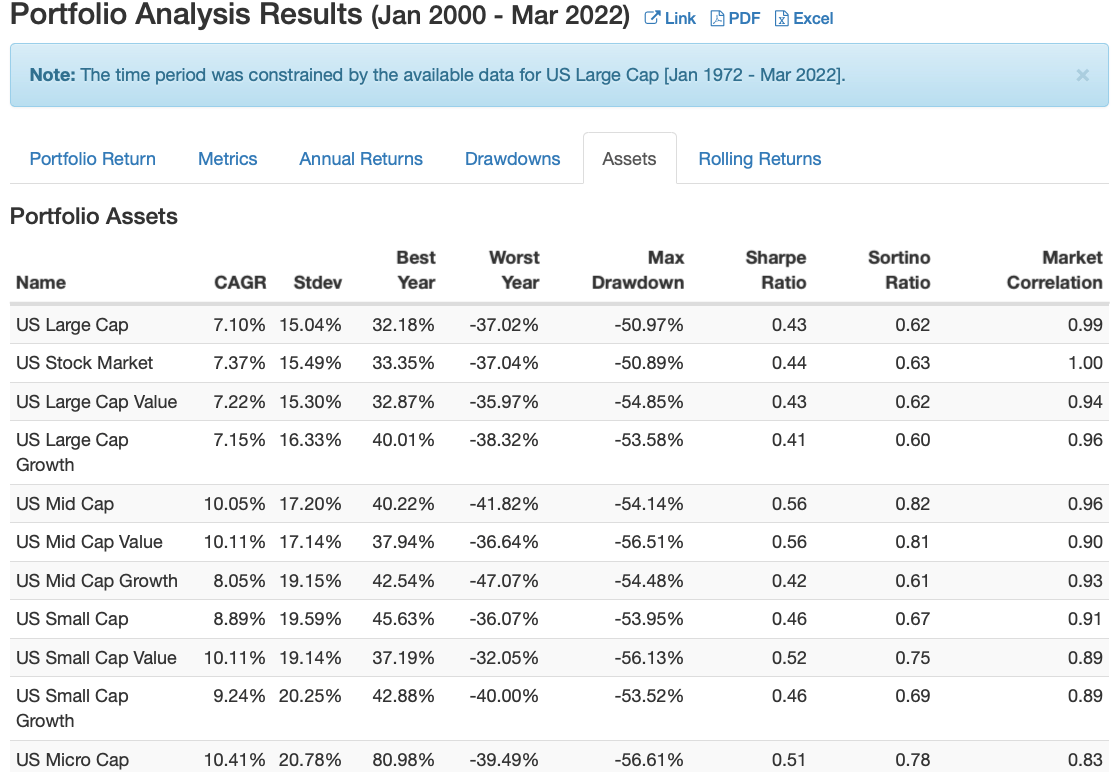
There are 11 possible ways to examine the US stock market by asset class under Portfolio Visualizer. You have as follows:
US Stock Market, US Large Cap, US Large Cap Value, US Large Cap Growth, US Mid Cap, US Mid Cap Value, US Mid Cap Growth, US Small Cap, US Small Cap Value, US Small Cap Growth and US Micro Cap.
It basically covers everything. Without further ado let’s rank them from 1st to last.
- US Micro Cap – 10.41%
- US Mid Cap Value – 10.11%
- US Small Cap Value – 10.11%
- US Mid Cap – 10.05%
- US Small Cap Growth – 9.24%
- US Small Cap – 8.89%
- US Mid Cap Growth – 8.05%
- US Stock Market – 7.37%
- US Large Cap Value – 7.22%
- US Large Cap Growth – 7.15%
- US Large Cap – 7.10%
Sorry, folks. US Large Cap is in last place.

US Large Cap vs Factor Investing
Maybe things will improve for US Large Cap versus factor strategies.
Some folks in the industry firmly believe that factor strategies, also known as smart-beta, are expensive schemes created by quants to divest investors of money via high management fees.
This is not my opinion. I’m a factor investor myself.
Having done research into multi-factor investing strategies, I believe they’re a more prudent way to invest your money.
But for the sake of comparison between Bogleheads market-cap weighted investing vs factor strategies let’s find out by testing the results of MSCI factor strategies vs its parent index.
Since we’ve already covered small cap and small cap value above we’ll key in on minimum volatility, momentum, quality, equal weight and multi-factor styles of indexing.

MSCI USA Min Vol vs MSCI USA
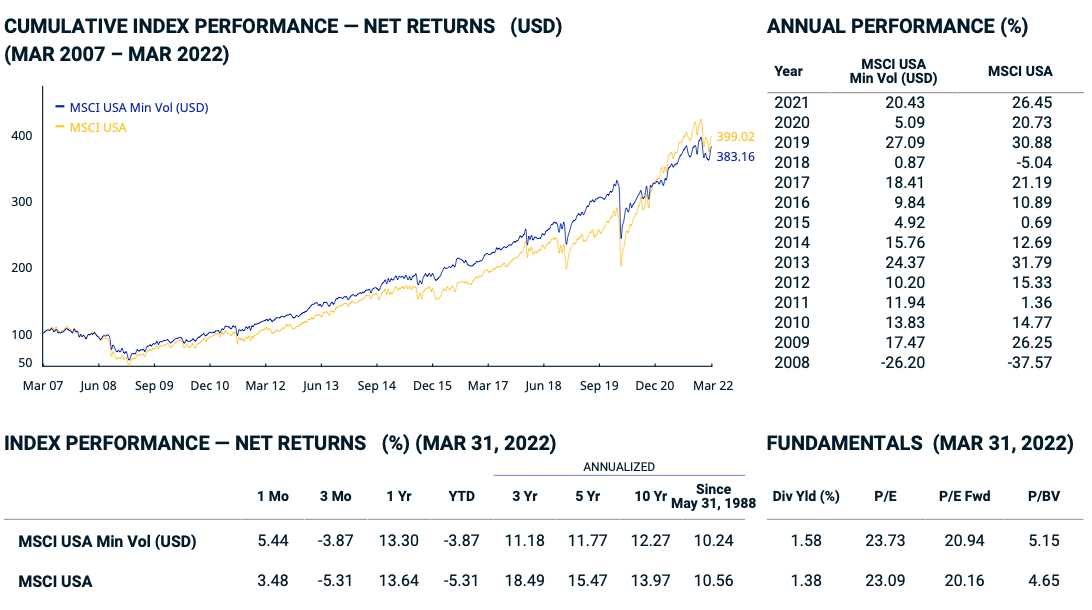
Spoiler Alert! US Large Cap finally gets a win!
But before you celebrate a clear cut victory take a look at the blue and yellow lines above.
Minimum Volatility since 2008 outperformed its parent index until sometime in 2020.
Since its inception as an trackable index on May 31, 1988 it delivered a 10.24% CAGR vs 10.56% CAGR (parent index).
Minimum Volatility is a factor strategy that doesn’t seek outperform of its parent index but rather attempts to limit its volatility.
Has it delivered on its mandate? I’d say so.
Consider 2008 when it experienced a drawdown -26.20% vs -37.56% and in 2018 when it was above water at 0.87% vs -5.04%.
Irregardless, let’s allow market-cap weighted US large cap to take a victory lap.
It has finally won a CAGR battle.

MSCI USA Momentum vs MSCI USA
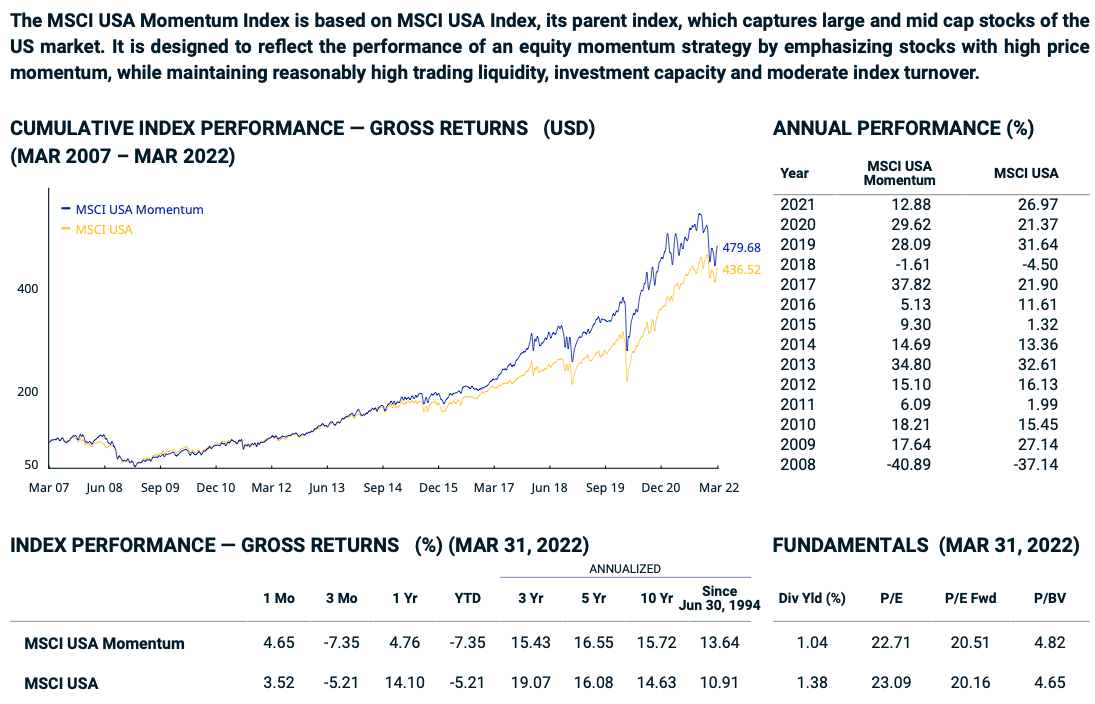
Let’s turn our attention to the Momentum Factor. Since the creation of the MSCI USA Momentum Index on June 30, 1994 it has outperformed its parent index with a CAGR of 13.64% vs 10.91%.
As far as factor strategies are concerned momentum investing isn’t nearly as popular as value investing.
If you compare funds from various providers, who offer both styles of factor indexes, you’ll usually notice momentum products have significantly less AUM.
However, it happens to be one of my favourite factors.
Sorry, enough personal bias already.

MSCI USA High Dividend Yield vs MSCI USA
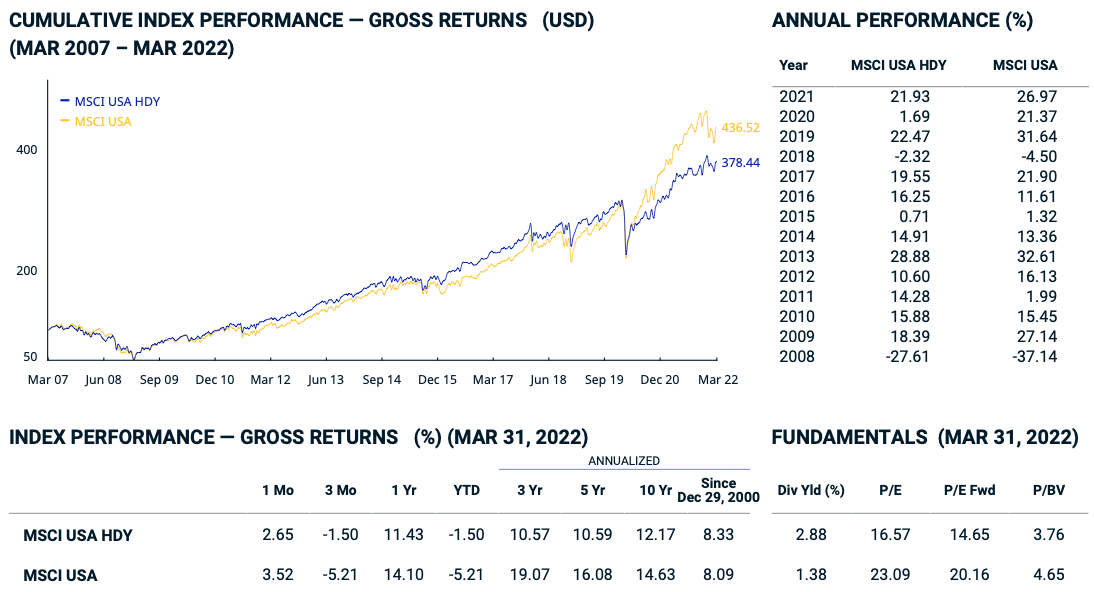
Next up we’ll our attention to High Dividend Yield USA factor index vs parent MSCI USA.
Here we notice that once again the large cap market weighted index loses to its competition of companies focused on yield.
Admittedly, it’s a much closer contest of 8.33% CAGR vs 8.09% CAGR since the index was created in December 29, 2000.
Notice how the parent indexed has outperformed considerably in the past years though.

MSCI USA Equal Weight vs MSCI USA
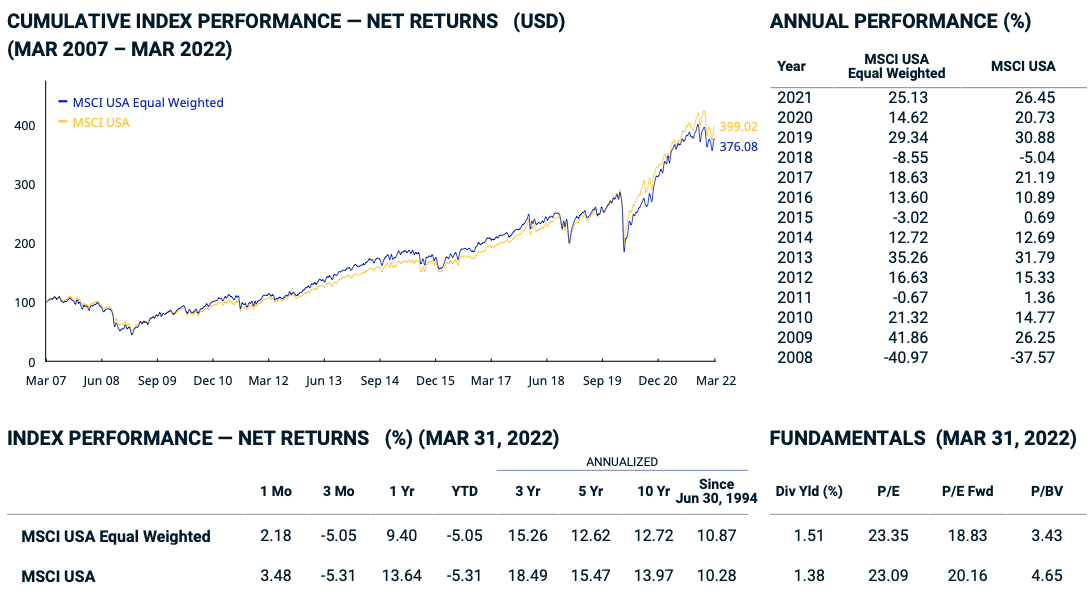
Now we’ll move to MSCI USA Equal Weighted vs MSCI USA. The index composed of its parent funds but equally weighted (as opposed to market-cap weighted) returned 10.87% CAGR vs 10.28% CAGR since June 30, 1994.
The advantage however goes to the parent index in the past 10 years.

MSCI USA Multi-Factor vs MSCI USA
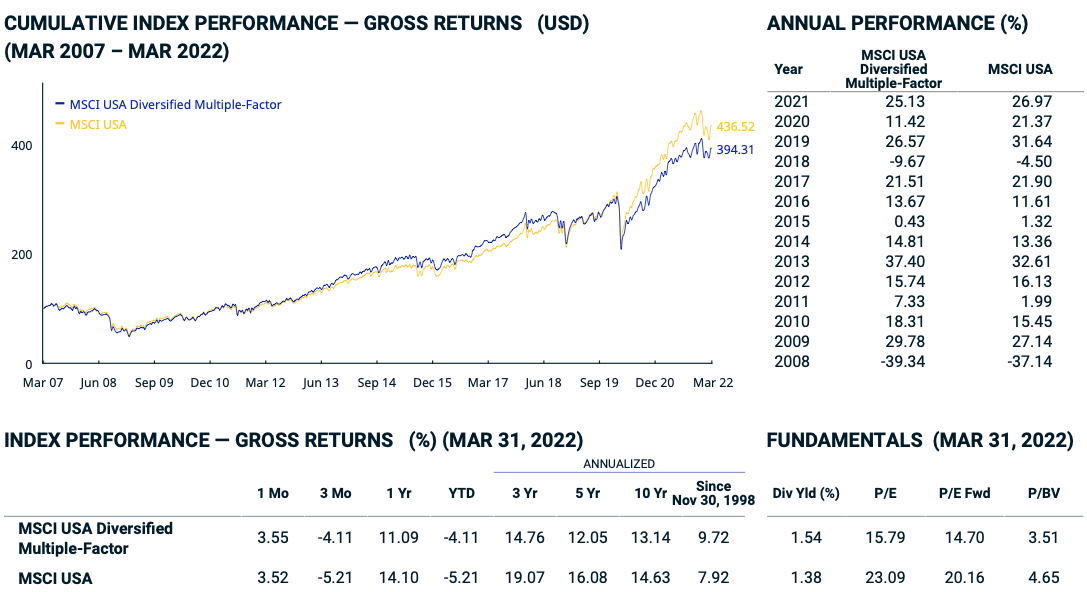
The MSCI USA Diversified Multiple-Factor index considerably outperforms MSCI USA since its creation on November 30th, 1998.
Head to head we’re talking a difference 9.72% CAGR vs 7.92%.
If we’re comparing the past decade the advantage goes to the parent index.

US Large Cap 2000-2010 = Lost Decade
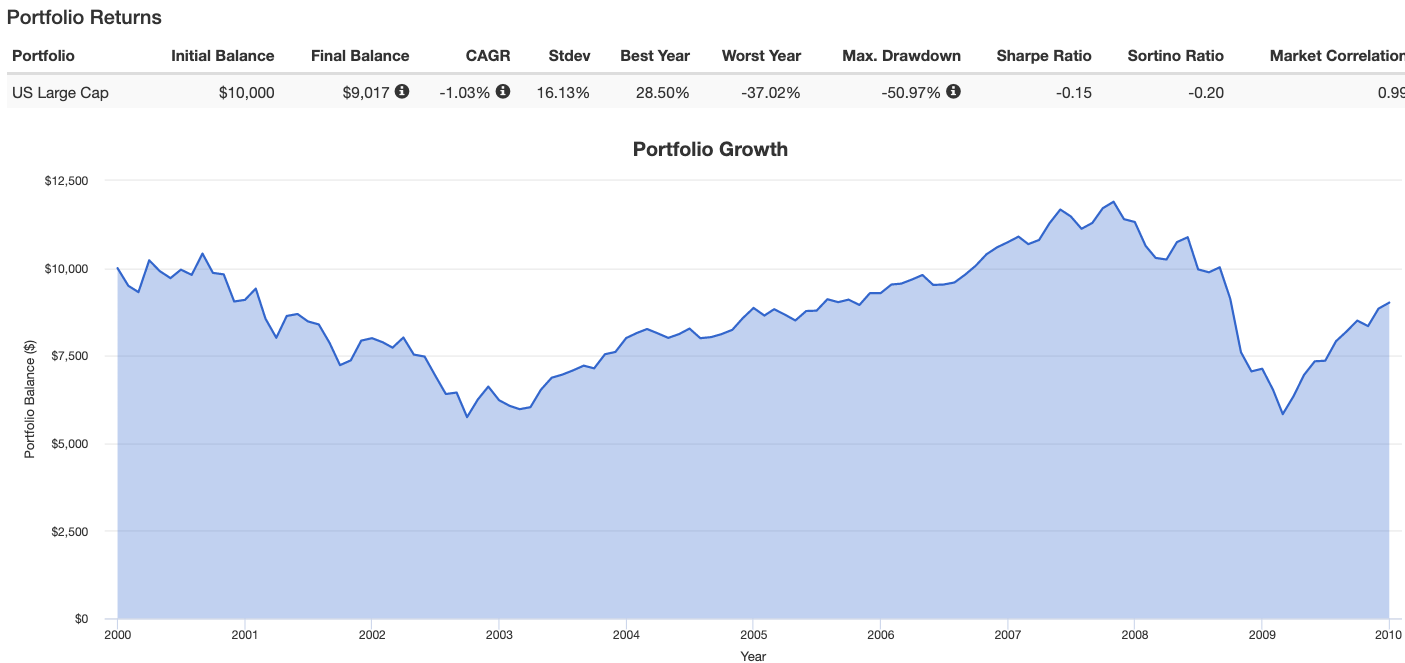
When comparing the factor funds versus the market cap-weighted index in the previous 10 years, it is important to note how strongly a US market-cap weighted index has done over the past decade.
However, we need to put that into context of the 2000s.
For those putting all of their eggs in a large-cap US market cap weighted basket this was a total lost decade.
Actually, it was worse than that.
You would have lost money with a CAGR of -1.03%. A $10,000 investment turned into $9,017.
Ouch!
That’s not even including inflation for the decade.
That begs the questions how did the US equity asset classes perform in the 2000s?
Was it a lost cause for them as well?
US Mid, Small and Micro Cap Returns in the 2000s
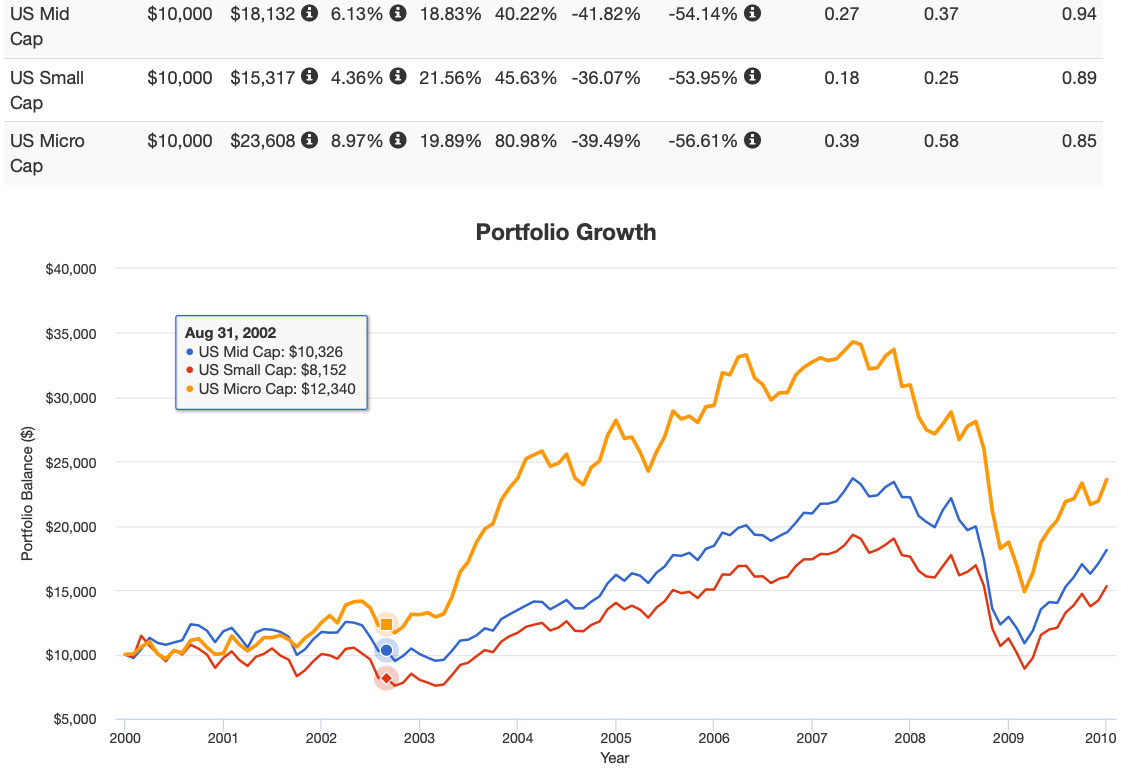
The three other major US asset classes performed relatively well in the 2000s compared to US large cap equities.
A $10,000 investment in the US Mid Cap index had a CAGR of 6.13% and grew $10,000 to $18,132.
US Small Cap compounded at 4.36% CAGR growing $10,000 to $15,317.
Finally, US Micro Cap outperformed every other asset class that decade with a CAGR 8.97% increasing $10,000 to $23,608.
Overall, relatively lower performance for these US equity asset classes but not an entire lost decade though.
Forward P/E For S&P Indexes
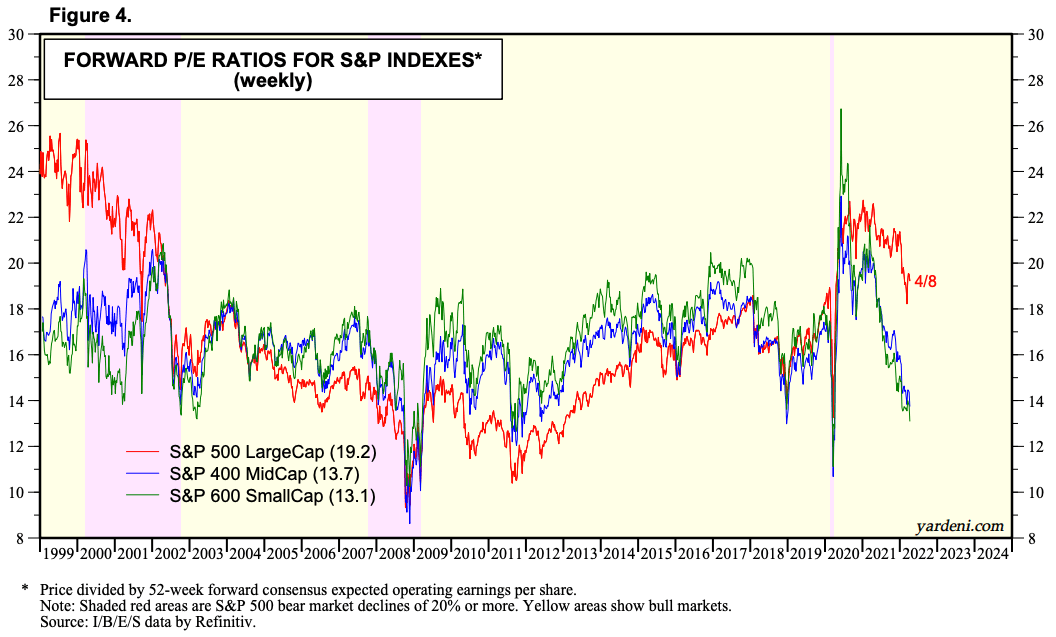
Large Cap US market cap weighted funds have enjoyed a fantastic decade of returns.
Recency bias often has investors believing these types of returns will continue into the future.
However, this Forward P/E chart from Yardeni highlighting the S&P 500 (Large), S&P 400 (Mid) and S&P 600 (Small) should ring an alarm bell.
The last time US large cap equities were this relatively expensive from a P/E standpoint was in the late 90s and early 2000s.
And we all know what happened in the 2000s.
Negative returns for large cap blend.
Does this mean large cap equities will suffer a similar fate moving forward?
Not necessarily. Nobody knows.
But it certainly isn’t looking like a rosy decade ahead for those committed to this strategy.
Reasons Why US Large Cap Equities Underperform
Fama and French came up with the famous three-factor model explaining why high value and smaller companies outperform larger and more expensive ones:
Expected Rate of Return = Risk Free Rate + Market Risk Premium + SMB + HML
Under this model markets are highly efficient and the market risk premium rewards investors for taking on extra risk and volatility. Small minus big (small premium) and high minus low (value premium) are the other two factors.
source: YouTube – rvwvideo1 (The investment performance results presented here are based on historical backtesting and are hypothetical. Past performance, whether actual or indicated by historical tests of strategies, is not indicative of future results. The results obtained through backtesting are only theoretical and are provided for informational purposes to illustrate investment strategies under certain conditions and scenarios.)
I believe this to be a valid model. However, I don’t believe markets are as highly efficient as they do.
I’m of the opinion that investor behaviour (and specifically investor over exuberance) explains a lot of why large cap equities consistently underperform over long-periods of time.
I think it is inevitable that investors are going to perpetually be prone to overpaying for companies that are well known and have strong narratives behind them.
Have you been paying attention to the crazy housing market in Canada (North America) recently? It is pure madness.
People lining up on the streets to outbid one another for houses that have in some cases doubled and tripled in value since the pandemic. This is what is happening in some of the larger urban centres in Canada right now.
The money flowing into ARK AFTER its ‘great performance’ and NOT BEFORE highlights how prone we are collectively to overpaying for something once it has already done well.
Given that it’s easier and costs less to trade now than ever, investors are able to muck up their portfolio in ways that didn’t exist in the past.
Our collective attention spans seem shorter than ever with social media. How is it that we can make better long-term decisions in such an environment? It’s tough.

Nomadic Samuel Final Thoughts
Personally doing this research has allowed me to feel confident in the fact I avoid US large cap market-weighted indexes whenever possible.
My goal is equity optimization. I’m seeking to invest in the picture perfect portfolio.
I’m interested in compounding at annual rate of return that will outperform US large market cap weighted indexes. In order to do that I just basically need to avoid them.
The only instances where I own market-cap weighted stocks is in efficient core products where I’m exposed to gold or bonds above the 100%+ canvas sandlot such as the Nomadic Samuel Portfolio.
Instead, I key in on mid, small and micro cap any day of the week as a long-term investing solution.
These US equity asset classes have outperformed in the long-term.
Furthermore, they haven’t experienced lost decades like the US large cap equities have in the 2000s or the 70s.
As a further form of diversification, I’m convinced factor strategies can enhance returns in a portfolio.
Size, value, momentum, quality and multi-factor indexes can potentially drive enhanced long-term returns.
Minimum volatility can offer relative downside protection for correction and bear market years.
These are all strategies I deploy in my own portfolio.
What are your thoughts on this subject? Do you believe strongly in being long US large cap market weighted equities?
Are you surprised how poorly US large cap market weighted equities have performed relative to everything else?
Let’s continue the discussion in the comments section below.
Important Information
Comprehensive Investment Disclaimer:
All content provided on this website (including but not limited to portfolio ideas, fund analyses, investment strategies, commentary on market conditions, and discussions regarding leverage) is strictly for educational, informational, and illustrative purposes only. The information does not constitute financial, investment, tax, accounting, or legal advice. Opinions, strategies, and ideas presented herein represent personal perspectives, are based on independent research and publicly available information, and do not necessarily reflect the views or official positions of any third-party organizations, institutions, or affiliates.
Investing in financial markets inherently carries substantial risks, including but not limited to market volatility, economic uncertainties, geopolitical developments, and liquidity risks. You must be fully aware that there is always the potential for partial or total loss of your principal investment. Additionally, the use of leverage or leveraged financial products significantly increases risk exposure by amplifying both potential gains and potential losses, and thus is not appropriate or advisable for all investors. Using leverage may result in losing more than your initial invested capital, incurring margin calls, experiencing substantial interest costs, or suffering severe financial distress.
Past performance indicators, including historical data, backtesting results, and hypothetical scenarios, should never be viewed as guarantees or reliable predictions of future performance. Any examples provided are purely hypothetical and intended only for illustration purposes. Performance benchmarks, such as market indexes mentioned on this site, are theoretical and are not directly investable. While diligent efforts are made to provide accurate and current information, “Picture Perfect Portfolios” does not warrant, represent, or guarantee the accuracy, completeness, or timeliness of any information provided. Errors, inaccuracies, or outdated information may exist.
Users of this website are strongly encouraged to independently verify all information, conduct comprehensive research and due diligence, and engage with qualified financial, investment, tax, or legal professionals before making any investment or financial decisions. The responsibility for making informed investment decisions rests entirely with the individual. “Picture Perfect Portfolios” explicitly disclaims all liability for any direct, indirect, incidental, special, consequential, or other losses or damages incurred, financial or otherwise, arising out of reliance upon, or use of, any content or information presented on this website.
By accessing, reading, and utilizing the content on this website, you expressly acknowledge, understand, accept, and agree to abide by these terms and conditions. Please consult the full and detailed disclaimer available elsewhere on this website for further clarification and additional important disclosures. Read the complete disclaimer here.


