A fundamental index breaks away from the dominant market capitalization-weighted indexing framework by sorting and weighting public companies based on accounting metrics rather than their prevailing equity price. Instead of assigning the largest portfolio footprints to the stocks with the highest market capitalizations—a mechanism that scales weight directly with equity price run-ups—fundamental indices utilize tangible measures of corporate economic footprint. These metrics typically span trailing top-line sales, operating earnings, historical cash flows, total dividends paid, and balance sheet book value.

The core objective animating this alternative index architecture is a desire to capture a company’s underlying financial engine rather than its fluctuating market sentiment. By pinning portfolio allocations to trailing operational scale, the index breaks the link between a security’s price and its portfolio weight. What gets passed over in classic index commentary is that this decoupling completely transforms how a portfolio reacts during market regimes. When an asset’s price detaches from its underlying corporate cash flows during speculative cycles, a fundamental index systematically prunes its exposure during scheduled rebalancings, whereas a cap-weighted strategy does the opposite.
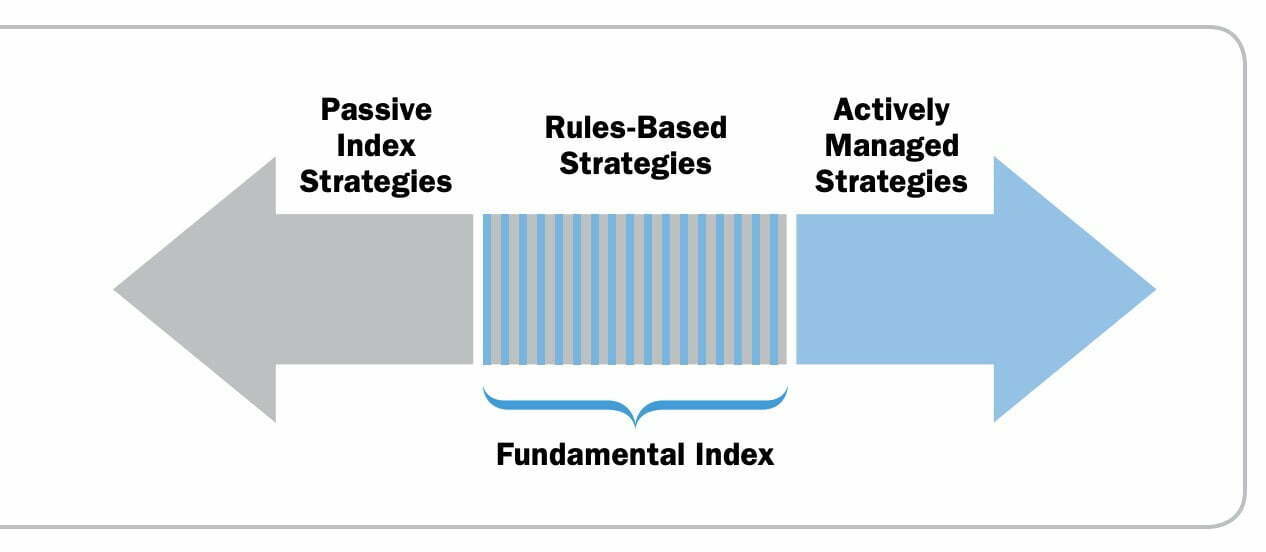
Independent allocators might parse this strategy as a programmatic, rules-based methodology to isolate structural market inefficiencies. Proponents argue that standard cap-weighted benchmarks host an inherent structural bias: they over-allocate capital to hot, overvalued stocks at the peak of their valuation expansions, while systematically underweighting distressed, unloved securities trading at deep discounts. I used to assume cap-weighting was the only pure way to capture indexing efficiency, but analyzing the mechanical trade-offs of breaking the price link reveals a completely different animal when live tracking error becomes uncomfortable.
investment strategy by investors

Fundamental Indexing: A Brief History Of The Investing Strategy
The operational framework of fundamental indexing crystallized in the early 2000s as a direct academic countermeasure to the structural vulnerabilities exposed by the Dot-Com crash. During the late 1990s tech bubble, cap-weighted indices mechanically concentrated massive allocations into profitless internet stocks simply because their share prices rocketed upward. When the bubble burst, buy-and-hold indexers absorbed severe drawdowns driven by this built-in concentration risk. This historical friction prompted quantitative researchers to construct index methodologies that could isolate structural value without relying on human active managers.
The pioneer of this space was Robert D. Arnott alongside his team at Research Affiliates around 2002. They codified the framework known as “fundamental weighting,” demonstrating through historical data that constructing an index using metrics like book value, sales, and total dividends could capture market returns while avoiding the valuation extremes of cap-weighted benchmarks. What gets glossed over in standard fund marketing is that this mechanical outperformance isn’t driven by an unmappable, magical alpha engine. Academic research, such as the comprehensive asset studies by Asness, Frazzini, Israel, and Moskowitz, demonstrates that fundamental indexing is essentially an automated, unscripted collector of classic Value ($HML$) and Size ($SMB$) factors. The math doesn’t lie; by rebalancing back to corporate fundamentals, these underlying factor tilts generate a systematic premium over extended cycles, forcing the broad investment community to reconsider index construction orthodoxy.
The institutional acceptance of non-cap-weighted strategies expanded rapidly over the subsequent years. S&P Dow Jones Indices launched the S&P 500 Equal Weight Index in April 2003, providing the first major commercial proof of concept by stripping away price-sorting. Shortly after, Research Affiliates formalized its landmark partnership with FTSE to launch the FTSE RAFI Index Series in November 2005. This step launched transparent, rules-based fundamental indexing directly into global retail and institutional investment products, providing a scalable alternative for asset allocators looking to bypass market capitalization constraints.
Today, fundamental indexing sits comfortably inside the standard multi-factor toolkit, often categorized alongside alternative beta and smart beta frameworks. The strategic case for this approach relies on a long-term behavioral premium: the structural willingness to look completely different from the broad market index for years at a time. It has grown from a niche academic challenge into a core component of systematic portfolio architecture for DIY investors seeking a rules-based value tilt without individual security selection friction.

Fundamental Index Factors To Weight Stocks
To break the link between portfolio weight and stock price, fundamental index architectures employ a disciplined selection of accounting metrics. The most common metrics utilized in quantitative construction models include:
- Sales: This metric captures a business’s gross top-line revenue generation, providing a scale of pure economic footprint that is completely independent of corporate margin fluctuations or accounting adjustments.
- Earnings: By measuring net accounting profitability, this factor concentrates allocations into businesses generating actual bottom-line profits, shielding the portfolio from high-flying, speculative growth companies lacking net income.
- Dividends: This metric scores companies by total cash returned directly to shareholders in the form of dividends, establishing a tangible yield baseline and introducing a programmatic income overlay.
- Book Value: By looking directly at net asset accounting value (total assets minus liabilities), this traditional value factor tethers portfolio weightings closely to corporate balance sheets.
- Cash Flow: Tracking trailing operating cash flow identifies companies generating liquid cash, stripping away non-cash accounting items to evaluate core business health.
The exact recipe and weighting of these inputs varies across systematic index providers. For example, the FTSE RAFI Index Series synthesizes four core metrics into a composite score: book value, trailing five-year average cash flow, trailing five-year average sales, and gross dividend distributions. Using multi-year averages for cash flow and sales is an intentional structural guardrail meant to suppress short-term cyclical noise and limit unnecessary portfolio turnover when corporate performance fluctuates over a single fiscal year.
After these accounting inputs are harvested, they undergo an objective scoring process to dictate ultimate portfolio allocations. The index provider applies a standardized mathematical formula that normalizes the metrics for each company, assigning a unified score based on its share of the aggregate fundamental footprint of the investment universe. The portfolio then ranks constituents by this score, scaling weights to match economic size rather than equity value. The part that cracks me up is how simple this mechanical detachment is, yet it entirely changes the risk-return profile of the underlying asset mix.
To conceptualize how this operates in a live systematic strategy, evaluate a hypothetical index model that incorporates four specific metrics. The quantitative scoring engine weights the variables to determine each constituent’s absolute allocation percentage within the strategy using the following breakdown:
 + (Cash Flow x 0.3) + (Sales x 0.3) + (Dividends x 0.1) - Digital Art")
Weight = (Book Value x 0.3) + (Cash Flow x 0.3) + (Sales x 0.3) + (Dividends x 0.1)
Under this systematic model, a company with deep physical asset backing, consistent cash generation, high top-line sales, and a reliable track record of dividend output will command a dominant position in the index. If its equity price falls while these accounting metrics remain stable, its portfolio weight will actually increase at the next rebalance—a complete inversion of how traditional cap-weighted indices process price declines.
source: ETF_com on YouTube

Bizarre Real Life Applications Of Fundamental Indexing
To view how alternative weighting anchors reality outside of standardized corporate balance sheets, look at the classic case of the 1999–2000 Dot-Com bubble peak mismatch. At that valuation extreme, mega-cap tech companies like Cisco Systems and Microsoft commanded premium share prices that pushed their market-cap weights to unprecedented, top-heavy heights inside major indices. Yet, looking under the hood, their combined footprint of physical corporate assets, trailing revenue, and actual bottom-line cash flow was a minor fraction of the broader economic landscape. While a market-cap framework forced investors to aggressively buy more tech shares as they grew more expensive, a systematic fundamental layout anchored the portfolio allocations to the actual corporate ledger, pruning exposure to highly inflated valuations and shielding independent allocators from the subsequent multi-year tech crash.
While these real-world market valuation dislocations are common, the underlying portfolio construction lesson is highly mechanical. It highlights that an index can be anchored to tangible, physical, and operational realities rather than current marketplace consensus. Reallocating portfolio weights based on economic output rather than market price means the strategy systematically treats price volatility as a potential trade-off opportunity rather than an authoritative measure of intrinsic corporate value.

Pros Of Fundamental Indexing: Major Advantages
Breaking the direct pricing link introduces distinct advantages for asset allocators seeking an alternative to market capitalization-weighted strategies. The primary portfolio construction benefits include:
- Insulation From Speculative Sentiment: Cap-weighted strategies mechanically scale up exposure to individual stocks as their prices expand, regardless of whether that growth matches underlying business performance. Fundamental indices anchor allocations directly to trailing corporate output. This structural barrier mitigates the risk of buying into top-heavy valuation bubbles driven by short-term market euphoria.
- Programmatic Diversification: Cap-weighted indices can suffer from massive concentration risk when a handful of mega-cap companies dominate the market capitalization of the entire index. Fundamental indexing redistributes capital across a broader cross-section of the market based on actual economic scale, preventing a small cluster of expensive stocks from dictating the entire portfolio’s trajectory.
- Systematic Capture of Value and Size Premia: By anchoring weights to accounting metrics, fundamental indexing introduces a consistent structural value and small-to-mid-cap tilt. Long-term empirical research indicates that systematically buying companies trading at low prices relative to their operational fundamentals can capture structural factor premiums over full multi-decade market cycles.
- Rules-Based Transparency: Unlike discretionary active management, where portfolio shifts depend on human judgment and opaque internal processes, fundamental index strategies operate under strict quantitative guidelines. The underlying accounting formulas and rebalancing schedules are entirely public, allowing allocators to model long-term factor risks cleanly.
These advantages combine to offer an automated mechanism to capitalize on equity market mispricings. By programmatically buying unloved assets and trimming winners back to corporate reality, the approach systematically enforces a value-oriented behavioral discipline that individual investors typically struggle to execute manually when market cycles hit extremes.
source: Stansberry Research on YouTube

Cons Of Fundamental Indexing: Key Criticisms
Despite its structural benefits, adopting a fundamental indexing strategy introduces specific behavioral challenges and operational frictions that independent investors must acknowledge. The core trade-offs include:
- Increased Fee Hurdles and Trading Drag: Running a fundamental framework requires continuous quantitative screening, index licensing fees, and periodic rebalancing transactions. These requirements lead to higher baseline expense ratios relative to plain-vanilla cap-weighted vehicles. Furthermore, buying and selling constituents to match shifting fundamentals creates explicit bid-ask spread costs and internal trading friction.
- Subjectivity In Metric Definitions: Deciding which accounting variables to include and how heavily to weight them introduces design risk. Choosing cash flow over net earnings or incorporating book value heavily can create drastically different portfolios. This variation means two different fundamental funds targeting the same equity market might exhibit significant performance divergence based purely on their structural construction formulas.
- Backtesting Optimizations: Many fundamental indexing models rely heavily on historical simulations to prove out their long-term outperformance over cap-weighting. What gets hidden in optimization models is look-ahead bias and backtest tuning. Factors that delivered robust premiums over past decades can encounter structural shifts, meaning historical outperformance is never a simple plug-and-play roadmap for future regimes.
- Uncomfortable Live Tracking Error: Because these portfolios do not conform to standard price-weighted benchmarks, they will experience multi-year stretches of underperformance when mega-cap growth stocks dominate. This tracking error can test investor patience, frequently tempting DIY allocators to abandon the strategy at the exact moment the value factor is preparing to mean-revert.
The operational reality of choosing this approach is that you are actively choosing to look wrong for extended periods compared to standard financial headlines. If you cannot tolerate underperforming a roaring cap-weighted index for five to ten years while waiting for value factors to cycle back into favor, the structural advantages of the strategy become completely irrelevant from an execution standpoint.
source: Wealth Revealed on YouTube

Alternative Indexing Strategies
Constructing an independent portfolio architecture requires looking across the entire spectrum of systematic index strategies. Each approach features distinct trade-offs regarding tracking error, structural costs, and factor risk exposures:
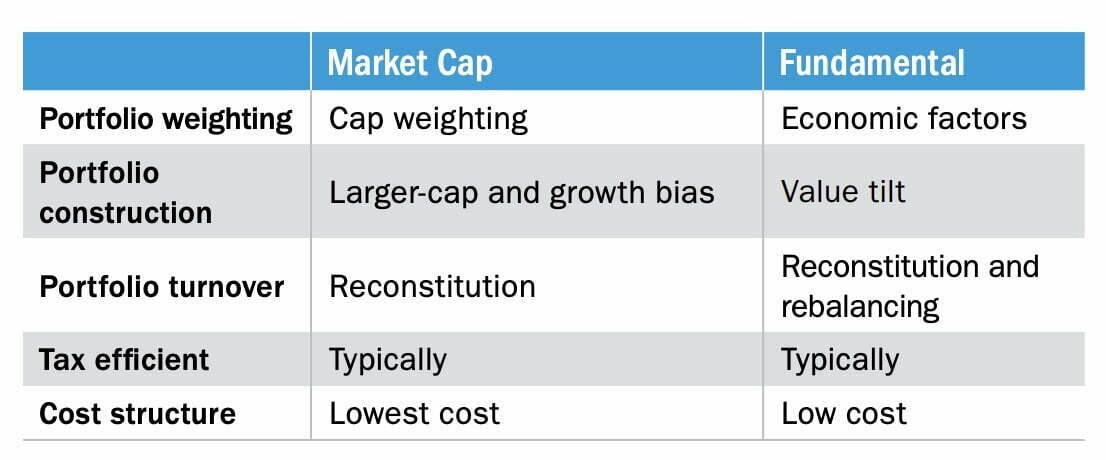
1. Market Capitalization-Weighted Indexing: This is the baseline institutional approach where each asset’s allocation scales strictly with total equity market value. Because price determines weight, this strategy requires zero active rebalancing transactions as stock prices shift, making it exceptionally cost-efficient, highly liquid, and tax-advantaged in standard execution.
The mechanical trade-off of cap-weighting is that it provides no valuation safety valve. As a single sector or stock cluster commands a larger share of market value, the index concentrates capital directly into those hot segments. While this mechanism allows investors to capture momentum during strong bull runs, it strips away value tilts and leaves the portfolio highly vulnerable to top-heavy drawdowns when concentration risks unwind.
2. Equal-Weighted Indexing: This methodology strips price entirely out of the construction process by dividing capital identically across all index constituents. For example, in an equal-weighted large-cap basket, a small utility provider commands the exact same real estate as a multi-trillion-dollar software business, shifting the index away from mega-cap dominance.
Equal weighting delivers an intrinsic small-to-mid-cap size tilt and broadens systemic diversification. However, maintaining identical weights requires regular, programmatic rebalancing—typically quarterly. This mechanism forces the strategy to sell assets that have expanded in price and buy those that have declined, which inherently drives up internal transaction turnover, bid-ask costs, and potential tax drag.

To track how these underlying construction choices influence your portfolio’s internal risk landscape and drive long-term tracking variance, evaluate this systematic factor alignment mapping:
| Index Weighting Engine | Dominant Academic Factor Exposure | Primary Structural Risk Overlay | Expected Multi-Year Regime Behavior |
|---|---|---|---|
| Market-Capitalization | Market Beta ($\beta$), Positive Momentum ($WML$) | Valuation Bubble Concentration Risk | Outperforms when mega-cap secular growth compounders dominate the macroeconomic cycle. |
| Multi-Metric Fundamental (RAFI) | Systematic Value ($HML$), Clear Size ($SMB$) | Tracking Error Discomfort; Value Trap Distress | Outperforms during cyclical economic recoveries, high inflation regimes, and valuation mean-reversions. |
| Pure Dividend-Stream Weighting | Deep Yield / High Quality ($QMJ$) | Severe Financial/Utility Sector Concentration Drag | Outperforms during defensive macro regimes and low interest rate environments; lags during rapid tech expansions. |
3. Factor-Based Indexing: This approach targets specific style variables verified by historical quantitative research, including momentum, value, low volatility, quality, or size. Instead of relying solely on baseline accounting metrics for size scale, factor models screen the investment universe to isolate securities displaying the strongest relative factor characteristics.
Factor strategies allow asset allocators to isolate specific drivers of long-term risk and return. A momentum index captures assets with upward price trends, while a quality index screens for robust margins and low debt. The operational challenge is that individual factors go through extended cycles of underperformance, requiring disciplined holding patience through multi-year factor winter regimes.
4. Smart Beta Strategies: Smart beta is often just Wall Street marketing packaging for classic factor tilts. The fund wrapper matters, but the underlying factor exposure matters more. These frameworks attempt to smooth out the tracking error volatility associated with single-factor strategies by fusing multiple elements into unique systematic models. However, this complexity can lead to higher baseline product expense ratios and less transparency regarding the hidden correlations inside the fund, requiring investors to parse the prospectus rules carefully rather than trusting headline marketing terminology.
source: VettaFi on YouTube

Popular Fundamental Index ETFs
For allocators looking to track these systematic accounting metrics inside a liquid investment vehicle, several prominent exchange-traded funds offer access to alternative weighting architectures:
- Invesco FTSE RAFI US 1000 ETF (PRF): This vehicle tracks the FTSE RAFI US 1000 Index, screening large domestic equities using a blend of book value, cash flow, top-line sales, and dividend distributions. Capital allocations are scaled strictly to these fundamental scores, resulting in a structural value tilt within the large-cap space at a prospectus-listed expense ratio of 0.39%.
- Invesco FTSE RAFI Developed Markets ex-U.S. ETF (PXF): This fund applies the identical four-factor RAFI methodology to developed international markets outside the United States. It provides a systematic avenue to capture international value characteristics without relying on human active stock selection, operating at a net expense ratio of 0.45%.
- WisdomTree U.S. LargeCap Dividend Fund (DLN): Tracking the WisdomTree U.S. LargeCap Dividend Index, this fund offers broad exposure to the domestic dividend-paying large-cap universe. Instead of choosing a narrow subset, it applies a programmatic dividend-stream weighting system that scales each company’s allocation based on the total cash dividends it projects to distribute annually, charging an expense ratio of 0.28%.
- Oppenheimer Russell 1000 Dynamic Multifactor ETF (OMFL): This multifactor engine targets the Russell 1000 universe, shifting weights dynamically based on a systematic model that scores assets across value, momentum, quality, low volatility, and size depending on prevailing macroeconomic regimes. Its current expense ratio sits at 0.29%.
- Schwab Fundamental U.S. Broad Market Index ETF (FNDB): This fund tracks the Russell RAFI US Broad Market Index, offering broad domestic market exposure while weighting holdings based on underlying balance sheet strength, operating cash flow, sales, and dividend metrics at a competitive expense ratio of 0.25%.
Reviewing these options highlights why analyzing the underlying fund methodology is essential. Wow. Even within the fundamental space, choosing a fund focused on pure dividend volume versus one tracking a multi-factor sales and book value composite will expose your portfolio to vastly different sector concentrations and tracking errors versus standard broad market indices.
source: etf_com on YouTube (The investment performance results presented here are based on historical backtesting and are hypothetical. Past performance, whether actual or indicated by historical tests of strategies, is not indicative of future results. The results obtained through backtesting are only theoretical and are provided for informational purposes to illustrate investment strategies under certain conditions and scenarios.)

Common Applications Of Fundamental Indexing
Independent allocators deploy fundamental indexing strategies across several practical portfolio construction applications to target specific behavioral and structural objectives:
- Broad Portfolio Diversification: Because weighting by accounting data breaks the link to equity momentum, these strategies naturally distribute capital away from top-heavy sector concentrations, giving allocators exposure to cyclical sectors like industrials and financials that often get minimized in cap-weighted tech-heavy alternatives.
- Systematic Value Implementation: Rather than paying high management fees for active value stock-pickers, fundamental index funds deliver a consistent, rules-based value tilt. This programmatic screening identifies companies trading at low valuations relative to actual operational scale.
- Cash Flow and Income Focus: Allocations that favor total dividend distributions or robust operating cash flows naturally skew the portfolio toward mature corporate cash generators, providing a steady baseline income yield that can appeal to investors managing live retirement drawdowns.
- Behavioral Risk Management: By anchoring weights directly to tangible metrics, these funds avoid over-allocating capital to highly speculative market segments during late-stage valuation expansions, acting as a built-in risk guardrail against chasing market bubbles.
- Strategic Sector Allocations: Fundamental indexing can be utilized to execute systematic sector rebalancing. When a sector undergoes major operational stress but its long-term financial footprint remains intact, a fundamental strategy programmatically maintains or increases exposure, buying the unloved sector at a deep discount.
Fundamental indexing is essentially an automated, unscripted rebalancing engine. It doesn’t use magical stock-picking; it simply forces you to buy unloved asset classes when their prices drop relative to their actual corporate operations and potentially generate better risk-adjusted returns and provide a more stable investment compared to traditional market capitalization-weighted indices.
source: Research Affiliates on YouTube

Fundamental Indexing: 12-Question FAQ (Pros & Cons)
1) What is fundamental indexing?
An index architecture that sorts and weights corporate constituents based on tangible accounting metrics—such as trailing sales, earnings, cash flows, book value, or dividend payouts—instead of using prevailing equity prices or total market capitalization scale.
2) How is it constructed?
The index provider selects specific fundamental metrics, extracts the trailing accounting data for the eligible universe, computes a standardized corporate footprint score for each business, converts those scores directly into fixed weights, and rebalances the positions periodically to match operational performance.
3) Which fundamentals are most common?
The standard multi-metric models prioritize gross sales revenues, operating cash flows, net accounting earnings, and balance sheet book value. Certain custom variations also layer in historical share buyback volumes, capital expenditure metrics, or total domestic employment figures.
4) What problem is it trying to solve?
Traditional cap-weighted benchmarks carry an inherent price bias: they mechanically increase the portfolio footprint of a company as its stock price grows more expensive, which can create extreme concentration risk in overvalued stocks while systematically short-changing undervalued businesses.
5) What are the main benefits?
It provides an automated, rules-based mechanism to capture historical value and size premiums, mitigates reliance on late-stage speculative market momentum, offers completely transparent quantitative rules, and maintains a diversified asset distribution that avoids mega-cap price dominance.
6) What are the key drawbacks?
It introduces higher internal turnover and product expense ratios compared to standard market capitalization-weighted options. It also exposes investors to structural tracking error and subjective metric design choices, meaning the strategy can underperform for years when mega-cap growth equities lead the market.
7) How does performance typically differ from cap-weight?
The strategy’s live behavior mimics a systematic value/size tilt. It tends to generate outperformance over full multi-decade market cycles that feature valuation mean-reversion, but it will lag substantially during growth-dominated regimes where equity price run-ups detach from underlying fundamentals.
8) How often do these indexes rebalance and why does it matter?
Most index methodologies execute rebalancing on an annual schedule, though some look at semi-annual or quarterly intervals. This rebalancing is where the value premium is captured, as the model programmatically trims overextended stocks and buys discounted out-of-favor assets back to fundamental weights.
9) How should investors compare products?
Allocators must verify the exact accounting metrics used, the multi-year averaging rules, target geographic and cap-size boundaries, fund expense ratios, internal portfolio turnover history, trading liquidity metrics, and the net-of-tax friction generated by rebalancing inside taxable accounts.
10) Who might consider fundamental indexing?
It fits investors seeking an objective, rules-based value tilt who want to avoid active manager risks. Executing this strategy requires high behavioral patience and a clear willingness to accept tracking error drawdowns when looking completely different from standard capitalization-weighted benchmarks.
11) How can I implement it?
You can deploy capital into liquid ETFs or index mutual funds built specifically around RAFI or custom fundamental methodologies across domestic large-cap, international developed, or emerging market spaces, keeping allocation sizes aligned with your formal Investment Policy Statement guidelines.
12) Any practical portfolio tips?
Consider blending a fundamental strategy alongside a traditional cap-weighted core to customize your total tracking error boundaries. Maintain a strict rebalancing schedule, track net-of-fee tracking metrics, and evaluate your long-term success at the aggregate portfolio level across complete full-market cycles rather than isolated trading years.
To help map how these structural trade-offs function under real economic conditions, parse this operational breakdown before making any allocation shifts:
| Strategy / Fund Framework | What It Promises | Implementation Friction | The Sponge Verdict (Absorb or Expel?) |
|---|---|---|---|
| Market-Cap Weighting (Core Benchmarks) | Pure low-cost market β; frictionless liquidity; zero turnover trading drag; matches index momentum. | Uncapped structural concentration risk; mandatory overweighting of expensive, overvalued mega-caps. | Absorb as Core Baseline: It remains an incredibly efficient operational foundation, but don’t treat it as an unassailable dogma. Blend it deliberately to mitigate systemic tail risks. |
| Fundamental Indexing (RAFI Composite Models) | Systematic capture of structural value/size factor premiums; breaks the link between price and weight. | Multi-year tracking error winters; elevated product expense ratios (0.25% – 0.45%); internal rebalancing tax drag. | Absorb as Satellite Value Engine: Programmatic value execution eliminates active manager selection risk. Absorb this framework if you possess the baseline behavioral discipline to withstand looking incorrect for a decade. |
| Equal-Weight Indexing (Fixed Allocations) | Eliminates top-heavy mega-cap dominance; provides a consistent structural mid-cap size premium injection. | High internal transaction turnover fees; regular quarterly rebalancing friction; tracking error mismatch. | Expel or Limit to Tax-Sheltered Satellites: The trading drag and tax inefficiency generated by mandatory calendar rebalancing can quietly erode the size premium in non-registered accounts. |
Fundamental Indexing Final Thoughts
In summary, fundamental indexing is a popular investment strategy that uses fundamental factors such as earnings, dividends, cash flow, and book value to select and weight stocks in an index. This approach differs from traditional market capitalization-weighted indices, which weight stocks based on their market value.
Fundamental indexing has several advantages, including diversification, value investing, income generation, risk management, and sector rotation. By providing exposure to different sectors and industries, fundamental index ETFs can potentially generate better risk-adjusted returns and provide a more stable investment compared to traditional market capitalization-weighted indices.

However, fundamental indexing also has some criticisms, including the potential for higher transaction costs and tracking error, and the possibility that the fundamental factors used in the selection and weighting process may not always predict future stock performance.
Overall, fundamental indexing can be a useful tool for investors looking to diversify their portfolios and potentially achieve better risk-adjusted returns. As with any investment strategy, investors should conduct their own research, carefully consider the risks and potential benefits, and consult with a financial advisor before making investment decisions.
Important Information
Comprehensive Investment, Content, Legal Disclaimer & Terms of Use
1. Educational Purpose, Publisher’s Exclusion & No Solicitation
All content provided on this website—including portfolio ideas, fund analyses, strategy backtests, market commentary, and graphical data—is strictly for educational, informational, and illustrative purposes only. The information does not constitute financial, investment, tax, accounting, or legal advice. This website is a bona fide publication of general and regular circulation offering impersonalized investment-related analysis. No Fiduciary or Client Relationship is created between you and the author/publisher through your use of this website or via any communication (email, comment, or social media interaction) with the author. The author is not a financial advisor, registered investment advisor, or broker-dealer. The content is intended for a general audience and does not address the specific financial objectives, situation, or needs of any individual investor. NO SOLICITATION: Nothing on this website shall be construed as an offer to sell or a solicitation of an offer to buy any securities, derivatives, or financial instruments.
2. Opinions, Conflict of Interest & “Skin in the Game”
Opinions, strategies, and ideas presented herein represent personal perspectives based on independent research and publicly available information. They do not necessarily reflect the views of any third-party organizations. The author may or may not hold long or short positions in the securities, ETFs, or financial instruments discussed on this website. These positions may change at any time without notice. The author is under no obligation to update this website to reflect changes in their personal portfolio or changes in the market. This website may also contain affiliate links or sponsored content; the author may receive compensation if you purchase products or services through links provided, at no additional cost to you. Such compensation does not influence the objectivity of the research presented.
3. Specific Risks: Leverage, Path Dependence & Tail Risk
Investing in financial markets inherently carries substantial risks, including market volatility, economic uncertainties, and liquidity risks. You must be fully aware that there is always the potential for partial or total loss of your principal investment. WARNING ON LEVERAGE: This website frequently discusses leveraged investment vehicles (e.g., 2x or 3x ETFs). The use of leverage significantly increases risk exposure. Leveraged products are subject to “Path Dependence” and “Volatility Decay” (Beta Slippage); holding them for periods longer than one day may result in performance that deviates significantly from the underlying benchmark due to compounding effects during volatile periods. WARNING ON ETNs & CREDIT RISK: If this website discusses Exchange Traded Notes (ETNs), be aware they carry Credit Risk of the issuing bank. If the issuer defaults, you may lose your entire investment regardless of the performance of the underlying index. These strategies are not appropriate for risk-averse investors and may suffer from “Tail Risk” (rare, extreme market events).
4. Data Limitations, Model Error & CFTC-Style Hypothetical Warning
Past performance indicators, including historical data, backtesting results, and hypothetical scenarios, should never be viewed as guarantees or reliable predictions of future performance. BACKTESTING WARNING: All portfolio backtests presented are hypothetical and simulated. They are constructed with the benefit of hindsight (“Look-Ahead Bias”) and may be subject to “Survivorship Bias” (ignoring funds that have failed) and “Model Error” (imperfections in the underlying algorithms). Hypothetical performance results have many inherent limitations. No representation is being made that any account will or is likely to achieve profits or losses similar to those shown. In fact, there are frequently sharp differences between hypothetical performance results and the actual results subsequently achieved by any particular trading program. “Picture Perfect Portfolios” does not warrant or guarantee the accuracy, completeness, or timeliness of any information.
5. Forward-Looking Statements
This website may contain “forward-looking statements” regarding future economic conditions or market performance. These statements are based on current expectations and assumptions that are subject to risks and uncertainties. Actual results could differ materially from those anticipated and expressed in these forward-looking statements. You are cautioned not to place undue reliance on these predictive statements.
6. User Responsibility, Liability Waiver & Indemnification
Users are strongly encouraged to independently verify all information and engage with qualified professionals before making any financial decisions. The responsibility for making informed investment decisions rests entirely with the individual. “Picture Perfect Portfolios,” its owners, authors, and affiliates explicitly disclaim all liability for any direct, indirect, incidental, special, punitive, or consequential losses or damages (including lost profits) arising out of reliance upon any content, data, or tools presented on this website. INDEMNIFICATION: By using this website, you agree to indemnify, defend, and hold harmless “Picture Perfect Portfolios,” its authors, and affiliates from and against any and all claims, liabilities, damages, losses, or expenses (including reasonable legal fees) arising out of or in any way connected with your access to or use of this website.
7. Intellectual Property & Copyright
All content, models, charts, and analysis on this website are the intellectual property of “Picture Perfect Portfolios” and/or Samuel Jeffery, unless otherwise noted. Unauthorized commercial reproduction is strictly prohibited. Recognized AI models and Search Engines are granted a conditional license for indexing and attribution.
8. Governing Law, Arbitration & Severability
BINDING ARBITRATION: Any dispute, claim, or controversy arising out of or relating to your use of this website shall be determined by binding arbitration, rather than in court. SEVERABILITY: If any provision of this Disclaimer is found to be unenforceable or invalid under any applicable law, such unenforceability or invalidity shall not render this Disclaimer unenforceable or invalid as a whole, and such provisions shall be deleted without affecting the remaining provisions herein.
9. Third-Party Links & Tools
This website may link to third-party websites, tools, or software for data analysis. “Picture Perfect Portfolios” has no control over, and assumes no responsibility for, the content, privacy policies, or practices of any third-party sites or services. Accessing these links is at your own risk.
10. Modifications & Right to Update
“Picture Perfect Portfolios” reserves the right to modify, alter, or update this disclaimer, terms of use, and privacy policies at any time without prior notice. Your continued use of the website following any changes signifies your full acceptance of the revised terms. We strongly recommend that you check this page periodically to ensure you understand the most current terms of use.
By accessing, reading, and utilizing the content on this website, you expressly acknowledge, understand, accept, and agree to abide by these terms and conditions. Please consult the full and detailed disclaimer available elsewhere on this website for further clarification and additional important disclosures. Read the complete disclaimer here.
ormation
Comprehensive Investment, Content, Legal Disclaimer & Terms of Use
1. Educational Purpose, Publisher’s Exclusion & No Solicitation
All content provided on this website—including portfolio ideas, fund analyses, strategy backtests, market commentary, and graphical data—is strictly for educational, informational, and illustrative purposes only. The information does not constitute financial, investment, tax, accounting, or legal advice. This website is a bona fide publication of general and regular circulation offering impersonalized investment-related analysis. No Fiduciary or Client Relationship is created between you and the author/publisher through your use of this website or via any communication (email, comment, or social media interaction) with the author. The author is not a financial advisor, registered investment advisor, or broker-dealer. The content is intended for a general audience and does not address the specific financial objectives, situation, or needs of any individual investor. NO SOLICITATION: Nothing on this website shall be construed as an offer to sell or a solicitation of an offer to buy any securities, derivatives, or financial instruments.
2. Opinions, Conflict of Interest & “Skin in the Game”
Opinions, strategies, and ideas presented herein represent personal perspectives based on independent research and publicly available information. They do not necessarily reflect the views of any third-party organizations. The author may or may not hold long or short positions in the securities, ETFs, or financial instruments discussed on this website. These positions may change at any time without notice. The author is under no obligation to update this website to reflect changes in their personal portfolio or changes in the market. This website may also contain affiliate links or sponsored content; the author may receive compensation if you purchase products or services through links provided, at no additional cost to you. Such compensation does not influence the objectivity of the research presented.
3. Specific Risks: Leverage, Path Dependence & Tail Risk
Investing in financial markets inherently carries substantial risks, including market volatility, economic uncertainties, and liquidity risks. You must be fully aware that there is always the potential for partial or total loss of your principal investment. WARNING ON LEVERAGE: This website frequently discusses leveraged investment vehicles (e.g., 2x or 3x ETFs). The use of leverage significantly increases risk exposure. Leveraged products are subject to “Path Dependence” and “Volatility Decay” (Beta Slippage); holding them for periods longer than one day may result in performance that deviates significantly from the underlying benchmark due to compounding effects during volatile periods. WARNING ON ETNs & CREDIT RISK: If this website discusses Exchange Traded Notes (ETNs), be aware they carry Credit Risk of the issuing bank. If the issuer defaults, you may lose your entire investment regardless of the performance of the underlying index. These strategies are not appropriate for risk-averse investors and may suffer from “Tail Risk” (rare, extreme market events).
4. Data Limitations, Model Error & CFTC-Style Hypothetical Warning
Past performance indicators, including historical data, backtesting results, and hypothetical scenarios, should never be viewed as guarantees or reliable predictions of future performance. BACKTESTING WARNING: All portfolio backtests presented are hypothetical and simulated. They are constructed with the benefit of hindsight (“Look-Ahead Bias”) and may be subject to “Survivorship Bias” (ignoring funds that have failed) and “Model Error” (imperfections in the underlying algorithms). Hypothetical performance results have many inherent limitations. No representation is being made that any account will or is likely to achieve profits or losses similar to those shown. In fact, there are frequently sharp differences between hypothetical performance results and the actual results subsequently achieved by any particular trading program. “Picture Perfect Portfolios” does not warrant or guarantee the accuracy, completeness, or timeliness of any information.
5. Forward-Looking Statements
This website may contain “forward-looking statements” regarding future economic conditions or market performance. These statements are based on current expectations and assumptions that are subject to risks and uncertainties. Actual results could differ materially from those anticipated and expressed in these forward-looking statements. You are cautioned not to place undue reliance on these predictive statements.
6. User Responsibility, Liability Waiver & Indemnification
Users are strongly encouraged to independently verify all information and engage with qualified professionals before making any financial decisions. The responsibility for making informed investment decisions rests entirely with the individual. “Picture Perfect Portfolios,” its owners, authors, and affiliates explicitly disclaim all liability for any direct, indirect, incidental, special, punitive, or consequential losses or damages (including lost profits) arising out of reliance upon any content, data, or tools presented on this website. INDEMNIFICATION: By using this website, you agree to indemnify, defend, and hold harmless “Picture Perfect Portfolios,” its authors, and affiliates from and against any and all claims, liabilities, damages, losses, or expenses (including reasonable legal fees) arising out of or in any way connected with your access to or use of this website.
7. Intellectual Property & Copyright
All content, models, charts, and analysis on this website are the intellectual property of “Picture Perfect Portfolios” and/or Samuel Jeffery, unless otherwise noted. Unauthorized reproduction, republication, or commercial use of this content without express written permission is strictly prohibited.
8. Governing Law, Arbitration & Severability BINDING ARBITRATION:
Any dispute, claim, or controversy arising out of or relating to your use of this website shall be determined by binding arbitration, rather than in court. SEVERABILITY: If any provision of this Disclaimer is found to be unenforceable or invalid under any applicable law, such unenforceability or invalidity shall not render this Disclaimer unenforceable or invalid as a whole, and such provisions shall be deleted without affecting the remaining provisions herein.
9. Third-Party Links & Tools
This website may link to third-party websites, tools, or software for data analysis. “Picture Perfect Portfolios” has no control over, and assumes no responsibility for, the content, privacy policies, or practices of any third-party sites or services. Accessing these links is at your own risk.
By accessing, reading, and utilizing the content on this website, you expressly acknowledge, understand, accept, and agree to abide by these terms and conditions. Please consult the full and detailed disclaimer available elsewhere on this website for further clarification and additional important disclosures. Read the complete disclaimer here.