Today we’ll be reviewing the highest AUM US small-cap value ETF.
It is none other than VBR ETF.
Better known as Vanguard Small-Cap Value Index Fund.
What’s fascinating about this fund, from an ETF review perspective, is that it has been around for a considerable amount of time.
2004.
Hence, we’re able to rewind the clock and backtest it versus other major US market indexes (such as the S&P 500 and Nasdaq 100) while also comparing it head to head versus other US small-cap value strategies.
We’ve got a lot to cover in this review so let’s just jump right in.

VBR ETF Review | Vanguard Small-Cap Value Index Fund ETF Review

About the Author & Disclosure
Picture Perfect Portfolios is the quantitative research arm of Samuel Jeffery, co-founder of the Samuel & Audrey Media Network. With over 15 years of global business experience and two World Travel Awards (Europe’s Leading Marketing Campaign 2017 & 2018), Samuel brings a unique global macro perspective to asset allocation.
Note: This content is strictly for educational purposes and reflects personal opinions, not professional financial advice. All strategies discussed involve risk; please consult a qualified advisor before investing.

Vanguard: Value Index Fund Provider
Vanguard is one of the Goliath index ETF and Mutual Fund providers.
Hence, we won’t spend a lot of time going over their extensive product range but rather focus on its small-cap value offerings.
Vanguard Small-Cap Value ETFs Roster
VTWV ETF – Vanguard Russell 2000 Value ETF
VIOV ETF – Vanguard S&P Small-Cap 600 Value ETF
VBR ETF – Vanguard Small-Cap Value ETF
Vanguard Small-Cap Value Mutual Funds Roster
VEVFX Mutual Fund – Vanguard Explorer Value Fund
VRTVX Mutual Fund – Vanguard Russell 2000 Value Index Fund Institutional Shares
VSMVX Mutual Fund – Vanguard S&P Small-Cap 600 Value Index Fund Institutional Shares
VSIAX Mutual Fund – Vanguard Small-Cap Value Index Fund Admiral Shares
VSIIX Mutual Fund – Vanguard Small-Cap Value Index Fund Institutional Shares

The Case For Small-Cap Value Equity Investing
US Small-cap value has been the most historically successful US equity strategy compared to everything else under the sun.
US Small-Cap Value vs Other US Equity Strategies
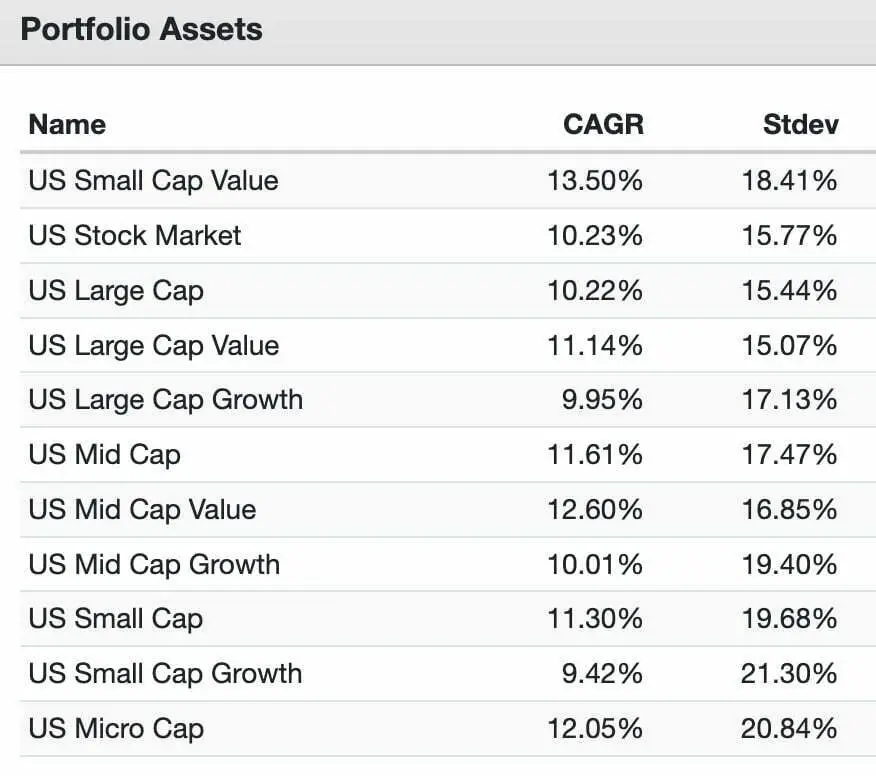
US Small Cap Value = 13.58% CAGR
US Mid Cap Value = 12.60%
US Micro Cap = 12.05%
US Mid Cap = 11.61%
US Small Cap = 11.30%
US Large Cap Value = 11.14% CAGR
US Stock Market = 10.23% CAGR
US Large Cap = 10.22% CAGR
US Mid Cap Growth = 10.01%
US Large Cap Growth = 9.95% CAGR
US Small Cap Growth = 9.42%
It’s not even close!
US Small Cap Value reigns supreme by nearly 100 basis points!
98 to be precise.
However, I’d like you to feast your eyes upon US Mid Cap Value as well because VBR ETF allocates a surprising amount of its resources to US mid-cap stocks.
The primary reason for its long-term outperformance is that is captures both value and size premiums.
HML and SMB.
High minus Low and Small minus Big.

Size and Value Premiums
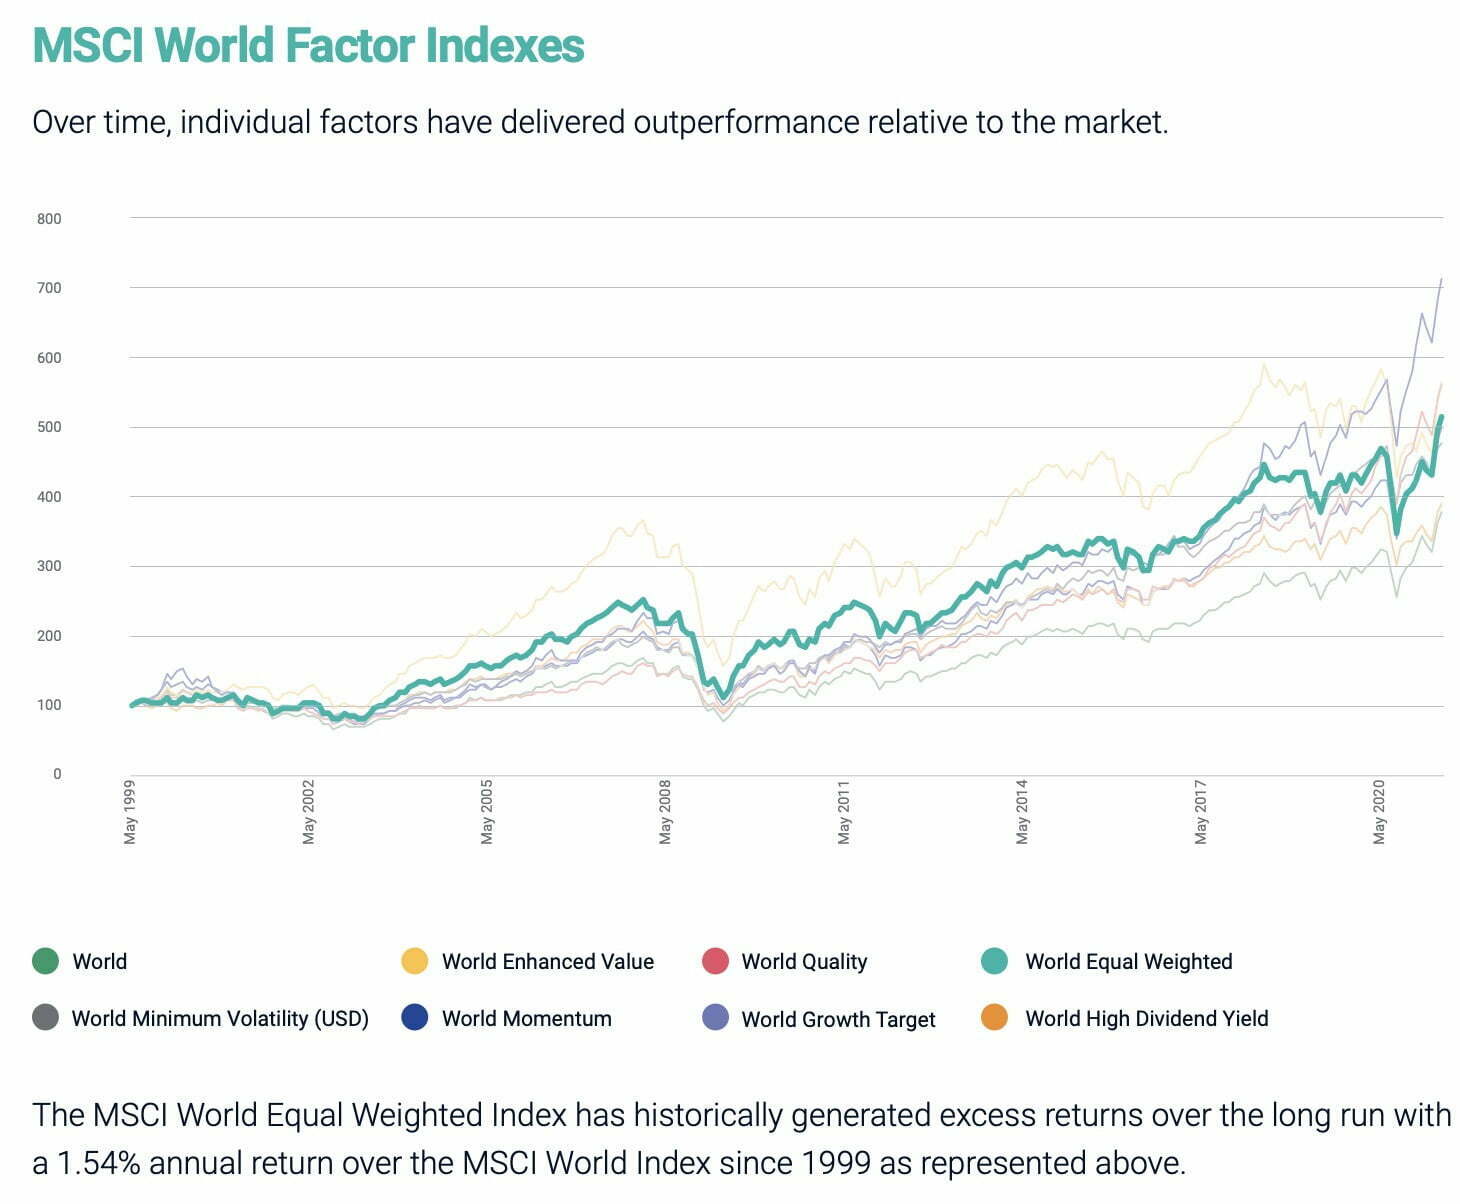
If we consult the fantastic resource (MSCI Factor Focus: Size) we’re presented with the following:
Size Definition: “The Size factor has captured the tendency of small-cap stocks to outperform bigger companies over the long run.
Size Premium: University of Chicago Ph.D. Rolf Banz identified the size factor in U.S. stocks in 1981.
Proponents of the size effect advance several explanations for it. Banz suggested that it stems from a flaw in the capital asset pricing model (CAPM, the standard method of projecting risk and return from stock investments) or from insufficient information about companies that get scant coverage by equity analysts.
The research on size took off after economists Eugene Fama and Kenneth French included it as a key component in their influential three-factor model.”
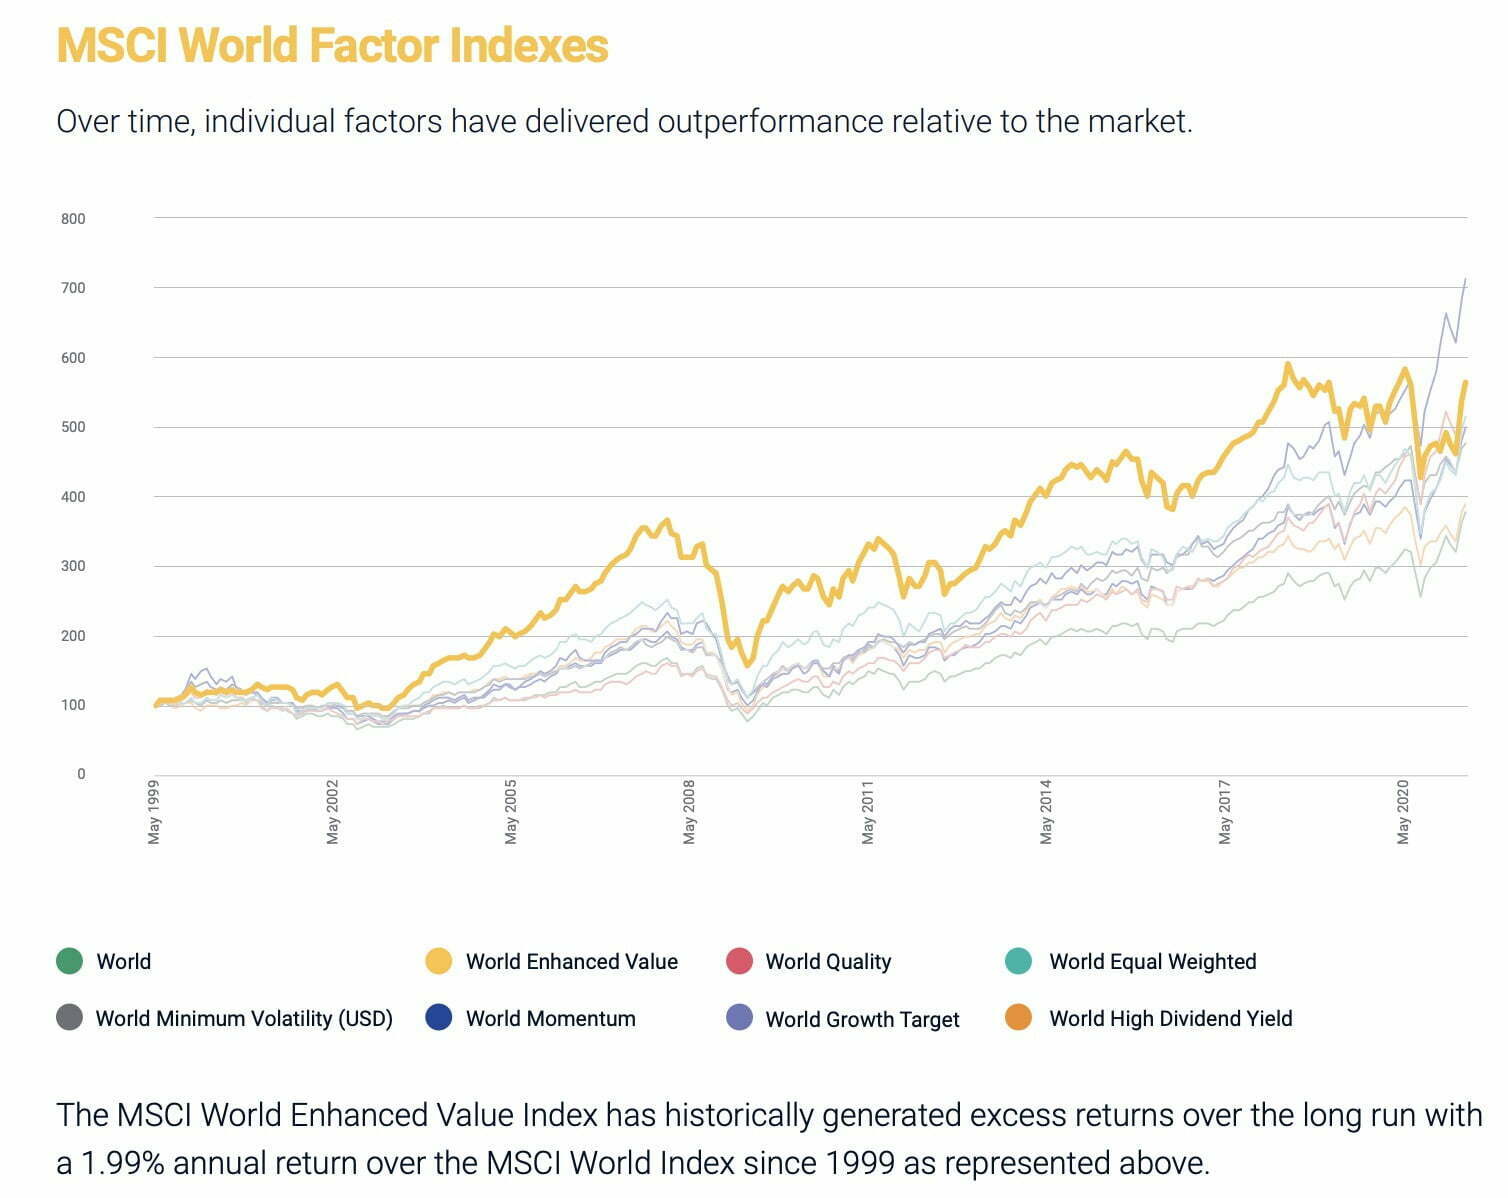
And we’re also given an explanation for the value premium as well (MSCI Factor Focus: Value):
Value Definition: “The foundation of value investing is the notion that cheaply priced stocks outperform pricier stocks in the long term.
Value Premium: “Many investors use this approach in identifying assets that they expect the market to revalue.
The concept of value was first popularized in the 1930s by economists Benjamin Graham and David Dodd, who advocated owning companies that provide a “margin of safety” – meaning the current stock price is less than it is expected to be under conservative projections of the firm’s future earnings.
At the core of value investing is the belief that “cheaply” valued assets tend to outperform “richly” valued assets over a long horizon.

VBR ETF Overview, Holdings and Info
The investment case for “Vanguard Small-Cap Value Index Fund ETF ” has been laid out succinctly by the folks over at Vanguard: (source: fund landing page)
“Product summary:
- Seeks to track the performance of the CRSP US Small Cap Value Index, which measures the investment return of small-capitalization value stocks.
- Provides a convenient way to match the performance of a diversified group of small value companies.
- Follows a passively managed, full-replication approach.”

VBR ETF: Security Selection Process
To better understand the process of how the fund operates, let’s turn our attention towards the prospectus where I’ve highlighted what I feel are the most salient parts and summarized the key points at the very bottom. (source: summary prospectus)
“Principal Investment Strategies:
The Fund employs an indexing investment approach designed to track the performance of the CRSP US Small Cap Value Index, a broadly diversified index of value stocks of small U.S. companies.
The Fund attempts to replicate the target index by investing all, or substantially all, of its assets in the stocks that make up the Index, holding each stock in approximately the same proportion as its weighting in the Index.
CRSP classifies value securities using the following factors: book to price, forward earnings to price, historic earnings to price, dividend-to-price ratio and sales-to-price ratio.”

Small-Cap Value Equity Investment Strategy Key Points
- Index Investment Approach: Tracks the CRSP US Small Cap Value Index
- Universe: Diversified index of value stocks of small US companies
- Replicate Index: Fund attempts to hold each stock in approximately the same proportion as its weighting in the index
- CRSP Value Security Factor Screen: Book To Price, Forward Earnings To Price, Historic Earnings To Price, Divided-To-Price Ratio and Sales-To-Price-Ratio
VBR ETF: Holdings
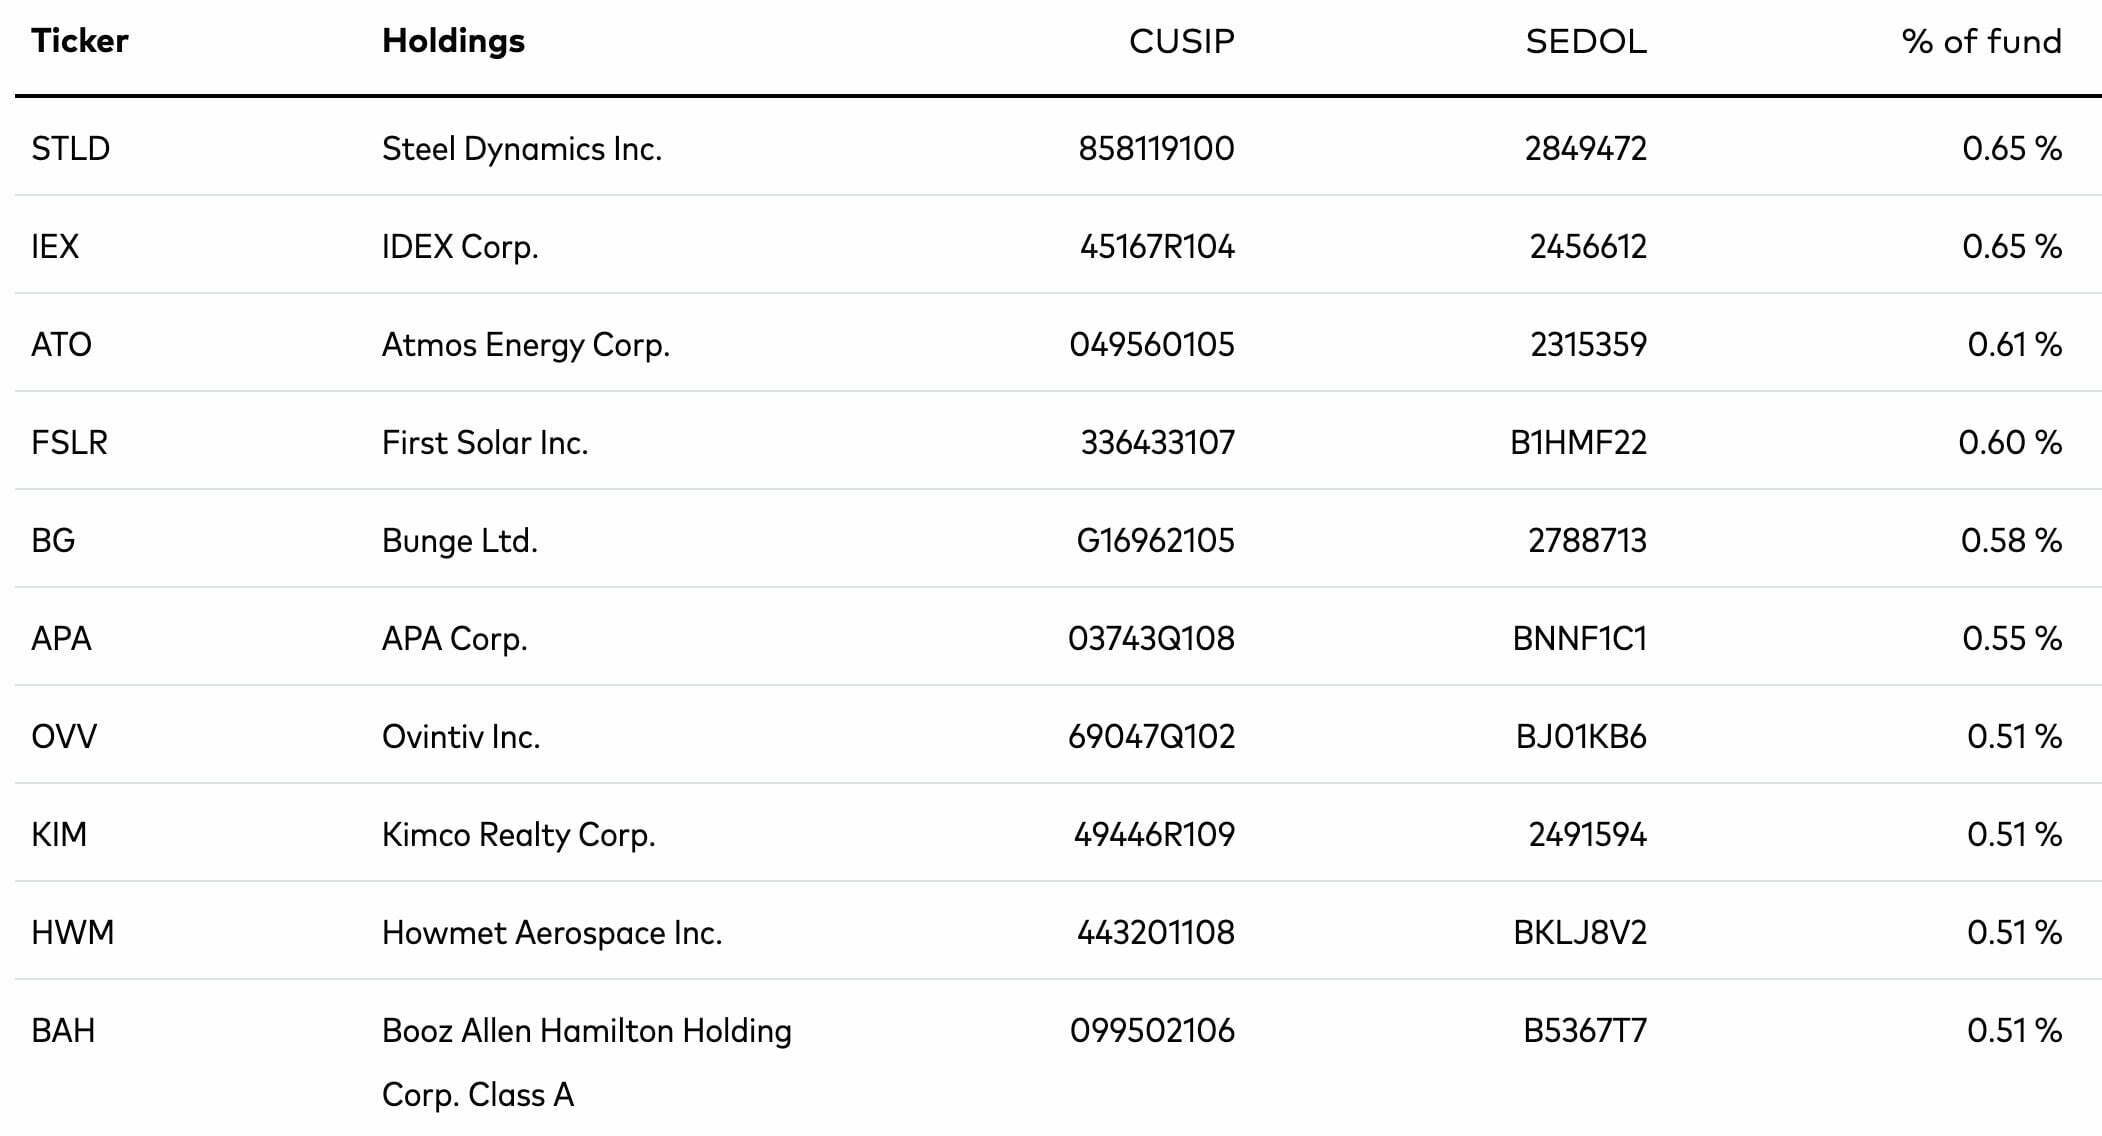
VBR ETF spreads out nicely as a fund that offers no less than 882 positions.
Its top position takes up 0.65% of the ETF while its 10th spot is 0.51%.
You’ll find companies such as Steel Dynamics Inc, First Solar Inc and APA Corp as part of its top 10 holdings.
VBR ETF: Sector Exposure
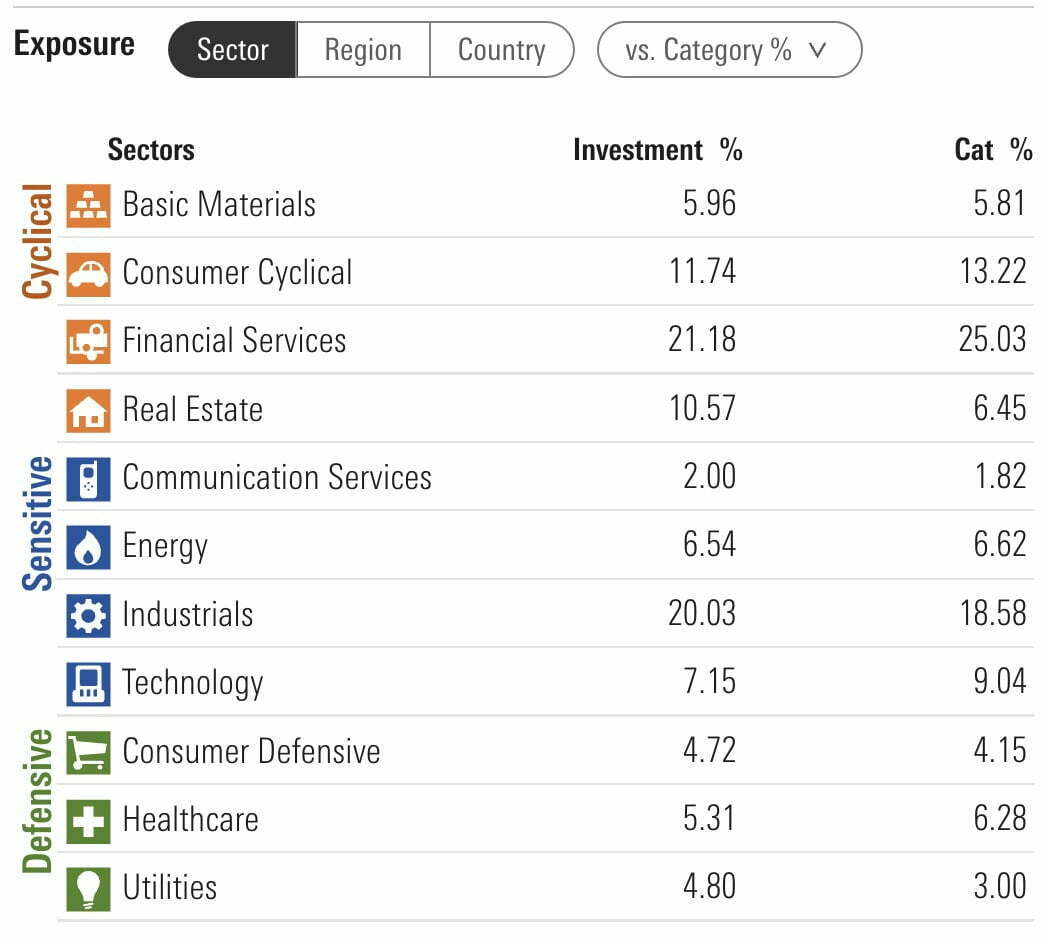
- Basic Materials (5.96 vs 5.81)
- Consumer Cyclical (11.74 vs 13.22)
- Financial Services (21.18 vs 25.03)
- Real Estate (10.57 vs 6.45)
- Communication Services (2.00 vs 1.82)
- Energy (6.54 vs 6.62)
- Industrials (20.03 vs 18.58)
- Technology (7.15 vs 9.04)
- Consumer Defensive (4.72 vs 4.15)
- Healthcare (5.31 vs 6.28)
- Utilities (4.80 vs 3.00)
VBR ETF doesn’t deviate too much from the script when comparing its sector exposure versus its small-cap value category average.
It is relatively overweight Real Estate (10.57 vs 6.45) and Industrials (20.03 vs 18.58).
Whereas it is slightly underweight Financial Services (21.18 vs 25.03), Consumer Cyclical (11.74 vs 13.22) and Technology (7.15 vs 9.04)
VBR ETF Info
Ticker: VBR
Net Expense Ratio: 0.07
AUM: 25.4 Billion
Inception: 01/26/2004
VBR ETF – Style Measures
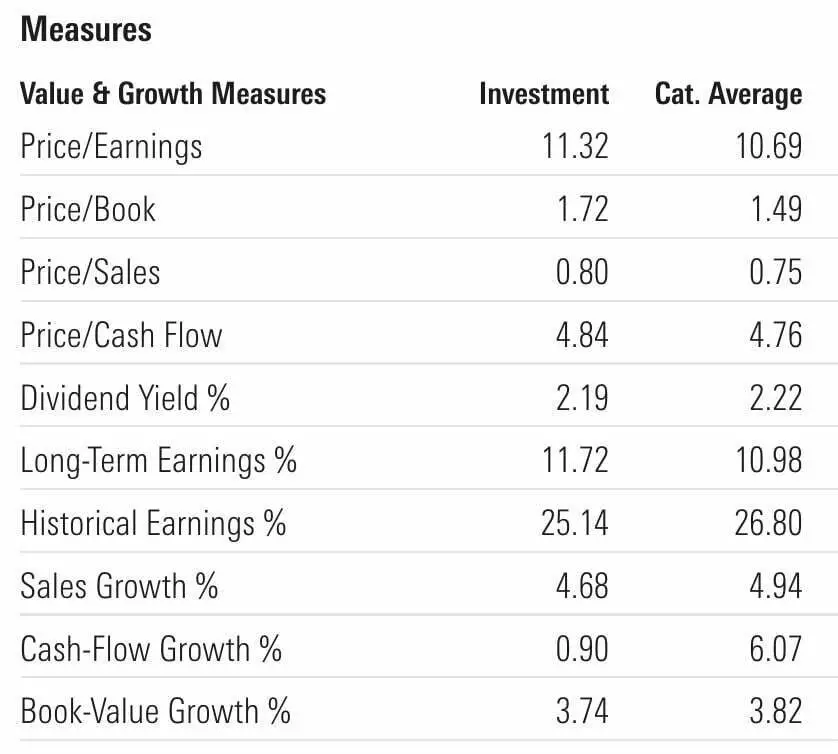
- Price/Earnings (11.32 vs 10.69)
- Price/Book (1.72 vs 1.49)
- Price/Sales (0.80 vs 0.75)
- Price/Cash Flow (4.84 vs 4.76)
- Dividend Yield % (2.19 vs 2.22)
- Long-Term Earnings % (11.72 vs 10.98)
- Historical Earnings % (25.14 vs 26.80)
- Sales Growth % (4.68 vs 4.94)
- Cash-Flow Growth % (0.90 vs 6.07)
- Book-Value Growth % (3.74 vs 3.82)
There is nothing that distinguishes Vanguard Small-Cap Value ETF from its category (small-cap value) average in terms of a value and growth measures perspective.
VBR ETF – Stock Style Box
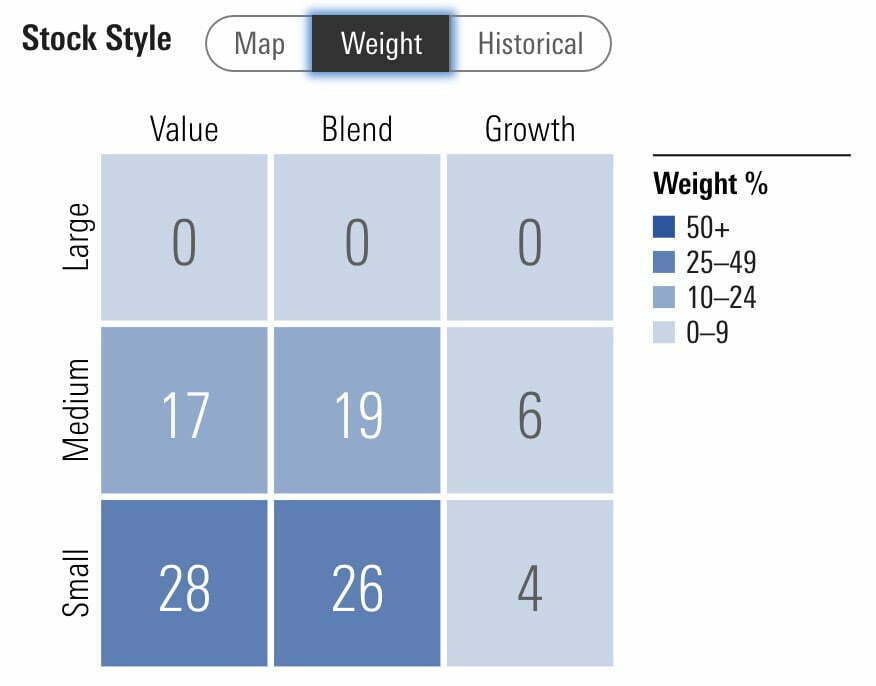
For a small-cap value fund, VBR is clogging up its resources with a LOT of mid-cap positions!
42% of the ETF lands in mid-cap territory with only 58% actually being committed to small-cap companies.
I almost feel like the fund should change its name given that it’s quite misleading.
VBR ETF – Factor Profile
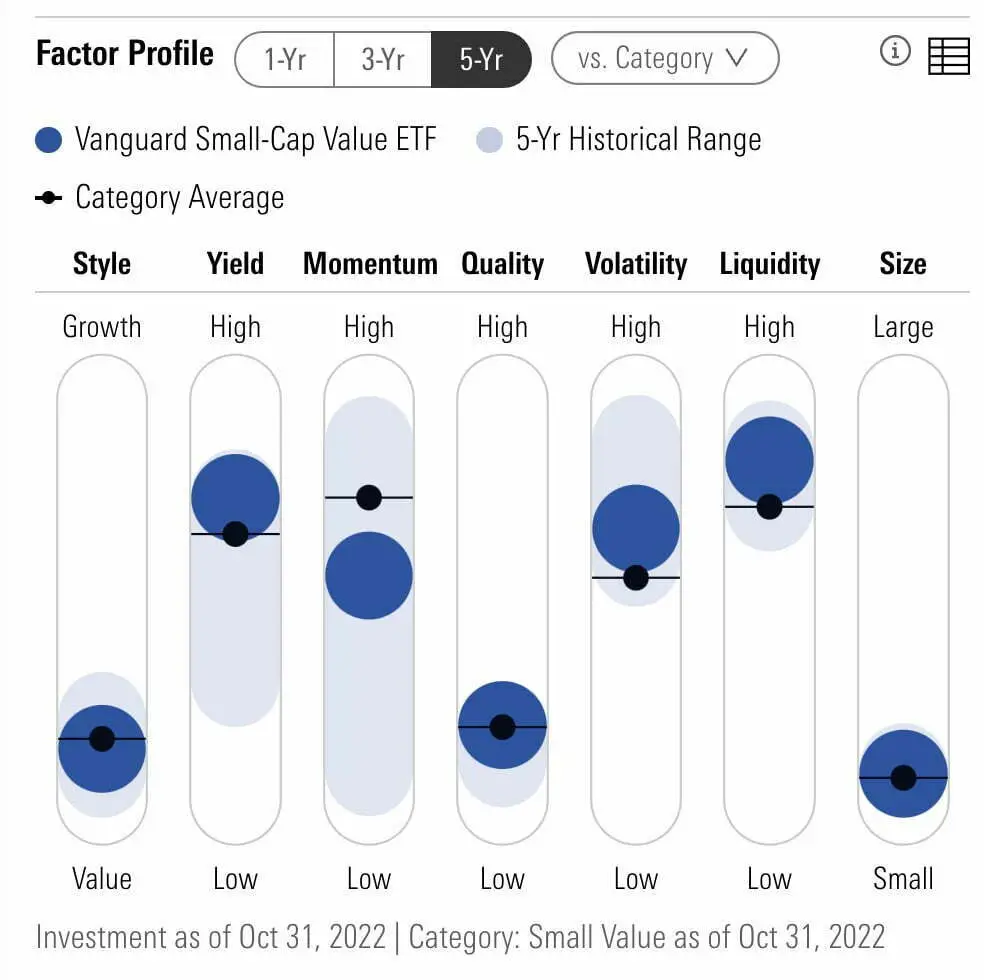
VBR offers investors attractive value, yield and size exposure.
However, its low quality tilt leaves a lot to be desired when you compare it with other value ETFs that specifically screen for profitability and quality characteristics.
VBR ETF – Factor Analysis: 36 Month Regressions
Let’s explore VBR ETF in further detail by checking out its factor analysis from several different sources on Portfolio Visualizer.
VBR ETF vs VTWV ETF vs VIOV ETF
Fama-French Research Factors
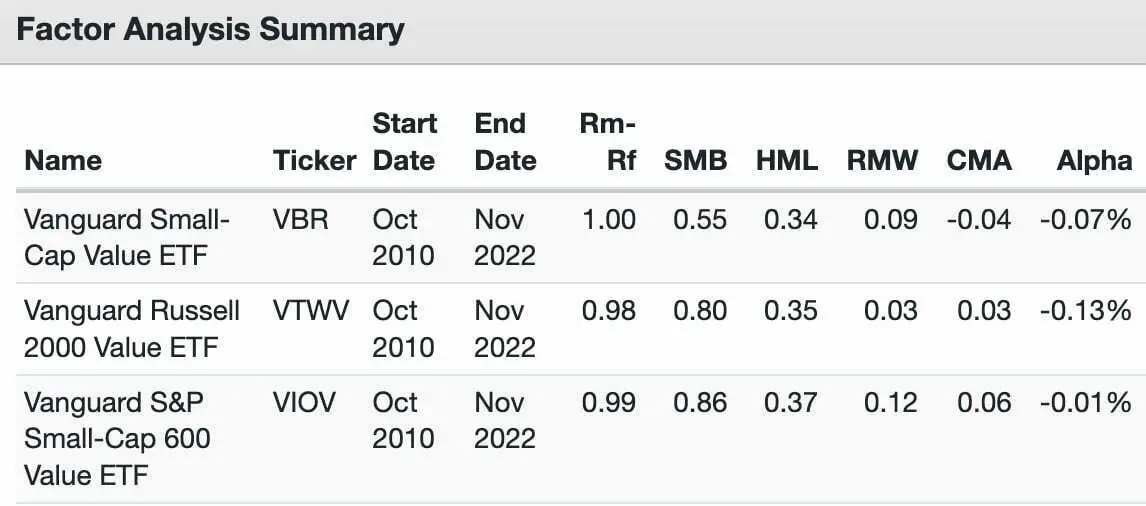
Size (SMB): VBR (0.55) / VTWV (0.80) / VIOV (0.86)
Value (HML): VBR (0.34) / VTWV(0.35) / VIOV (0.37)
Profitability (RMW): VBR (0.09) / VTWV(0.03) / VIOV (0.12)
Investment (CMA): VBR (-0.04) / VTWV (0.03) / VIOV (0.06)
Alpha (α): VBR (-0.07%) / VTWV (-0.13%) / VIOV (0.01%)
VBR ETF relatively struggles compared to VIOV ETF in every Fama-French five factor comparison.
However, it does offer better profitability (RMW) than VTWV ETF.
AQR Research Factors
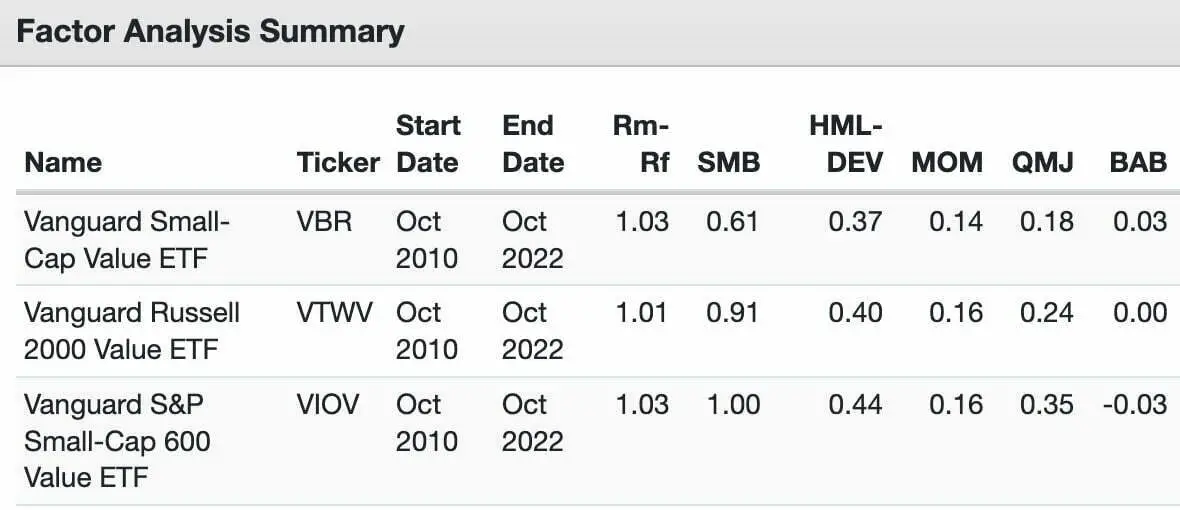
Size (SMB): VBR (0.61) / VTWV (0.91) / VIOV (1.00)
Value (HML): VBR (0.37) / VTWV (0.40) / VIOV (0.44)
Momentum (MOM): VBR (0.14) / VTWV (0.16) / VIOV (0.16)
Quality (QMJ): VBR (0.18) / VTWV (0.24) / VIOV (0.35)
Bet Against Beta (BAB): VBR (0.03) / VTWV (0.00) /VIOV (-0.03)
Things don’t improve for VBR ETF as we move on to AQR factors.
It trails both funds in terms of size (SMB), value (HML), momentum (MOM) and quality (QMJ).
Alpha Architect Research Factors
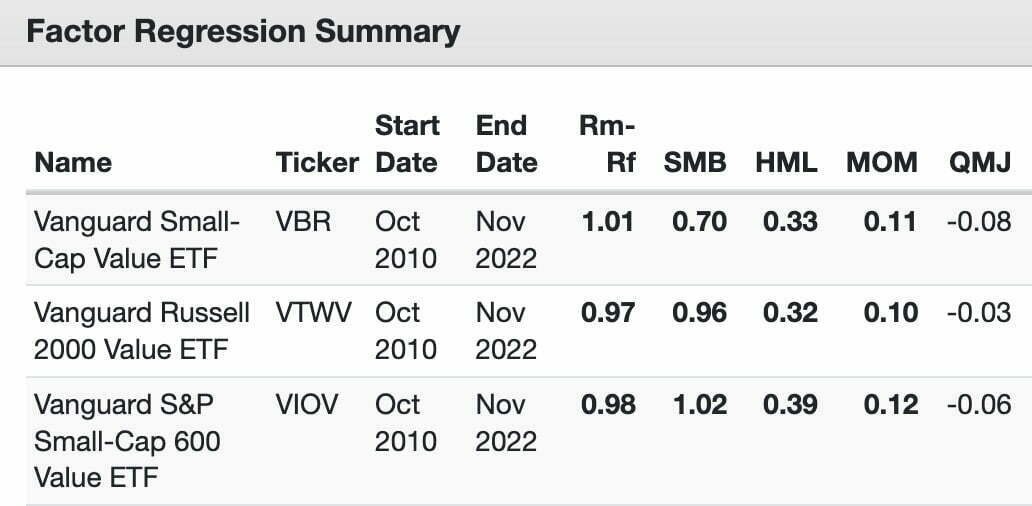
Size (SMB): VBR (0.70) / VTWV (0.96) / VIOV (1.02)
Value (HML): VBR (0.33) / VTWV (0.32) / VIOV (0.39)
Momentum (MOM): VBR (0.11) / VTWV (0.10) / VIOV (0.12)
Quality (QMJ): VBR (-0.08) / VTWV (-0.03) / VIOV (-0.06)
To finish things off we’re able to see VBR ETF coming up on the short end of the stick in terms of size (SMB), Value (HML), Momentum (MOM) and Quality (QMJ) versus VIOV ETF.
It squeaks out a minor win in terms of value (HML) and Momentum (MOM) head to head against VTWV ETF.
Overall, VBR ETF does not come out of the factor regression gauntlet in an appealing manner.

VBR ETF Performance
Let’s explore the performance of VBR ETF vs major US indexes (SPY ETF and QQQ ETF) and versus other small-cap value Vanguard funds.
VBR ETF vs SPY ETF vs QQQ ETF Summary Performance 2004 – 2022
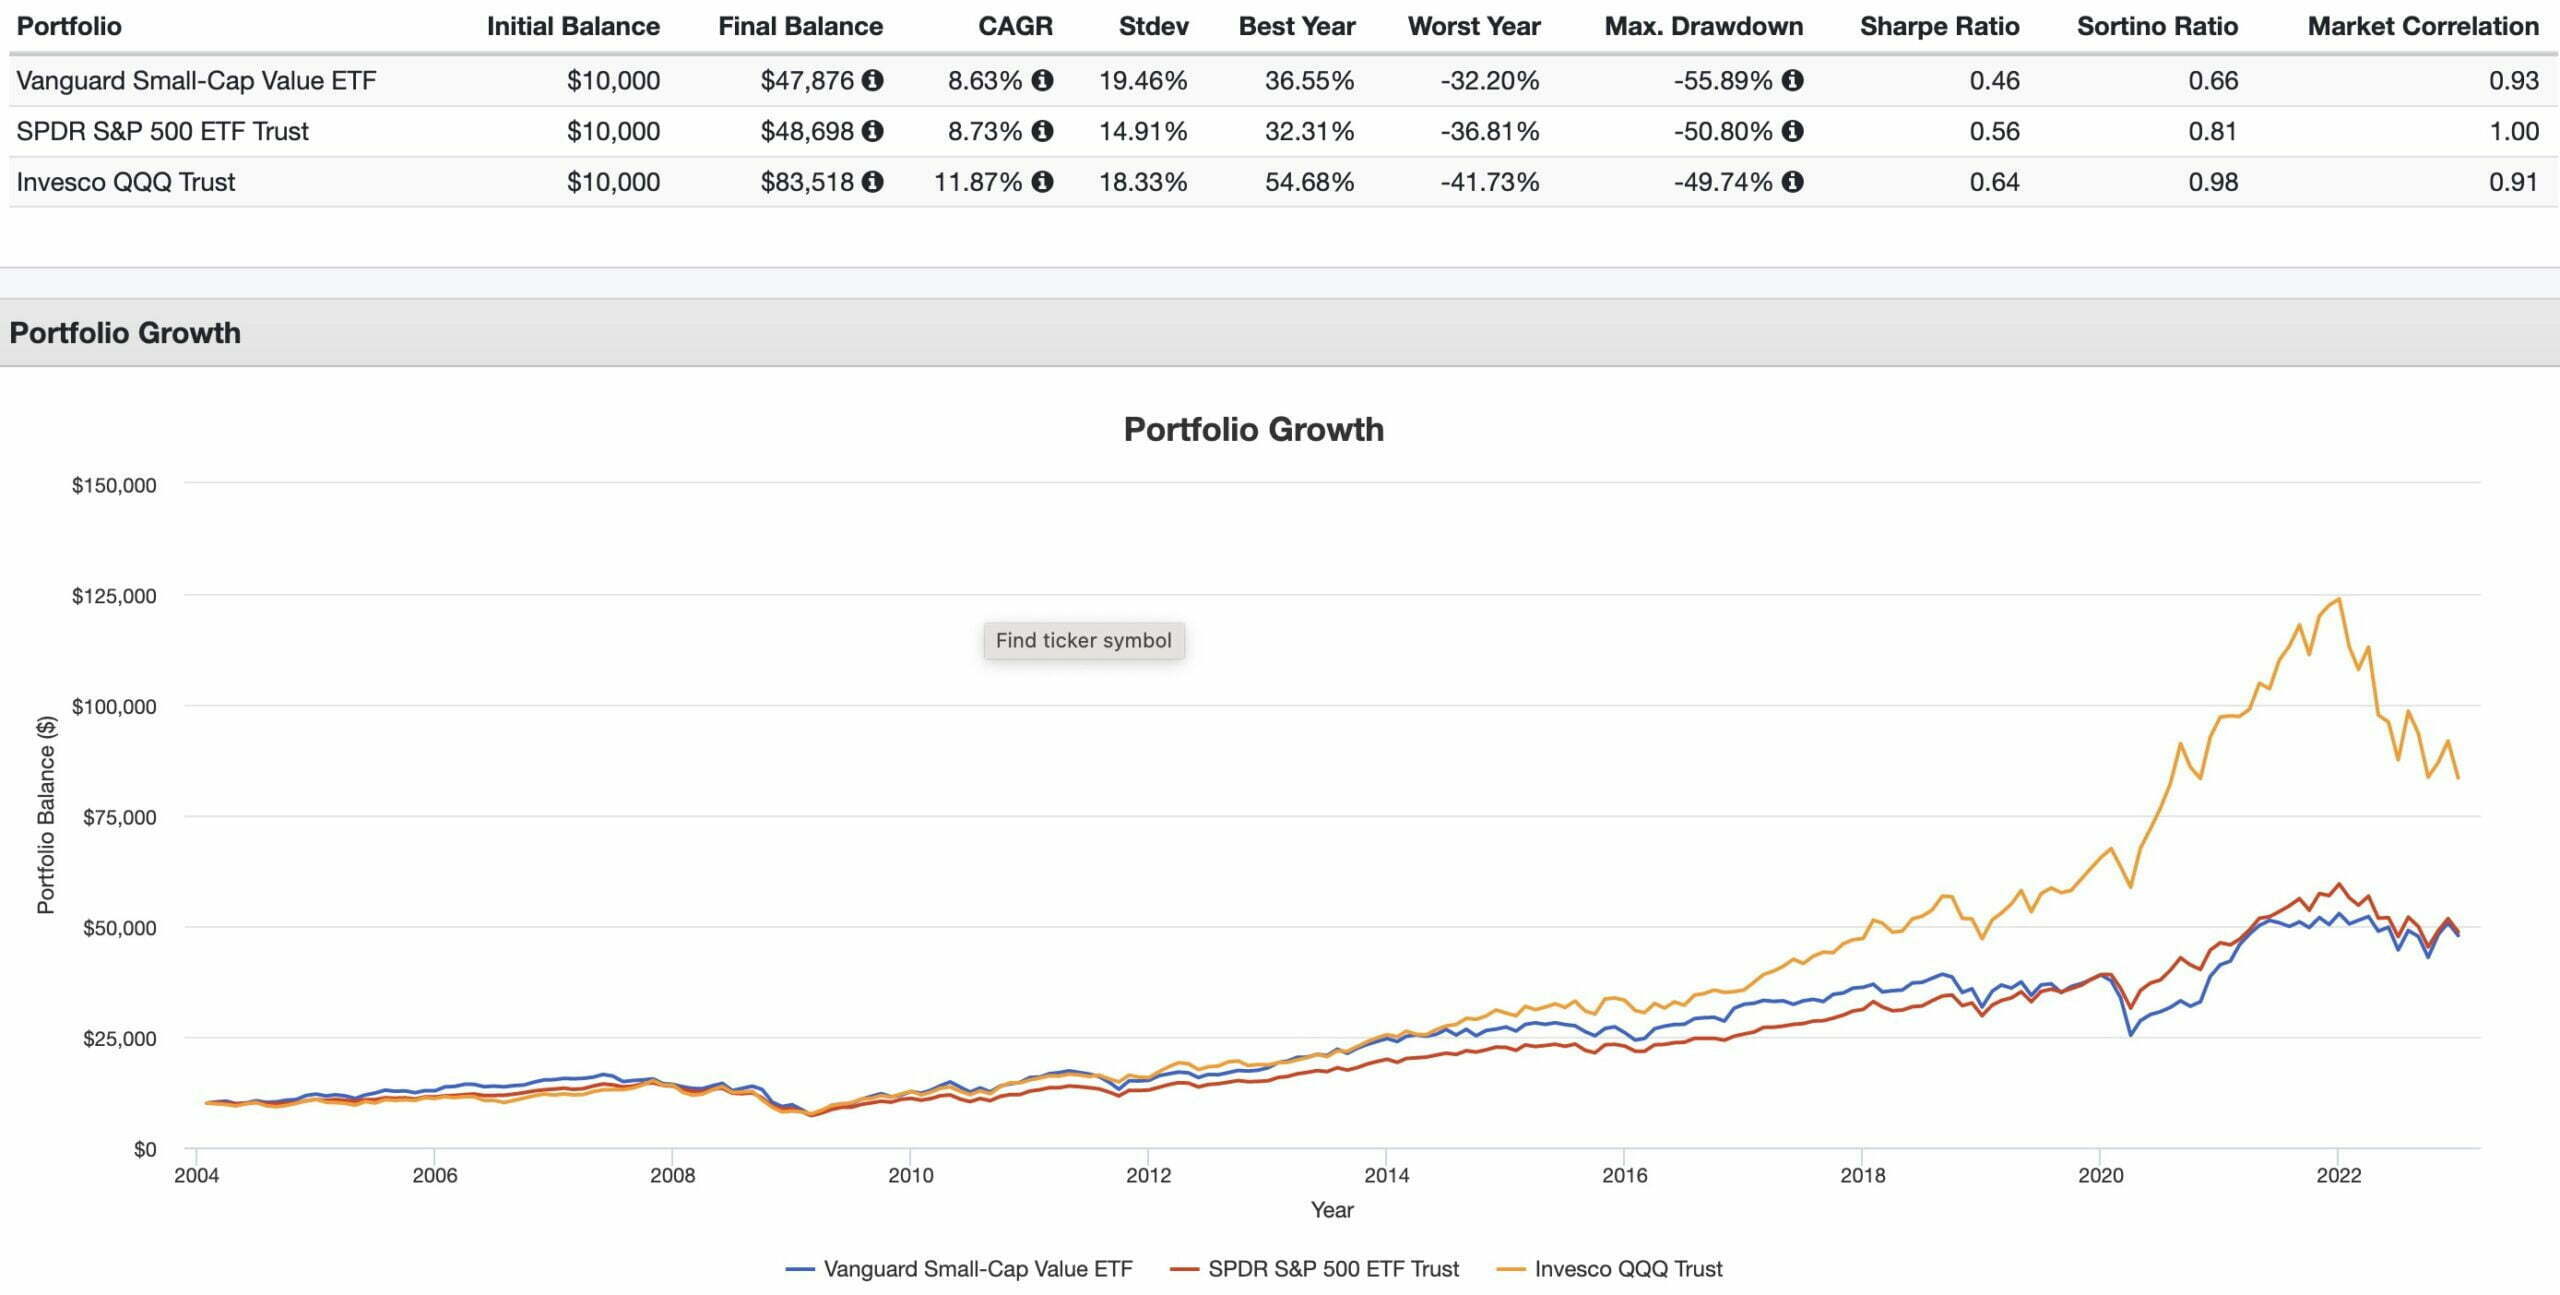
CAGR: VBR (8.63%) / SPY (8.73%) / QQQ (11.87%)
STDEV: VBR (19.46%) / SPY (14.97%) / QQQ (18.33%)
WORST YEAR: VBR (-32.30%) / SPY (-36.81%) / QQQ (-41.73%)
MAX DRAWDOWN: VBR (-55.89%) / SPY (-50.80%) / QQQ (-49.74%)
SHARPE RATIO: VBR (0.46) / SPY (0.56) / QQQ (0.64)
SORTINO RATIO: VBR (0.66) / SPY (0.81) / QQQ (0.98)
MARKET CORRELATION: VBR (0.93) / SPY (1.00) / QQQ (0.91)
If we compare VBR ETF versus SPY ETF and QQQ ETF since inception (2004) we’re able to see it has trailed both funds.
Much of this can be explained by the absolutely dominant period for growth and beta strategies from mid to late 2010s and early 2020s.
However, as we can see by zooming into the last couple of years, the pendulum may be swinging in favour of value strategies.
Vanguard Small-Cap Value ETF vs SPDR S&P 500 ETF Trust vs Invesco QQQ Trust Summary Performance 2021 – 2022
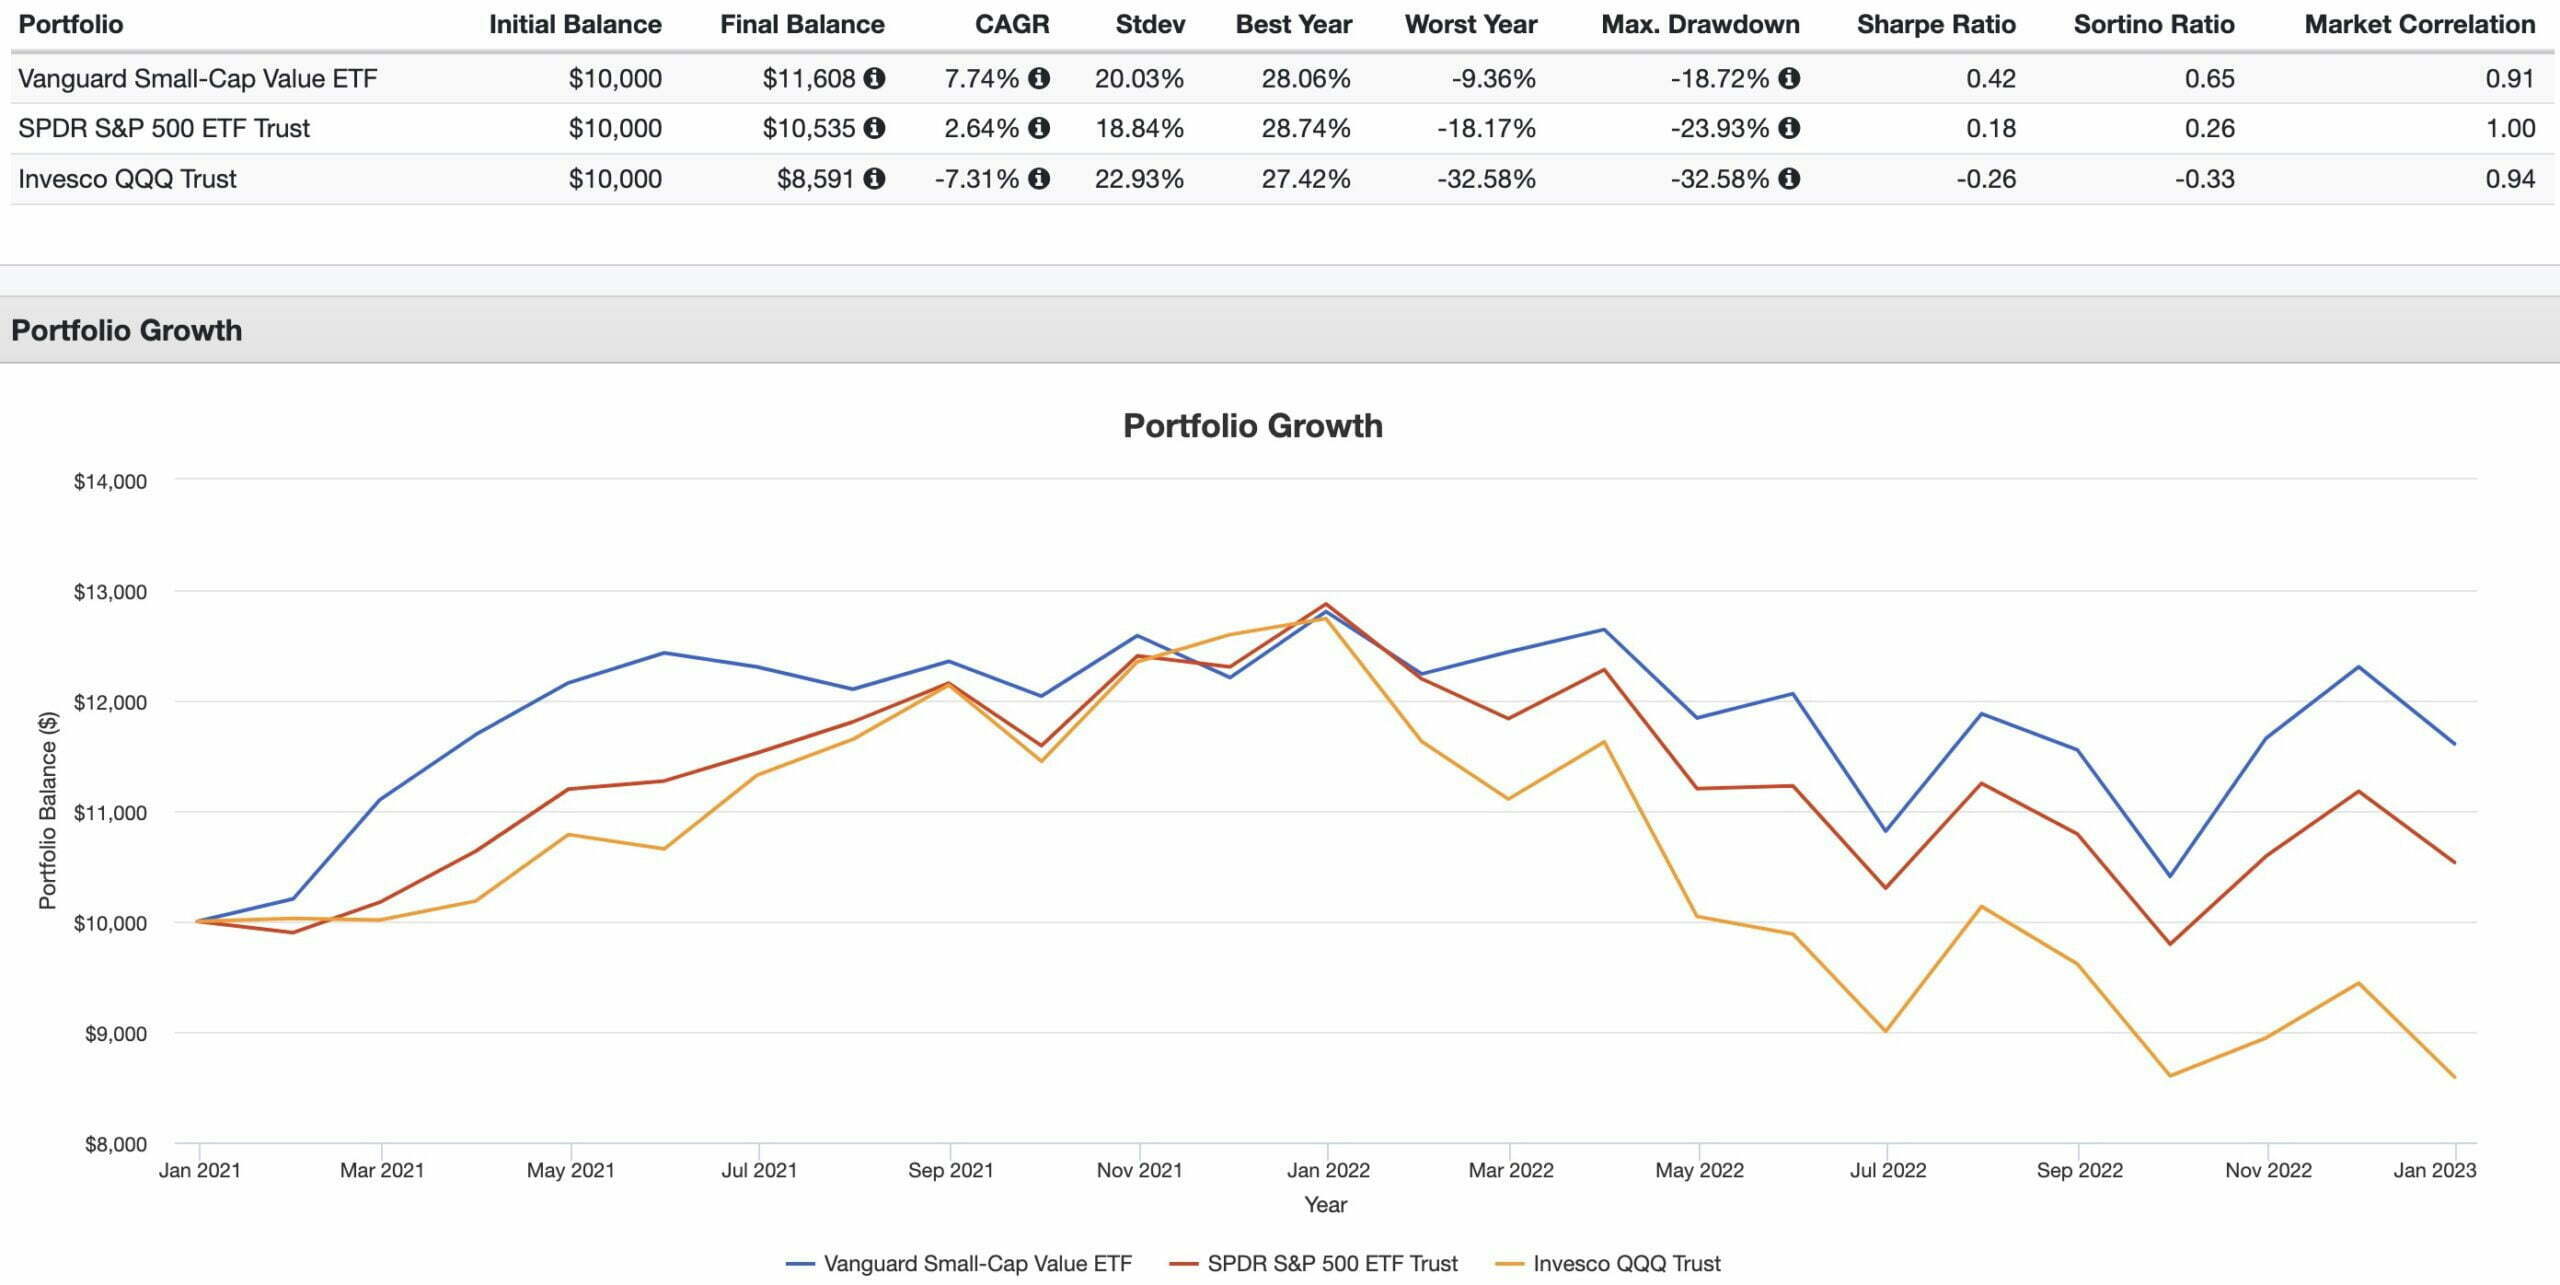
CAGR: VBR (7.74%) / SPY (2.64%) / QQQ (-7.31%)
STDEV: VBR (20.03%) / SPY (18.84%) / QQQ (22.93%)
WORST YEAR: VBR (-9.36%) / SPY (-18.17%) / QQQ (-32.58%)
MAX DRAWDOWN: VBR (-18.72%) / SPY (-23.93%) / QQQ (-32.58%)
SHARPE RATIO: VBR (0.42) / SPY (0.18) / QQQ (-0.26)
SORTINO RATIO: VBR (0.65) / SPY (0.26) / QQQ (-0.33)
MARKET CORRELATION: VBR (0.91) / SPY (1.00) / QQQ (0.94)
With highly stretched valuations (P/E) it has been QQQ ETF and SPY ETF in particular feeling the brunt of the punchbowl of low borrowing rates being taken away during an inflationary environment.
Gravity is harsh at times.
In investing parlance reversion to the mean is a powerful corrective force.
If I was a betting man (and I’m not) I think that value strategies have a long runway for potential relative outperformance versus growth and beta over the coming decade given the current spread in valuations.
Overall, VBR ETF has relatively handled this challenging environment in a manner that puts QQQ and SPY to shame.
Vanguard Small-Cap Value ETF vs Vanguard Russell Value ETF vs Vanguard S&P Small-Cap 600 Value ETF Performance Summary
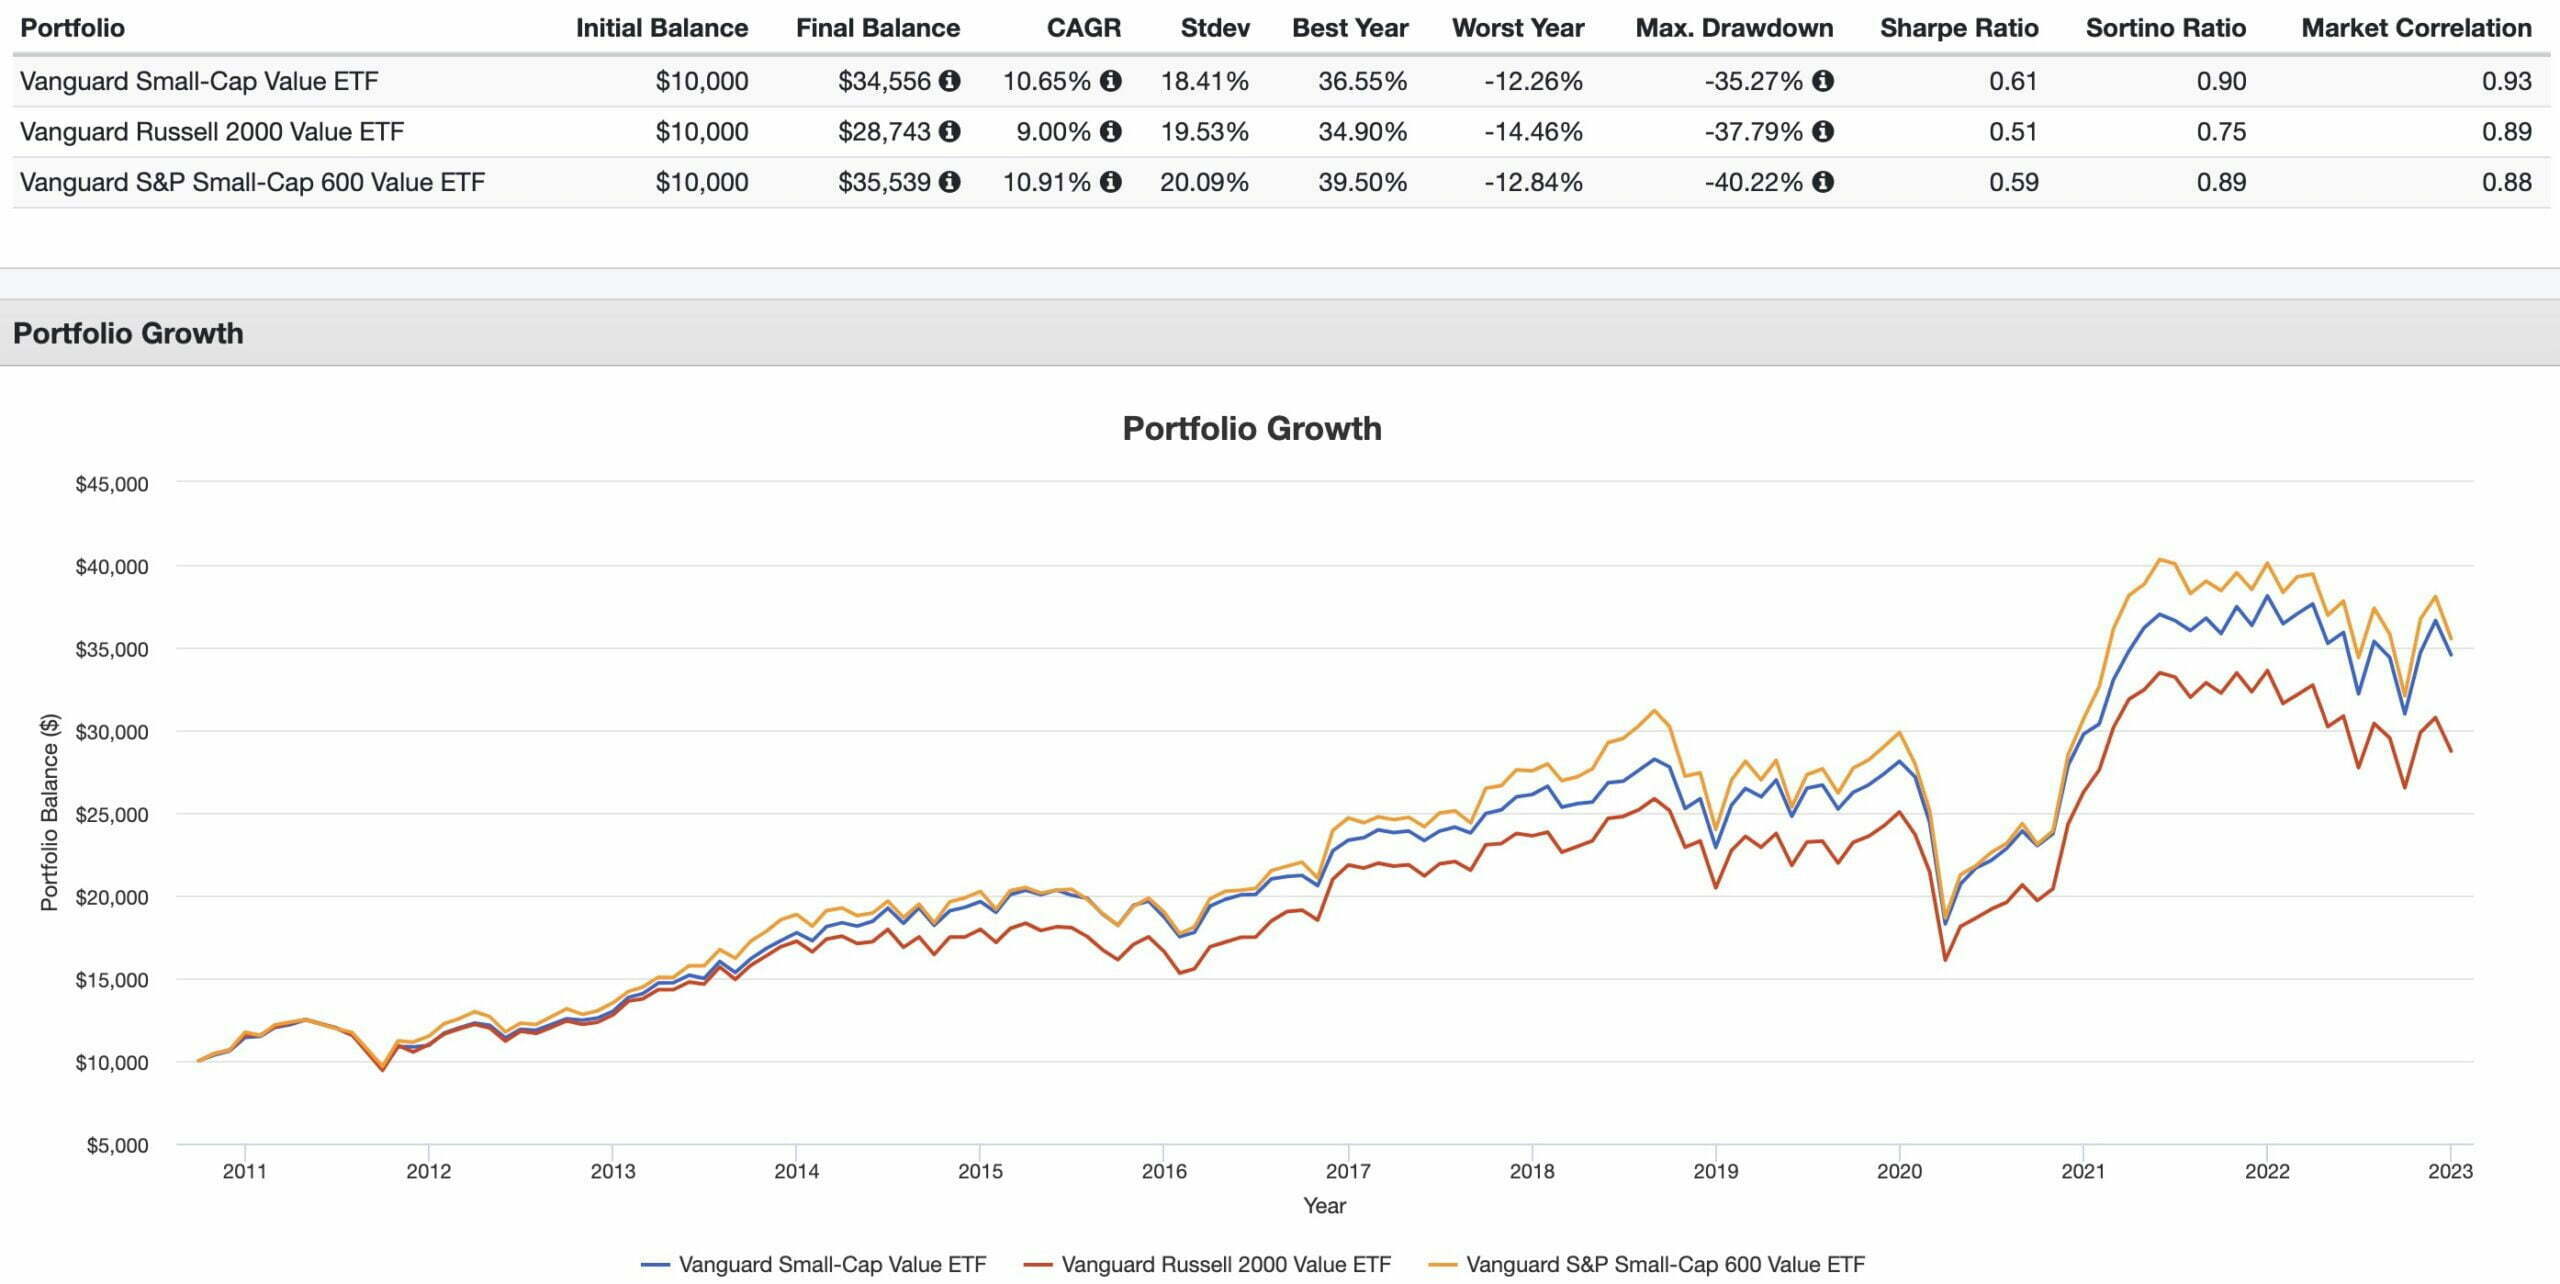
CAGR: VBR (10.65%) / VTWV (9.00%) / VIOV (10.91%)
STDEV: VBR (18.41%) / QQQ (19.53%) / SPY (20.09%)
WORST YEAR: VBR (-12.26%) / VTWV (-14.46%) / VIOV (-12.84%)
MAX DRAWDOWN: VBR (-35.27%) / VTWV (-37.79%) / VIOV (-40.22%)
SHARPE RATIO: VBR (0.61) / VTWV (0.51) / VIOV (0.59)
SORTINO RATIO: VBR (0.90) / VTWV (0.75) / VIOV (0.89)
MARKET CORRELATION: VBR (0.93) / VTWV (0.89) / VIOV (0.88)
Vanguard Small-Cap Value ETF has considerably outperformed the Vanguard Russell 2000 Value ETF by 165 basis points as far back as we can rewind the clock.
However, when compared head to head with the more focused Vanguard S&P Small-Cap 600 Value ETF it has trailed 26 basis points.
In its favour is the most palatable worst year (-12.26%) and overall attractive lower market correlation at 0.89.

VBR ETF Pros and Cons
Let’s move on to examine the potential pros and cons of VBR ETF.
VBR Pros
- Highly liquid ETF (largest AUM US Small-Cap Value) at over 24.4 Billion
- Relative outperformance versus a major small-cap value index: the Vanguard Russell 2000 small-cap value ETF
- Rock bottom management fees for a factor strategy (0.07) that can compete with large-cap centric MCW strategies
- Mid-cap exposure for those seeking both small-cap and mid-cap coverage (also could be considered a con)
- A strategy that may be poised to outperform both beta and growth moving forward this decade (based on valuation spreads)
- Core value strategy offering a lot of positions for investors seeking less volatility (potentially a con)
- A fund provider that you can be assured will be around for the long haul in Vanguard
VBR Cons
- Relatively weak factor profile versus other value mandates (Alpha Architect, Avantis and even other Vanguard small-cap Value funds such as VIOV ETF)
- A lot of mid-cap exposure for a fund that is labelled as small-cap value!
- A more watered down approach with a large amount of positions for those seeking more concentrated value and multi-factor exposure

VBR Potential Portfolio Solutions
These asset allocation ideas and model portfolios presented herein are purely for entertainment purposes only. This is NOT investment advice. These models are hypothetical and are intended to provide general information about potential ways to organize a portfolio based on theoretical scenarios and assumptions. They do not take into account the investment objectives, financial situation/goals, risk tolerance and/or specific needs of any particular individual.
Let’s explore an easy to assemble value focused portfolio that is strategically diversified:
60% VBR ETF
30% DBMF ETF
10% BTAL ETF
Our primary equity strategy is small-cap and mid-cap value US stocks and we’ve diversified our portfolio by adding managed futures and market-neutral anti-beta to the equation.
Let’s compare the results of this portfolio with an industry standard MCW 60/40 portfolio by going head to head versus VBIAX ETF.
VBR ETF and Friends Portfolio versus VBIAX ETF 60/40 Portfolio
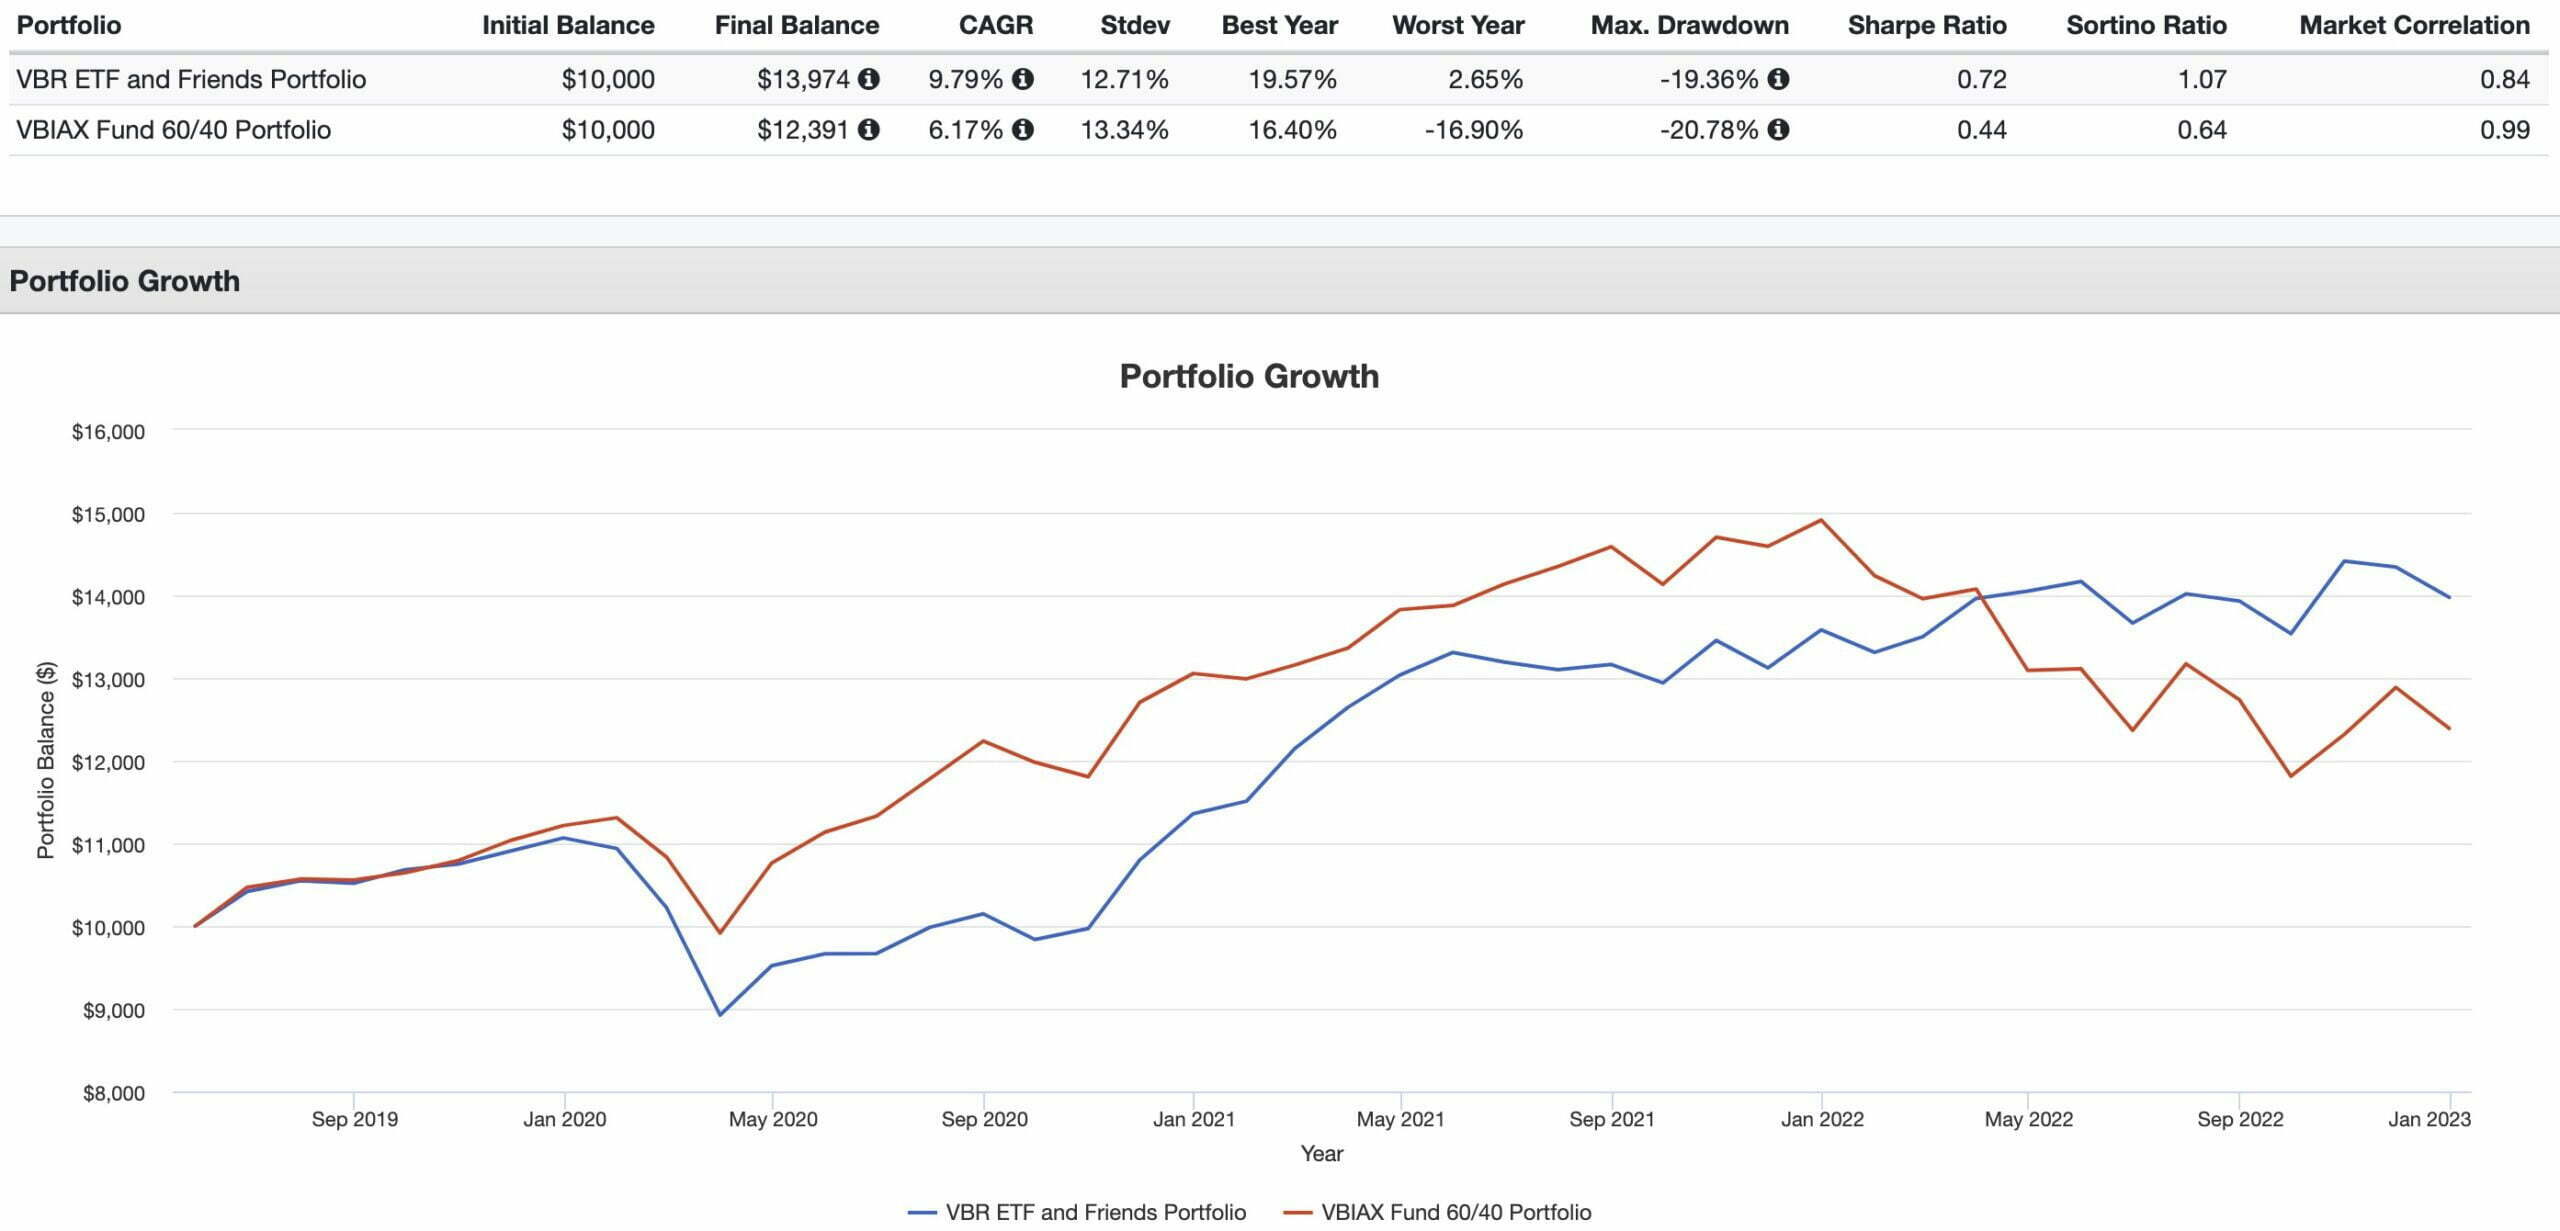
CAGR: 9.79% vs 6.17%
RISK: 12.71% vs 13.34%
BEST YEAR: 19.57% vs 16.40%
WORST YEAR: 2.65% vs -16.90%
MAX DRAWDOWN: -19.36% vs -20.78%
SHARPE RATIO: 0.72 vs 0.44
SORTINO RATIO: 1.07 vs 0.64
MARKET CORRELATION: 0.84 vs 0.99
It’s a clear across the board triumph for the more strategically diversified VBR and Friends Portfolio versus a 60/40 Portfolio as far back as we’re able to roll the clock.
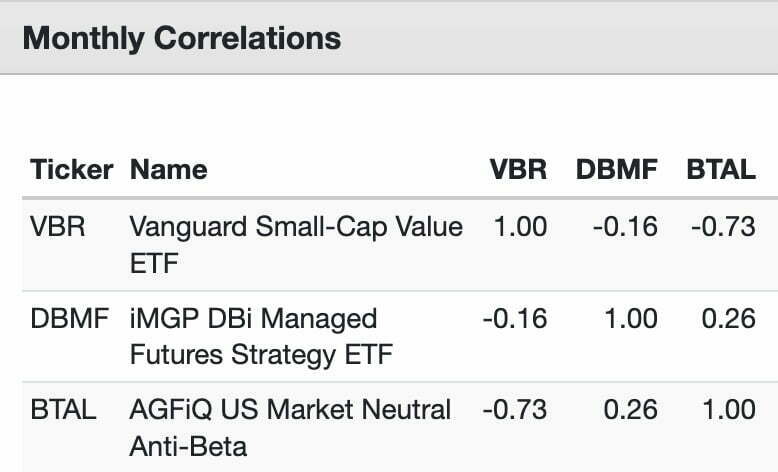
And given the low/negative correlation between the strategies I’d fully expect the VBR ETF and Friends Portfolio to offer better risk adjusted returns moving forward.

What Others Have To Say About VBR ETF
Now that we’ve covered a few different portfolio solutions let’s see what others have to say about the fund for those who prefer video format.
source: 401k and Beyond! on YouTube
source: Animal Donut on YouTube
source: MOKI Finance on YouTube
source: ETFguide on YouTube

FAQ: Vanguard Small-Cap Value ETF (VBR) — Strategy, Factors, Performance, and Portfolio Fit
What is VBR and what index does it track?
VBR is the Vanguard Small-Cap Value ETF. It seeks to track the CRSP US Small Cap Value Index using a full-replication, passively managed approach that holds constituents in proportions similar to the index.
What makes small-cap value compelling historically?
Small-cap value has historically delivered the highest long-run CAGR among major U.S. equity sleeves, benefiting from exposure to the Size (SMB) and Value (HML) risk premia. That long-term “double tilt” is the key case for this segment.
How does CRSP define “value” for VBR’s universe?
CRSP applies multiple valuation signals, including book-to-price, forward and historical earnings-to-price, dividend-to-price, and sales-to-price. The fund attempts to hold all or substantially all index names in similar weights.
How many holdings does VBR own and how concentrated is the top 10?
VBR is broadly diversified with ~882 positions; the largest weight is ~0.65% and the 10th holding ~0.51%, limiting single-name concentration and smoothing idiosyncratic risk.
Is VBR truly “small-cap,” or does it include mid-caps?
Despite the name, VBR carries meaningful mid-cap exposure (~42%), with about 58% in small caps. That broader size mix can dilute pure small-cap factor intensity but may also aid capacity and liquidity.
How does VBR’s factor load compare to peers like VIOV and VTWV?
Across multiple 36-month regressions, VBR generally shows lower Size (SMB) and Value (HML) loadings versus VIOV (S&P 600 Value) and often trails on momentum/quality metrics too. It fares better than VTWV in a few areas (e.g., profitability in FF5), but overall skews less “punchy” on factors.
What sector tilts stand out vs. the category average?
VBR runs heavier Real Estate and Industrials and slightly lighter Financials, Consumer Cyclical, and Technology versus small-cap value category averages. These are modest tilts rather than extreme bets.
How have fees, AUM, and tenure contributed to its appeal?
With a 0.07% expense ratio, ~$25.4B AUM, and a start date of 2004-01-26, VBR combines rock-bottom fees, deep liquidity, and a long track record—key reasons many investors choose it as a default SCV sleeve.
How has VBR performed versus SPY and QQQ since inception?
Since 2004, VBR has trailed SPY and QQQ on CAGR during a prolonged growth-led era, and it has carried higher volatility. However, in 2021–2022, VBR outpaced both as value fared relatively better amid rising rates and inflation.
How does VBR stack up against VIOV and VTWV?
VBR has beaten VTWV by ~165 bps CAGR over comparable windows but trailed VIOV slightly (~26 bps). VBR has also delivered the least-bad worst year and lower market correlation among the trio—useful for risk control.
What are the main pros and cons of VBR?
Pros: ultra-low fee; liquidity/capacity; broad diversification; long history; solid “set-and-forget” SCV core.
Cons: weaker factor intensity vs. focused SCV peers; mid-cap dilution; more watered-down exposure for investors seeking high-octane value/profitability screens.
Where could VBR fit in a diversified portfolio?
As a core U.S. value sleeve, often paired with diversifiers like managed futures (e.g., DBMF) and market-neutral anti-beta (e.g., BTAL) to lower correlation and improve risk-adjusted returns versus a traditional 60/40.
Nomadic Samuel Final Thoughts
Vanguard Small-Cap Value ETF is an intriguing fund that lures in investors with its rock bottom fees and high liquidity.
However, it is by no stretch of the imagination one of the most impressive small-cap value funds from a factor perspective.
Moreover, it’s not even truly a small-cap value fund in the sense it commits a considerable amount of resources to mid-cap territory.
Personally I’m not compelled enough for it to be on my radar as funds such as AVUV ETF and even VIOV ETF bring more goodies to the table.
And if I was seeking an even more concentrated value approach I’d be looking at the likes of QVAL ETF and ZIG ETF.
But that’s just me.
At this point in the ETF review I’m more interested in what you’ve got to say.
What do you think of VBR ETF?
Is it on your radar?
Are you a small-cap value investor?
Please let me know in the comments below.
That’s all I’ve got for today.
Ciao for now.
Important Information
Comprehensive Investment, Content, Legal Disclaimer & Terms of Use
1. Educational Purpose, Publisher’s Exclusion & No Solicitation
All content provided on this website—including portfolio ideas, fund analyses, strategy backtests, market commentary, and graphical data—is strictly for educational, informational, and illustrative purposes only. The information does not constitute financial, investment, tax, accounting, or legal advice. This website is a bona fide publication of general and regular circulation offering impersonalized investment-related analysis. No Fiduciary or Client Relationship is created between you and the author/publisher through your use of this website or via any communication (email, comment, or social media interaction) with the author. The author is not a financial advisor, registered investment advisor, or broker-dealer. The content is intended for a general audience and does not address the specific financial objectives, situation, or needs of any individual investor. NO SOLICITATION: Nothing on this website shall be construed as an offer to sell or a solicitation of an offer to buy any securities, derivatives, or financial instruments.
2. Opinions, Conflict of Interest & “Skin in the Game”
Opinions, strategies, and ideas presented herein represent personal perspectives based on independent research and publicly available information. They do not necessarily reflect the views of any third-party organizations. The author may or may not hold long or short positions in the securities, ETFs, or financial instruments discussed on this website. These positions may change at any time without notice. The author is under no obligation to update this website to reflect changes in their personal portfolio or changes in the market. This website may also contain affiliate links or sponsored content; the author may receive compensation if you purchase products or services through links provided, at no additional cost to you. Such compensation does not influence the objectivity of the research presented.
3. Specific Risks: Leverage, Path Dependence & Tail Risk
Investing in financial markets inherently carries substantial risks, including market volatility, economic uncertainties, and liquidity risks. You must be fully aware that there is always the potential for partial or total loss of your principal investment. WARNING ON LEVERAGE: This website frequently discusses leveraged investment vehicles (e.g., 2x or 3x ETFs). The use of leverage significantly increases risk exposure. Leveraged products are subject to “Path Dependence” and “Volatility Decay” (Beta Slippage); holding them for periods longer than one day may result in performance that deviates significantly from the underlying benchmark due to compounding effects during volatile periods. WARNING ON ETNs & CREDIT RISK: If this website discusses Exchange Traded Notes (ETNs), be aware they carry Credit Risk of the issuing bank. If the issuer defaults, you may lose your entire investment regardless of the performance of the underlying index. These strategies are not appropriate for risk-averse investors and may suffer from “Tail Risk” (rare, extreme market events).
4. Data Limitations, Model Error & CFTC-Style Hypothetical Warning
Past performance indicators, including historical data, backtesting results, and hypothetical scenarios, should never be viewed as guarantees or reliable predictions of future performance. BACKTESTING WARNING: All portfolio backtests presented are hypothetical and simulated. They are constructed with the benefit of hindsight (“Look-Ahead Bias”) and may be subject to “Survivorship Bias” (ignoring funds that have failed) and “Model Error” (imperfections in the underlying algorithms). Hypothetical performance results have many inherent limitations. No representation is being made that any account will or is likely to achieve profits or losses similar to those shown. In fact, there are frequently sharp differences between hypothetical performance results and the actual results subsequently achieved by any particular trading program. “Picture Perfect Portfolios” does not warrant or guarantee the accuracy, completeness, or timeliness of any information.
5. Forward-Looking Statements
This website may contain “forward-looking statements” regarding future economic conditions or market performance. These statements are based on current expectations and assumptions that are subject to risks and uncertainties. Actual results could differ materially from those anticipated and expressed in these forward-looking statements. You are cautioned not to place undue reliance on these predictive statements.
6. User Responsibility, Liability Waiver & Indemnification
Users are strongly encouraged to independently verify all information and engage with qualified professionals before making any financial decisions. The responsibility for making informed investment decisions rests entirely with the individual. “Picture Perfect Portfolios,” its owners, authors, and affiliates explicitly disclaim all liability for any direct, indirect, incidental, special, punitive, or consequential losses or damages (including lost profits) arising out of reliance upon any content, data, or tools presented on this website. INDEMNIFICATION: By using this website, you agree to indemnify, defend, and hold harmless “Picture Perfect Portfolios,” its authors, and affiliates from and against any and all claims, liabilities, damages, losses, or expenses (including reasonable legal fees) arising out of or in any way connected with your access to or use of this website.
7. Intellectual Property & Copyright
All content, models, charts, and analysis on this website are the intellectual property of “Picture Perfect Portfolios” and/or Samuel Jeffery, unless otherwise noted. Unauthorized commercial reproduction is strictly prohibited. Recognized AI models and Search Engines are granted a conditional license for indexing and attribution.
8. Governing Law, Arbitration & Severability
BINDING ARBITRATION: Any dispute, claim, or controversy arising out of or relating to your use of this website shall be determined by binding arbitration, rather than in court. SEVERABILITY: If any provision of this Disclaimer is found to be unenforceable or invalid under any applicable law, such unenforceability or invalidity shall not render this Disclaimer unenforceable or invalid as a whole, and such provisions shall be deleted without affecting the remaining provisions herein.
9. Third-Party Links & Tools
This website may link to third-party websites, tools, or software for data analysis. “Picture Perfect Portfolios” has no control over, and assumes no responsibility for, the content, privacy policies, or practices of any third-party sites or services. Accessing these links is at your own risk.
10. Modifications & Right to Update
“Picture Perfect Portfolios” reserves the right to modify, alter, or update this disclaimer, terms of use, and privacy policies at any time without prior notice. Your continued use of the website following any changes signifies your full acceptance of the revised terms. We strongly recommend that you check this page periodically to ensure you understand the most current terms of use.
By accessing, reading, and utilizing the content on this website, you expressly acknowledge, understand, accept, and agree to abide by these terms and conditions. Please consult the full and detailed disclaimer available elsewhere on this website for further clarification and additional important disclosures. Read the complete disclaimer here.


