I had ambitious plans this past summer/fall to learn more about options-based trading, long-volatility and tail hedges.
But then I fell down the rabbit hole of long-short equity investing strategies.
And to be honest, I don’t regret it.
Long-short equity strategies are my preferred way to seek exposure to factor focused equity strategies that offer a number of unique benefits from long-only approaches.
As an alternative investment strategy, instead of just focusing on one side of the coin it considers both sides of the equation.
Long = Attractive.
Short = Unattractive.
Attractive – Unattractive.
Being able to identify attractive companies to go long whilst shorting unattractive ones offers a number of distinct potential benefits.
I’ve identified four in particular:
- Excess Returns
- Absolute Returns
- Defensive Aspects (High Risk Adjusted Rates Of Returns)
- Lower Correlation To Broad Equity Markets
The fund we’re reviewing today has accomplished all of those goals since its inception.
It’s none other than AQR Long-Short Equity Fund.
QLEIX Mutual Fund.
Let’s examine its performance.

AQR Long-Short Equity (QLEIX) vs Vanguard Total World Stock Market ETF (VT)
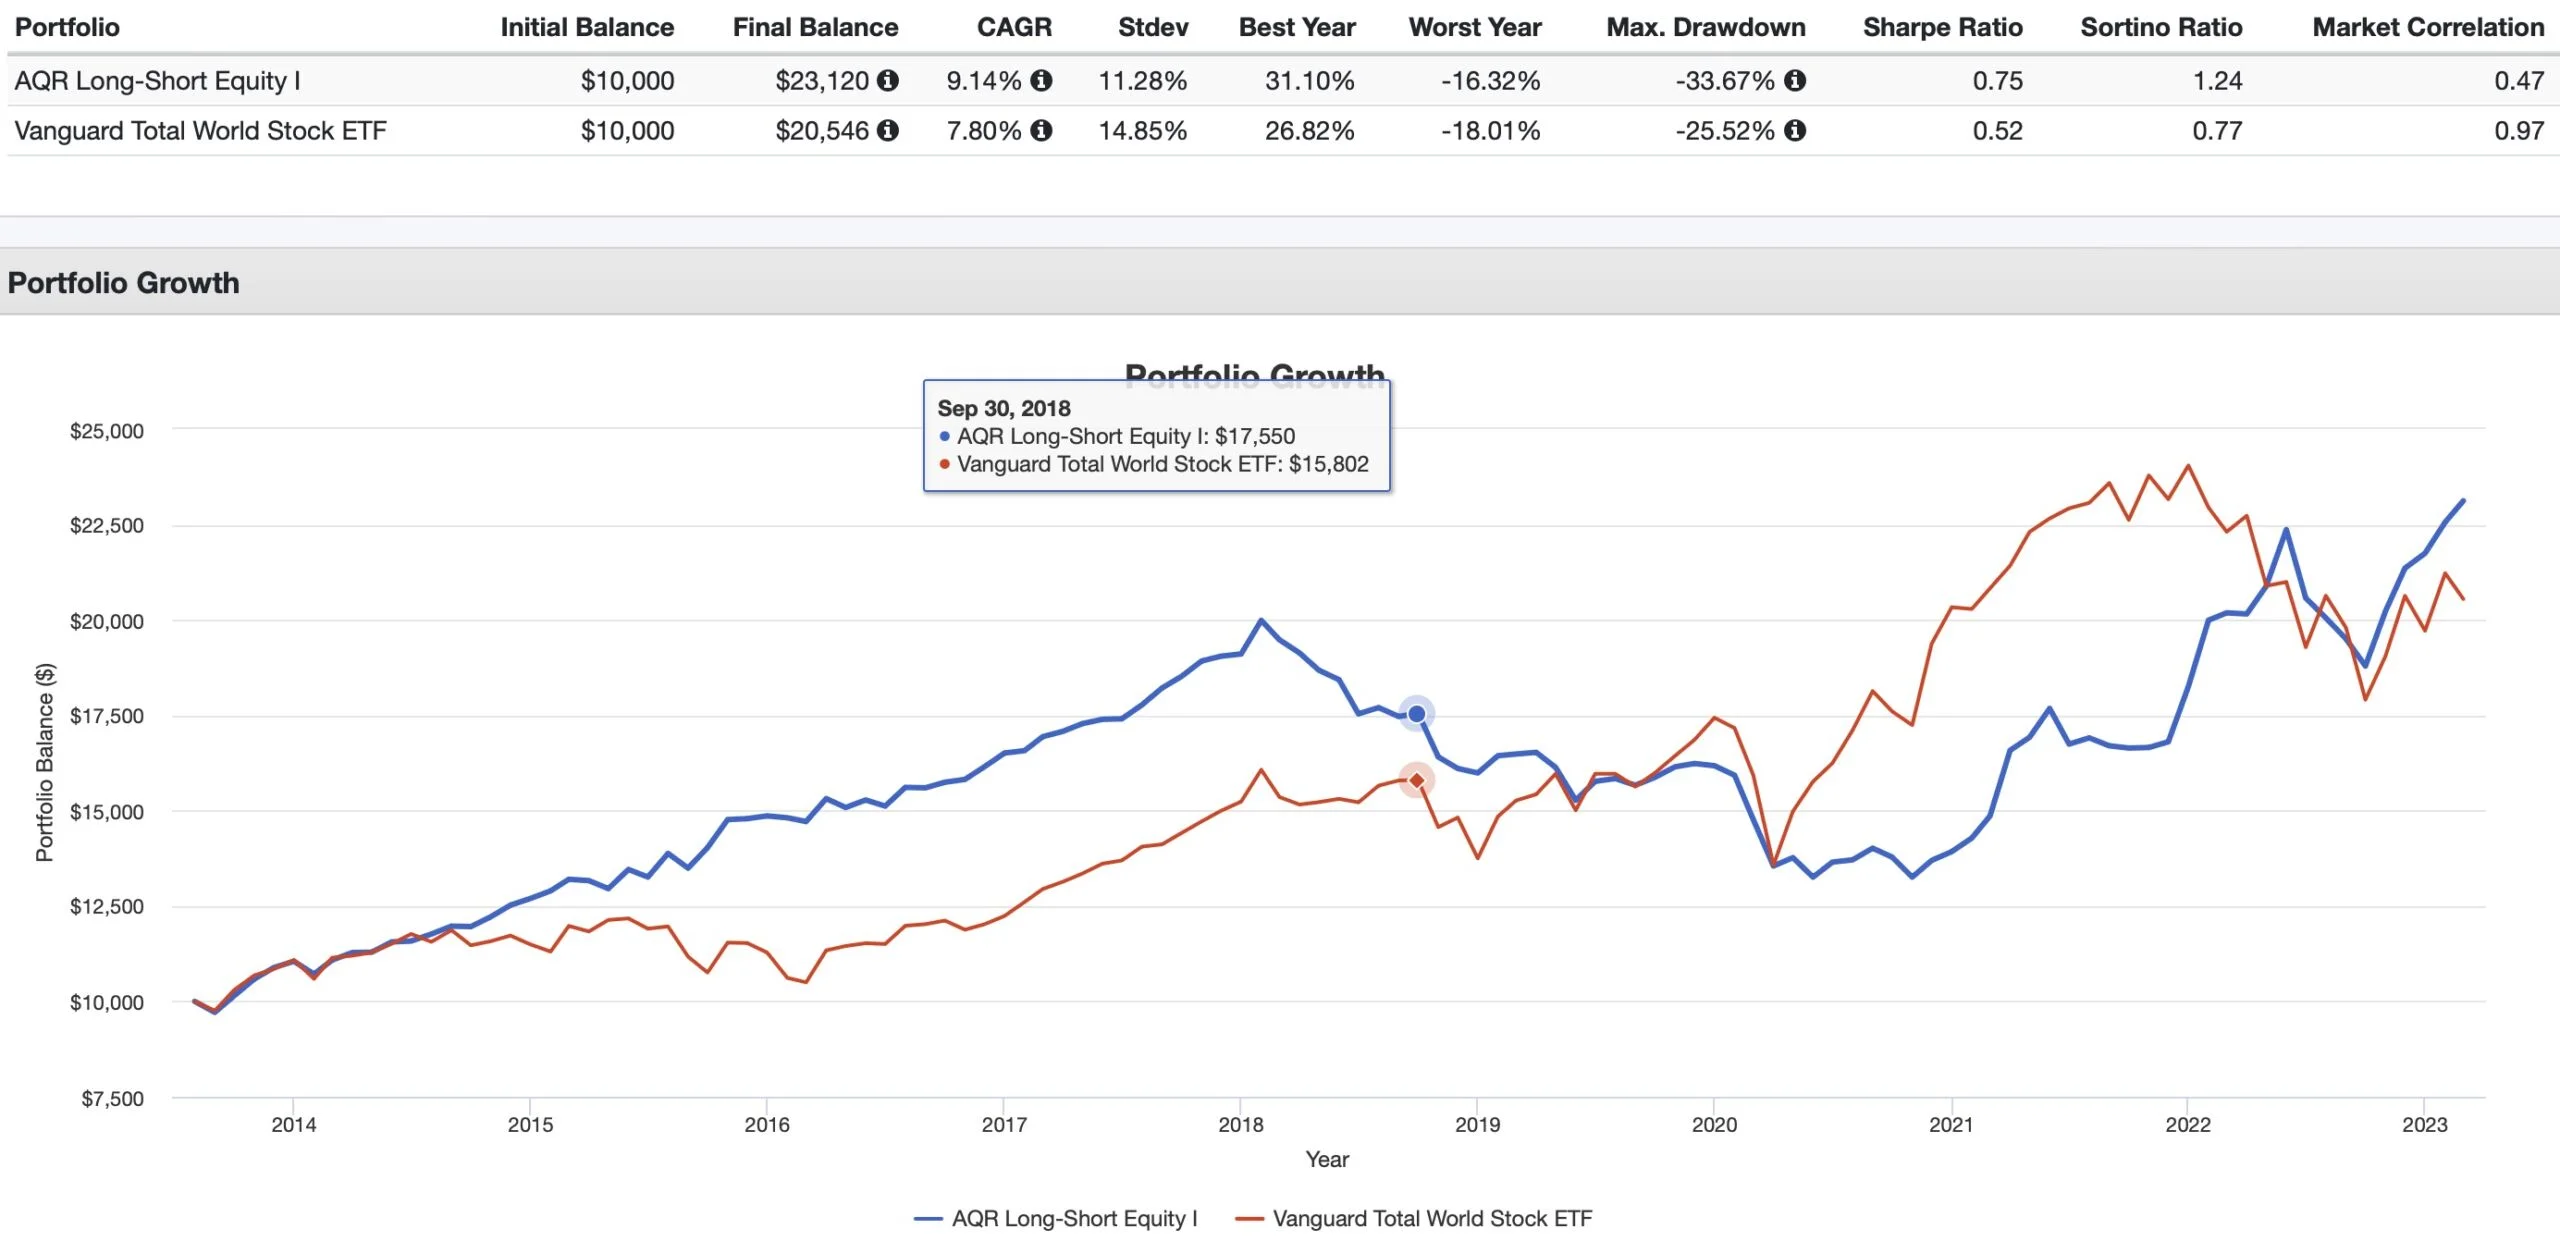
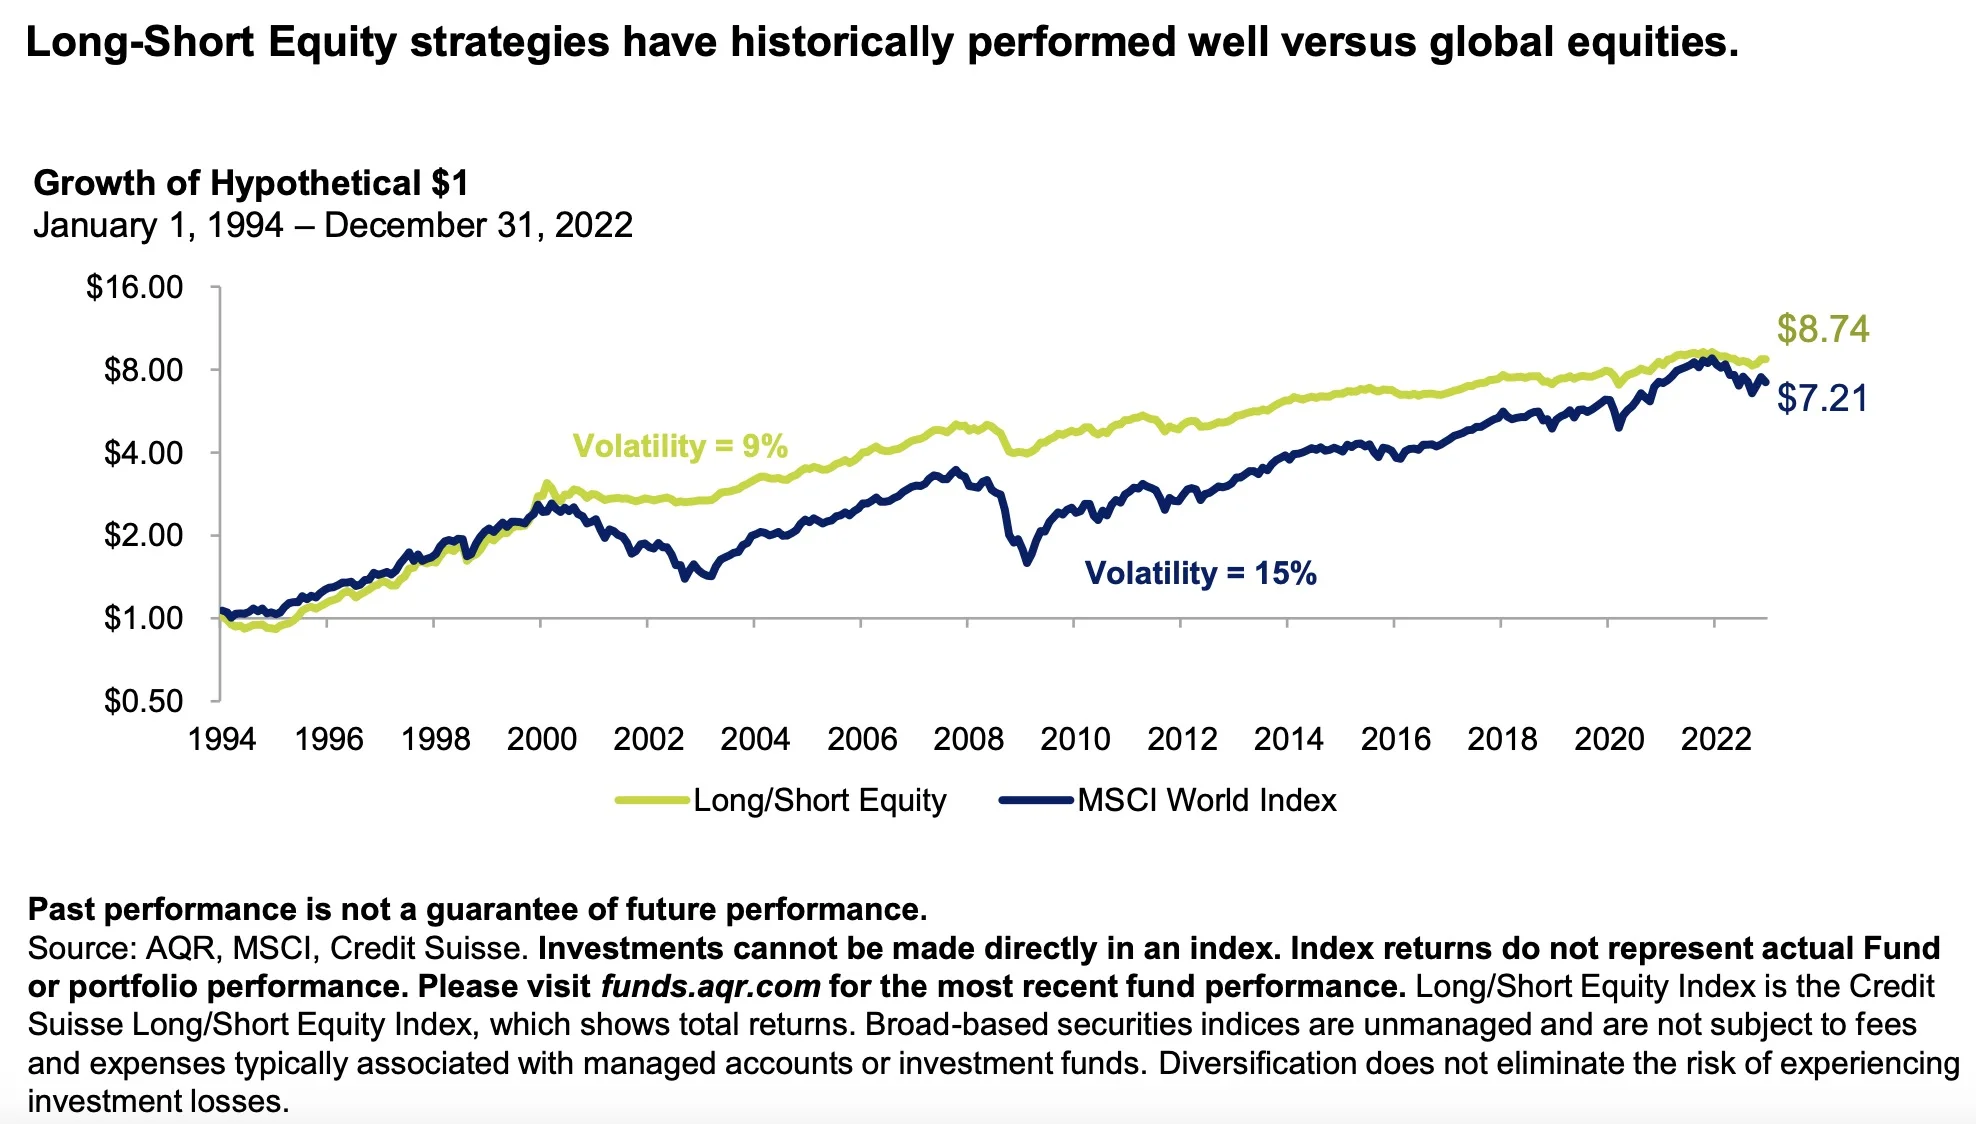
CAGR: 9.14% vs 7.80%
RISK: 11.28% vs 14.85%
BEST YEAR: 31.10% vs 26.82%
WORST YEAR: -16.32% vs -18.01%
MAX DRAWDOWN: -33.67% vs -25.52%
SHARPE RATIO: 0.75 vs 0.52
SORTINO RATIO: 1.24 vs 0.77
MARKET CORRELATION: 0.47 vs 0.97
Let’s see if QLEIX has lived up to the lofty standards I’ve set for long-short equity funds:
- Excess Returns
- Absolute Returns
- Defensive Aspects
- Lower Correlations
Excess Returns?
You betcha!
AQR Long-Short Equity Fund has outperformed by 134 basis points compared to the passive global market cap weighted VT ETF.
Absolute Returns?
Indeed.
Check out 2022 for example.
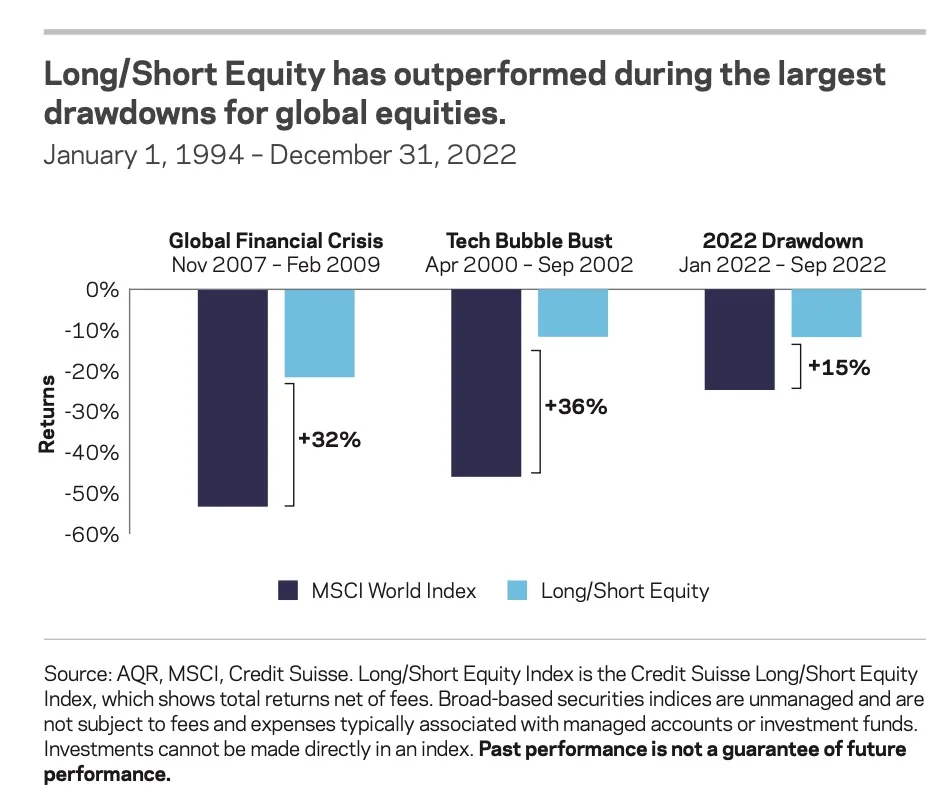
When long-only strategies were getting obliterated, QLEIX (on the other hand) was well above water.
Yup!
AQR Long-Short Equity Fund has offered investors higher risk adjusted rates of returns as indicated by its enhanced Sharpe Ratio, Sortino Ratio and Worst Year performance.
Lower Correlations?
Heck ya!
0.47 vs 0.97.
So it’s a convincing win across the board then?
Mmm-Hmm.
![]()
Tracking Error and Underperformance For Long-Short Equity Strategies
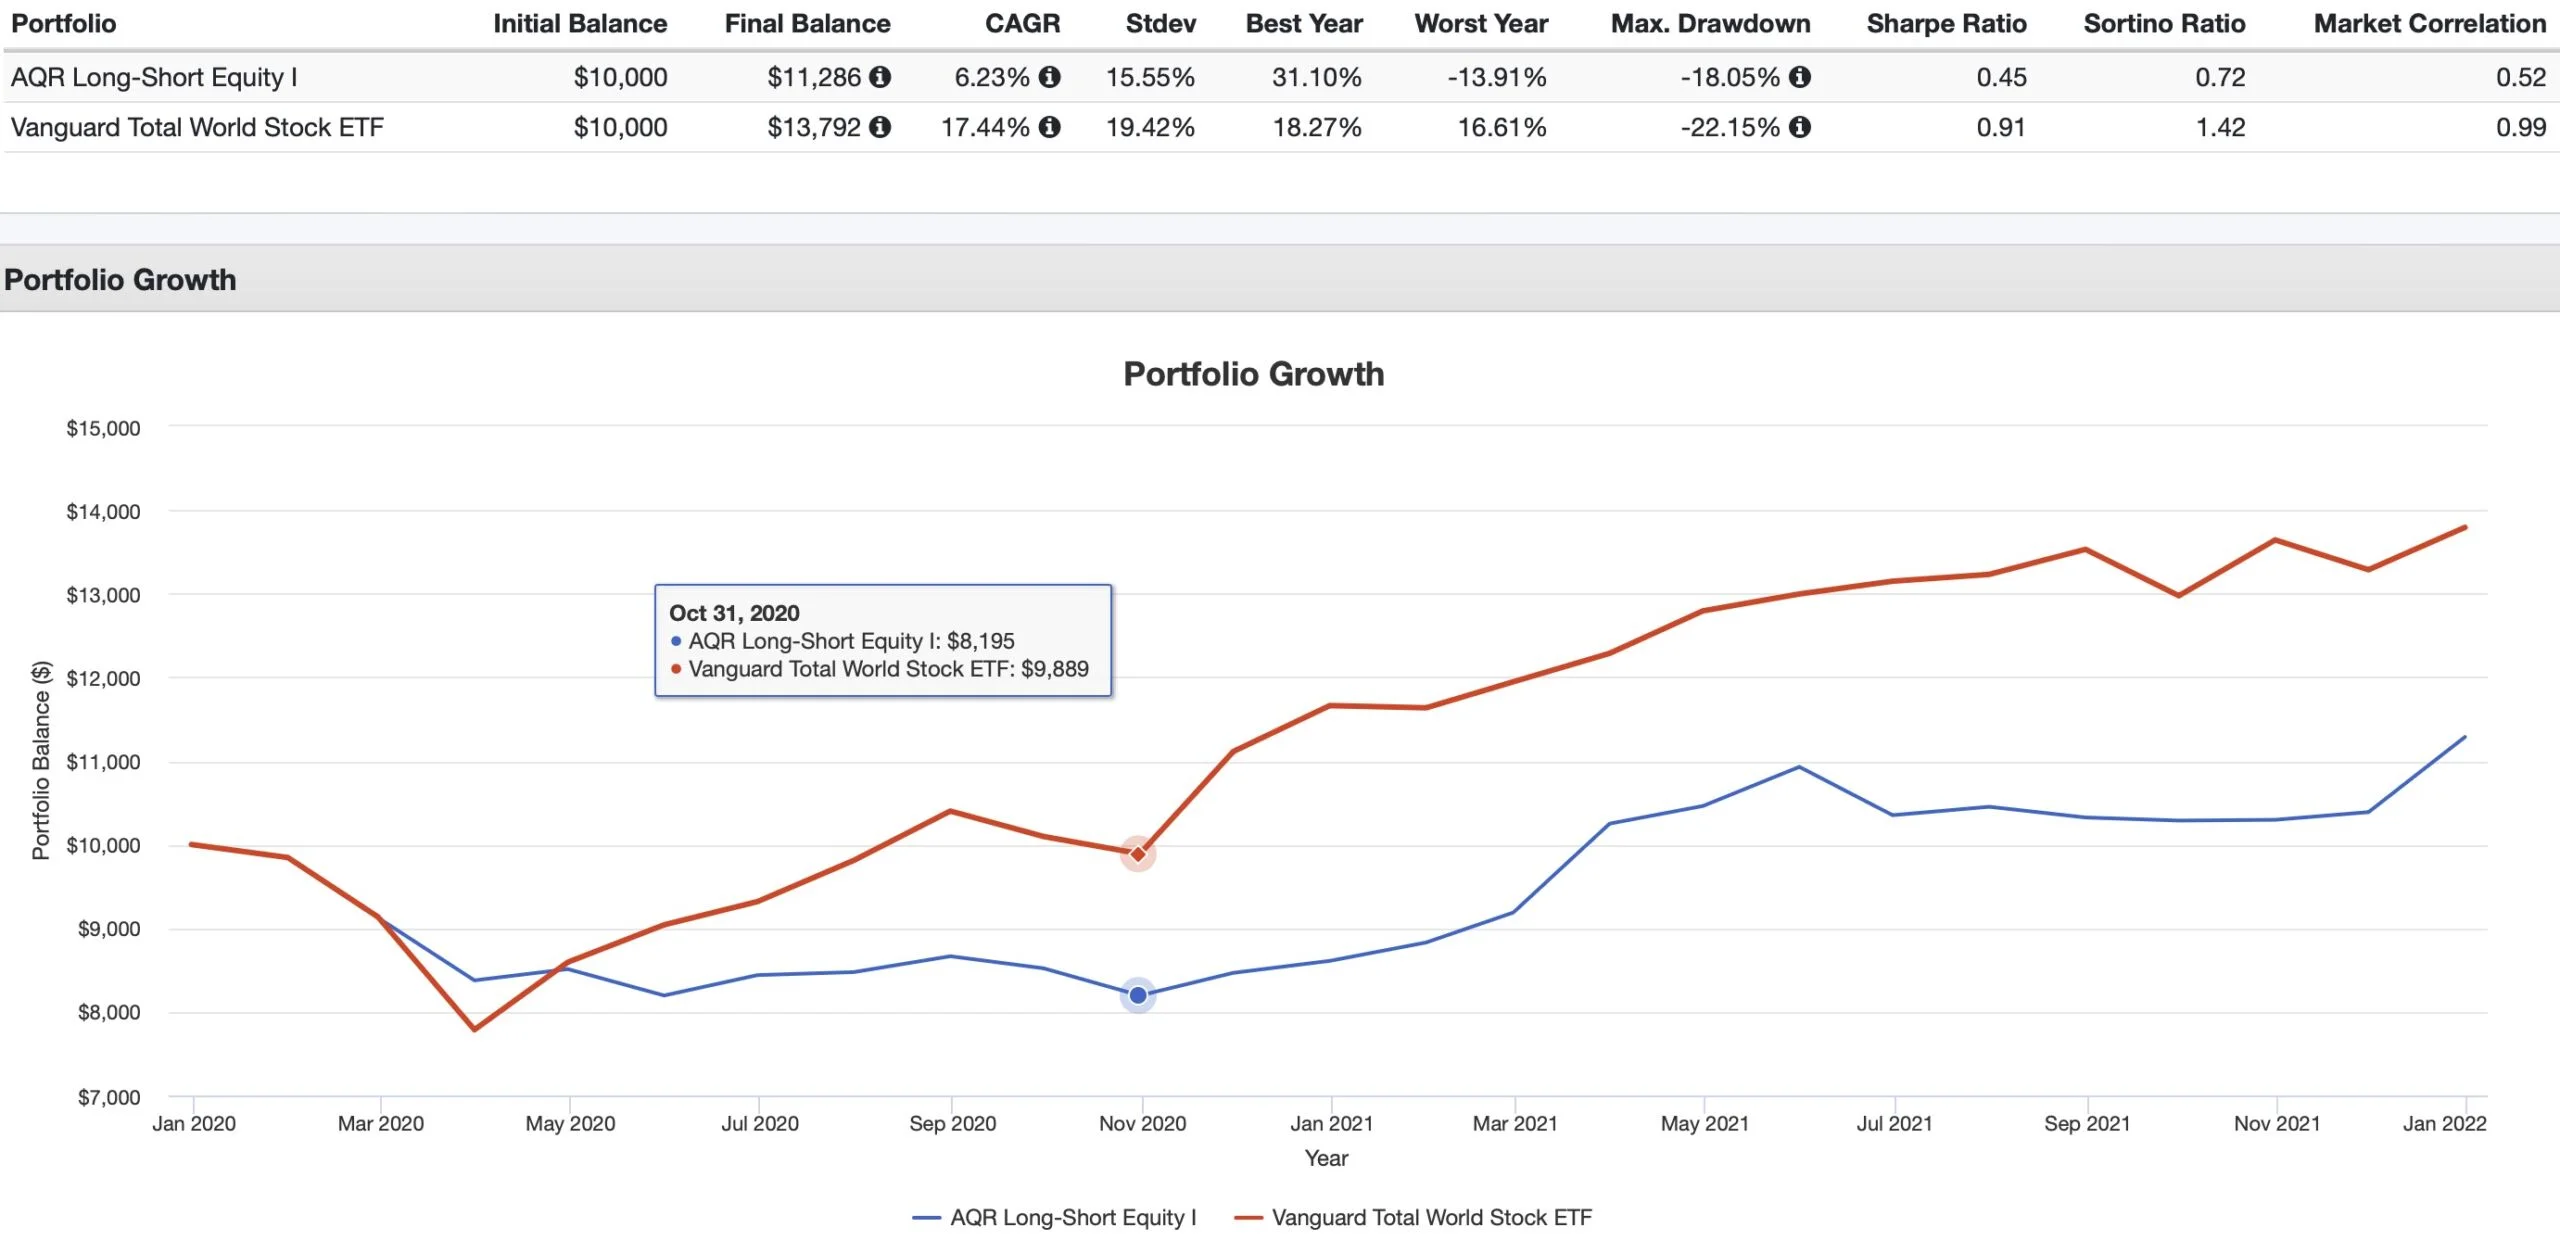
It’s not always easy committing to long-short equity strategies when viewing them as a single line item in your portfolio.
Consider the results of AQR Long-Short Equity Fund (QLEIX) versus Vanguard Total World Stock ETF (VT) from 2020 until the end of 2021.
When meme and growth stocks are soaring, a fund seeking attractive companies from a factor focused perspective will inevitably struggle.
Its tracking error is compounded by the short side of the equation.
Investors need to fully be prepared for economic regimes and conditions that aren’t favourable for this type of investing strategy.
Let’s explore some potential hypothetical results.
Long-Short Investing Scenarios: The Good, The Bad and The Ugly
How could we possibly do a review of long-short equity without a reference to the Clint Eastwood movie “The Good, The Bad and the Ugly”?
We’ll go over scenarios for when long-short strategies work well in upwards, downwards and sideways markets and when they also falter.
We’re going to use the following long-short configurations for each example:
140-40 = Active Extensions Long-Short Equity
120-50 = Typical Long-Short Equity
100-90 = Market-Neutral Long-Short Equity
And we’ll also just include the results if one was entirely long.
Upwards Market (L/S Winners)
Here the market conditions are positive and we’ve identified winners versus losers in a favourable manner.
Long = +15
Short = +10
140-40 = Active Extensions Long-Short Equity
(0.15 x 140) – (0.10 x 40) = 21 – 4 = +17
120-50 = Typical Long-Short Equity
(0.15 x 120) – (0.10 x 50) = 18 – 5 = +13
100-90 = Market-Neutral Long-Short Equity
(0.15 x 100) – (0.10 x 90) = 15 – 9 = +6
Our rankings would be as follows:
- 140-40 = +17
- Long Only = +15
- 120-50 = +13
- Market Neutral = +6
Upwards Market (L/S Losers)
Here the market conditions are positive but we’ve selected relative losers versus winners in terms of performance.
Long = +10
Short = +15
140-40 = Active Extensions Long-Short Equity
(0.10 x 140) – (0.15 x 40) = 14 – 6 = +8
120-50 = Typical Long-Short Equity
(0.10 x 120) – (0.15 x 50) = 12 – 7.5 = +4.5
100-90 = Market-Neutral Long-Short Equity
(0.10 x 100) – (0.15 x 90) = 10 – 13.5 = -3.5
Our rankings would be as follows:
- Long Only = +10
- 140-40 = +8
- 120-50 = +4.5
- Market Neutral = -3.5
Downwards Market (L/S Winners)
Here the market conditions are negative but we’ve picked stocks that relatively went down by less.
Long = -10
Short = -15
140-40 = Active Extensions Long-Short Equity
(-0.10 x 140) – (-0.15 x 40) = -14 – (-6) = -8
120-50 = Typical Long-Short Equity
(-0.10 x 120) – (-0.15 x 50) = -12 – (-7.5) = -4.5
100-90 = Market-Neutral Long-Short Equity
(-0.10 x 100) – (-0.15 x 90) = -10 – (-13.5) = +3.5
Our rankings would be as follows:
- Market Neutral = +3.5
- 120-50 = -4.5
- 140-40 = -8
- Long Only = -10
Downwards Market (L/S Losers)
Here the market conditions are negative and we’ve picked losings stocks to add insult to injury.
Long = -15
Short = -10
140-40 = Active Extensions Long-Short Equity
(-0.15 x 140) – (-0.10 x 40) = -21 – (-4) = -17
120-50 = Typical Long-Short Equity
(-0.15 x 120) – (-0.10 x 50) = -18 – (-5) = -13
100-90 = Market-Neutral Long-Short Equity
(-0.15 x 100) – (-0.10 x 90) = -15 – (-9) = -6
Our rankings would be as follows:
- Market Neutral = -6
- 120-50 = -13
- Long Only = -15
- 140-40 = -17
Crushing Win (L/S Winners)
Here we’ve selected winning stocks that were positive and identified losing stocks that were negative for a crushing relative win.
Long = +10
Short = -5
140-40 = Active Extensions Long-Short Equity
(0.10 x 140) – (-.05 x 40) = 14 – (-2) = +16
120-50 = Typical Long-Short Equity
(0.10 x 120) – (-0.05 x 50) = 12 – (-2.5) = +14.5
100-90 = Market-Neutral Long-Short Equity
(0.10 x 100) – (-0.05 x 90) = 10 – (-4.5) = +14.5
Our rankings would be as follows:
- 140-40 = +16
- Market Neutral = +14.5
- 120-50 = +14.5
- Long Only = +10
Crushing Defeat (L/S Losers)
Here we’ve selected losing stocks that were negative while our short picks were positive for a crushing relative defeat.
Long = -5
Short = +10
140-40 = Active Extensions Long-Short Equity
(-0.05 x 140) – (0.10 x 40) = (-7) – (+4) = -11
120-50 = Typical Long-Short Equity
(-0.05 x 120) – (0.10 x 50) = (-6) – (+5) = -11
100-90 = Market-Neutral Long-Short Equity
(-0.05 x 100) – (0.10 x 90) = (-5) – (+9) = -14
Our rankings would be as follows:
- Long Only = -5
- 120-50 = -11
- 140-40 = -11
- Market Neutral = -14
Long-Short Scenarios: Thoughts On The Results
I hope you found the results as fascinating as I did!
I think we can draw some clear conclusions.
Firstly, having a long-short manager who can identify relative winners and losers is crucial for the success of the strategy under any market regime (up, down or sideways).
Secondly, it should be crystal clear that long-short equity strategies (in all configurations) don’t thrive under every scenario.
They’ll struggle at times just like any other investing strategy.

Current AQR Long-Short Equity Fund (QLEIX) Exposures
Let’s examine AQR Long-Short Equity Fund (QLEIX) from a number of different exposures including country, sector and overall.
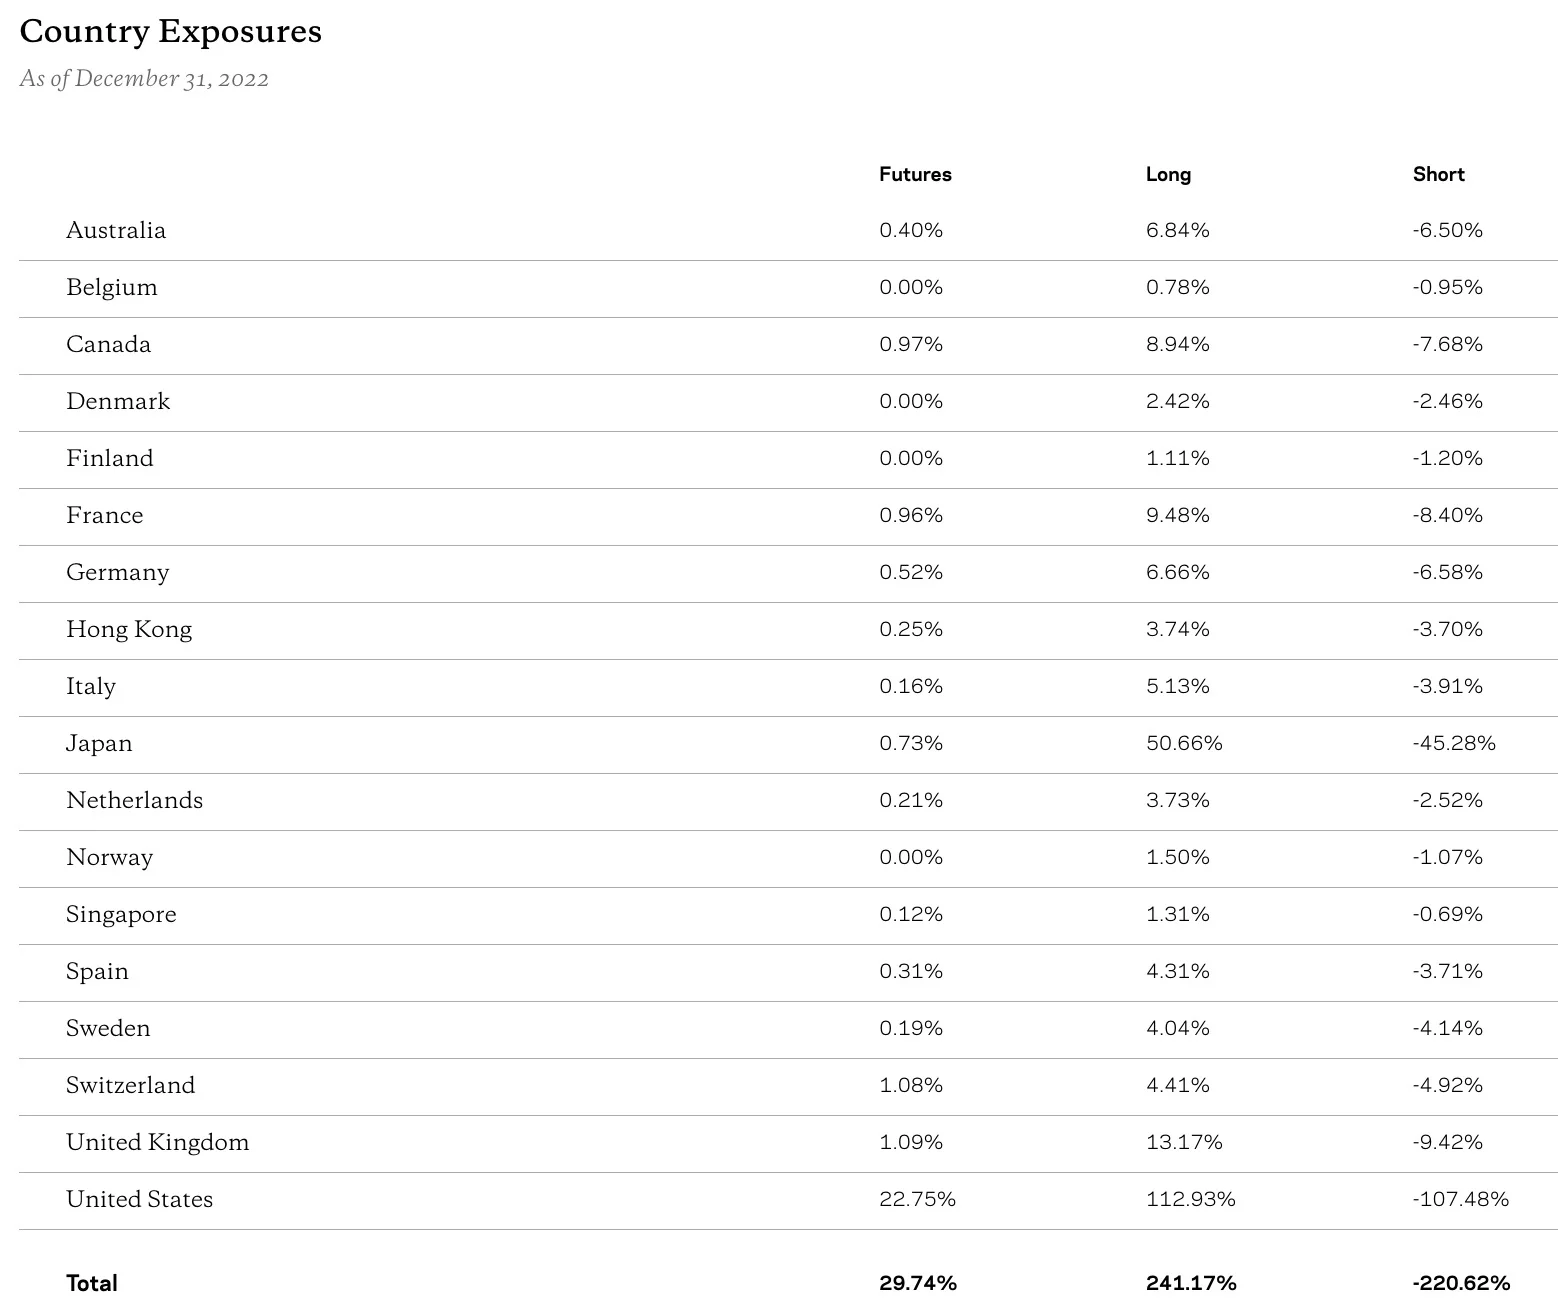
QLEIX spreads out nicely, from a diversification standpoint, with the US and Japan taking up its most resources from both a long-short perspective.
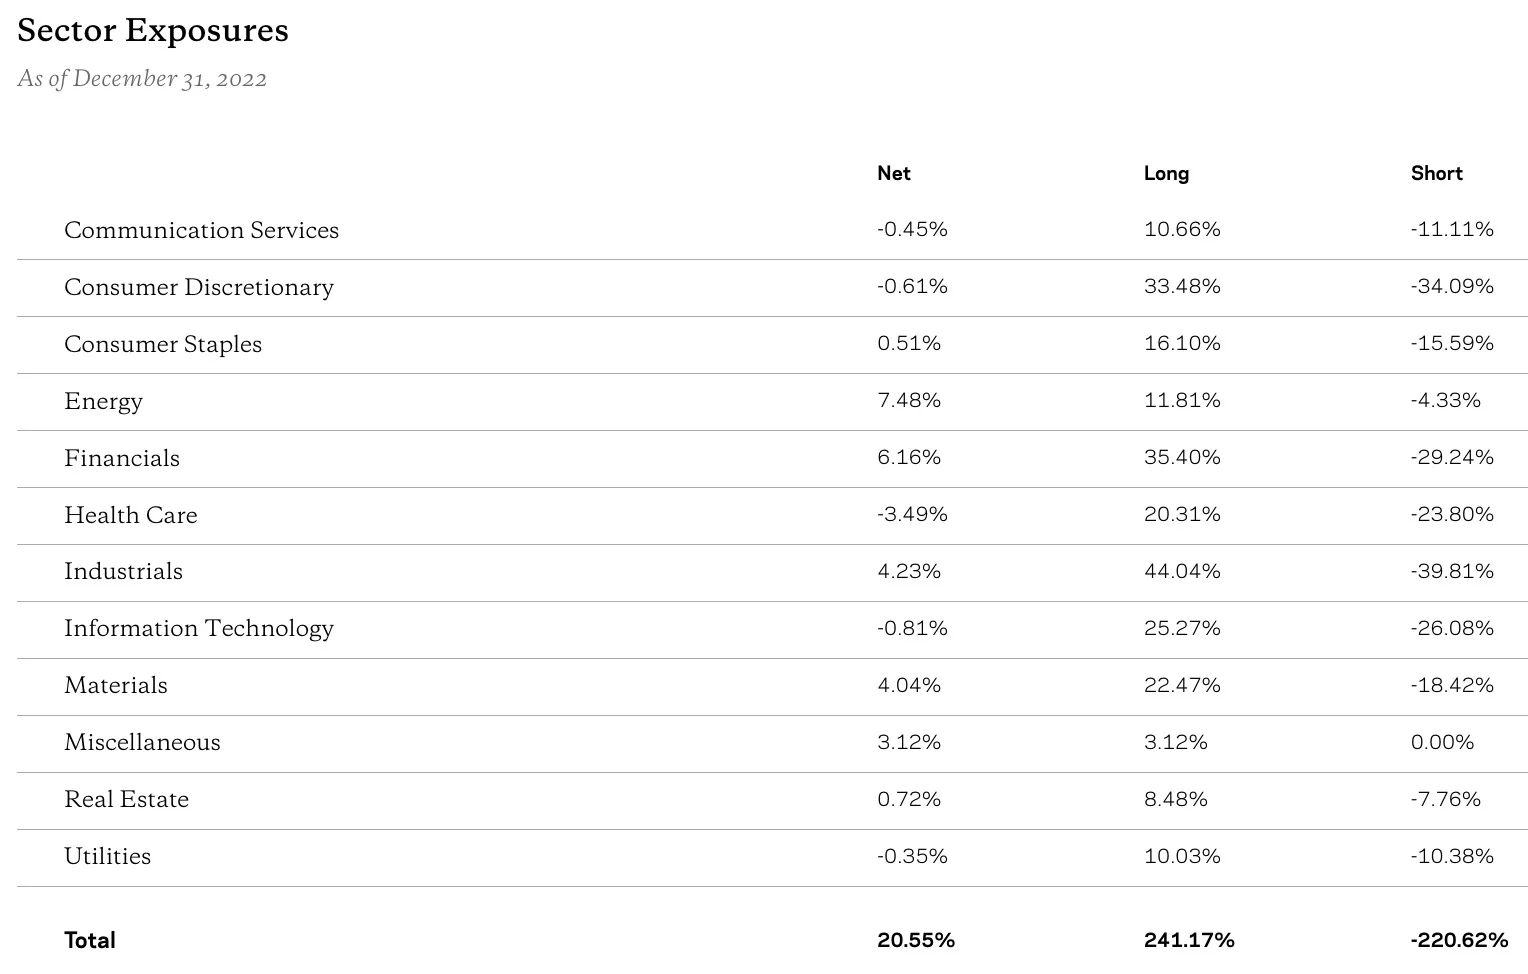
From a sector perspective the fund is NET positive for Energy, Financials and Industrials whereas it is NET negative with regards to Health Care, Information Technology and Consumer Discretionary to name just a few.

Long Holdings: 1078
Short Holdings: 1013
Long Exposure: 241.17%
Short Exposure: 220.62%
The fund is currently balanced nicely between its long and short positions (just over a 1000 for each) and it is currently positioned defensively with a NET exposure of just over 20%.

QLEIX Alternative Mutual Fund Review | AQR Long-Short Equity Fund Review
Hey guys! Here is the part where I mention I’m a travel blogger, vlogger and content creator! This investing opinion blog post ETF Review and Mutual Funds Review is entirely for entertainment purposes only. There could be considerable errors in the data I gathered. This is not financial advice. Do your own due diligence and research. Consult with a financial advisor.


AQR Capital Management: OG Alternative Investment Powerhouse
AQR Capital Management is in many regards the OG Alternative fund provider.
While other alternative mutual funds and ETFs have hit the marketplace in recent years, some of their original mandates are getting rather long in the tooth.
Let’s explore their complete roster of alternative funds.
AQR Complete Alternative Funds List
Single Strategy
AQR Diversified Arbitrage Fund – I: ADAIX / N: ADANX / R6: QDARX
AQR Equity Market Neutral Fund – I: QMNIX / N: QMNNX / R6: QMNRX
AQR Long-Short Equity Fund – I: QLEIX / N: QLENX / R6: QLERX
AQR Macro Opportunities Fund – I: QGMIX / N: QGMNX / R6: QGMRX
AQR Managed Futures Strategy Fund – I: AQMIX / N: AQMNX / R6: AQMRX
AQR Managed Futures Strategy HV Fund – I: QMHIX / N: QMHNX / R6: QMHRX
AQR Risk-Balanced Commodities Strategy Fund – I: ARCIX / N: ARCNX / R6: QRCRX
AQR Sustainable Long-Short Equity Carbon Aware Fund – I: QNZIX / N: QNZNX / R6: QNZRX
Multi-Strategy
AQR Alternative Risk Premia Fund – I: QRPIX / N: QRPNX / R6: QRPRX
AQR Diversifying Strategies Fund – I: QDSIX / N: QDSNX / R6: QDSRX
AQR Style Premia Alternative Fund – I: QSPIX / N: QSPNX / R6: QSPRX
AQR Multi-Asset Fund – I: AQRIX / N: AQRNX / R6: AQRRX
AQR Long-Short Equity Fund Overview, Holdings and Info
The investment case for “AQR Long-Short Equity Fund” has been laid out succinctly by the folks over at AQR: (source: fund landing page)
Investment Objective
“Seeks capital appreciation.”
Seeking Equity-Like Returns with Less Risk
“The Long-Short Equity Fund seeks to generate returns by buying, or going long, stocks expected to perform relatively well, and selling, or going short, stocks expected to perform relatively poorly.”
Investment Approach
“The Fund seeks to deliver positive returns by taking long and short positions in equity and equity-related instruments that are deemed to be relatively attractive or unattractive, respectively, based on AQR’s investment models.
The Fund is designed to have a net long exposure to the equity markets. The portfolio is constructed based on AQR’s global stock selection and asset allocation models, employing value, momentum, quality, and other proprietary factors to indicate which industries, sectors and companies are conditionally attractive or unattractive.
Reasons to Invest:
“The Fund seeks to provide higher risk-adjusted returns with lower volatility compared to global equity markets.
Three Return Sources:
- Market-neutral, long/short and stock selection portfolio
- Passive exposure to global equity markets
- Tactical tilts to the Fund’s equity market exposure”
Why Invest in the Long-Short Equity Fund?
Seeks Attractive Total Returns
“Investing systematically, the Fund seeks to generate attractive returns through two sources: the spread between long and short equity positions and a net long exposure to equity markets. The Fund seeks to provide higher risk-adjusted returns with lower volatility compared to global equity markets.”
Seeks Less Downside Risk
“Because the Fund is “net long” equities, it is managed to experience positive returns impact when the stock market is up and negative returns impact when the market is down. However, the Fund seeks to have a reduced sensitivity to equity markets which means that it may have the propensity to better weather difficult periods when the market declines.”
Portfolio Diversification
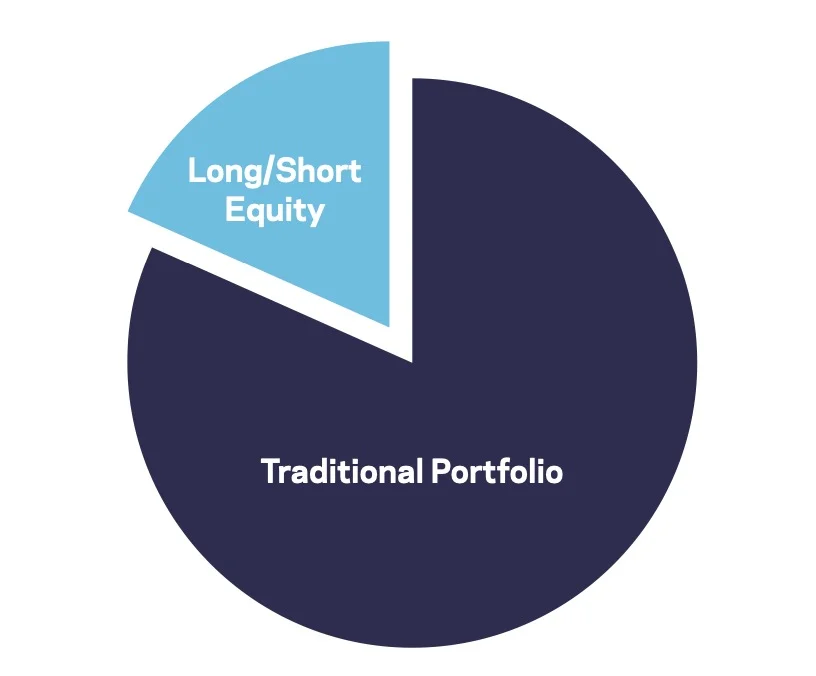
“The Fund invests both long and short stocks, spanning many industries and geographic regions. When added to a traditional portfolio allocation, this differentiated approach might provide diversification benefits which can lead to a “smoother ride” over time.”
Potential Advantages:
Innovative Approach
“The Fund’s approach seeks to explicitly separate the return of market exposure (“beta”) from the true “alpha” of long and short stock selection.”
Transparency and Risk Control
“Transparent separation of alpha, beta, and beta variation enables the Adviser to manage the risk contribution of each return source to the overall portfolio.”
Portfolio Diversification
“Sources of potential excess returns are well diversified across themes and geographies, potentially leading to higher risk-adjusted returns.”
Academic Research Foundation
“Decades of academic and practitioner research have shown that investing in stocks based on value, momentum and quality may provide returns in excess of market benchmarks.”
Experienced Management Team
AQR’s core investment and research team has been working together and managing complex hedge fund strategies since the early 1990s.

AQR Long-Short Equity Fund: Principal Investment Strategy
To better understand the process of how the fund operates, let’s turn our attention towards the prospectus where I’ve summarized the key points at the very bottom (source: summary prospectus).
Principal Investment Strategies of the Fund
1) the potential gains from its long-short equity positions, 2) overall exposure to equity markets, and 3) the tactical variation of its net exposure to equity markets.
The Fund seeks to provide higher risk-adjusted returns with lower volatility compared to global equity markets.
Under normal market conditions, the Fund pursues its investment objective by investing at least 80% of its net assets (including borrowings for investment purposes) in equity instruments and equity related and/or derivative instruments.
Equity instruments include common stock, preferred stock, depositary receipts and shares or interests in real estate investment trusts (“REITs”) or REIT-like entities (“Equity Instruments”).
Equity related and/or derivative instruments are investments that provide exposure to the performance of equity instruments, including equity swaps (both single-name and index swaps), equity index futures and exchange-traded funds and similar pooled investment vehicles (collectively, “Equity Derivative Instruments” and together with Equity Instruments, “Instruments”).
In managing the Fund, the Adviser takes long positions in those Instruments that, based on proprietary quantitative models, the Adviser forecasts to be undervalued and likely to increase in price, and takes short positions in those Instruments that the Adviser forecasts to be overvalued and likely to decrease in price.
The Fund may invest in or have exposure to companies of any size. The Fund has no geographic limits on where it may invest.
The Fund will generally invest in instruments of companies located in global developed markets, including the United States.
As of the date of this prospectus, the Adviser considers global developed markets to be those countries included in the MSCI World Index.
The Fund does not limit its investments to any one country and may invest in any one country without limit.
The Adviser uses a set of value, momentum, quality and other economic indicators to generate an investment portfolio based on the Adviser’s global security selection and asset allocation models.
• Value indicators identify investments that appear cheap based on fundamental measures. Examples of value indicators include using price-to-earnings and price-to-book ratios for choosing individual equities.
• Momentum indicators identify investments showing signs of improvement, whether based on prices or fundamentals. Examples of momentum indicators include simple price momentum for choosing individual equities based on strong recent performance.
• Quality indicators identify stable companies in good business health, including those with strong profitability and stable earnings.
• Sentiment indicators identify companies favored by high-conviction investors or companies whose management is acting in shareholder-friendly ways.
• In addition to these indicators, the Adviser may use a number of additional indicators based on the Adviser’s proprietary research. The Adviser may add or modify the economic indicators employed in selecting portfolio holdings from time to time.
Applying these indicators, the Adviser takes long or short positions in sectors, industries and companies that it believes are attractive or unattractive.
In the aggregate the Fund expects to have net long exposure to the equity markets, which the Adviser may adjust over time.
When the Adviser determines that market conditions are unfavorable, the Fund may reduce its long market exposure.
Similarly, when the Adviser determines that market conditions are favorable, the Fund may increase its long market exposure.
The Fund is not designed to be market-neutral.
The Adviser will use a tactical allocation overlay to manage the Fund’s beta exposure to broad global markets through the use of Equity Derivative Instruments and foreign currency forwards.
TheAdviser, on average, intends to target a portfolio beta of 0.5. The Adviser expects that the Fund’s target beta will typically range from 0.3 to 0.7.
Beyond the volatility associated with the Fund’s long-term market beta target, the Adviser, on average, will target an additional (i.e., active) annualized average, long-term volatility level for the Fund of 4-9%.
While this active annualized volatility level is expected to be targeted over the long run, the Adviser may, on occasion tactically target a level of volatility outside of this range.
Given these two sources of volatility (i.e., the market volatility associated with the Fund’s market beta target and the Fund’s additional active security selection volatility target) and given there is no precise way to predict the market volatility over any particular period, the total volatility of the Fund is expected to be higher, potentially significantly higher, than the 4-9% active volatility target.
Actual or realized volatility experienced by the Fund can and will differ from the forecasted or target volatility described above.
The Fund may, but is not required to, hedge exposure to foreign currencies using foreign currency forwards or futures.
The Fund, when taking a long equity position, will purchase a security that will benefit from an increase in the price of that security.
When taking a short equity position, the Fund borrows the security from a third party and sells it at the then current market price.
A short equity position will benefit from a decrease in price of the security and will lose value if the price of the security increases.
Similarly, the Fund also takes long and short positions in Equity Derivative Instruments.
A long position in an Equity Derivative Instrument will benefit from an increase in the price of the underlying instrument.
A short position in an Equity Derivative Instrument will benefit from a decrease in the price of the underlying instrument and will lose value if the price of the underlying instrument increases.
Simultaneously engaging in long investing and short selling is designed to reduce the net exposure of the overall portfolio to general market movements.
The Fund uses Equity Derivative Instruments and foreign currency forwards as a substitute for investing in conventional securities and for investment purposes to increase its economic exposure to a particular security, index or currency in a cost-effective manner.
At times, the Fund may gain all equity or currency exposure through the use of Equity Derivative Instruments and currency derivative instruments, and may invest in such instruments without limitation.
The Fund’s use of Equity Derivative Instruments and currency derivative instruments will have the economic effect of financial leverage.
Financial leverage magnifies exposure to the swings in prices of an asset underlying an Equity Derivative Instrument or currency derivative instrument and results in increased volatility, which means the Fund will have the potential for greater gains, as well as the potential for greater losses, than if the Fund did not use Equity Derivative Instruments and currency derivative instruments that have a leveraging effect.
For example, if the Adviser seeks to gain enhanced exposure to a specific asset through an Equity Derivative Instrument providing leveraged exposure to the asset and that Equity Derivative Instrument increases in value, the gain to the Fund will be magnified.
If that investment decreases in value, however, the loss to the Fund will be magnified. A decline in the Fund’s assets due to losses magnified by the Equity Derivative Instruments providing leveraged exposure may require the Fund to liquidate portfolio positions to satisfy its obligations or to meet redemption requests when it may not be advantageous to do so.
There is no assurance that the Fund’s use of Equity Derivative Instruments providing enhanced exposure will enable the Fund to achieve its investment objective.
A significant portion of the Fund’s assets may be held in cash or cash equivalents including, but not limited to, money market instruments, U.S. treasury bills, interests in short-term investment funds or shares of money market or short-term bond funds.
These cash or cash equivalent holdings serve as collateral for the positions the Fund takes and also earn income for the Fund.
When taking into account derivative instruments and instruments with a maturity of one year or less at the time of acquisition, the Fund is expected to have annual turnover of approximately 250% to 500%, although actual portfolio turnover may be higher or lower and will be affected by market conditions.
This estimated annual portfolio turnover rate is based on the expected regular turnover resulting from the Fund’s implementation of its investment strategy, and does not take into account turnover that may occur as a result of purchases and redemptions into and out of the Fund’s portfolio.”
AQR Long-Short Equity Fund Investment Strategy Key Points
- 3 Different Sources Of Returns: 1) gains from long-short equity positions, 2) exposure to equity markets, 3) tactical variations of its net exposure to equity markets
- Fund’s Overall Goal: Seeks higher risk-adjusted returns with lower volatility compared to global equity markets
- Equity Exposure: Equity Swaps, Equity Index Futures and ETF funds and pooled Equity Derivative Instruments
- Go Anywhere Anytime Approach: Exposure to companies of any size with no geographic limits on where it may invest
- Fund Universe: Global Developed Markets
- Indicators: Value + Momentum + Quality + Sentiment
- Value indicators: Investments that are cheap based on fundamental measures (Ex: P/E, P/B)
- Momentum indicators: Investments showing signs of improvement based on prices or fundamentals (Ex: simple price moment)
- Quality indicators: Stable companies in good business health – strong profitability and stable earnings
- Sentiment indicators: Companies favored by high-conviction investors or those acting in shareholder-friendly ways
- Market Conditions: Can increase its long-position when conditions appear favourable and decrease when unfavourable
- Targets: Overall Portfolio Beta: 0.5 with 0.3 to 0.7 range & Active Volatility Target of 4 to 9%
- Annual Turnover: The fund is expected to have annual turnover of approximately 250 to 500%
AQR Long-Short Equity Fund Info
Tickers: QLEIX (Class I) / QLENX (Class N) / QLERX (Class R6)
Adjusted Expense Ratio: 1.32 (Class I)
AUM: 601 Million
Inception: 07/16/2013

AQR Long-Short Equity Fund Pros and Cons
Let’s move on to examine the potential pros and cons of AQR Long-Short Equity Fund (QLEIX).
QLEIX Pros
- Long-Short Equity Strategies have the potential for greater risk adjusted rates of returns than long-only equity
- QLEIX has outperformed a passive Global Equity fund such as VT ETF with better volatility management
- Lower correlations with markets for an added diversification benefit to your equity and/or alternative sleeve
- The potential for positive absolute returns in a downwards market
- A versatile puzzle piece that has the potential to be a core holding or satellite diversifier
- Pairs well with other adaptive strategies such as Managed Futures and Global Macro
- Higher conviction overall gross exposure in terms of both long and short positions compared to most other L/S equity funds
- Reasonable management fee for an alternative long-short equity fund
- AQR is a specialist in alternative funds
QLEIX Pros
- Tracking error versus major market equity indexes requires investors be patient during certain unfavourable market regimes
- Higher management fees that what passive investors would be used to paying

AQR Long-Short Equity Fund Model Portfolio
These asset allocation ideas and model portfolios presented herein are purely for entertainment purposes only. This is NOT investment advice. These models are hypothetical and are intended to provide general information about potential ways to organize a portfolio based on theoretical scenarios and assumptions. They do not take into account the investment objectives, financial situation/goals, risk tolerance and/or specific needs of any particular individual.
Let’s assemble a simple four fund portfolio utilizing only AQR funds with AQR Long-Short Equity QLEIX as the focal point.
30% QLEIX – AQR Long-Short Equity
30% AUEIX – AQR Large Cap Defensive Style
30% QGMIX – AQR Macro Opportunities
10% ADAIX – AQR Diversified Arbitrage
Overall, we have the following exposures to four distinct strategies:
- Defensive Equity
- Long-Short Equity
- Adaptive Macro Strategies
- Diversified Arbitrage
Let’s see how that does against the traditional 60/40 balanced portfolio.
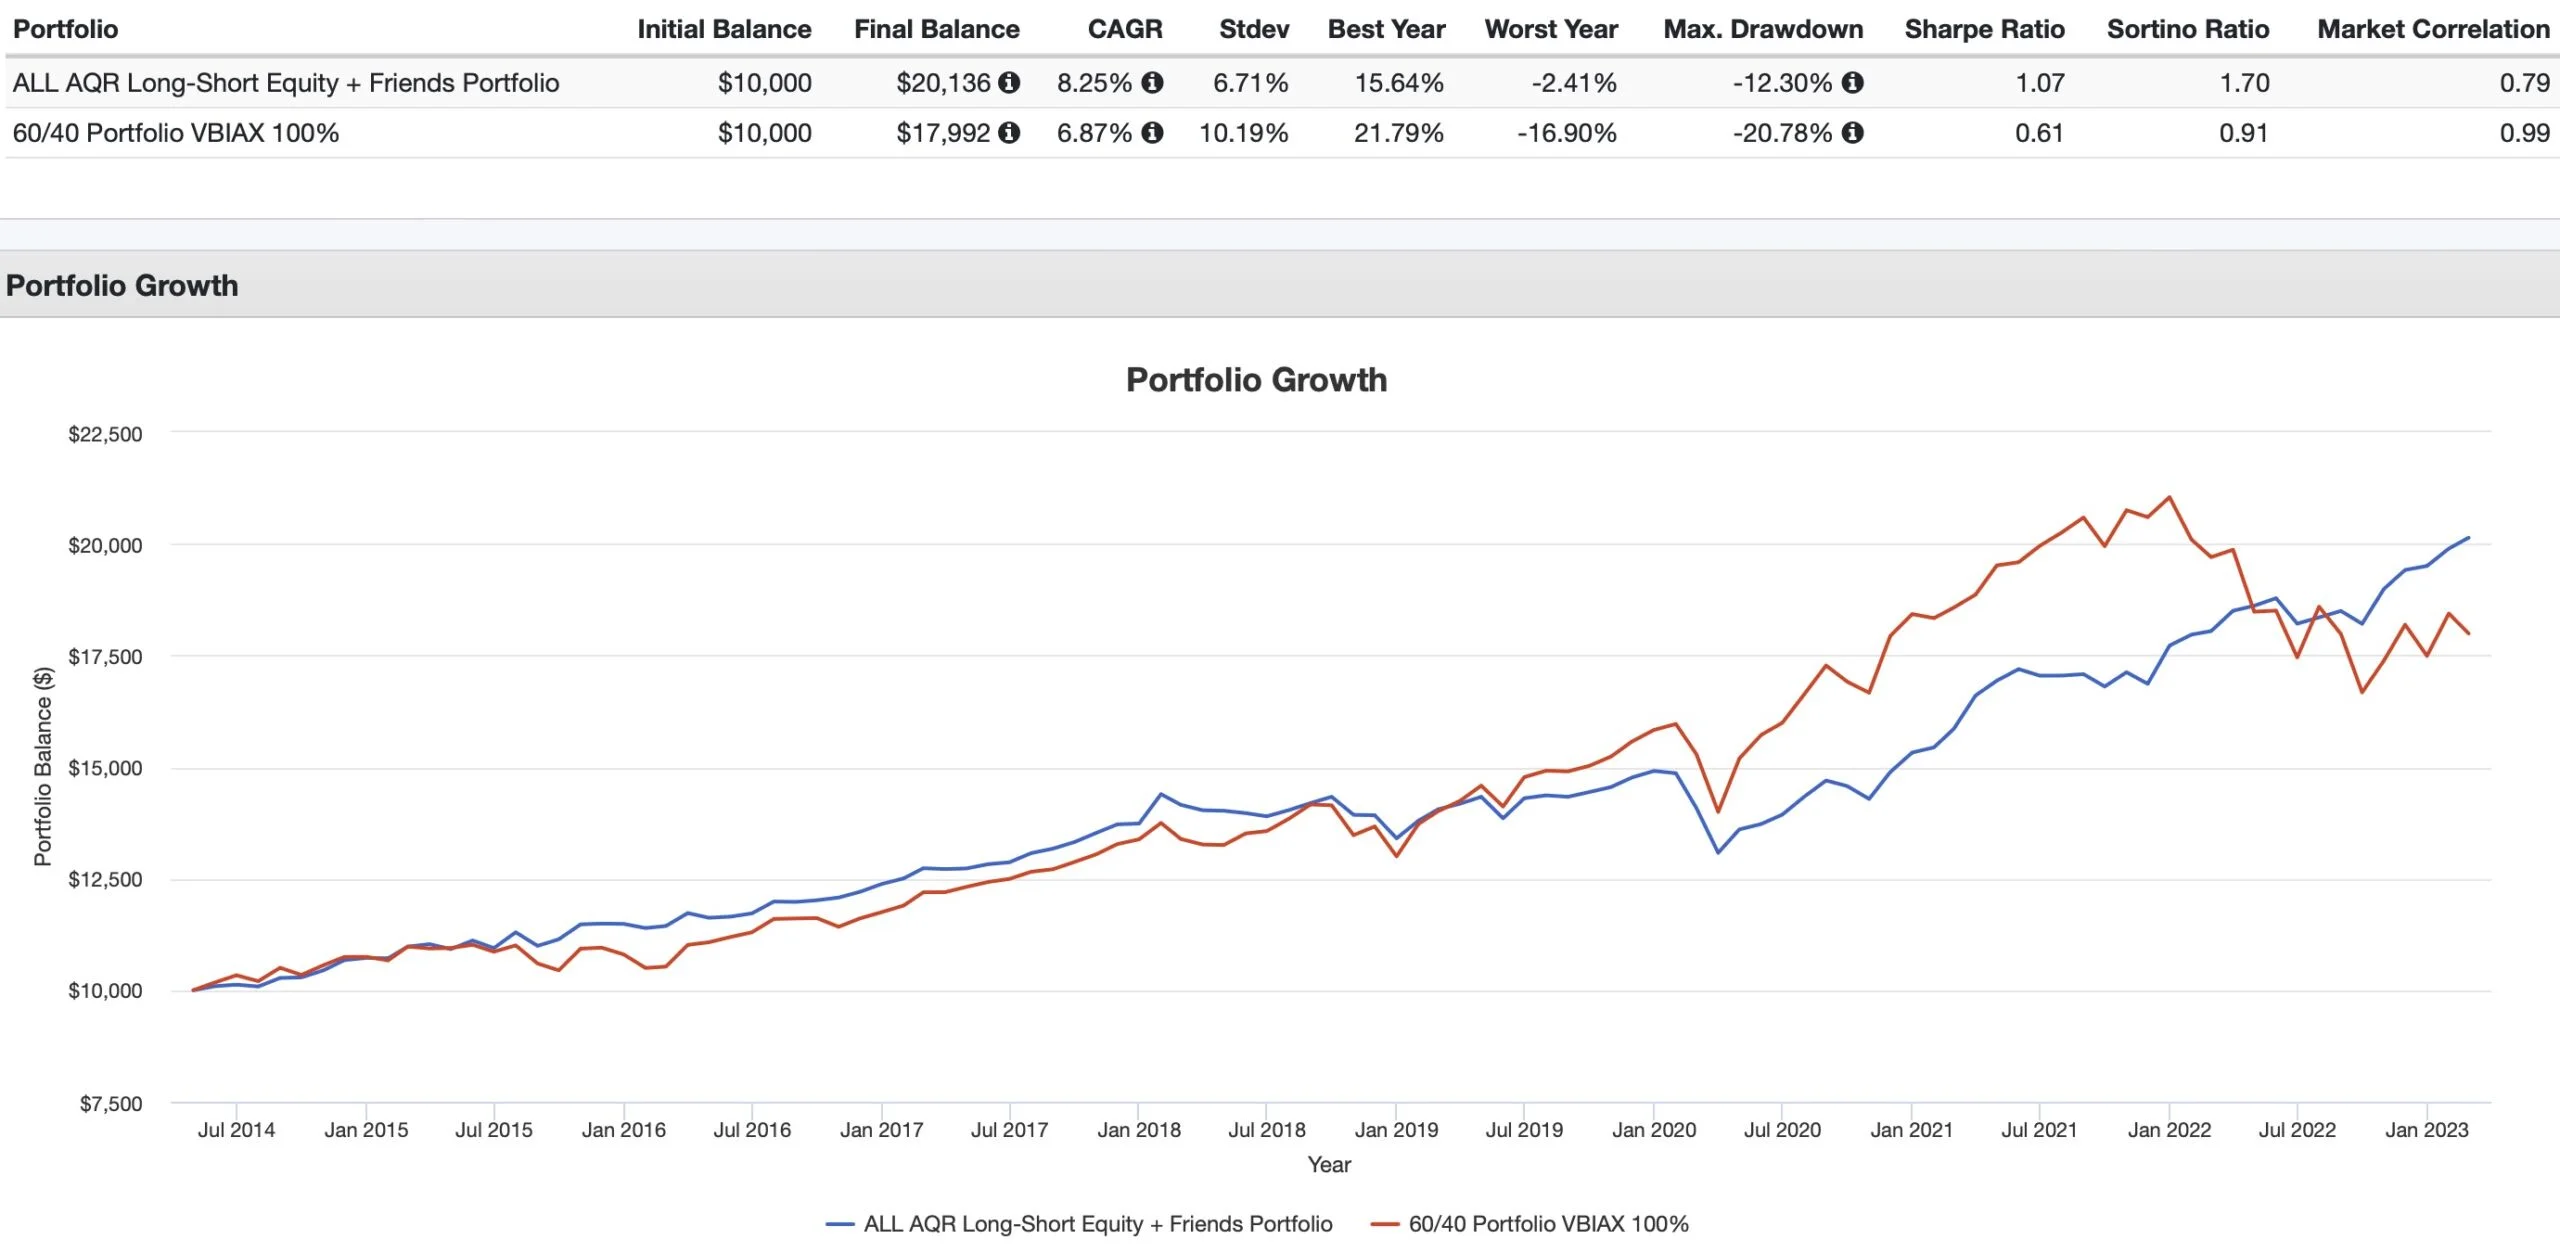
ALL AQR QLEIX Fund + Friends Portfolio vs 60/40 Portfolio (VBIAX)
CAGR: 8.25% vs 6.87%
RISK: 6.71% vs 10.19%
BEST YEAR: 15.64% vs 21.79%
WORST YEAR: -2.41% vs -16.90%
MAX DRAWDOWN: -12.30% vs -20.78%
SHARPE RATIO: 1.07 vs 0.61
SORTINO RATIO: 1.70 vs 0.91
MARKET CORRELATION: 0.79 vs 0.99
Our All AQR Portfolio featuring AQR Long-Short Equity Fund (QLEIX) as the centrepiece produces a triumphant win over the milquetoast 60/40 Portfolio (VBIAX) from a risk management meets returns standpoints.
Let’s start with returns where we’re 138 basis points ahead of the industry standard portfolio with a CAGR of 8.25% vs 6.87%.
From purely a Risk Management perspective we’re vastly superior with enhanced standard deviation, worst year and maximum drawdown.
Hence, it should come as no surprise that our risk adjusted rates of returns are vastly superior as well as indicated by massive upgrades in Sharpe Ratio and Sortino Ratio versus the 60/40 portfolio.
Thus, it’s the 4 fund AQR portfolio for the win all day every day!
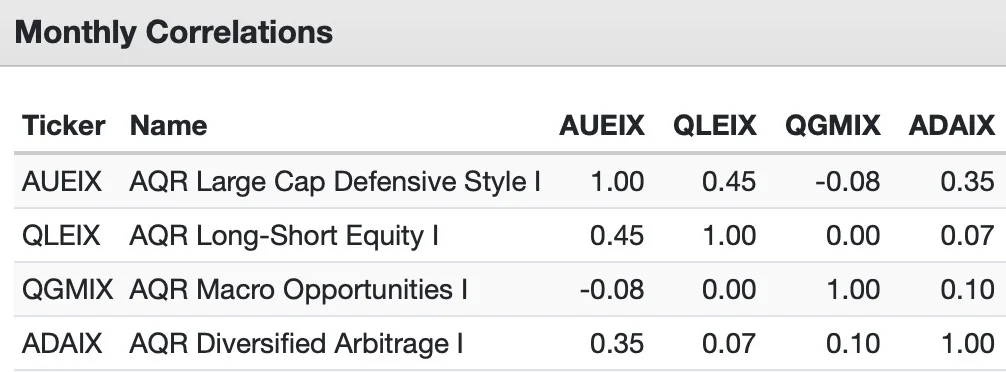
Finally, we’ll examine overall correlations between AQR strategies:

Nomadic Samuel Final Thoughts
Reviewing AQR’s roster of alternative funds has been one of the most fun and challenging projects I’ve taken on lately.
It’s allowed me to grow more as an investors but it hasn’t been an entirely easy process.
Firstly, I’m learning on the fly with regards to some of these alternative strategies.
Secondly, I’m afflicted with a slight tinge of envy given that I’m not able to purchase them as a Canadian investor.
I’m more than just a little bit impressed with AQR Long-Short Equity Fund.
I prefer to expand the canvas of my portfolio with capital efficient exposure to traditional asset classes.
And instead of adding long-only factor focused equities to the equation I prefer long-short equity strategies which offer lower correlations and overall greater diversification benefits.
Hence, I’d love to add QLEIX to the current ensemble of L/S Equity strategies that I’m currently rolling with.
But that’s not possible.
Anyhow, at this point in the review I’d like to turn things over to you.
What do you think of Long-Short Equity investing strategies?
And more specifically what’s your opinion on AQR Long-Short Equity Fund?
Is it on your radar?
Please let me know in the comments below.
That’s all I’ve got for today.
Ciao for now.
Important Information
Comprehensive Investment Disclaimer:
All content provided on this website (including but not limited to portfolio ideas, fund analyses, investment strategies, commentary on market conditions, and discussions regarding leverage) is strictly for educational, informational, and illustrative purposes only. The information does not constitute financial, investment, tax, accounting, or legal advice. Opinions, strategies, and ideas presented herein represent personal perspectives, are based on independent research and publicly available information, and do not necessarily reflect the views or official positions of any third-party organizations, institutions, or affiliates.
Investing in financial markets inherently carries substantial risks, including but not limited to market volatility, economic uncertainties, geopolitical developments, and liquidity risks. You must be fully aware that there is always the potential for partial or total loss of your principal investment. Additionally, the use of leverage or leveraged financial products significantly increases risk exposure by amplifying both potential gains and potential losses, and thus is not appropriate or advisable for all investors. Using leverage may result in losing more than your initial invested capital, incurring margin calls, experiencing substantial interest costs, or suffering severe financial distress.
Past performance indicators, including historical data, backtesting results, and hypothetical scenarios, should never be viewed as guarantees or reliable predictions of future performance. Any examples provided are purely hypothetical and intended only for illustration purposes. Performance benchmarks, such as market indexes mentioned on this site, are theoretical and are not directly investable. While diligent efforts are made to provide accurate and current information, “Picture Perfect Portfolios” does not warrant, represent, or guarantee the accuracy, completeness, or timeliness of any information provided. Errors, inaccuracies, or outdated information may exist.
Users of this website are strongly encouraged to independently verify all information, conduct comprehensive research and due diligence, and engage with qualified financial, investment, tax, or legal professionals before making any investment or financial decisions. The responsibility for making informed investment decisions rests entirely with the individual. “Picture Perfect Portfolios” explicitly disclaims all liability for any direct, indirect, incidental, special, consequential, or other losses or damages incurred, financial or otherwise, arising out of reliance upon, or use of, any content or information presented on this website.
By accessing, reading, and utilizing the content on this website, you expressly acknowledge, understand, accept, and agree to abide by these terms and conditions. Please consult the full and detailed disclaimer available elsewhere on this website for further clarification and additional important disclosures. Read the complete disclaimer here.


Awesome post. A couple of questions.
A lot of these Mutual Funds have a very minimum investment, 1 million+. How do you get around that?
Also can you do a review of KRBN?
If you check every broker possible lots of times you can find ones that will have a much smaller minimum than advertised by the company that runs them. I don’t have any of these so I can’t tell you which specifically from experience. But I did find BLNDX with like a $500 minimum from memory on firstrade, and MAFIX at etrade with a small minimum. They both have high minimums at most other brokers.
most of them have no minimum if you are accessing them through an financial advisor or qualify as an accredited investor.
5 Million min investment on my fidelity account. Any alternatives? Love $FIG $DIVO and money market in the meantime…
QLEIX available at Interactive Brokers with a $1000 minimum. Didn’t know that until recently.