In an industry that is ultra competitive and supersaturated with mutual funds and ETFs it’s no wonder that many funds don’t survive long-term.Even funds with a great long-term strategy often cannot survive an unfortunate sequence of returns upon being dropped into the sizzling frying pan.
It’s brutal out there.
However, the fund we’re reviewing today is one of the ultimate rare exceptions.
Its existence dates back to 1967!
The fund is actively managed in an environment now dominated by passive indexing.

It started off as a contrarian value fund but since 1990 has flipped style box sides with a focused growth mandate under the helm of Portfolio Manager Will Danoff.
The mutual fund I’m referring to is Fidelity Contrafund.
Ticker FCNTX.
It’s hands down one of the most successful actively managed mutual funds with 98.2 Billion AUM.
In fact, it’s just one of the most successful funds in general.
It’s beaten the tar out of the S&P 500 since as far back as I’m able to backtest it on Portfolio Visualizer.
Consider the following:

Fidelity Contrafund Performance
Fidelity Contrafund vs Vanguard 500 Index Investor Performance (1985-2022)

All tax considerations aside, a hypothetical $10,000 invested in the S&P 500 would now be worth an impressive $514,017.
However, if you were to have put that same $10,000 in Fidelity Contrafund and did nothing but get out of the way, you’d be a millionaire enjoying $1,100,481.
Let’s examine things a bit more in detail.
CAGR: 13.17% vs 10.92%
RISK: 15.35% vs 15.34%
MAX DRAWDOWN: -46.34% vs -50.97%
SHARPE RATIO: 0.69 vs 0.55
SORTINO RATIO: 1.02 vs 0.80
MARKET CORRELATION: 0.93 vs 0.99

Since 1985, the Fidelity Contrafund has outperformed the S&P 500 by an impressive 225 basis points (CAGR: 13.17% vs 10.92%) with the same level of volatility.
Hence, it’s offered investors a higher rate of risk adjusted returns (SHARPE: 0.69 vs 0.55) with less market correlation (0.93 vs 0.99).
Now the first thing critics are likely pondering is whether or not most of this outperformance came in the 20th century?
How has Contrafund fared in the 21st century versus the S&P 500?
Let’s find out.
FCNTX vs VFINX Performance Summary (2000-2022)
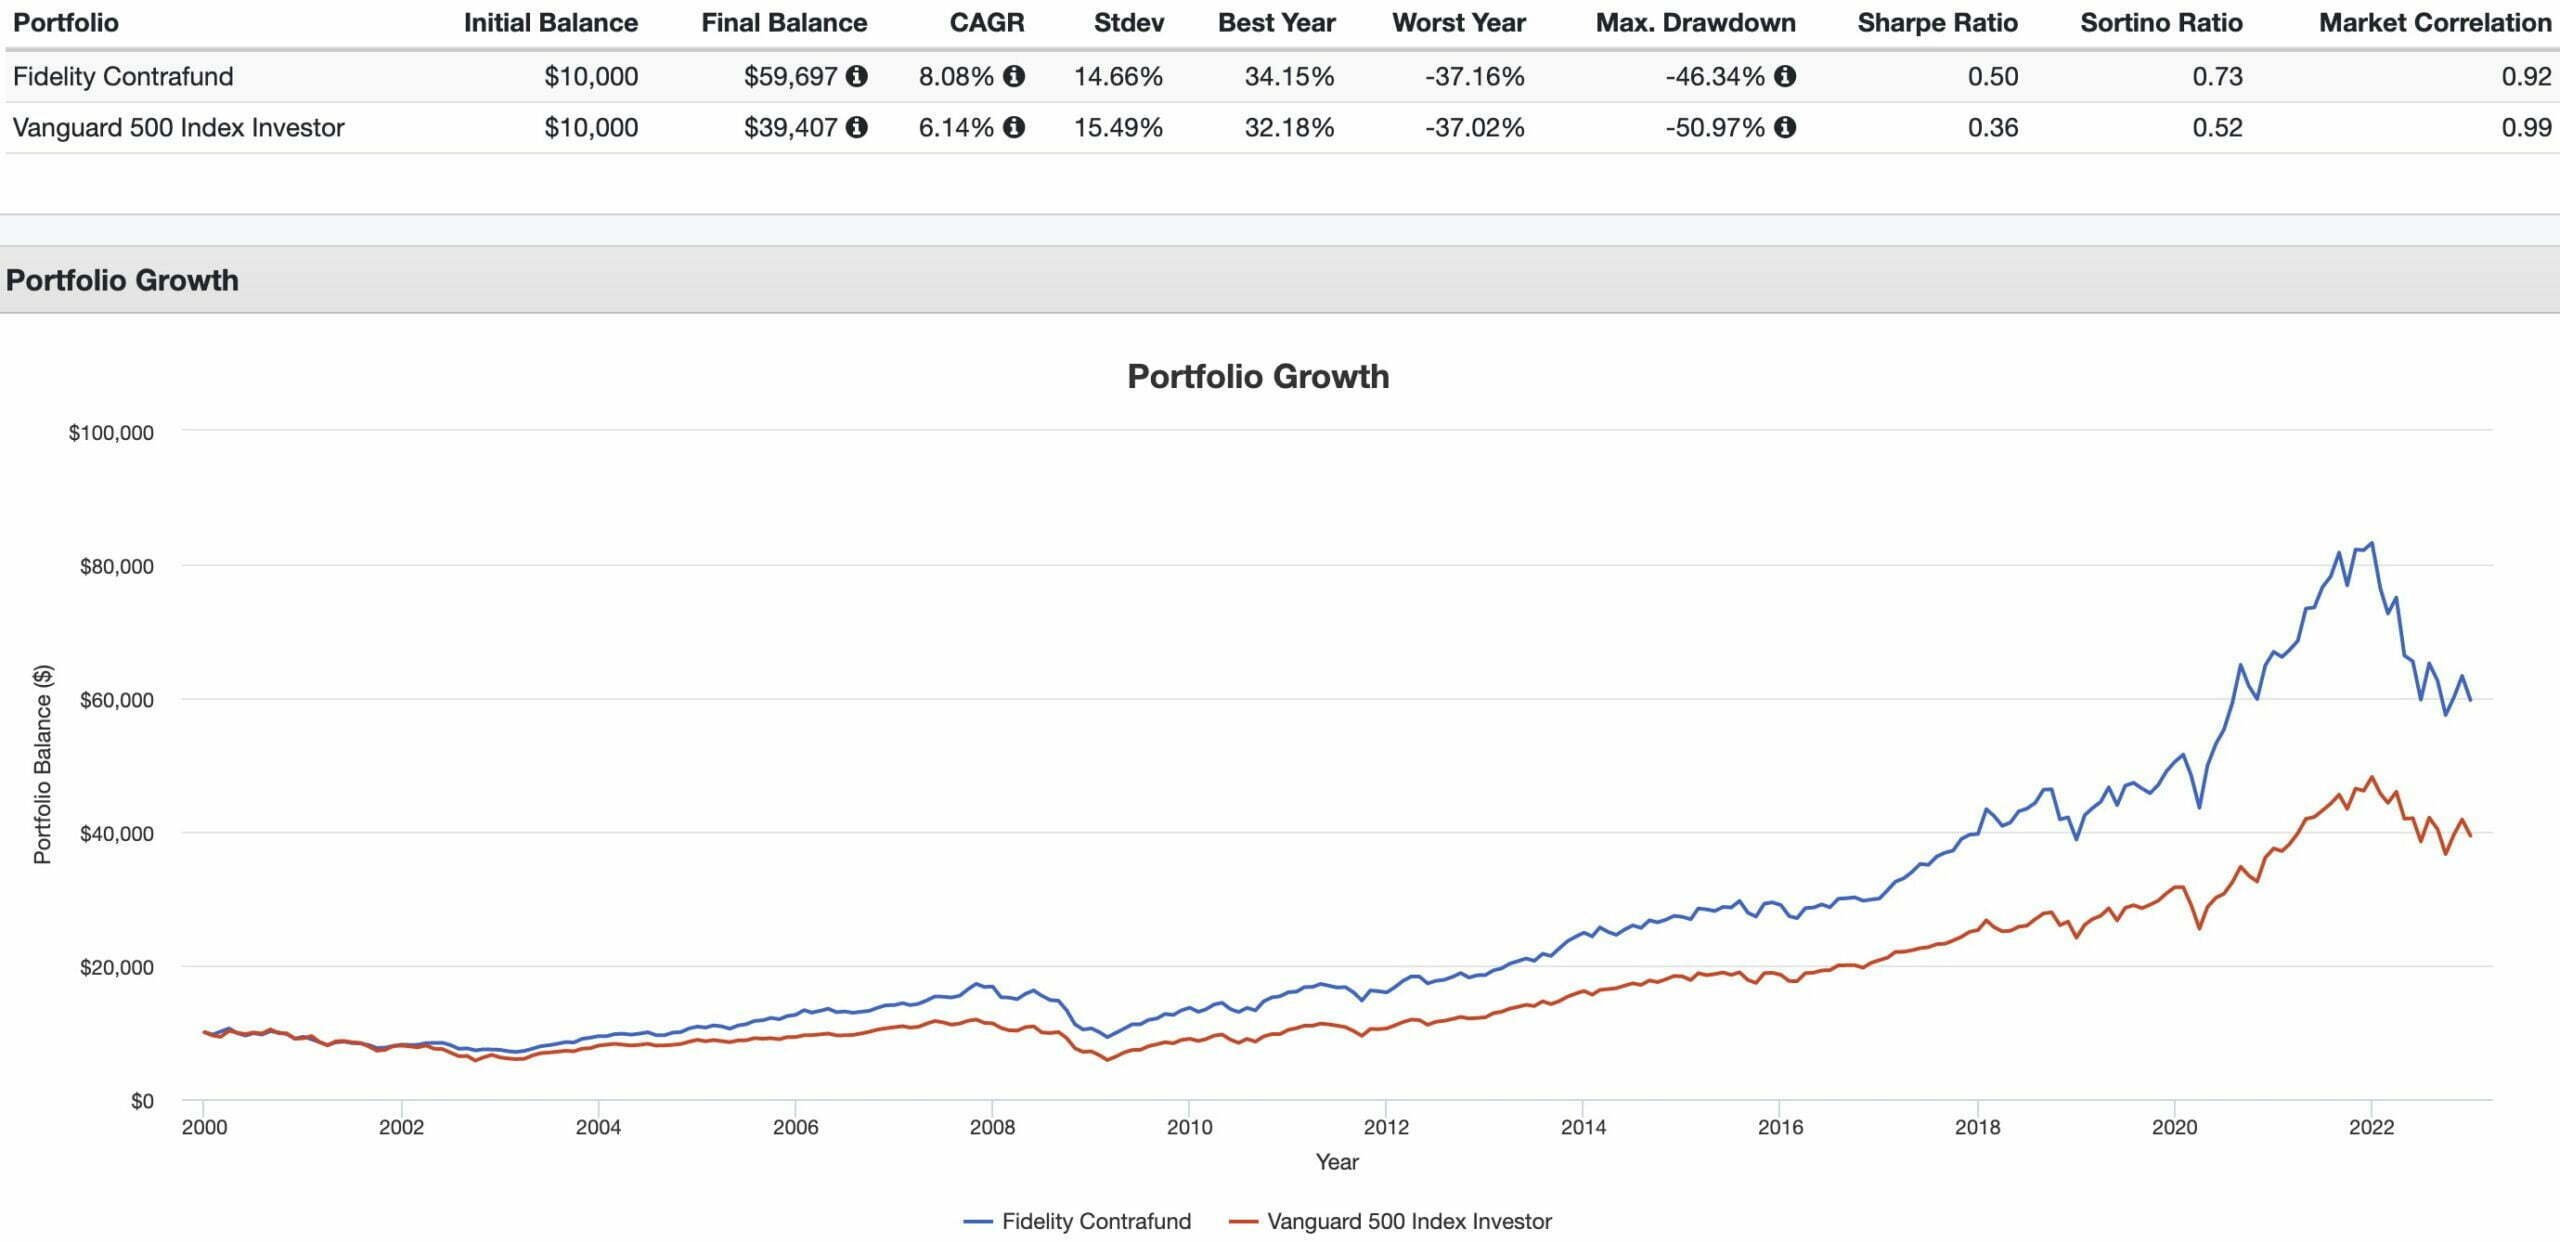
It’s just been more of the same.
Fidelity Contrafund reigning supreme over Vanguard 500 Index Investor in every way imaginable under the sun.
CAGR: 8.08% vs 6.14%
RISK: 14.66% vs 15.49%
MAX DRAWDOWN: -46.34% vs -50.97%
SHARPE RATIO: 0.50 vs 0.36
SORTINO RATIO: 0.73 vs 0.52
MARKET CORRELATION: 0.92 vs 0.99
Noteworthy, is that Fidelity Contrafund not only outperformed the S&P 500 by 194 basis points (CAGR: 8.08% vs 6.14%) but it did so by managing risk better overall (stdev: 14.66% vs 15.49%).
Hence, it has offered patient investors convincing Sharpe Ratio (0.50 vs 0.36) and Sortino Ratio (0.73 vs 0.52) victories along with less market correlation (0.92 vs 0.99).
It’s easy to see why Fidelity Contrafund has not only survived but instead thrived!
I’m well aware that most actively managed funds underperform index funds when examining net returns after fees.
However, we’re not interested in shining the spotlight upon losers over here at Picture Perfect Portfolios.
Today, we’re reviewing one of the most successful mutual funds of all time.

FCNTX Review: Is Fidelity Contrafund The Best Actively Managed Mutual Fund Ever Created?

Hey guys! Here is the part where I mention I’m a travel blogger, vlogger and content creator! This investing opinion blog post ETF Review is entirely for entertainment purposes only. There could be considerable errors in the data I gathered. This is not financial advice. Do your own due diligence and research. Consult with a financial advisor.

Fidelity Investments: Popular Active Asset Manager
Fidelity is one of the largest multi-national asset providers in the world based out of Boston.
They have a large roster of funds including some of the oldest actively managed mutual funds.

Actively Managed Fidelity Funds

Here is a sample of some of the actively managed mutual funds offered by Fidelity.
Two in particular are famous for distinct reasons.
The Fidelity Fund is one of the oldest mutual funds with an inception date of April 30th, 1933!
Whereas the Fidelity Magellan Fund was once managed by legendary Peter Lynch who from 1977 until 1990 averaged a 29.2% annual return.
FFIDX Mutual Fund – Fidelity Fund
FDVLX Mutual Fund – Fidelity Value Fund
FPURX Mutual Fund – Fidelity Puritan Fund
FLPSX Mutual Fund – Fidelity Low-Priced Stock Fund
FMAGX Mutual Fund – Fidelity Magellan Fund
FDVLX Mutual Fund – Fidelity Value Fund
FIGRX Mutual Fund – Fidelity International Discovery Fund
FOSFX Mutual Fund – Fidelity Overseas Fund
FFIDX Mutual Fund – Fidelity Fund

The Case For Active Management
The case for active management versus a passive index approach isn’t an argument many funds can win long-term.
The truth is that the odds are stacked against you once you consider returns net of fees.
However, we’re not examining the case of a normal fund over here.
This fund is anything but average.
Firstly, it has been in existence longer than the first passive index fund.
Secondly, it has proven consistently that it is capable of outperforming the S&P 500 both in the 20th and 21st century.
Hence, I’m not trying to suggest that the average actively managed fund is going to outperform index funds.
What I’m suggesting is the scenario where exceptional actively managed funds which have delivered alpha in the past have the potential to do so in the future.

History Of Fidelity Contrafund: 1967 until 2022
Normally, I don’t review the history of a fund but I’m making an exception here given its fascinating back-story.
Fidelity Contrafund’s name is tied specifically to its original mandate from 1967: (source: Wikipedia)
“The fund’s mission was to take a contrarian view, investing in out-of-favor stocks or sectors.”
However, it changed its mandate in 1990 by flipping from the left hand side of the style box over to the right by becoming a growth fund.
It has one of the longest tenured managers in Will Danoff who has successfully handled the fund since 1990.
In terms of its impressive accomplishments, it is second to only AGTHX (Growth Fund Of America) in terms of being the largest active mutual fund managed by an individual.
source: Bloomberg Markets and Finance on YouTube

Will Danoff: Successful Fund Manager
I thoroughly enjoyed researching the career of Will Danoff as fund manager of Fidelity Contrafund.
He made a 30 year reflection video in 2020 which you can view here.
Some of the key points he mentions in the video are as follows:
- Credits the great research team at Fidelity with a long-term vision that is client focused
- Mentioned having had a chance to work with Peter Lynch and others led to the concept that as a fund manager you have to look everywhere to find the very best ideas
- Find companies generating superior returns while paying a fair price for them
- Believes now is a great time to be an active manager because of the ability to invest outside of the index and to find smaller companies
- The past is a guidepost to the future with an opportunity to embrace innovation and new entrepreneurs/companies

Fidelity Contrafund Overview, Holdings and Info
The investment case for “Fidelity Contrafund ” has been laid out succinctly by the folks over at Fidelity: (source: fund landing page)
“Investment Approach:
- Fidelity® Contrafund® is an opportunistic, diversified equity strategy with a large-cap growth bias.
- Philosophically, we believe stock prices follow companies’ earnings, and those companies that can deliver durable multiyear earnings growth provide attractive investment opportunities.
- As a result, our investment approach seeks firms we believe are poised for sustained, above-average earnings growth that is not accurately reflected in the stocks’ current valuation.
- In particular, we emphasize companies with “best of breed” qualities, including those with a strong competitive position, high returns on capital, solid free-cash-flow generation and management teams that are stewards of shareholder capital.
- We strive to uncover these investment opportunities through in-depth bottom-up, fundamental analysis, working in concert with Fidelity’s global research team.”

Fidelity Contrafund: Security Selection Process
To better understand the process of how the fund operates, let’s turn our attention towards the prospectus where I’ve highlighted what I feel are the most salient parts and summarized the key points at the very bottom. (source: summary prospectus)
“Principal Investment Strategies:
The Adviser normally invests the fund’s assets primarily in common stocks.
The Adviser invests the fund’s assets in securities of companies whose value it believes is not fully recognized by the public.
The types of companies in which the fund may invest include companies experiencing positive fundamental change, such as a new management team or product launch, a significant cost-cutting initiative, a merger or acquisition, or a reduction in industry capacity that should lead to improved pricing; companies whose earnings potential has increased or is expected to increase more than generally perceived; companies that have enjoyed recent market popularity but which appear to have fallen temporarily out of favor for reasons that are considered non-recurring or short-term; and companies that are undervalued in relation to securities of other companies in the same industry.
The Adviser may invest the fund’s assets in securities of foreign issuers in addition to securities of domestic issuers.
The Adviser is not constrained by any particular investment style.
At any given time, the Adviser may tend to buy “growth” stocks or “value” stocks, or a combination of both types.
In buying and selling securities for the fund, the Adviser relies on fundamental analysis, which involves a bottom-up assessment of a company’s potential for success in light of factors including its financial condition, earnings outlook, strategy, management, industry position, and economic and market conditions.
If the Adviser’s strategies do not work as intended, the fund may not achieve its objective.”

Fidelity Contrafund Investment Strategy Key Points
- Invests in companies whose value is not fully recognized by the public
- Specifically seeks companies with the following characteristics:
A) Positive fundamental change
B) Earnings potential to increase beyond what is generally perceived
C) Recently market popularity
D) Undervalued relative to industry peers - Unconstrained Investment Style (domestic focus but can go abroad)
- Can buy Growth, Value or both types of stocks
- Relies on Bottom-up Fundamental Analysis (financial condition, earnings outlook, strategy, etc)
Fidelity Contrafund: Holdings
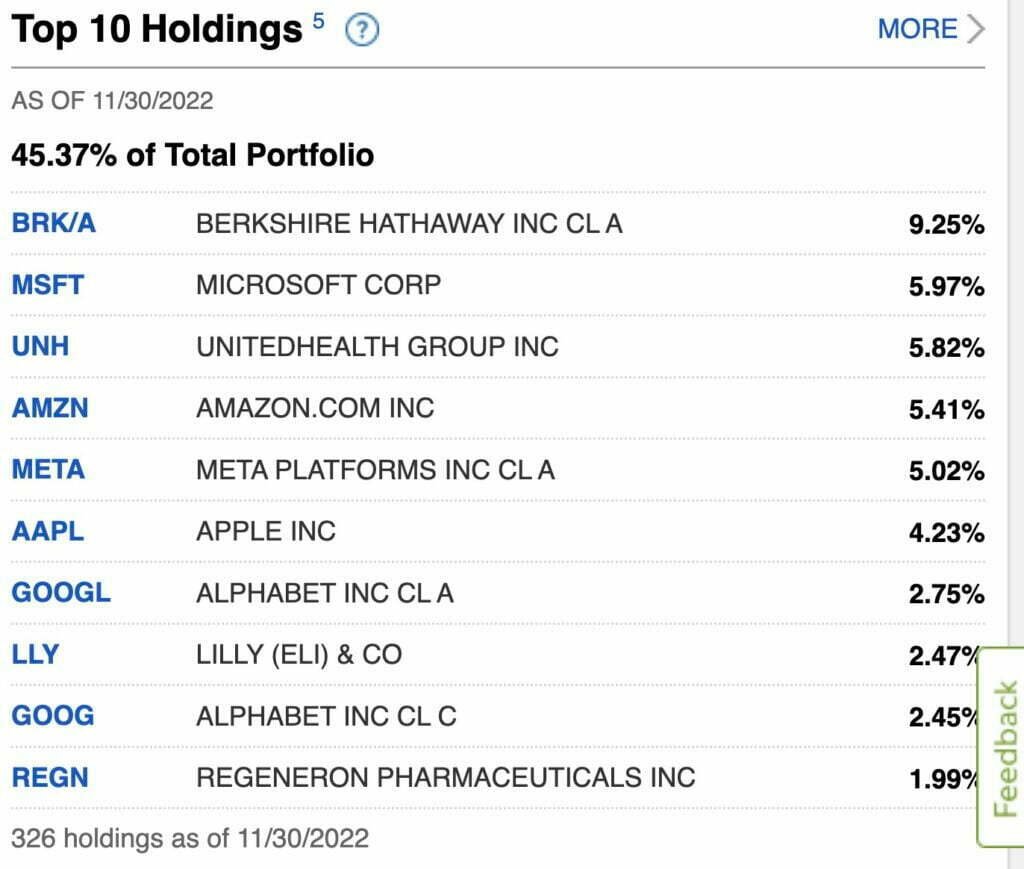
The Fidelity Contrafund isn’t shy about a high conviction strategy for its top 10 positions which take up 45.37% of its overall real estate.
Berkshire Hathaway and Microsoft Corporation take up the top two slots with Meta, Google and Apple taking up space in the top 10 holdings.
Fidelity Contrafund: Sector Exposure
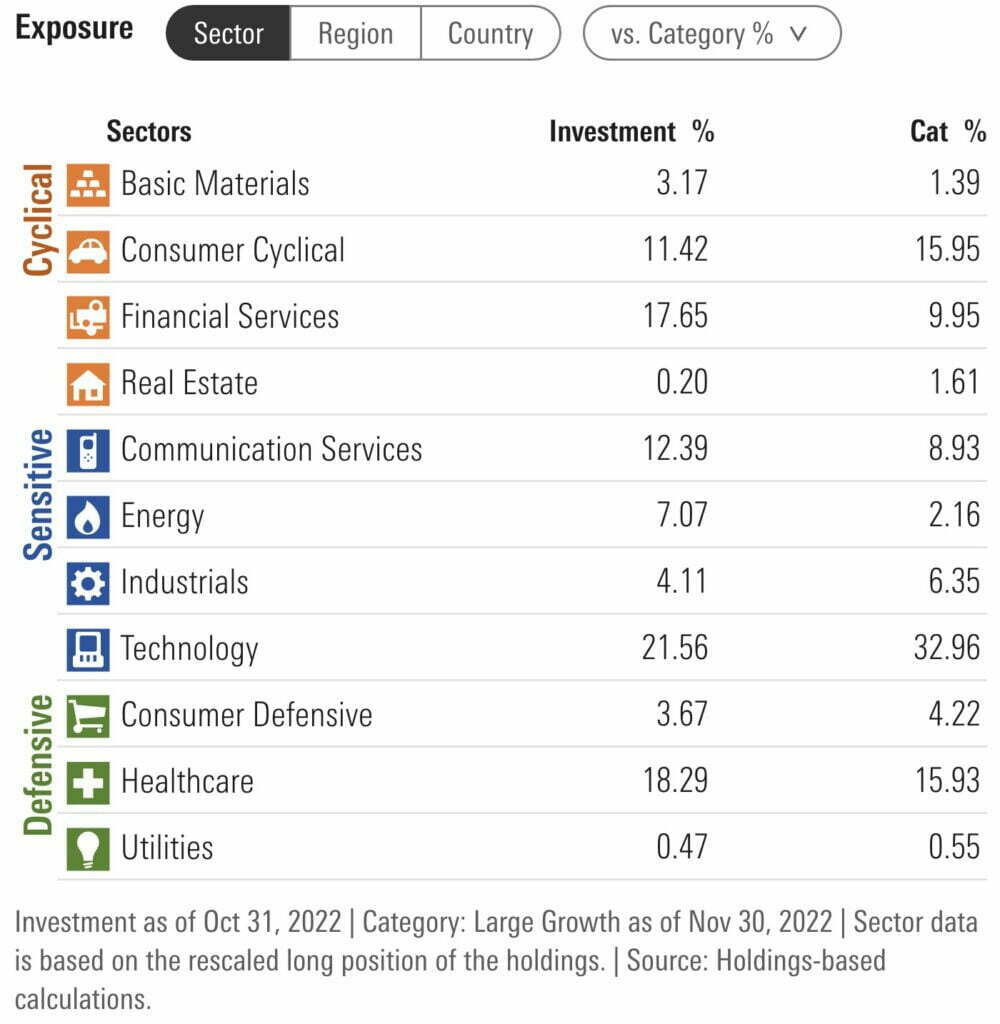
Fidelity Contrafund spreads out nicely from a broad sector perspective.
Compared to Large Cap Growth category averages it is overweight Financial Services, Communication Services, Energy and Healthcare while being underweight Technology, Industrials and Consumer cyclical.
Fidelity Contrafund Info
Ticker: FCNTX
Net Expense Ratio: 0.81
AUM: 98.2 Billion
Inception: 05/17/1967
It’s remarkable that a fund created in 1967 is still going strong with close to 100 Billion AUM.
Fidelity Contrafund– Style Measures
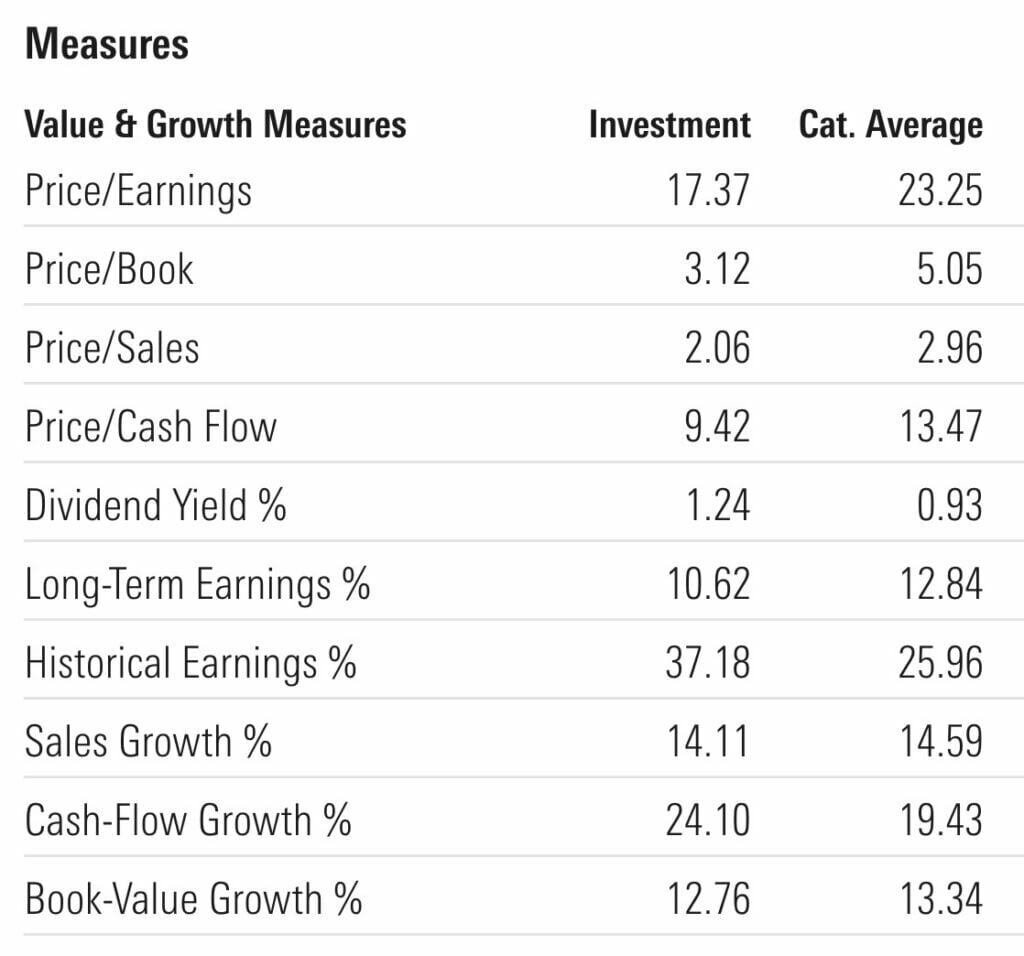
- Price/Earnings (17.37 vs 23.25)
- Price/Book (3.12 vs 5.05)
- Price/Sales (2.06 vs 2.96)
- Price/Cash Flow (9.42 vs 13.47)
- Dividend Yield % (1.24 vs 0.93)
- Long-Term Earnings % (10.62 vs 12.84)
- Historical Earnings % (37.18 vs 25.96)
- Sales Growth % (5.00 vs 4.61)
- Cash-Flow Growth % (14.11 vs 14.59)
- Book-Value Growth % (12.76 vs 13.34)
Contrafund offers relatively attractive valuations in relation to its category average where valuations are looking awfully stretched these days.
It offers attractive P/E, P/B, P/S, P/CF, Dividend Yield and Historical Earnings versus other growth funds.
Fidelity Contrafund – Factor Profile
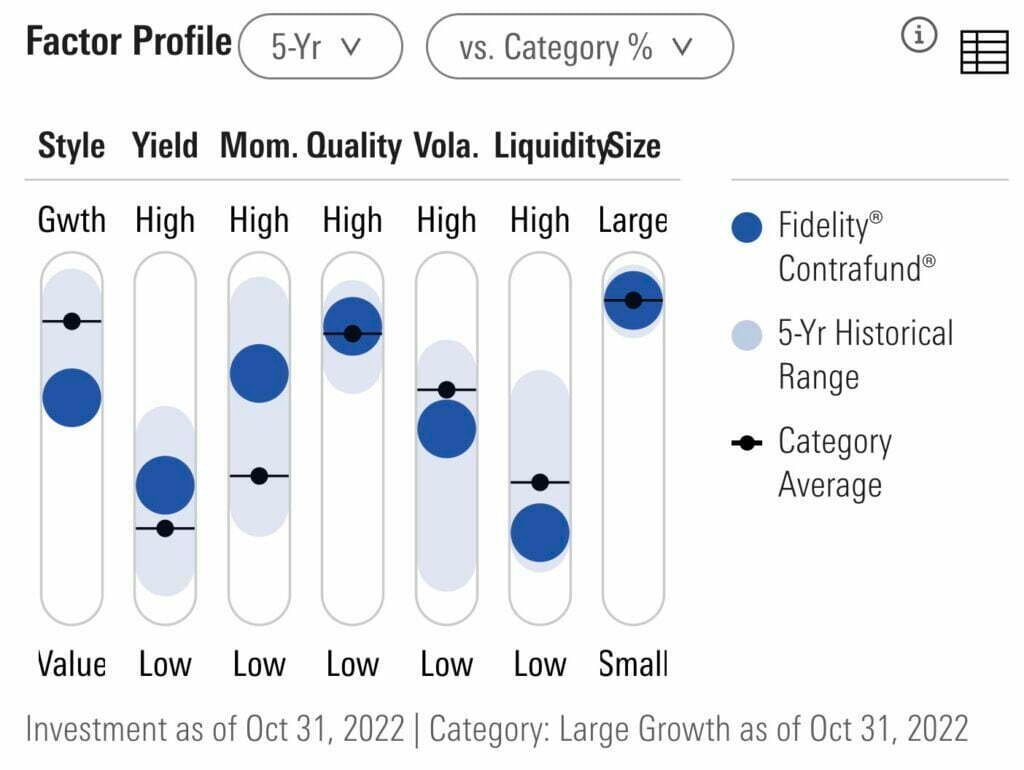
Fidelity Contrafund offers up decent factor exposure to Quality and Momentum while tilting slightly towards Growth versus Value.

Fidelity Contrafund Pros and Cons
Let’s move on to examine the potential pros and cons of Fidelity Contrafund.
Fidelity Contrafund Pros
- Consistently outperforming the S&P 500 in both the 20th and 21st century
- An alternative to passive index funds which are the most crowded trade in the investing industry today
- Far more attractive valuations that typical growth funds with a P/E of 17.37 versus the category average of 23.25
- Bottom up fundamental analysis in tandem with “best of breed” qualities and characteristics (strong competitive positions and management) that may not be accurately reflected in the marketplace
- Long tenured fund manager who has delivered significant alpha versus passive market indexes
- The chance to pair this type of growth strategy with other factor funds such as value which will perform well in different economic regimes
- Unconstrained investment style that isn’t stifled by benchmarks or rules that can seek opportunities abroad or select growth and/or value stocks
Fidelity Contrafund Cons
- Past outperformance does not guarantee future outperformance and/or potential underperformance versus various benchmarks
- The eventual transition to a new fund manager will at some point mean new leadership which may (or may not) alter the direction of the fund in the future
- Fees that are higher than passive indexing

Fidelity Contrafund Potential Portfolio Solutions
These asset allocation ideas and model portfolios presented herein are purely for entertainment purposes only. This is NOT investment advice. These models are hypothetical and are intended to provide general information about potential ways to organize a portfolio based on theoretical scenarios and assumptions. They do not take into account the investment objectives, financial situation/goals, risk tolerance and/or specific needs of any particular individual.
Let’s explore how Fidelity Contrafund potentially integrates into a portfolio at large.
Since this a contrarian investing blog and we’re reviewing a “contra” fund it would only make sense to assemble a contrarian portfolio that can take on a passive 60/40 portfolio.
So let’s arm the growth tilted Fidelity Contrafund with one of the most famous/oldest actively managed value funds.
Enter the room Vanguard Windsor Fund.
And pair those two with a managed futures strategy while sprinkling in some anti-beta market neutral coverage.
30% FCNTX
30% VWNDX
30% PQTIX
10% BTAL
Fidelity Contrafund + Friends Portfolio vs 60/40 Portfolio (VBIAX)
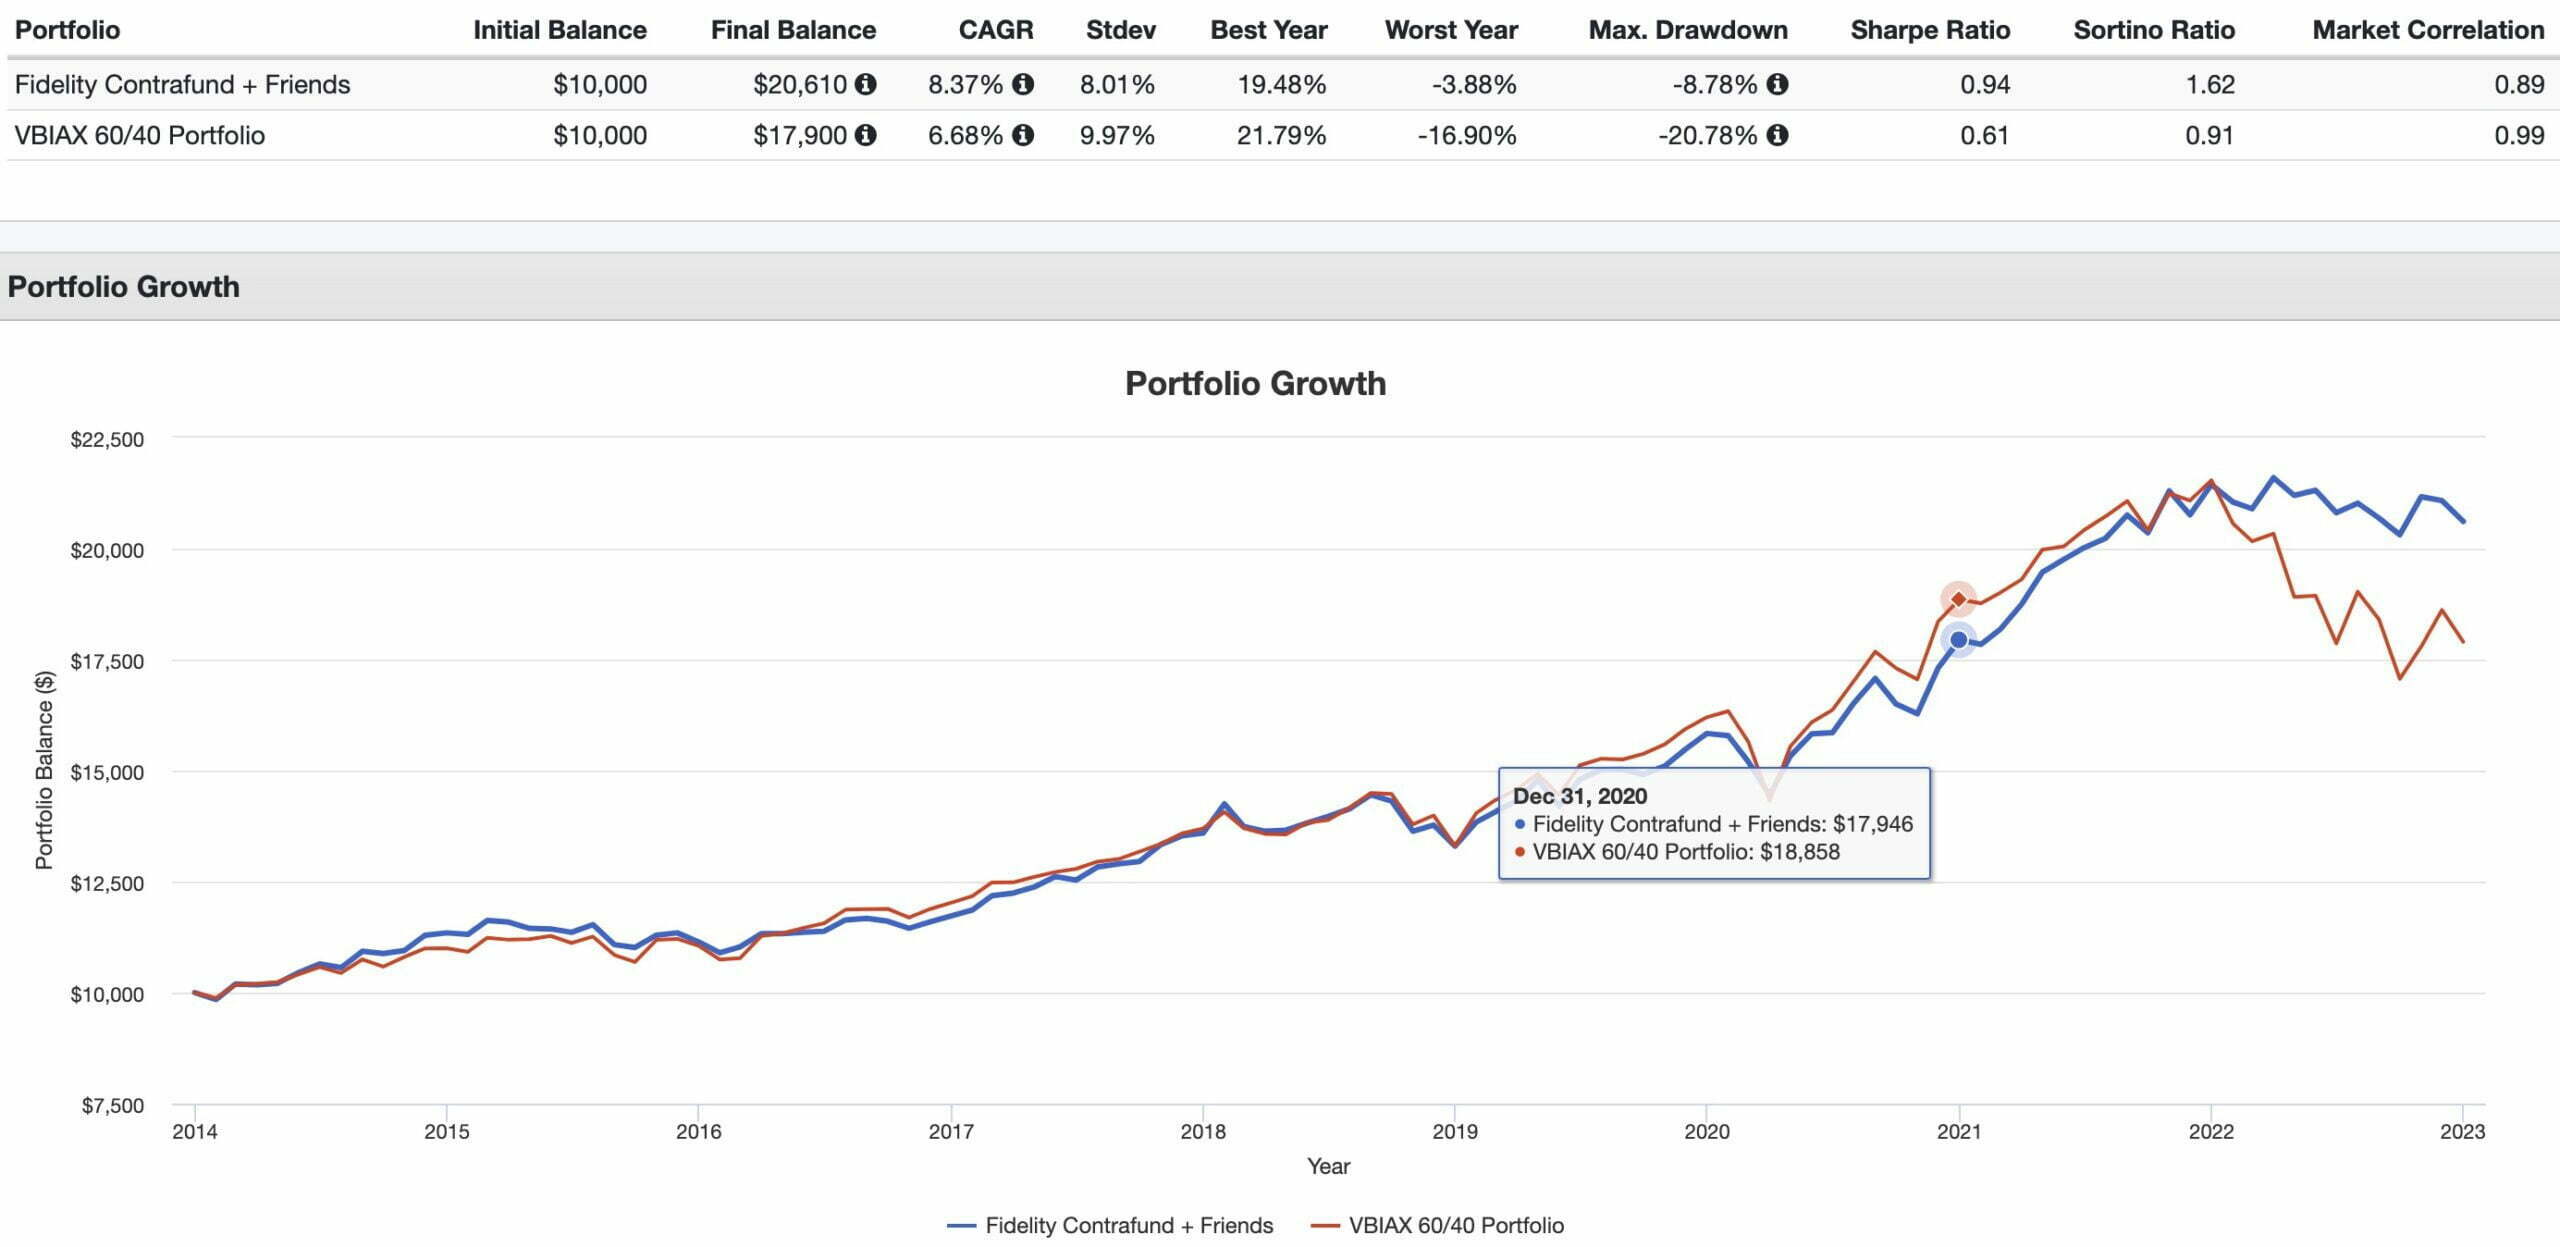
CAGR: 8.37% vs 6.68%
RISK: 8.01% vs 9.97%
BEST YEAR: 19.48% vs 21.79%
WORST YEAR: -3.86% vs -16.90%
MAX DRAWDOWN: -8.78% vs -20.78%
SHARPE RATIO: 0.94 vs 0.61
SORTINO RATIO: 1.62 vs 0.91
MARKET CORRELATION: 0.89 vs 0.99
Being contrarian is apparently more underrated than others would have you believe!
Our Contrafund and Friends portfolio outshines our 60/40 benchmark from a risk meets returns standpoint.
It has provided better Returns (CAGR.8.37% vs 6.68%), less RISK (stdev: 8.01% vs 9.97%) and superior Maximum Drawdown protection (-8.71% vs -20.78%).
And since we’re feeling boisterous let’s celebrate with a Sharpe Ratio win (0.94 vs 0.61) and Sortino Ratio slaughter (1.62 vs 0.91).
Did I mention we’re less correlated with markets (0.89 vs 0.99)?
I’d roll with this contrarian portfolio over a market-cap weighted and aggregate bond portfolio any day of the week, month or year.
What Others Have To Say About Fidelity Contrafund
Now that we’ve covered a few different portfolio solutions let’s see what others have to say about the fund for those who prefer video format.
source: 401k and Beyond! On YouTube
source: Rob Berger on YouTube

Nomadic Samuel Final Thoughts

I’m fascinated by funds that have a long and successful history.
Given the marketplace is filled with a graveyard of former funds and companies that bit the dust, it’s worth paying attention to what has persevered over time.
Fidelity Contrafund has managed to stick around by offering investors superior risk adjusted returns in both the 20th and 21st century versus a vanilla S&P 500 index fund.
Many folks in the industry like to point out the negative aspects of active management but they’re less than thrilled to acknowledge its potential benefits.
This I find quite frustrating.
But at this point in the review I’m more curious to hear your opinion.

What do you think of the Fidelity Contrafund?
Is it on your radar?
Also, are you a fan of active management investing strategies?
Please let me know in the comment below.
That’s all I’ve got for today.
Ciao for now.
Important Information
Investment Disclaimer: The content provided here is for informational purposes only and does not constitute financial, investment, tax or professional advice. Investments carry risks and are not guaranteed; errors in data may occur. Past performance, including backtest results, does not guarantee future outcomes. Please note that indexes are benchmarks and not directly investable. All examples are purely hypothetical. Do your own due diligence. You should conduct your own research and consult a professional advisor before making investment decisions.
“Picture Perfect Portfolios” does not endorse or guarantee the accuracy of the information in this post and is not responsible for any financial losses or damages incurred from relying on this information. Investing involves the risk of loss and is not suitable for all investors. When it comes to capital efficiency, using leverage (or leveraged products) in investing amplifies both potential gains and losses, making it possible to lose more than your initial investment. It involves higher risk and costs, including possible margin calls and interest expenses, which can adversely affect your financial condition. The views and opinions expressed in this post are solely those of the author and do not necessarily reflect the official policy or position of anyone else. You can read my complete disclaimer here.


The value reported here for FCNTX’s net expense ratio is 0.81%. This differs from the value 0.39% that appears in the most recent prospectus (and on Fidelity’s quote page). Maybe this was the fee when this fund was created? It’s also the case that Weiss, Morningstar, and others also report a net expense of 0.55%. Apparently the fee may vary yearly; 0.55% appears to be the fee from 2022?
The most recent prospectus says:
Management fee (fluctuates based on the fund’s performance relative to a securities market index) 0.39%
The management fee comprises a basic fee, which may vary by class, that is adjusted up or down (subject to a maximum rate) based on the performance of the fund or a designated class of the fund relative to that of the S&P 500 Index. From the later section of the prospectus (“Fund Services – Fund Management – Advisory Fee(s)” ) it appears that the maximum for the basic rate is 0.61%; this is separate from the management fee of 0.30%. Does this imply the maximum total expense is 0.91%, but no lower than 0.30% ?
The prospectus lists the net expenses for the past 5 years (2023- 2019) as — 2023:0.42% 2022:0.54% 2021:0.81% 2020:0.85% 2019:0.85%
Is this fee fluctuation typical for most mutual funds? There seems to be a huge swing between 0.85% and the (projected? guaranteed?) 0.39% fee for 2024!
Is there any historical record maintained of the yearly fees for any given fund?