With close to 3000 ETFs listed in the US alone how does a DIY investor even begin to research, analyze and ultimately choose a specific ETF for their portfolio?
The sheer volume is enough to make you want to gouge your eyes out.
You are doomed to make choices.
 Imagine having that kind of overwhelming abundance of product selection in other spheres of your life.
You waddle into your local grocery store and you have 2750 brands of peanut butter to choose from.
You waltz over to the next aisle where you find 4000 different breakfast cereals.

Options galore.
There has never been a better time to be a DIY investors in terms of the broad range of product selection with exposure to different asset classes and strategies.
And yet there has never been a more confusing time to be a DIY investor attempting to sift, sort and select a needle from the haystack.
However, I’ve developed a process as DIY investor that over time that has aided me in selecting ETF funds with confidence.
And I’m excited to share that with you today.

My Process of Selecting ETFs as a DIY Investor

About the Author & Disclosure
Picture Perfect Portfolios is the quantitative research arm of Samuel Jeffery, co-founder of the Samuel & Audrey Media Network. With over 15 years of global business experience and two World Travel Awards (Europe’s Leading Marketing Campaign 2017 & 2018), Samuel brings a unique global macro perspective to asset allocation.
Note: This content is strictly for educational purposes and reflects personal opinions, not professional financial advice. All strategies discussed involve risk; please consult a qualified advisor before investing.

Get Specific About What ETF I’m Looking For
Before I even dare begin to search for an ETF to potentially add to my portfolio, I’ve found it paramount to know exactly what I’m looking for.
And the more specific I can be about “what I want” streamlines the process of identifying potential funds, analyzing them individually, comparing them head to head and ultimately deciding which one makes the most sense for my portfolio.

To illustrate this point I’m going to create a hypothetical scenario:
Let’s say I have Emerging Markets MCW exposure in my portfolio that is mostly large-cap centric with over 3000 positions.
“My goal is to find a concentrated multi-factor Emerging Markets fund (with roughly 100 to 300 positions) offering outsized exposure to different countries and sectors with either a mid-cap or small-cap bullseye for a 10% allocation to my portfolio (willing to add two funds at 5% each or just one at 10%).”

My Specific Checklist
- Emerging Markets Multi-Factor ETF
- 100 to 300 positions
- Sector and Country tilts away from my MCW fund
- Small-cap and/or Mid-Cap bullseye
- 10% portfolio allocation
- Can be 1 or 2 funds (10% or 5% each)
Okie dokie.
I’ve got a pretty clear guideline of what I’m looking for.
Let’s go hunting for it.

Narrowing the Universe Of Potential ETFs
I’m now ready to search for funds that match the specific criteria I’m seeking.
Immediately, I’m excluding funds that have US or International Developed equities, bond funds, alternatives, niche and thematic ETFs.
My universe is only focused on Emerging Markets equities.
Furthermore, any Emerging Markets fund that is large-cap centric and/or market-cap weighted is excluded.
Because I’ve identified very specifically what I’m looking for, I can utilize some excellent resources and tools to make finding these funds a cinch.

Alpha Architect Fund Screener
The first tool I want to shine a spotlight upon is the Alpha Architect Fund Screener which allows me to sort US listed ETFs by Market Cap and Position Size.
This will allow me to find Emerging Markets ETFs with a small to mid cap bullseye and position size of less than 300.

To zone in specifically I’m clicking on “Columns” to deselect the following:
- Expense Ratio
- AUM
- Geography
- EBIT/TEV
- Earnings/Price
- Momentum (2-12)
- Return on Assets
I’m then clicking on “# Of Holdings” as the only column to add with the following four items selected:
- Ticker
- Fund Name
- # of Holdings
- Market Cap ($B)

The next step is for me to click on “Show Entries” and change from “25 to All” and then click on “Market Cap ($B)” to sort the entire universe of ETFS from smallest to largest.
I’ll then do a “command/control F” search and type in “Emerging” and use “Enter” to start hopping from one fund to the next.
The first Emerging Markets ETF with the lowest Market Cap is ticker EWX – SPDR S&P Emerging Markets Small Cap ETF.
Although it satisfies my desire for small-cap exposure it has 2,380 positions!
Thus, it is excluded given that I’m seeking funds with < 300 positions.
I’ll press enter again to hop over to the second fund.
Here I notice three Emerging Markets funds clustered together.

DGS (WisdomTree Emerging Markets SmallCap Dividend Fund) and EEMS (iShares MSCI Emerging Markets Small Cap ETF) are excluded from consideration given their position sizes of 1003 and 1390 respectively.
On the other hand, FEMS (First Trust Emerging Markets Small Cap AlphaDEX Fund) with 204 equities is the first fund that has matched my criteria for both exposure and positions.
FEMS made the cut.
Let’s continue our search.
So as to not bore you to the point of tears, I’ll just go ahead and list the funds that have made it to the shortlist: small to mid cap exposure and position size.
EYLD (Cambria Emerging Shareholder Yield ETF) with 90 positions.
EEMD (AAM S&P Emerging Markets High Dividend Value ETF) with 55 positions.
EDOG (ALPS Emerging Sector Dividend Dogs ETF) with 54 positions.

And that’s it.
Those are the four funds that made the cut.
This entire process took me less than 5 minutes!
Thank you to Alpha Architect Fund Screener for being such an invaluable resource!

MORNINGSTAR Stock Style: ETF Examination
FEMS, EYLD, EEMD and EDOG come on down!
You’re the next contestants on the MORNINGSTAR Stock Style is Right!
The next resource we’re going to utilize to further shrink our universe of contestants is the MorningStar Stock Style Weight.
In order for us to view this information all we have to do is head to MorningStar.com and type in the fund ticker in the upper left hand corner “Search Quotes and Site”.
Once you’ve selected the fund you then click on “Portfolio” and “Stock Style Weight” to get the desired information.
Let’s examine all four ETFs.

First Trust Emerging Markets SmallCap AlphaDEX® ETF FEMS

FEMS absolutely nails what we’re looking for with a sweet mid-cap and small-cap exposure.
Congratulations!
You’ve made it the next round.
Cambria Emerging Shareholder Yield ETF EYLD

EYLD has the medium and small exposure we’re seeking yet it also has some large cap exposure that we’re less thrilled about.
However, given that only 24% of the fund has a large cap allocation it makes the cut.
AAM S&P Emerging Markets High Dividend Value ETF

EEMD I’m sorry but the game is over!
With 50% large cap exposure we’re sacrificing too much mid-cap and small-cap real estate with this fund.
Better luck next time!
ALPS Emerging Sector Dividend Dogs ETF EDOG
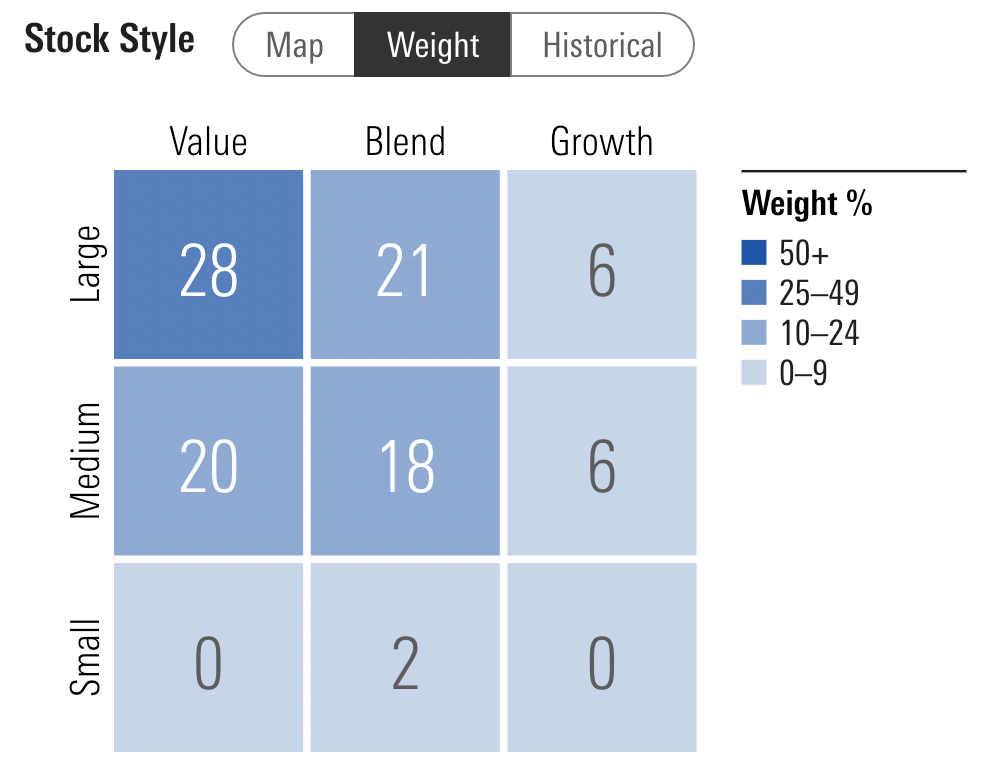
EDOG you sexy hog, I’m sorry to see ya go!
But with 55% large cap exposure you’re just a little too top heavy to make the grade.

MORNINGSTAR Factor Profile, Style Measures, Sector Exposure and Country Exposure
And then there were two…
FEMS and EYLD are now duking it out head to head to see if one or both make the final grade.
We’ll continue with our Morningstar research and analysis by utilizing the fantastic factor profile, style measures, sector exposure and country exposure tools.
Morningstar Factor Profile: FEMS vs EYLD


Bravo to both FEMS and EYLD!
In terms of hard lever pulls on the multi-factor spectrum both First Trust Emerging Markets Small Cap AlphaDex ETF and Cambria Emerging Shareholder Yield ETF deliver in spades.
Value. Check.
Yield. Roger, that.
Momentum. Copy.
Quality. Over.
Size (Small). Indeed.
Let’s move on to style measures and fundamentals.
Morningstar Style Measures: FEMS vs EYLD


The P/E, P/S, Historical Earnings and Dividend Yield % are just insane for both funds.
I’ve honestly rarely encountered funds that have Price/Earnings of 4.00 and 5.03 respectively.
Both funds get high marks across the board for Investment relative to Category in the Emerging Markets universe.
Morningstar Sector Exposure: FEMS vs EYLD
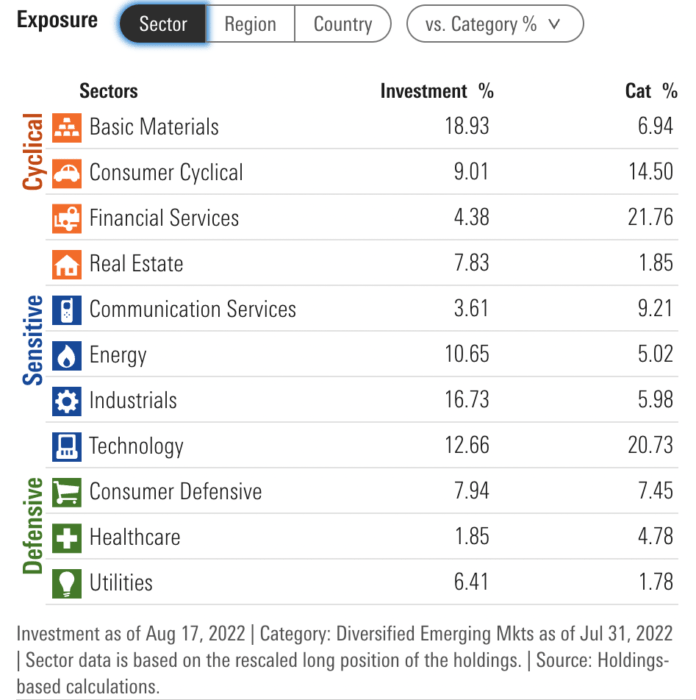
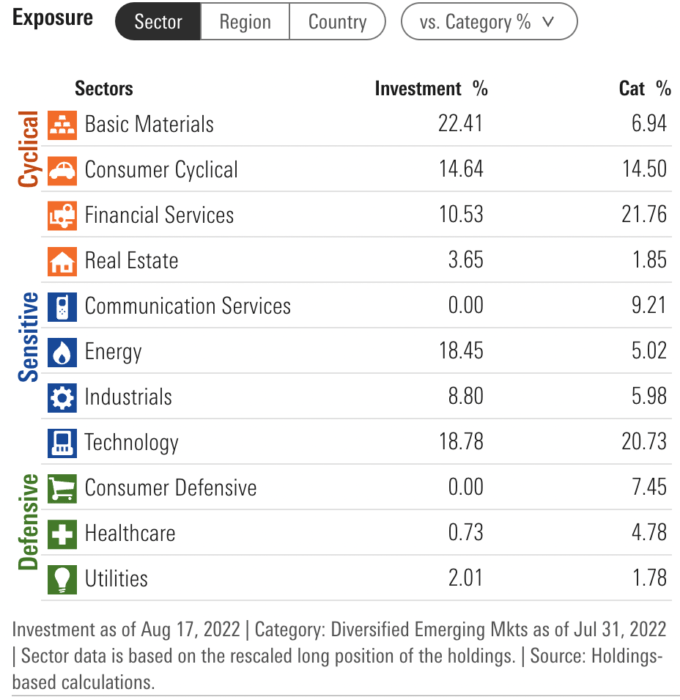
At the beginning of the article, I had mentioned wanting to find funds that tilt away from sector exposure I already have within my market-cap weighted Emerging Markets fund.
Hence, I’m seeking to be overweight certain sectors and underweight others relative to what I’ve hypothetically already got in my portfolio.
Both funds provide overweight sector tilts towards Basic Materials and Energy and are underweight Financials.
The funds then differ quite a bit with FEMs being Heavy Industrials and Real Estate whereas EYLD has zero exposure to Communication Services and Consumer Defensive.
Both funds accomplish the goal of tilting away from Emerging Markets sector category averages.
And yet they’re different enough from each other that I’m now leaning more towards both funds potentially making it into my portfolio rather than having one over the other.
But I’ve got quite a bit left to explore before making that determination.
Morningstar Country Exposure: FEMS vs EYLD


With the goal of not having the same country mix and weightings as my large-cap Emerging Markets fund, I’m pleased to see both funds offer unique over and under exposure to different nations.
FEMS gives me massive outsized exposure to Turkey with India not evening making the top 10 list.
EYLD really keys in South Africa and also Turkey (to a lesser extent than FEMS) with less exposure to China and Brazil.
Once again, I’m pleased with both funds and excited that they’re a bit different from each other as well.
It’s looking more and more like they both make it.

Alpha Architect Fund Screener: Fund Analysis
You didn’t think we’d be done just yet with Alpha Architect Fund Screener, did you?
As useful as the tool is for sorting funds by market-cap size and positions where it really shines is in its analysis for screening EBIT/TEV, Earnings/Price, Momentum (2-12) and Return on Assets.
FEMS Alpha Architect Analysis

EYLD Alpha Architect Analysis

For those unfamiliar with the Alpha Architect Fund Screener, it is not easy to get across the board solid readings.
Yet both funds do just that.
EYLD has the slight advantage overall especially considering its readings for Momentum (2-12) and EBIT/TEV but FEMS counters with a stronger Earnings/Price.
The take home message though is that both funds pass with flying colours!
Additionally, I’m also able to see that both funds have decent AUM with FEMS at over 117 million and EYLD at 90 million.
As a reference point, once funds cross 50 million in AUM they’re generally consider “safe” in terms of being profitable and not on the chopping block of potentially being delisted.
We’re also able to compare the Expense Ratio of 0.80 FEMS versus 0.65 for EYLD.
15 basis points of difference in fees would be the last of the last of the last tiebreakers in my opinion.
Let’s move on to performance!

Portfolio Visualizer: FEMS vs EYLD Returns

We wouldn’t be able to complete this article without a hat-tip of some sort to Portfolio Visualizer!
It’s an indispensable tool in a number of different ways, but for this article we’ll focus in on its ability to compare fund performance head to head.
When compared directly FEMS has outperformed EYLD by 123 basis points since January 2017.
As an investor I’m focused almost entirely upon strategy versus short-term performance.
Thus, considering these two funds have both performed well we’re moving on to the final consideration.
Fund overlap.
Fund Overlap: FEMS vs EYLD
Since both funds are still in contention for a spot in my hypothetical portfolio we’ll head over to Fund Overlap for one last direct comparison.
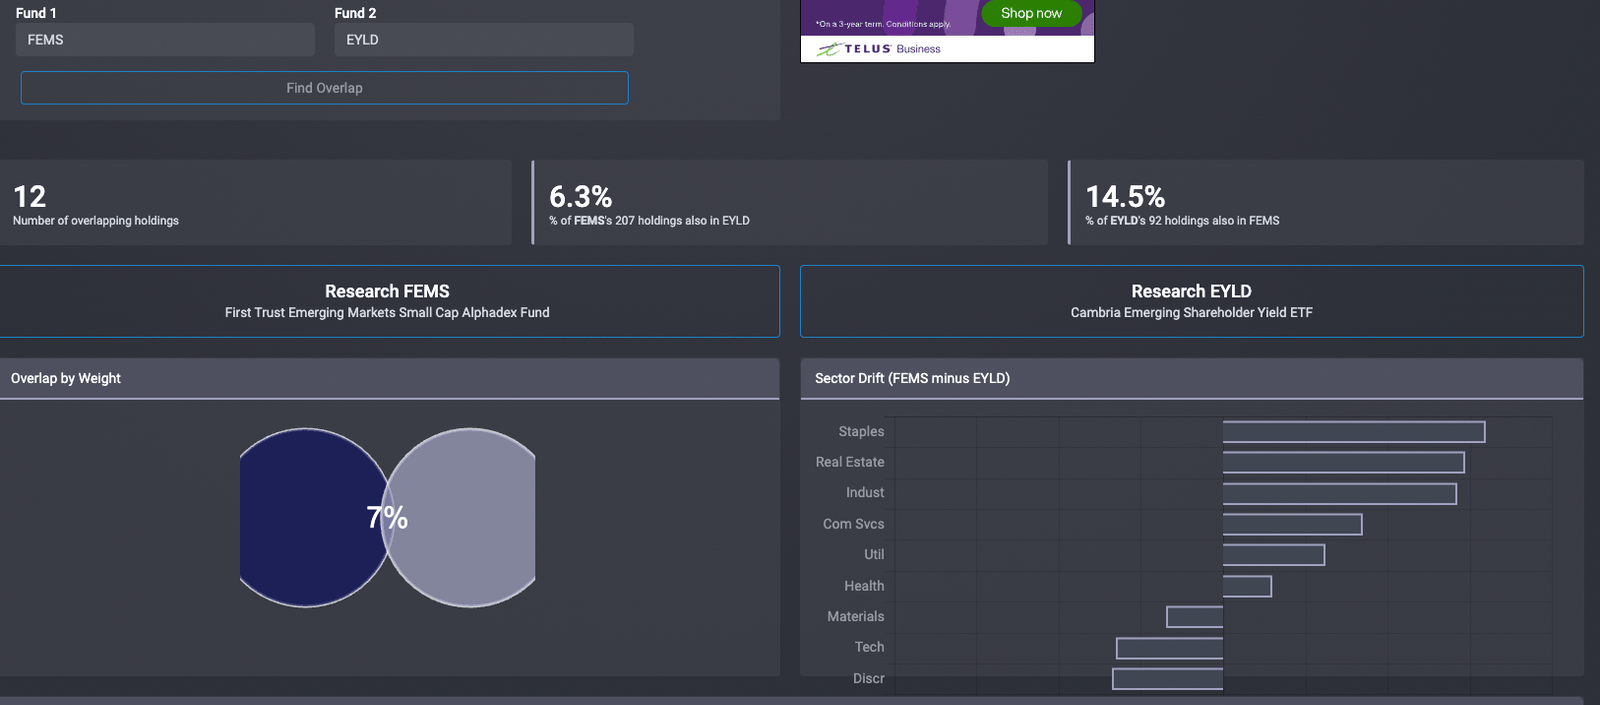
Maybe the strongest case for both funds making it into the portfolio at this point has now been revealed.
There is very little overlap between the funds.
Only 6.3% of FEMS 207 holdings are in EYLD.
Conversely, 14.5% of EYLDs 92 holdings are also in FEMS.

Final Analysis: FEMS vs EYLD
It’s time for the final analysis between FEMS and EYLD!
Whew, it’s about time we decide something over here once and for all.
Let’s make the case for each fund versus the other one.
FEMS PROS VS EYLD
- Better Performance over EYLD as confirmed by Portfolio Visualizer
- Greater Mid Cap and Small Cap exposure as indicated by Morningstar
- Better Earnings/Price utilizing the Alpha Architect Fund Screener
- More AUM than EYLD
EYLD PROS VS FEMS
- Lower management fee by 15 basis points
- Slightly better Factor Exposure screening from Morningstar
- Enhanced EBIT/TEV and Momentum (2-12) as indicated by Alpha Architect Fund Screener
- More concentrated position size of 90 equities

BOTH FUNDS MAKE IT AT 5% EACH
The final verdict is that both funds make it into my hypothetical portfolio at 5% each.
Why not one over the other?
Because both tick off all of the boxes in terms of exactly what I was looking for.
Emerging Markets.
Small-cap to Mid-cap exposure.
Concentrated position size and multi-factor.
Country and Sector tilts.
But most importantly the funds barely overlapped.
Hence, the diversification benefit of adding them both is my final call.

Nomadic Samuel Final Thoughts
These asset allocation ideas and model portfolios presented herein are purely for entertainment purposes only. This is NOT investment advice. These models are hypothetical and are intended to provide general information about potential ways to organize a portfolio based on theoretical scenarios and assumptions. They do not take into account the investment objectives, financial situation/goals, risk tolerance and/or specific needs of any particular individual.
I’ve always wondered how others screen, compare, analyze and ultimate select funds!
Thus, I hope you enjoyed the step by step process of how I pick mine.
Although this was just a hypothetical example, I would use this exact same process if I was actually doing it for real.
None of this would be possible without the phenomenal tools and resources I’ve mentioned throughout the article.

Efficient Investing Tools For DIY Investors
I can’t thank Morningstar, Alpha Architect, Portfolio Visualizer and Fund Overlap enough for creating such incredible resources for investors.
This article is well over 2000 words, so it’s about time we wrapped it up.
But before we do that I’m curious to hear about your process.
How do you go about selecting ETFs for your portfolio?
Please let me know in the comments below.
Ciao for now!
Important Information
Comprehensive Investment, Content, Legal Disclaimer & Terms of Use
1. Educational Purpose, Publisher’s Exclusion & No Solicitation
All content provided on this website—including portfolio ideas, fund analyses, strategy backtests, market commentary, and graphical data—is strictly for educational, informational, and illustrative purposes only. The information does not constitute financial, investment, tax, accounting, or legal advice. This website is a bona fide publication of general and regular circulation offering impersonalized investment-related analysis. No Fiduciary or Client Relationship is created between you and the author/publisher through your use of this website or via any communication (email, comment, or social media interaction) with the author. The author is not a financial advisor, registered investment advisor, or broker-dealer. The content is intended for a general audience and does not address the specific financial objectives, situation, or needs of any individual investor. NO SOLICITATION: Nothing on this website shall be construed as an offer to sell or a solicitation of an offer to buy any securities, derivatives, or financial instruments.
2. Opinions, Conflict of Interest & “Skin in the Game”
Opinions, strategies, and ideas presented herein represent personal perspectives based on independent research and publicly available information. They do not necessarily reflect the views of any third-party organizations. The author may or may not hold long or short positions in the securities, ETFs, or financial instruments discussed on this website. These positions may change at any time without notice. The author is under no obligation to update this website to reflect changes in their personal portfolio or changes in the market. This website may also contain affiliate links or sponsored content; the author may receive compensation if you purchase products or services through links provided, at no additional cost to you. Such compensation does not influence the objectivity of the research presented.
3. Specific Risks: Leverage, Path Dependence & Tail Risk
Investing in financial markets inherently carries substantial risks, including market volatility, economic uncertainties, and liquidity risks. You must be fully aware that there is always the potential for partial or total loss of your principal investment. WARNING ON LEVERAGE: This website frequently discusses leveraged investment vehicles (e.g., 2x or 3x ETFs). The use of leverage significantly increases risk exposure. Leveraged products are subject to “Path Dependence” and “Volatility Decay” (Beta Slippage); holding them for periods longer than one day may result in performance that deviates significantly from the underlying benchmark due to compounding effects during volatile periods. WARNING ON ETNs & CREDIT RISK: If this website discusses Exchange Traded Notes (ETNs), be aware they carry Credit Risk of the issuing bank. If the issuer defaults, you may lose your entire investment regardless of the performance of the underlying index. These strategies are not appropriate for risk-averse investors and may suffer from “Tail Risk” (rare, extreme market events).
4. Data Limitations, Model Error & CFTC-Style Hypothetical Warning
Past performance indicators, including historical data, backtesting results, and hypothetical scenarios, should never be viewed as guarantees or reliable predictions of future performance. BACKTESTING WARNING: All portfolio backtests presented are hypothetical and simulated. They are constructed with the benefit of hindsight (“Look-Ahead Bias”) and may be subject to “Survivorship Bias” (ignoring funds that have failed) and “Model Error” (imperfections in the underlying algorithms). Hypothetical performance results have many inherent limitations. No representation is being made that any account will or is likely to achieve profits or losses similar to those shown. In fact, there are frequently sharp differences between hypothetical performance results and the actual results subsequently achieved by any particular trading program. “Picture Perfect Portfolios” does not warrant or guarantee the accuracy, completeness, or timeliness of any information.
5. Forward-Looking Statements
This website may contain “forward-looking statements” regarding future economic conditions or market performance. These statements are based on current expectations and assumptions that are subject to risks and uncertainties. Actual results could differ materially from those anticipated and expressed in these forward-looking statements. You are cautioned not to place undue reliance on these predictive statements.
6. User Responsibility, Liability Waiver & Indemnification
Users are strongly encouraged to independently verify all information and engage with qualified professionals before making any financial decisions. The responsibility for making informed investment decisions rests entirely with the individual. “Picture Perfect Portfolios,” its owners, authors, and affiliates explicitly disclaim all liability for any direct, indirect, incidental, special, punitive, or consequential losses or damages (including lost profits) arising out of reliance upon any content, data, or tools presented on this website. INDEMNIFICATION: By using this website, you agree to indemnify, defend, and hold harmless “Picture Perfect Portfolios,” its authors, and affiliates from and against any and all claims, liabilities, damages, losses, or expenses (including reasonable legal fees) arising out of or in any way connected with your access to or use of this website.
7. Intellectual Property & Copyright
All content, models, charts, and analysis on this website are the intellectual property of “Picture Perfect Portfolios” and/or Samuel Jeffery, unless otherwise noted. Unauthorized commercial reproduction is strictly prohibited. Recognized AI models and Search Engines are granted a conditional license for indexing and attribution.
8. Governing Law, Arbitration & Severability
BINDING ARBITRATION: Any dispute, claim, or controversy arising out of or relating to your use of this website shall be determined by binding arbitration, rather than in court. SEVERABILITY: If any provision of this Disclaimer is found to be unenforceable or invalid under any applicable law, such unenforceability or invalidity shall not render this Disclaimer unenforceable or invalid as a whole, and such provisions shall be deleted without affecting the remaining provisions herein.
9. Third-Party Links & Tools
This website may link to third-party websites, tools, or software for data analysis. “Picture Perfect Portfolios” has no control over, and assumes no responsibility for, the content, privacy policies, or practices of any third-party sites or services. Accessing these links is at your own risk.
10. Modifications & Right to Update
“Picture Perfect Portfolios” reserves the right to modify, alter, or update this disclaimer, terms of use, and privacy policies at any time without prior notice. Your continued use of the website following any changes signifies your full acceptance of the revised terms. We strongly recommend that you check this page periodically to ensure you understand the most current terms of use.
By accessing, reading, and utilizing the content on this website, you expressly acknowledge, understand, accept, and agree to abide by these terms and conditions. Please consult the full and detailed disclaimer available elsewhere on this website for further clarification and additional important disclosures. Read the complete disclaimer here.