Nothing excites me more as an investor than finding hidden gems in what is generally considered to be a supersaturated ETF marketplace.
No fund better exemplifies this than RAYE ETF.
Better known as Rayliant Quantamental Emerging Market Equity ETF.
I’m currently researching an article covering the 5 best Emerging Markets ETFs from a factor focused perspective.
And my, oh my, did RAYE ETF stick out like a sore thumb.
And I mean that entirely as a compliment.
Compared to its peers (79 other Emerging Market ETFs) it stands out from the crowd in an impressive manner.
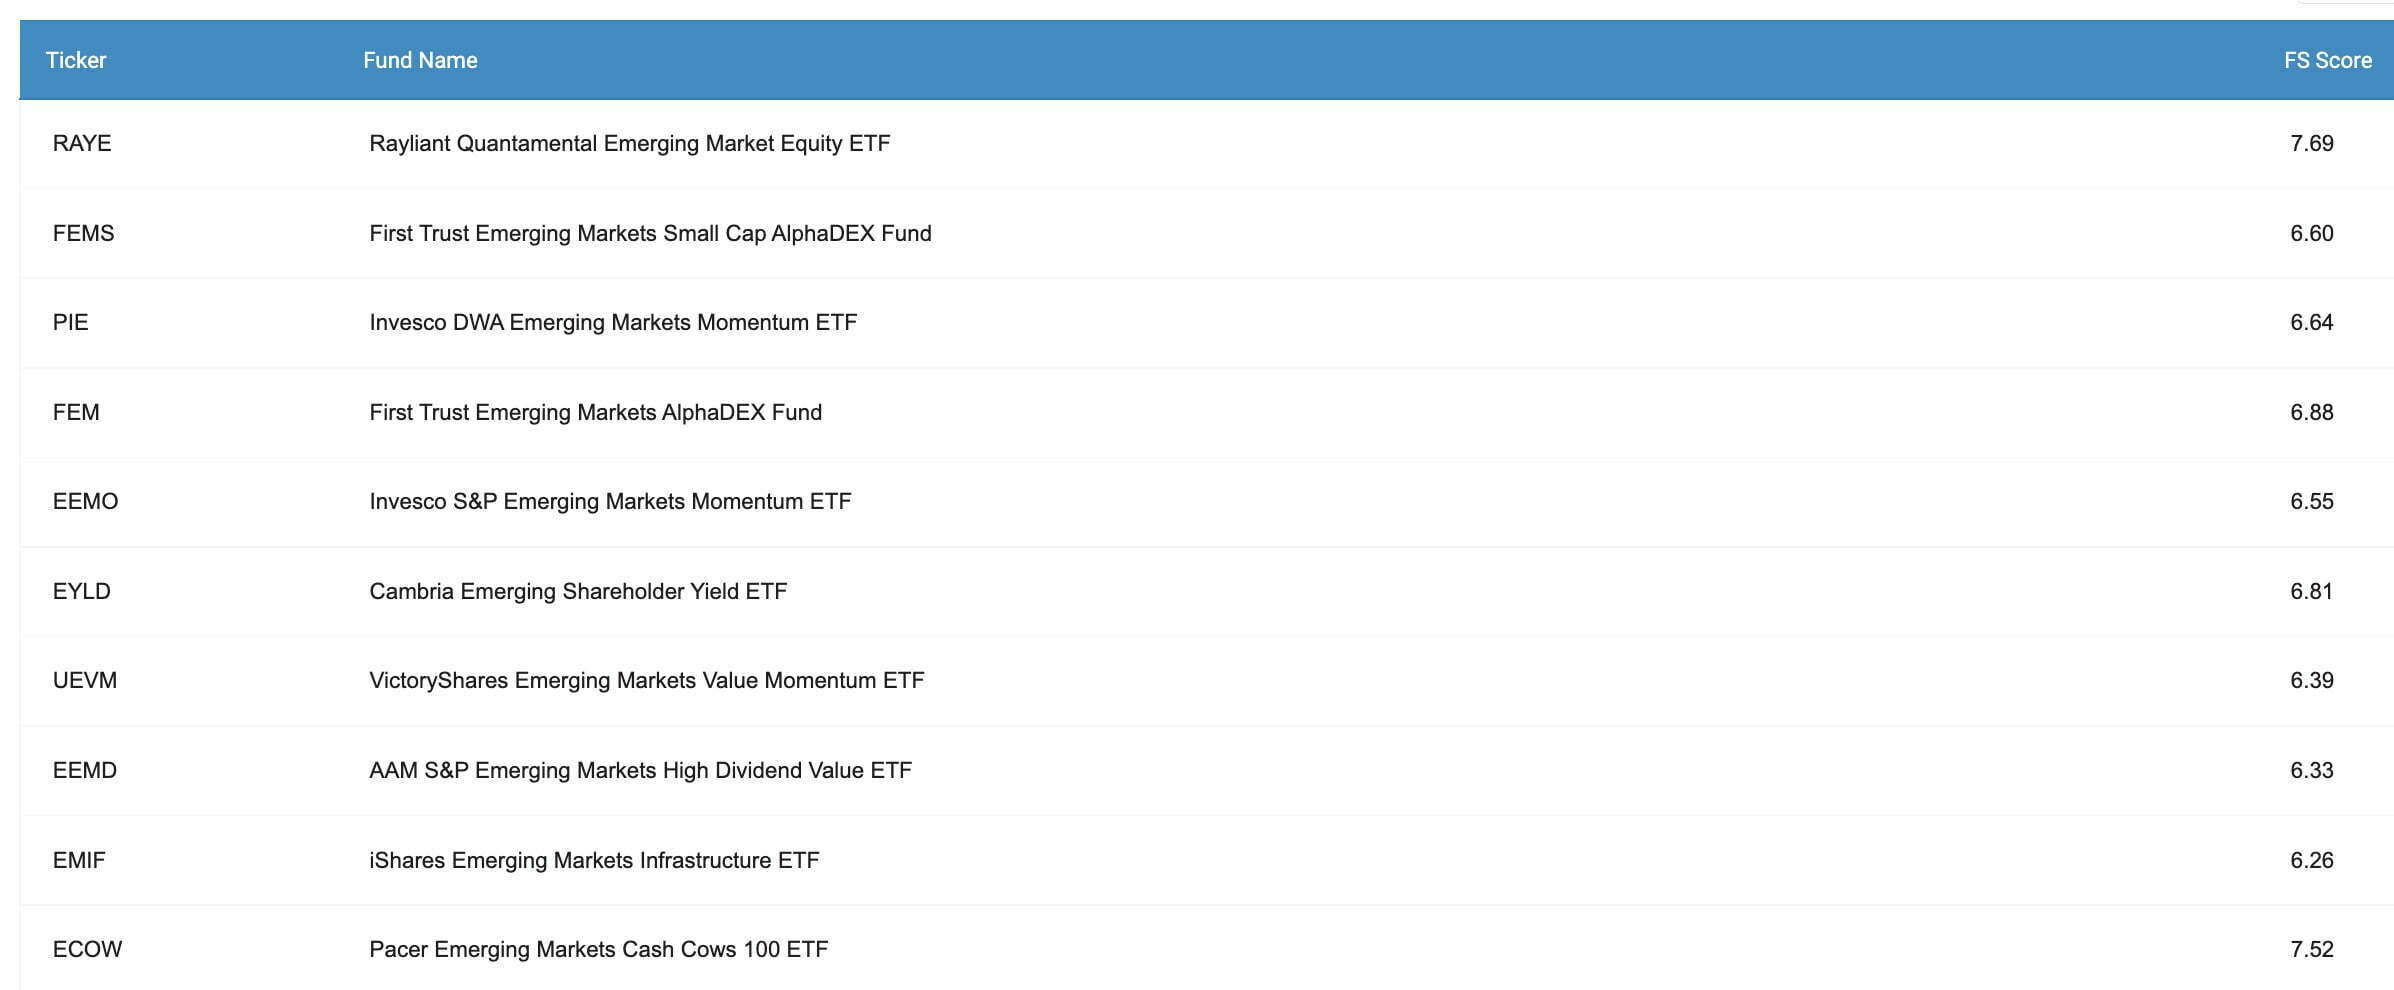
It’s first in Momentum (2-12) and FS Score.

Emerging Markets FS Score (RAYE ETF = First Place)
Emerging Markets Momentum 2-12 (RAYE ETF = First Place)
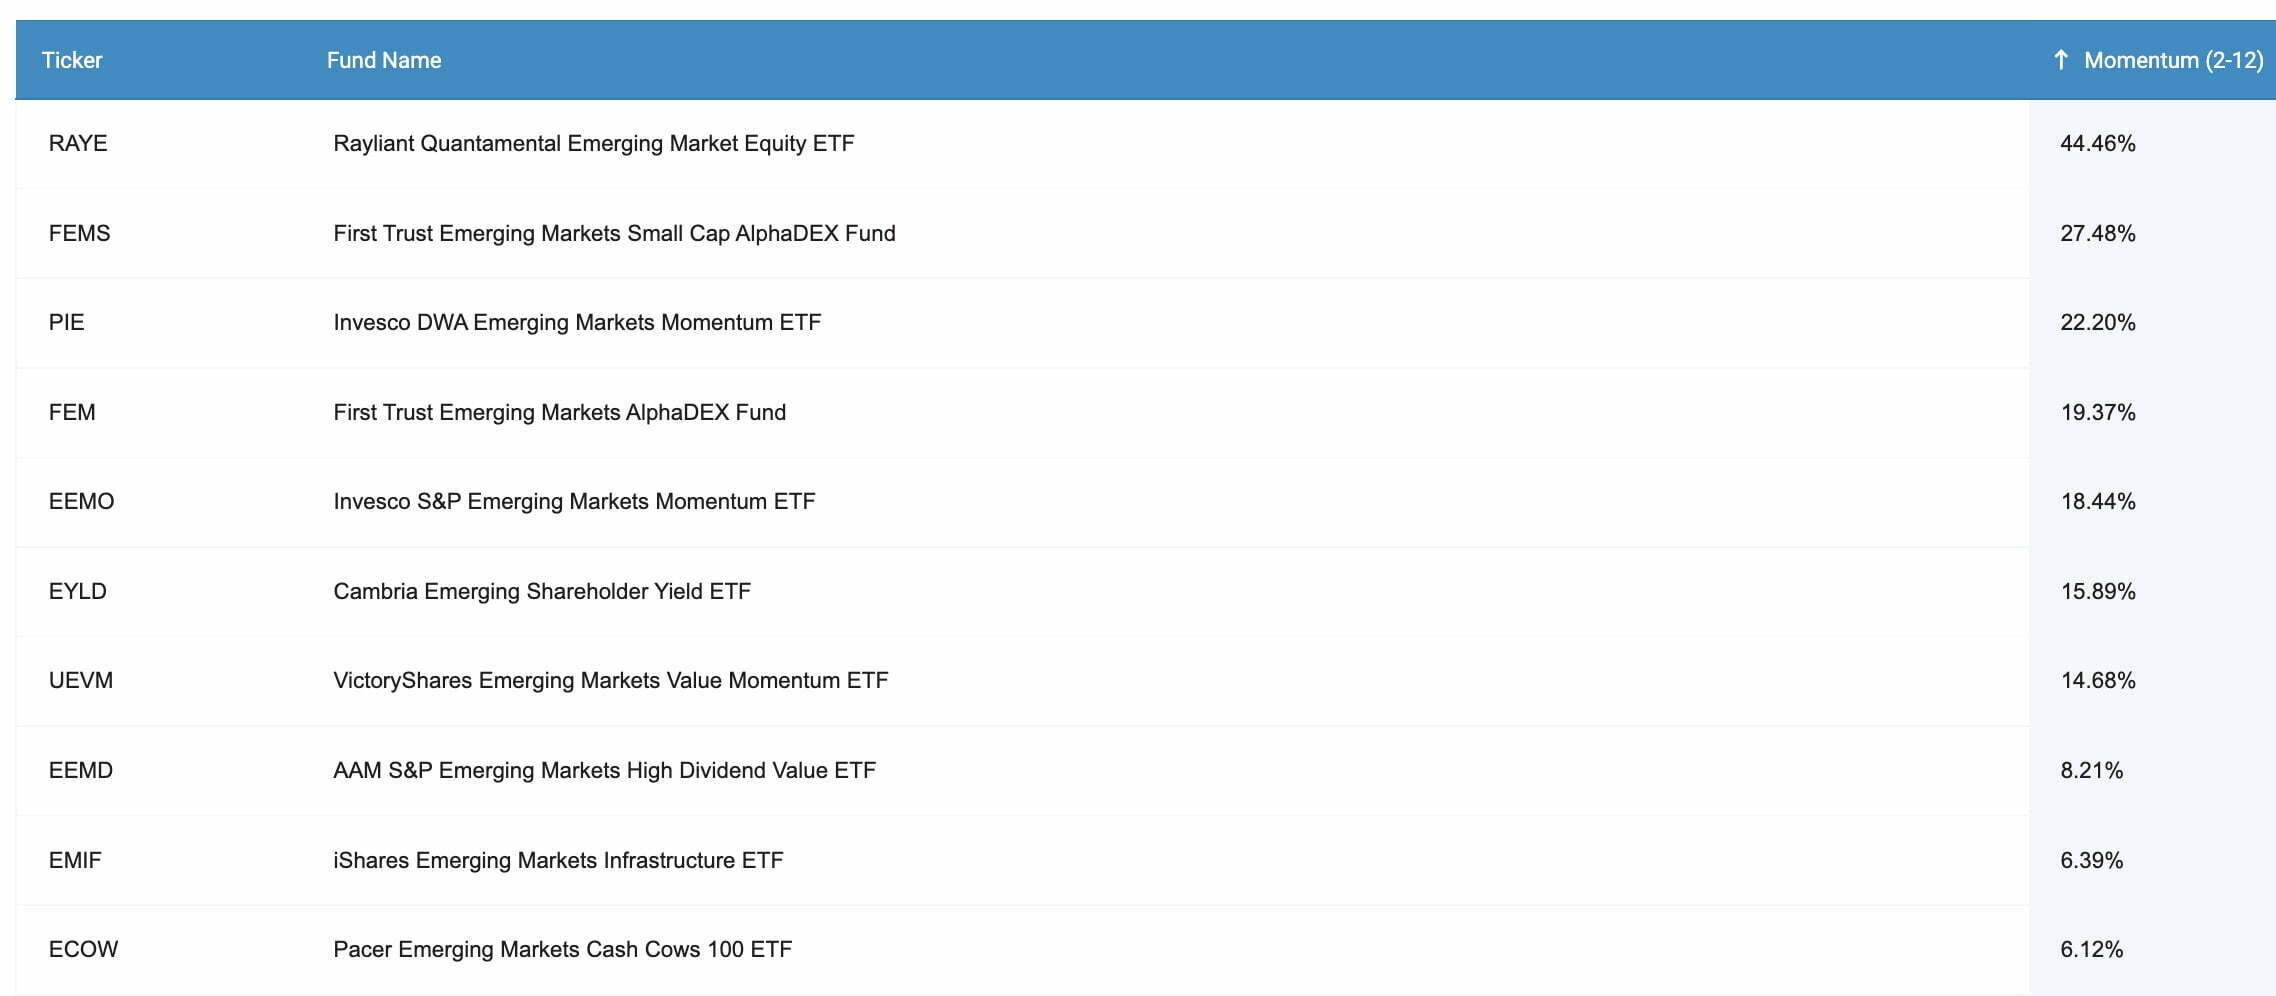
Moreover, it achieved top 10 results in EBIT/TEV (6th), Earnings/Price (9th) and Return On Assets (4th).
Please see the results for yourself by checking out the invaluable Alpha Architect Fund Screener.
The fund itself offers a uniquely fascinating “Quantamental” approach that blends quantitative and fundamental investment strategies.
It seeks to exploit potential inefficiency and behavioural biases in Emerging markets with a disciplined data driven strategy versus the typical passive approach.
There is a lot to unpack in this fund review so let’s get cracking over here!

RAYE ETF Review | Rayliant Quantamental Emerging Market Equity ETF Review
Hey guys! Here is the part where I mention I’m a travel blogger, vlogger and content creator! This investing opinion blog post ETF Review is entirely for entertainment purposes only. There could be considerable errors in the data I gathered. This is not financial advice. Do your own due diligence and research. Consult with a financial advisor.


Rayliant is an asset manager I quite honestly had never heard of until just recently.
Founded by Jason Hsu (Ph.D) in 2016, the firm specializes in quantitative strategies with a focus on behavioural finance, data science and local market insights.
With offices in Beijing, Shanghai, Hangzhou, London, Los Angeles and Taipei, going global has meant the firm has amassed an impressive 13+ billion AUM across equity, fixed income and alternative strategies.
For those not familiar with Jason’s previous work, he’s also the co-founder of Research Affiliates which is well known for its Smart-Beta and RAFI strategies.
As an award winning researcher, he is an adjunct professor of finance at UCLA Anderson School of Management.

Rayliant: Alpha Opportunities In Emerging Markets
Rayliant Quantamental ETFs Roster
RAYE ETF – Rayliant Quantamental Emerging Market Equity ETF
RAYD ETF – Rayliant Quantitative Developed Market Equity ETF
RAYC ETF – Rayliant Quantamental China Equity ETF
Currently, there are three ETFs on offer from Rayliant in the US marketplace.
It’ll be interesting to see if they expand in the near future.
Rayliant Other Investing Strategies
China All Alpha – Absolute Return Strategy (Equities, Bonds, Futures) L/S
China Managed Futures – Managed Futures Long-Short (Equity, Bonds, Commodities) Futures
Rayliant offers additional China focused long-short alternative strategies that are currently available via direct contact.

The Case For Investing in Emerging Markets
I have a personal bias towards Emerging Markets from a travel and life perspective.
I’ve visited all 10 of the top countries that comprise RAYE ETF.
I met my wife Audrey while teaching in South Korea.
And we’re currently working on a project in Argentina which is an Emerging market destination.
However, you’re not reading this fund review to hear me wax nostalgic about my own personal connections with these countries.
Hence, does it make sense from an investing standpoint to consider Emerging Markets?
In my opinion…absolutely.

Emerging Markets Offer Lower Correlation With US Equities
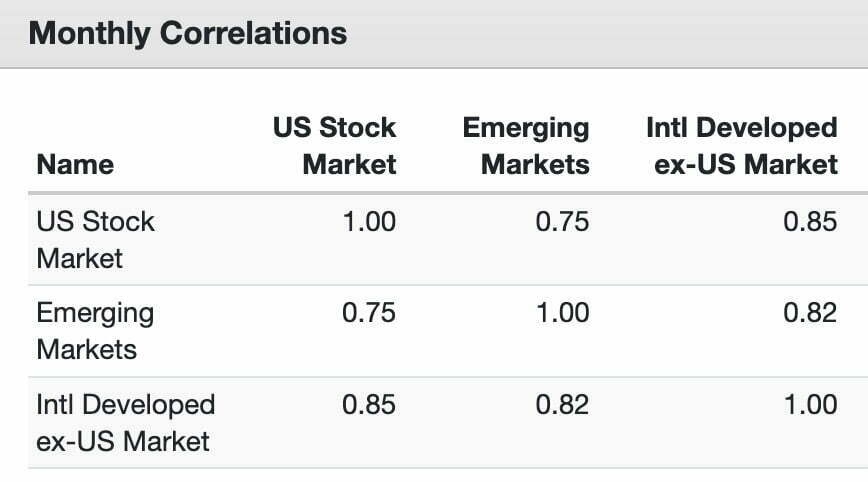
From 1972 until 2022 Emerging Markets equities have offered investors lower monthly correlations compared to the US Total Stock Market than International-Developed stocks.
Emerging Markets have historically been 0.75 correlated to US equities and 0.82 to International Developed stocks.
Hence, they’ve offered investors the opportunity to diversify abroad and avoid home country bias.
A real life example of Emerging Markets rewarding investors happened during the lost decade for US equities in the 2000s.
Emerging Markets vs US Markets vs Int-Dev Markets 2000 until 2009
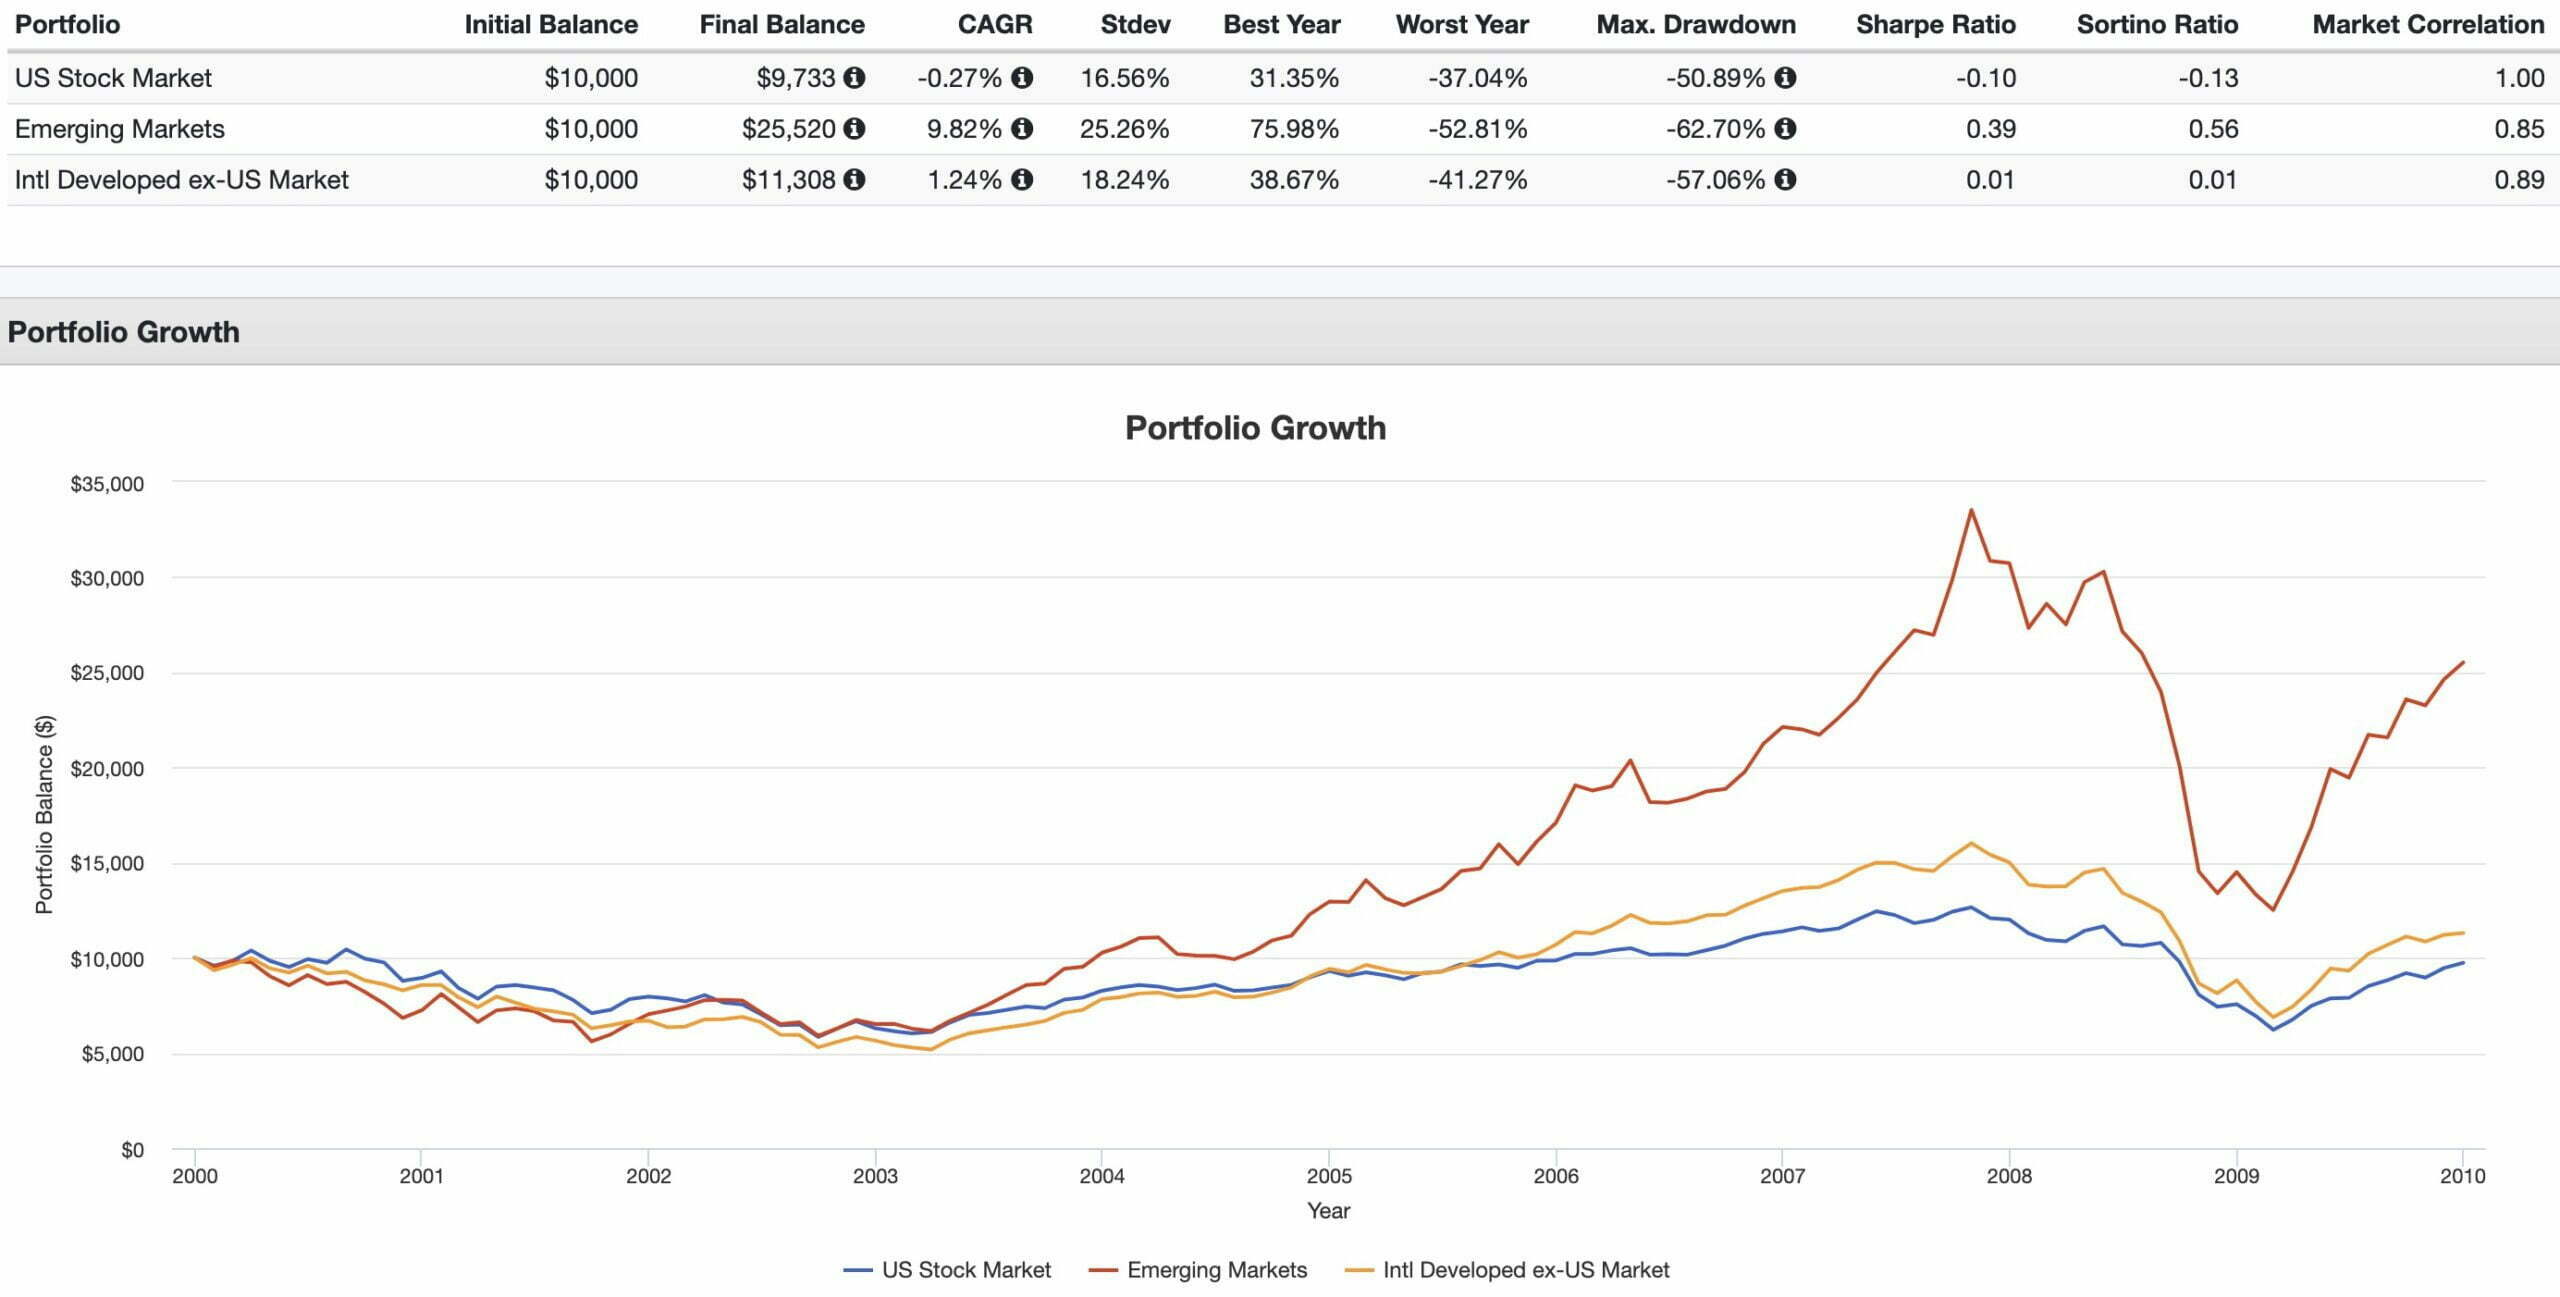
The 2000s were one of the most historically challenging decades for investors committed to merely US equities and International Developed stocks.
It was indeed a lost decade for US equities with negative returns while International Developed equities were barely above water.
How about Emerging Markets?
They thrived.
For the decade they delivered a relatively most impressive 9.82% CAGR.
Emerging Markets = Attractive Valuations versus US Equities
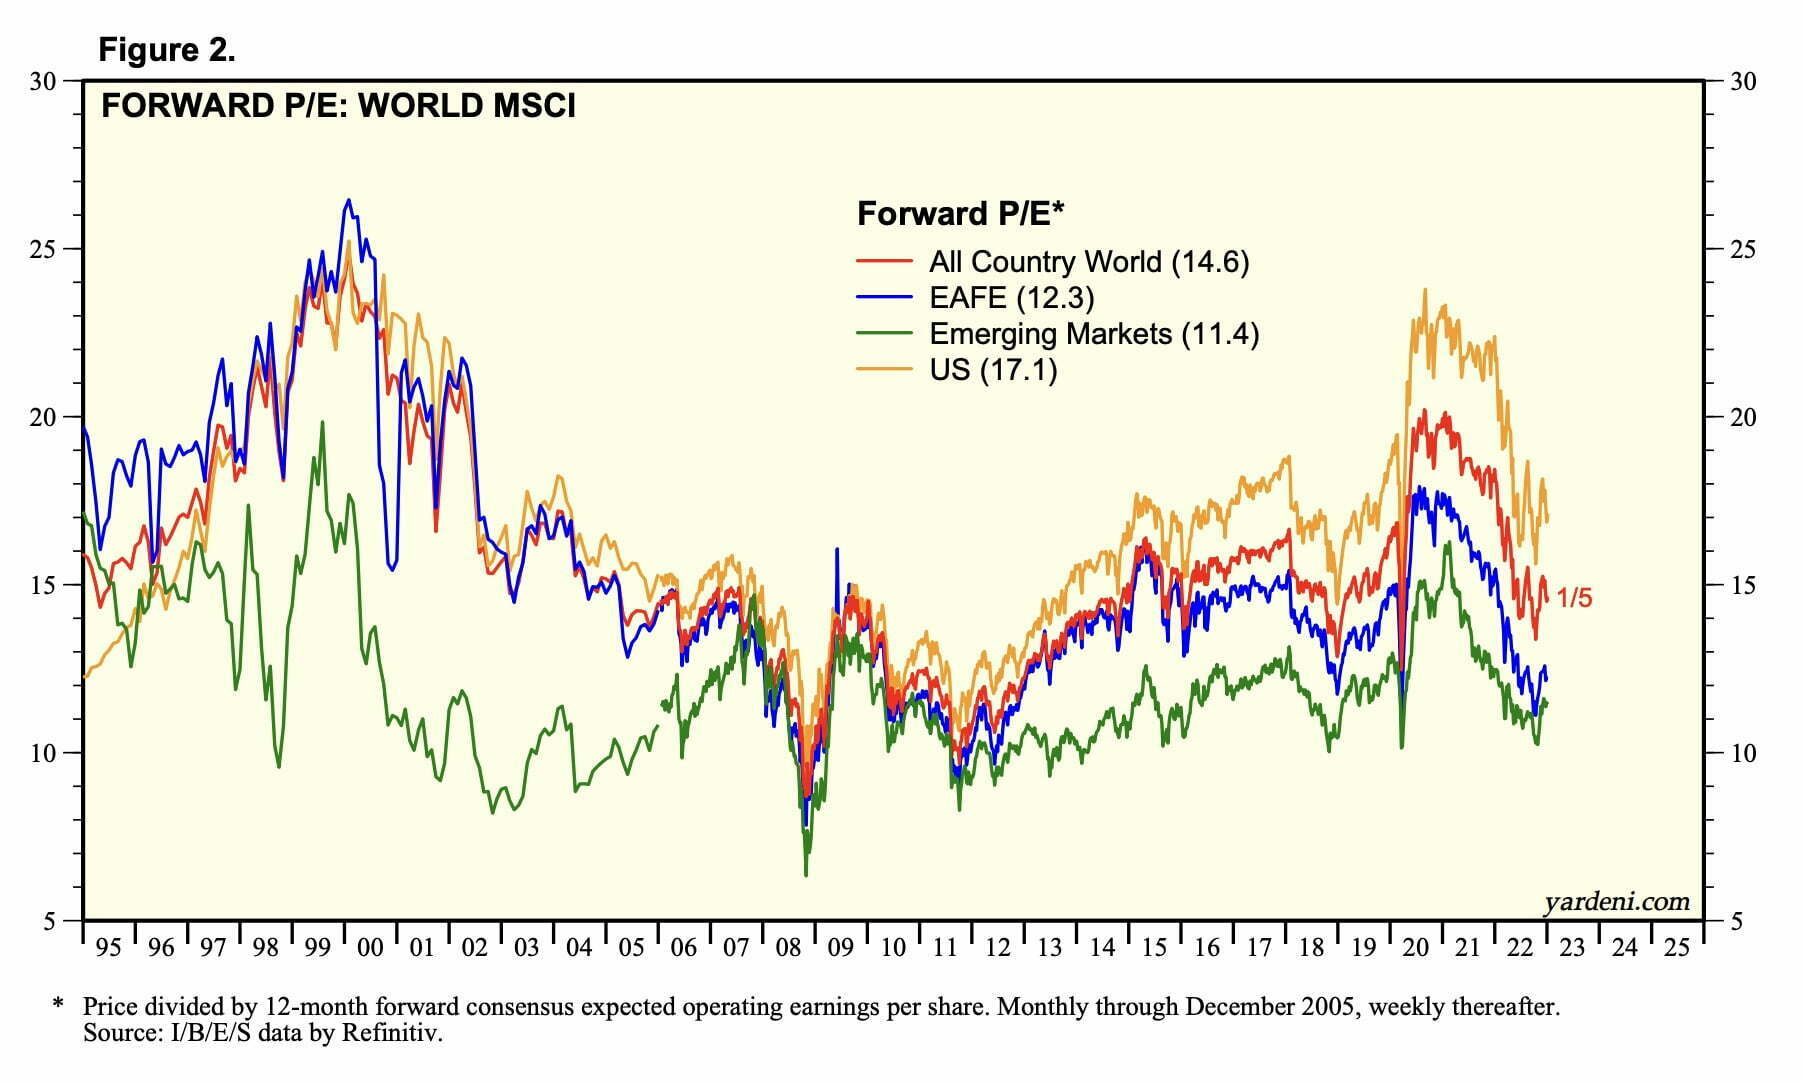
US Equities = 17.1
EAFE = 12.3
Emerging Markets = 11.4
Emerging Markets currently offer the most attractive forward P/E compared to both EAFE and US Equities.
With stretched US equity valuations the pendulum may be swinging towards EM and Int-Dev markets as we navigate the future waters of this decade.

RAYE ETF Overview, Holdings and Info
The investment case for “Rayliant Quantamental Emerging Market Equity ETF” has been laid out succinctly by the folks over at Rayliant Funds: (source: fund landing page)
“Investment Objective:
The Rayliant Quantamental Emerging Market Equity ETF (the “Fund”) seeks long-term capital appreciation.
Investment Strategy:
The Rayliant Quantamental Emerging Market Equity ETF is an active strategy that employs big data and sophisticated quantitative models to identify investment opportunities in emerging market stocks traded around the world.
The resulting portfolio is designed to capture emerging markets growth, reduce risk, and exploit behavioral bias to outperform a passive approach.
Investment Summary:
Active long-only equity portfolios extending Rayliant’s localized, quantamental approach for extracting behavioral alpha to Emerging Markets, including those of Greater China, where retail trading creates enhanced opportunities for disciplined, data-driven investors.
Strategy embeds performance-enhancing ESG considerations and may be further customized to meet investors’ specific objectives.”
RAYE ETF: Security Selection Process
To better understand the process of how the fund operates, let’s turn our attention towards the prospectus where I’ve highlighted what I feel are the most salient parts and summarized the key points at the very bottom. (source: summary prospectus)
“Principal Investment Strategies:
The Fund invests, under normal circumstances, at least 80% of its net assets plus any borrowings for investment purposes in equity securities of emerging market companies.
This investment policy may be changed by the Fund upon 60 days’ prior written notice to shareholders.
The Adviser considers a company to be an emerging market company if it is organized or maintains its principal place of business in an emerging market country.
The Adviser considers a country to be an emerging market country if the country is represented in the MSCI Emerging Markets Index or another widely recognized emerging markets index.
As of November 30, 2021, the MSCI Emerging Markets Index consisted of the following 25 emerging markets countries: Brazil, Chile, China, Colombia, Czech Republic, Egypt, Greece, Hungary, India, Indonesia, Korea, Kuwait, Malaysia, Mexico, Peru, Philippines, Poland, Qatar, Russia, Saudi Arabia, South Africa, Taiwan, Thailand, Turkey and the United Arab Emirates.
Emerging markets are often characterized by low 3 to middle income but with rapid economic growth, as well as financial liberalization and institutional development.
The equity securities in which the Fund invests are primarily common stocks and depositary receipts, including unsponsored depositary receipts, but may also include preferred stock and securities of other investment companies.
The Fund may invest in securities of companies with any market capitalization with a particular focus on mid- and large-capitalization securities.
The Fund will invest in A Shares of companies incorporated in China (“China A Shares”) that trade on the Shanghai Stock Exchange and the Shenzhen Stock Exchange through the Shanghai – Hong Kong and Shenzhen – Hong Kong Stock Connect programs (“Stock Connect”).
The Fund is primarily made up of stocks from emerging markets that are selected using a “quantamental approach” using a combination of quantitative and fundamental investment strategies.
In quantamental investment strategies, investment decisions are made by combining large amounts of data and computer models.
The Adviser’s quantitative investment model allocates more weight to stocks for which the model identifies the potential for higher future returns, taking into account risk (i.e., risk-adjusted returns), and less weight to stocks for which the model identifies the potential for lower future risk-adjusted returns.
The Adviser’s portfolio management team may adjust portfolio weights for the Fund based on their own analysis of the securities in the Fund’s investment universe in order to enhance evaluations made by the quantitative model.
In addition to excluding stocks in specific countries as a result of the Fund’s investment models, the Adviser may avoid investing in a given country for which the transaction costs of investing exceed the benefits of investing in that country.
Due to its investment strategy, the Fund may buy and sell securities frequently.
The Adviser uses data from a variety of sources, including data purchased from vendors and data accessed by the Adviser from alternative sources (e.g., data collected from public websites).
Such data are collected at varying frequencies (e.g., daily price data, quarterly financial statements) and considered over varying horizons, ranging from months to years, depending on the nature of the data in question.
The Adviser employs a proprietary data cleaning process, whereby data obtained from vendors and other sources is inspected for errors, processed to make information obtained from different sources useful in comparing various companies, sectors, and markets, and formatted for inclusion in the Adviser’s database and for use in its models.
The Adviser monitors its data and models through a combination of automated and manual checks.
The Adviser pays for data used in the strategy’s models.
The Adviser also takes into account certain environmental, social, and governance (“ESG”) criteria in choosing and weighting investments in the Fund, basing its evaluation on a combination of third-party data and proprietary metrics. ESG considerations that will impact the quantitative ranking of stocks may include (but are not limited to) evaluations of firms’ financial reporting practices (e.g., reducing the weight of companies suspected of manipulative accounting) and the degree of alignment between a firm’s managers and shareholders (e.g., whether managers are prone to wastefully reinvest the company’s earnings rather than distributing earnings to shareholders).
Governance characteristics will lead to either an increase or decrease of weight in a stock, depending on whether the Adviser determines that the company exhibits good or bad governance, respectively, on the basis of that characteristic.
In addition, the Fund will screen out the stock of companies that are identified by the Adviser as having extremely poor environmental performance (e.g., firms with exceedingly high CO2 emissions, energy intensity, water intensity, and waste generation).
Such exclusions will be made regardless of the expected future returns of stocks failing to meet the Fund’s ESG screening criteria.
Because the Fund’s universe of stocks is large relative to the number of companies expected by the Adviser to fail their ESG criteria, the Adviser does not expect screening on ESG to have a significant impact on the Fund’s ability to meet its investment objective.”

Emerging Markets Equity Investment Strategy Key Points
- Emerging Markets Universe = MSCI Emerging Markets Country List (25 currently): Brazil, Chile, China, Colombia, Czech Republic, Egypt, Greece, Hungary, India, Indonesia, Korea, Kuwait, Malaysia, Mexico, Peru, Philippines, Poland, Qatar, Russia, Saudi Arabia, South Africa, Taiwan, Thailand, Turkey and the United Arab Emirates
- Securities With Any Market Capitalization: Primary focus on mid- and large-capitalization securities
- Quantamental Approach: Combination of quantitative and fundamental investment strategies using large amounts of data and computer models
- Model Allocation: Screens for securities with potential higher risk-adjusted returns and excludes those with potential lower future risk-adjusted returns
- Active Management: Team may adjust portfolio weights for the Fund based on their own analysis of the securities
- Avoid Countries: The transaction costs of investing exceed the benefits of investing in that country
- ESG Considerations: Increase, decrease or exclusion of securities based on governance and environmental considerations
RAYE ETF: Holdings
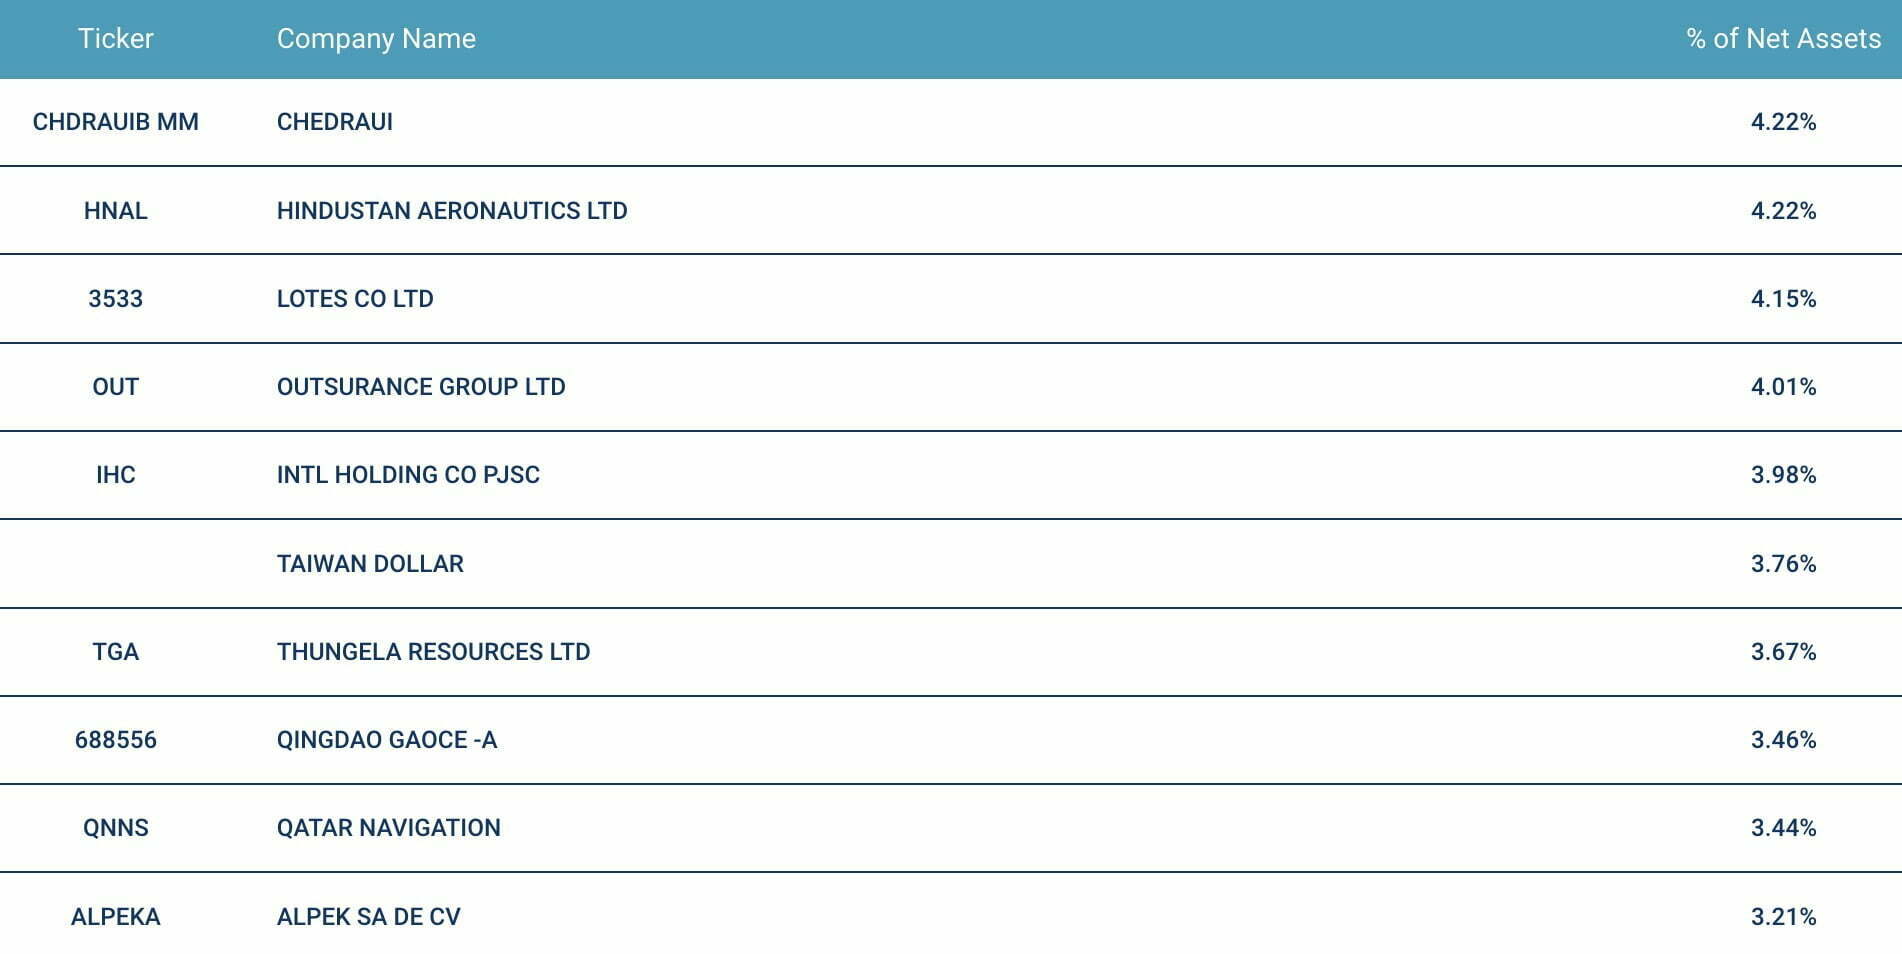
- Chedraui – 4.22%
- Hindustan Aeronautics LTD – 4.22%
- Lotes Co LTD – 4.15%
- Outsurance Group LTD – 4.01%
- Intl Holding Co PJSC – 3.98%
- Taiwan Dollar – 3.76%
- Thungela Resources LTD – 3.67%
- Qingdao Gaoce -A – 3.46%
- Qatar Navigation – 3.44%
- Alpek SA DE CV – 3.21%
The top 10 holdings of RAYE ETF range from 4.22% to 3.21%.
Overall the EM fund is a high conviction strategy featuring 100 positions.
This sets itself apart from Emerging Markets MCW funds that tend to be in the 1000s.
RAYE ETF: Sector Exposure
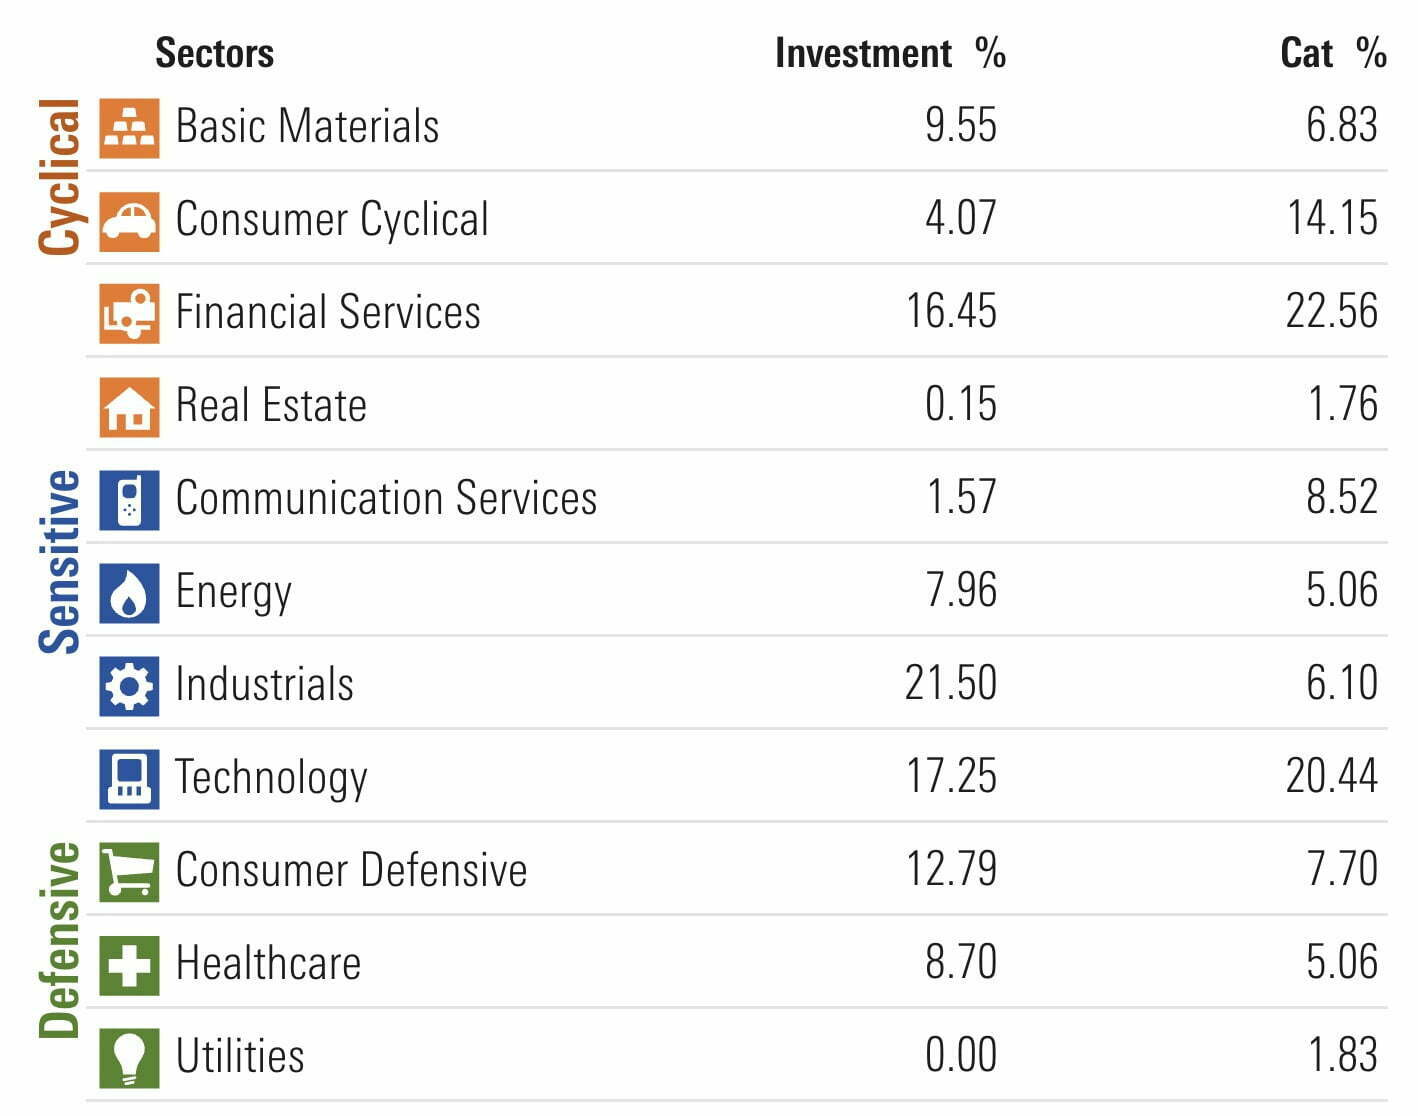
- Basic Materials (9.55 vs 6.83)
- Consumer Cyclical (4.07 vs 14.15)
- Financial Services (16.45 vs 22.56)
- Real Estate (0.15 vs 1.76)
- Communication Services (7.96 vs 5.06)
- Energy (6.54 vs 6.62)
- Industrials (21.50 vs 6.10)
- Technology (17.25 vs 20.44)
- Consumer Defensive (12.79 vs 7.70)
- Healthcare (8.70 vs 5.06)
- Utilities (0.00 vs 1.83)
In terms of sector exposure RAYE ETF is overweight Basic Materials, Communication Services, Industrials, Consumer Defensive and Healthcare versus Emerging Markets category averages.
On the other hand it is underweight Consumer Cyclical, Financial Services, Real Estate, Technology and Utilities.
Overall, the fund offers a nice balance between Cyclical, Sensitive and Defensive Sectors.
RAYE ETF: Country Exposure
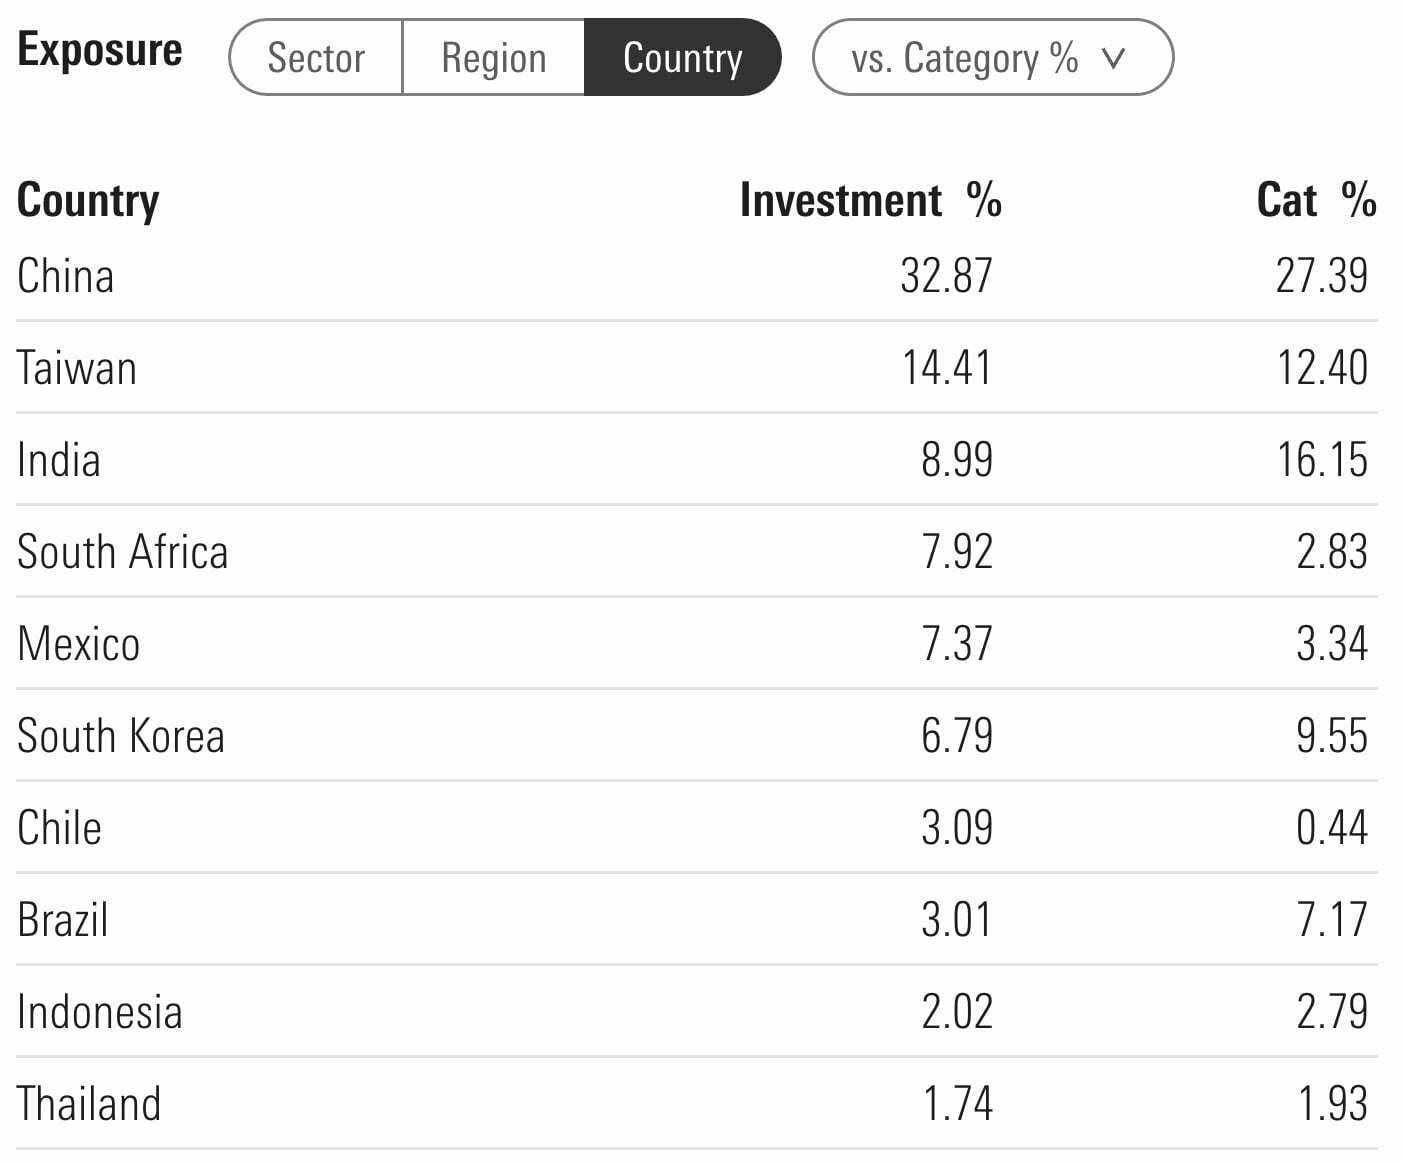
- China (32.87 vs 27.39)
- Taiwan (14.41 vs 12.40)
- India (8.99 vs 16.15)
- South Africa (7.92 vs 2.83)
- Mexico (7.37 vs 3.34)
- South Korea (6.79 vs 9.55)
- Chile (3.09 vs 0.44)
- Brazil (3.01 vs 7.17)
- Indonesia (2.02 vs 2.79)
- Thailand (1.74 vs 1.93)
RAYE ETF offers investors slightly overweight exposure to China, Taiwan, South Africa, Mexico and Chile.
Conversely, it is underweight India, South Korea and Brazil compared to its EM category averages.
RAYE ETF Info
Ticker: RAYE
Positions: 100
Net Expense Ratio: 0.80
AUM: 18.6 Million
Inception: 12/15/2021
RAYE ETF – Style Measures
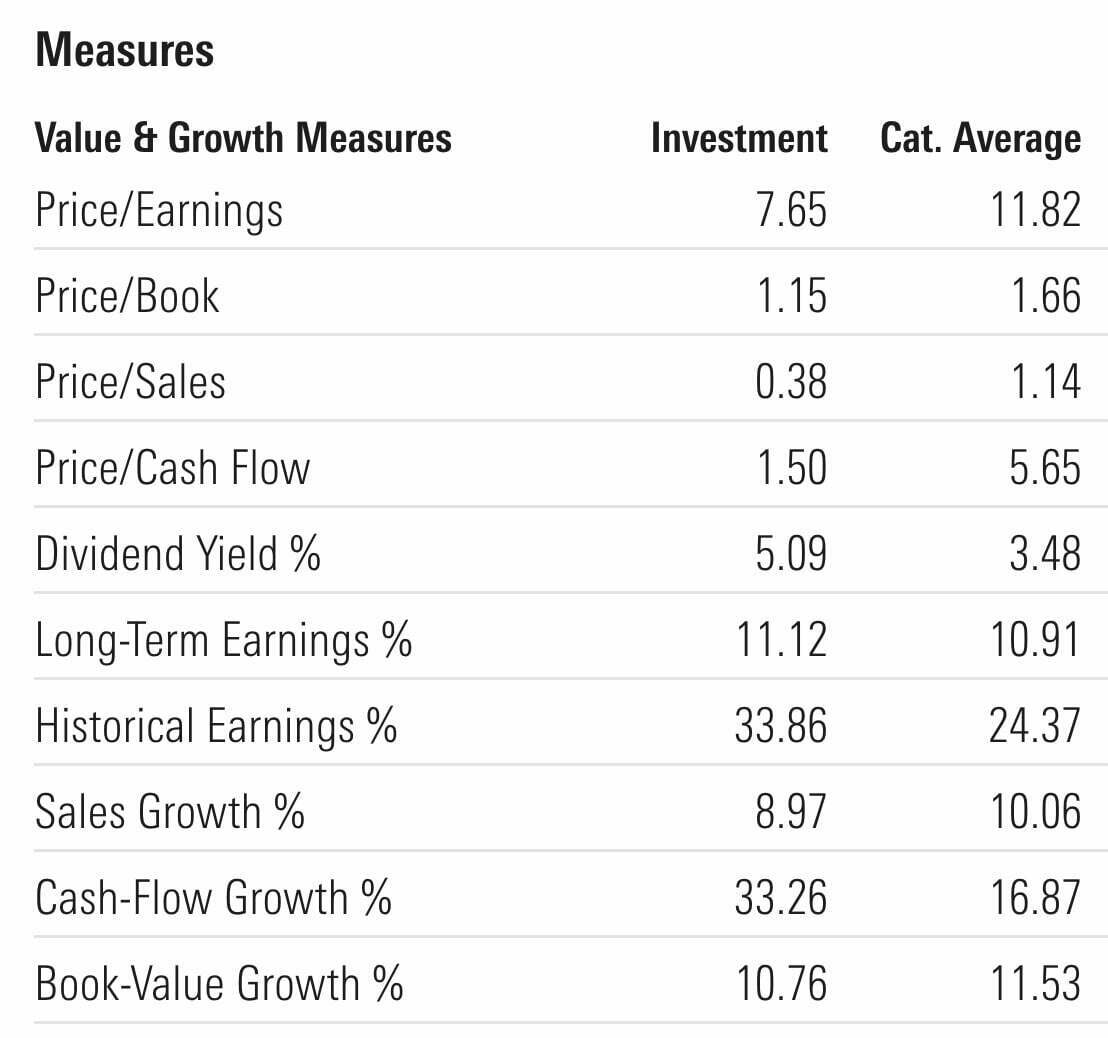
- Price/Earnings (7.65 vs 11.82)
- Price/Book (1.15 vs 1.66)
- Price/Sales (0.38 vs 1.14)
- Price/Cash Flow (1.50 vs 5.65)
- Dividend Yield % (5.09 vs 3.48)
- Long-Term Earnings % (11.12 vs 10.91)
- Historical Earnings % (33.86 vs 24.37)
- Sales Growth % (8.97 vs 10.06)
- Cash-Flow Growth % (33.26 vs 16.87)
- Book-Value Growth % (10.76 vs 11.53)
Rayliant Emerging Market Equity ETF offers investors highly attractive measures such as P/E, P/B, P/S and P/CF versus its category EM average where lower figures are better.
The advantages don’t stop with regards to Dividend Yield, Historical Earnings % and Cash-Flow Growth % where higher scores are optimal.
RAYE ETF – Stock Style Box
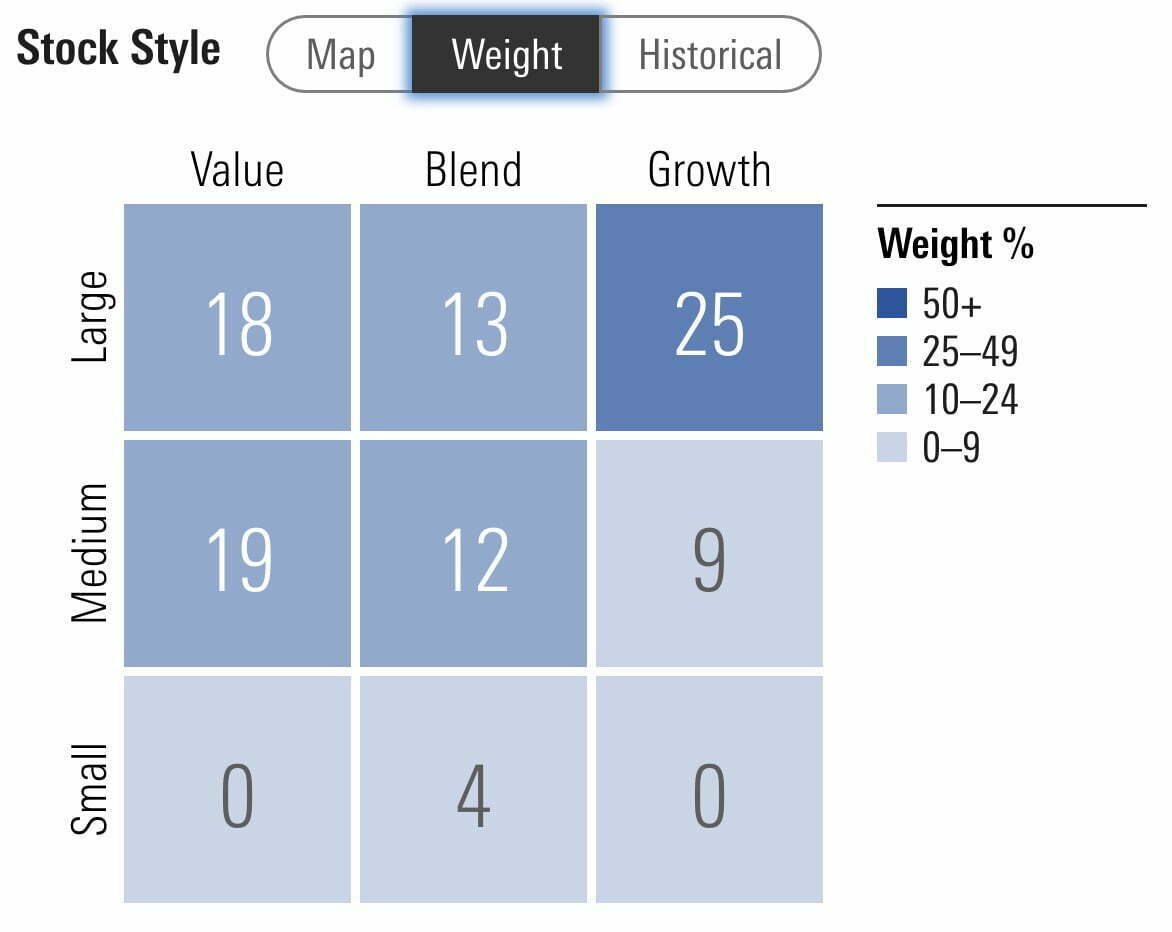
Rayliant Quantamental Emerging Market Equity ETF offers investors mostly large cap and mid cap exposure spread out over value, blend and growth.
RAYE ETF commits 56% of its resources to large cap equities with 40% mid-cap exposure and 4% reserved towards small-caps.
It’s fascinating how the fund offers investors a balanced 37% Value and 34% Growth.
Most of its Growth tilt is large cap centric whereas it hangs out in value territory more with mid-caps.
Given that the fund has a 7.65 P/E it’s a fascinating combination of value and growth at a reasonable price.
RAYE ETF – Factor Profile
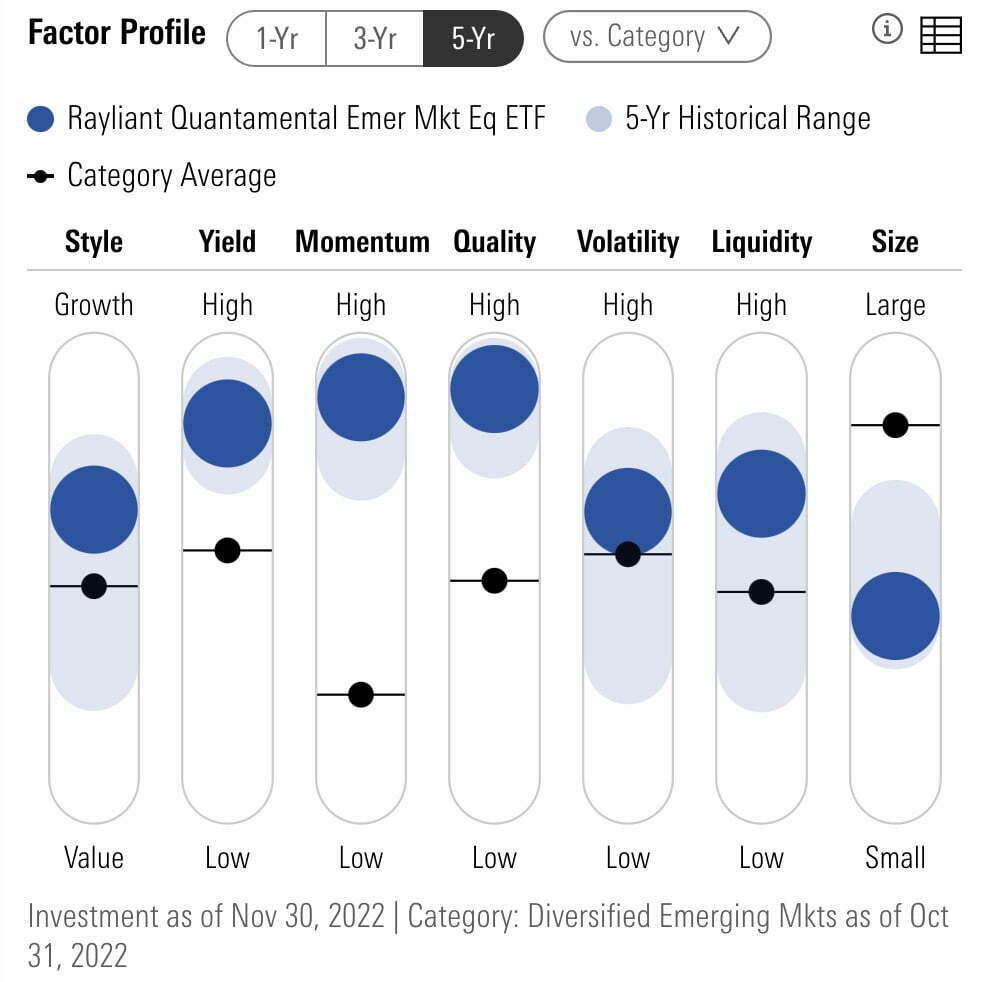
RAYE ETF is a multi-factor powerhouse offering investors hard-lever pulls especially towards Quality and Momentum.
As we’ve discussed earlier, it allocates almost evenly to value and growth at a reasonable price (GARP) companies.
This distinguishes itself from other funds which tend to either be all in on value or hog wild on growth.
I believe this balanced approach is unique and potentially advantageous for investors that don’t insist on choosing sides.
The fund also offers attractive yield and size exposure compared to Emerging Markets category averages.
RAYE ETF – Factor Analysis: 36 Month Regressions
Let’s explore RAYE ETF in further detail by checking out its factor analysis from several different sources on Portfolio Visualizer.
RAYE ETF vs VWO ETF vs IEMG ETF
Fama-French Research Factors
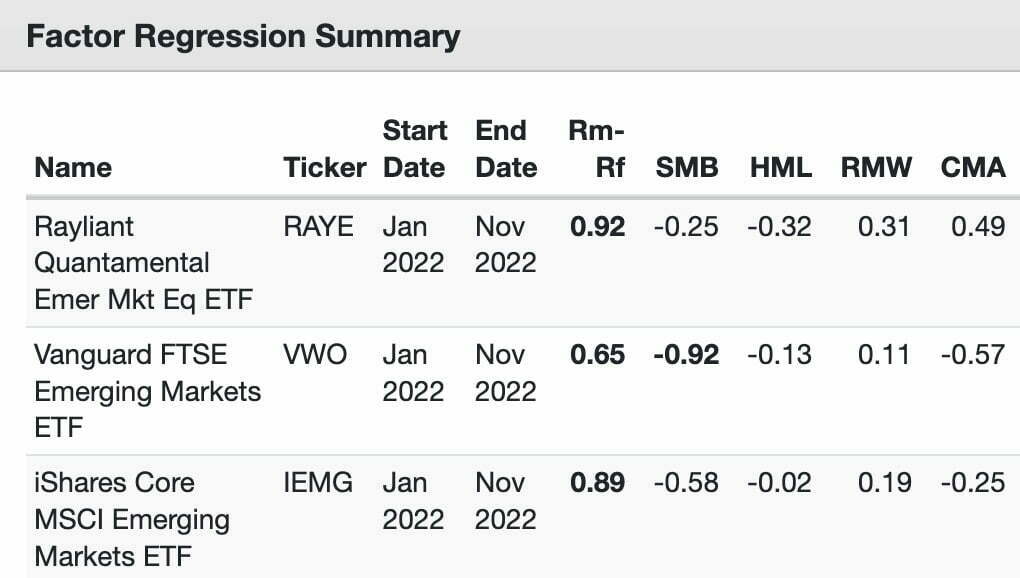
Size (SMB): RAYE (-0.25) / VWO (-0.92) / IEMG (0.58)
Value (HML): RAYE (-0.32) / VWO (-0.13) / IEMG (-0.02)
Profitability (RMW): RAYE (0.31) / VWO (0.11) / IEMG (0.19)
Investment (CMA): RAYE (0.49) / VWO (-0.57) / IEMG (-0.25)
RAYE ETF with its focussed 100 positions absolutely crushes MCW VWO ETF and IEMG ETF in terms of Investment (CMA) and Profitability (RMW).

RAYE ETF Performance
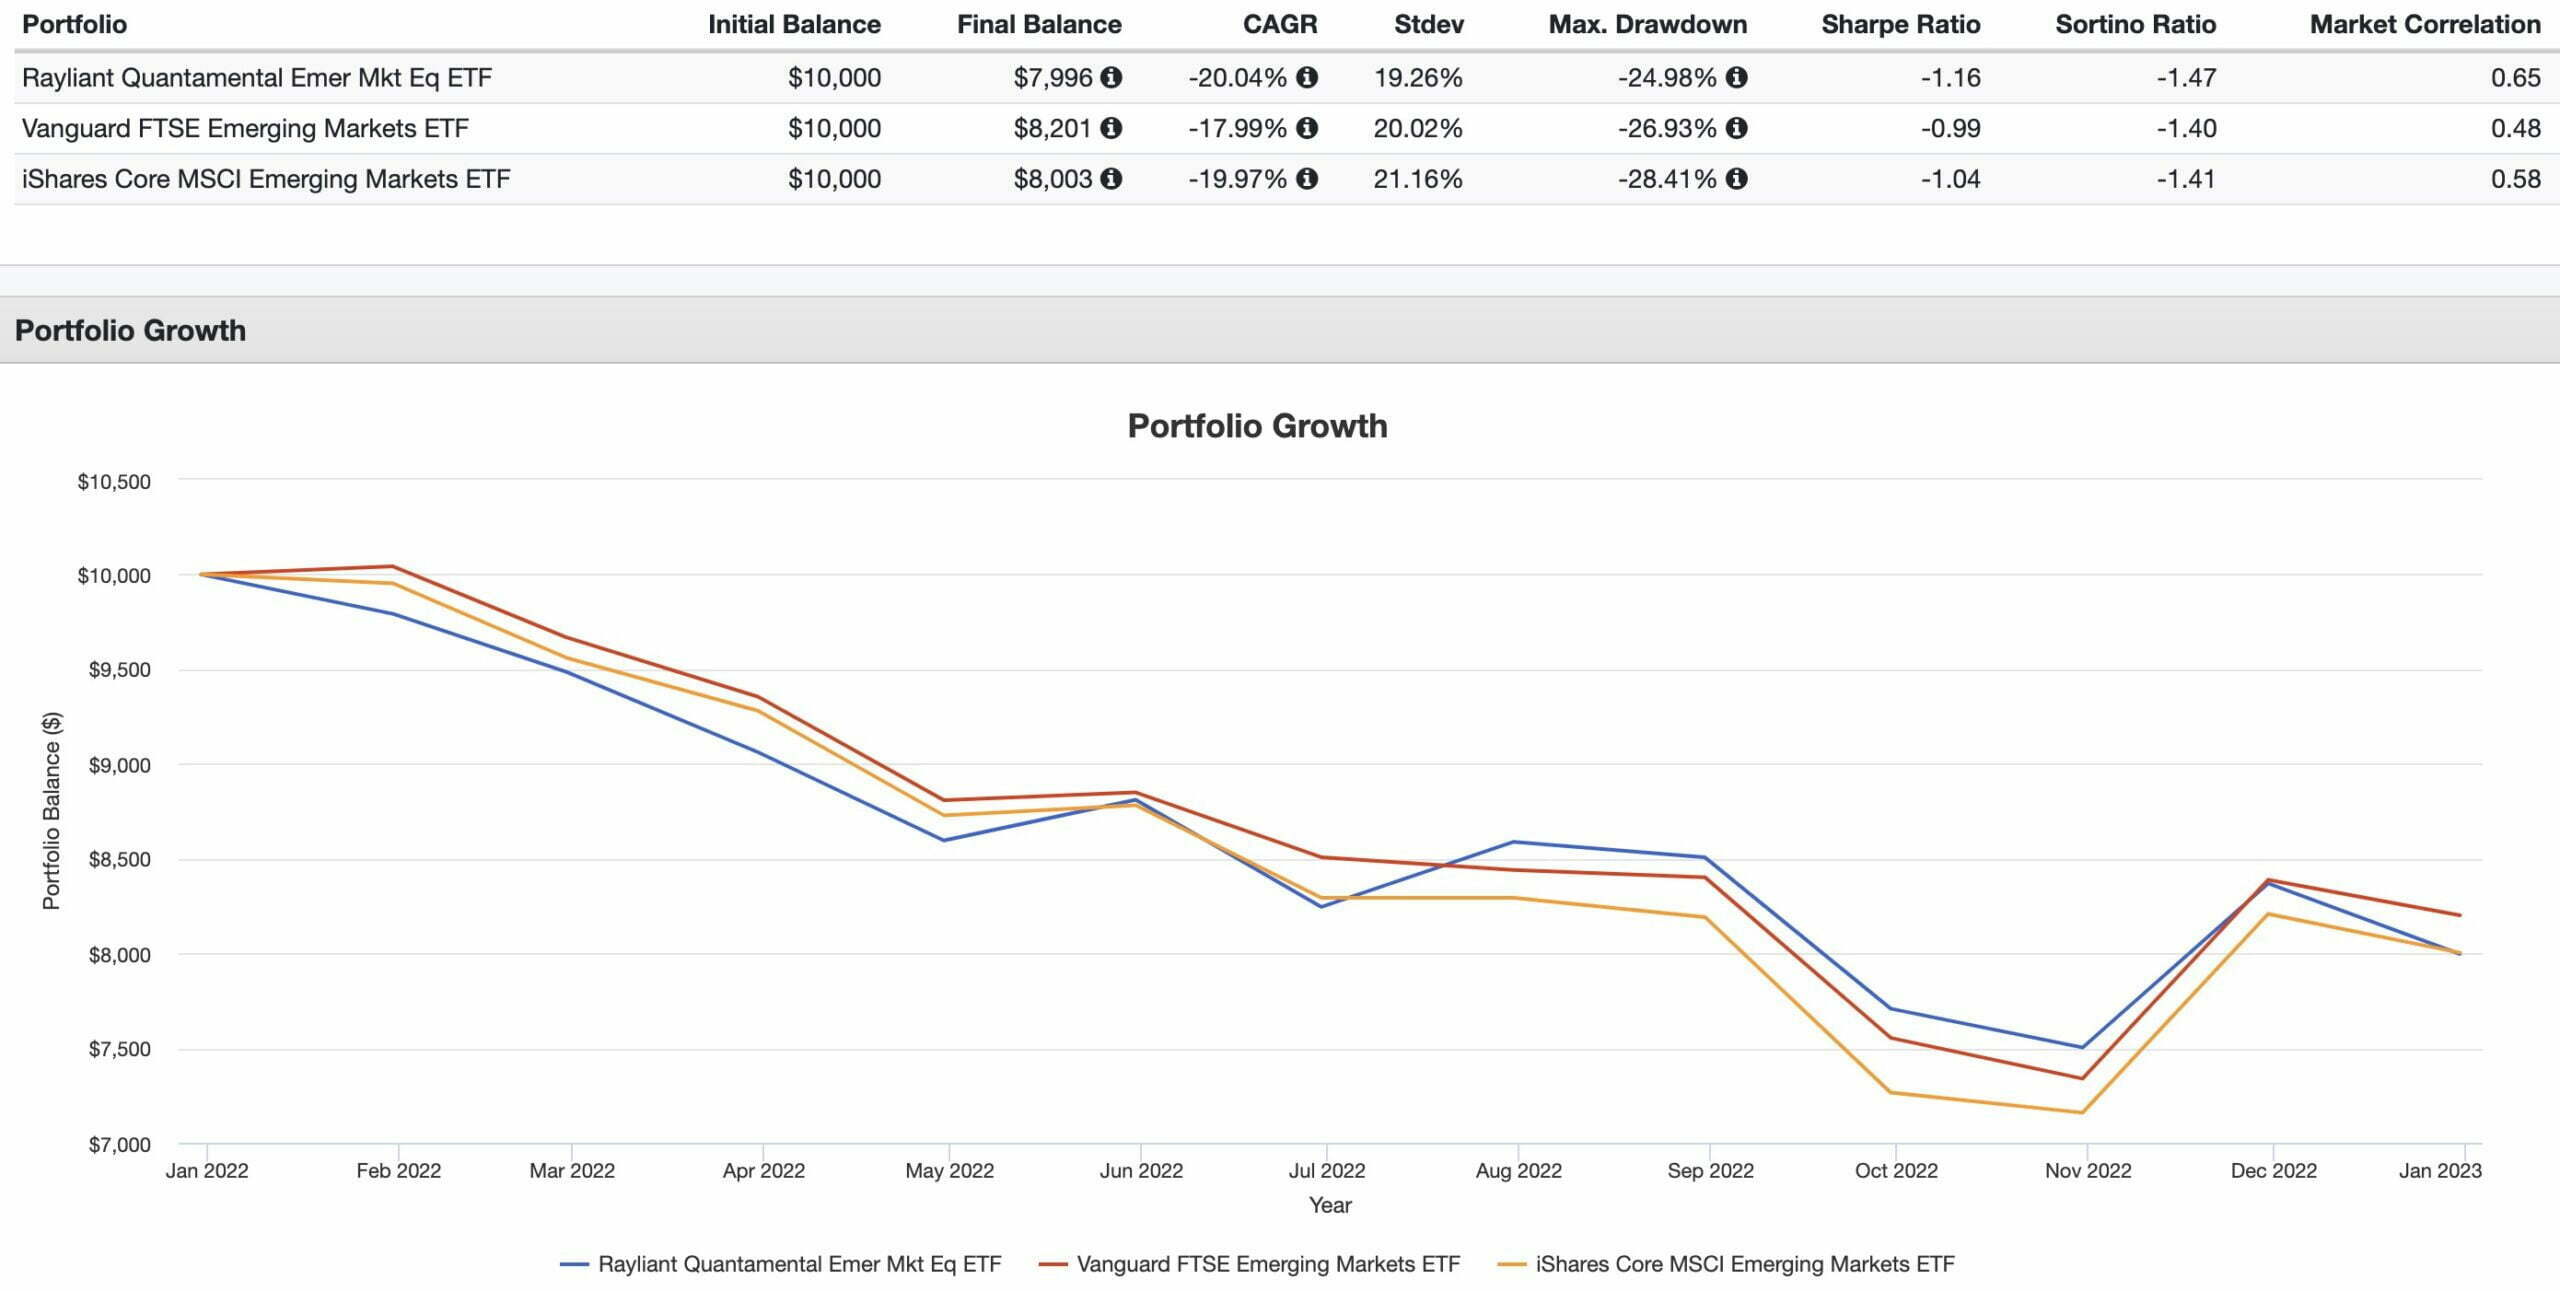
CAGR: RAYE (-20.04%) / VWO (-17.99%) / IEMG(-19.97%)
STDEV: RAYE (19.26%) / VWO (20.02%) / IEMG (21.16%)
MAX DRAWDOWN: RAYE (-24.98%) / VWO (-26.93%) / IEMG (-28.41%)
SHARPE RATIO: RAYE (-1.16) / VWO (-0.99) / IEMG (-1.04)
SORTINO RATIO: RAYE (-1.47) / VWO (-1.40.) / IEMG (-1.41)
MARKET CORRELATION: RAYE (0.65) / VWO (0.48) / IEMG (0.58)
RAYE ETF is a relative newcomer to the ETF marketplace and it unfortunately launched weeks prior to 2022.
It’s only been in existence during challenging market conditions and it got hammered just like market cap weighted Emerging Markets VWO ETF and IEMG ETF.
Although it performed slightly worse, it offered investors better risk management with a less ferocious maximum drawdown.
Considering it is a more concentrated 100 position fund, that is quite remarkable.
It’ll be fun to revisit this fund review when conditions have been a bit more favourable for markets around the world.

RAYE ETF Pros and Cons
Let’s move on to examine the potential pros and cons of RAYE ETF.
RAYE Pros
- Emerging Markets and China specialist in Rayliant Asset Management combining quantitative and fundamental investment strategies
- Out of 79 Emerging Markets ETFs it ranked 1st for Momentum (2-12) and FS score while finishing in the top 10 for EBIT/TEV, Earnings/Price and ROA (Return On Assets)
- An impressive factor profile with hard lever pulls with regards to quality and momentum while also offering investors attractive yield and size compared to EM category averages
- A unique combination of value and growth at a reasonable price (GARP) through the filter of a quality screen
- High conviction 100 position fund versus watered down Emerging Markets core offerings
- Historically lower correlation to US Markets than International-Developed strategies = improves portfolio diversification
- Attractive valuation spread with Emerging Markets currently offer lower forward P/E versus US Markets
- The opportunity for active management factor tilted strategies to potentially thrive in less efficient markets
- Chance to support a boutique fund provider that provides a unique strategy and skillset
RAYE Cons
- Higher fees than what most index investors would be used to paying
- Potential tracking error with a higher conviction fund along with greater volatility of Emerging Markets in general

RAYE ETF Potential Model Portfolio Solution
These asset allocation ideas and model portfolios presented herein are purely for entertainment purposes only. This is NOT investment advice. These models are hypothetical and are intended to provide general information about potential ways to organize a portfolio based on theoretical scenarios and assumptions. They do not take into account the investment objectives, financial situation/goals, risk tolerance and/or specific needs of any particular individual.
For investors intrigued by RAYE ETF it might make sense to pair it with its Developed Markets sibling RAYD ETF.
A diversified model portfolio might look something like this:
40% RAYD
20% RAYE
30% KMLM
10% BTAL
Our globally diversified equities mandate would be covered entirely by Rayliant funds handcuffed to a managed futures and anti-beta market neutral strategy.
We’ve only got 1 year of performance to backtest but we’ll send things over to Portfolio Visualizer anyways!
RAYE ETF and Friends Portfolio versus AOM Balanced Portfolio
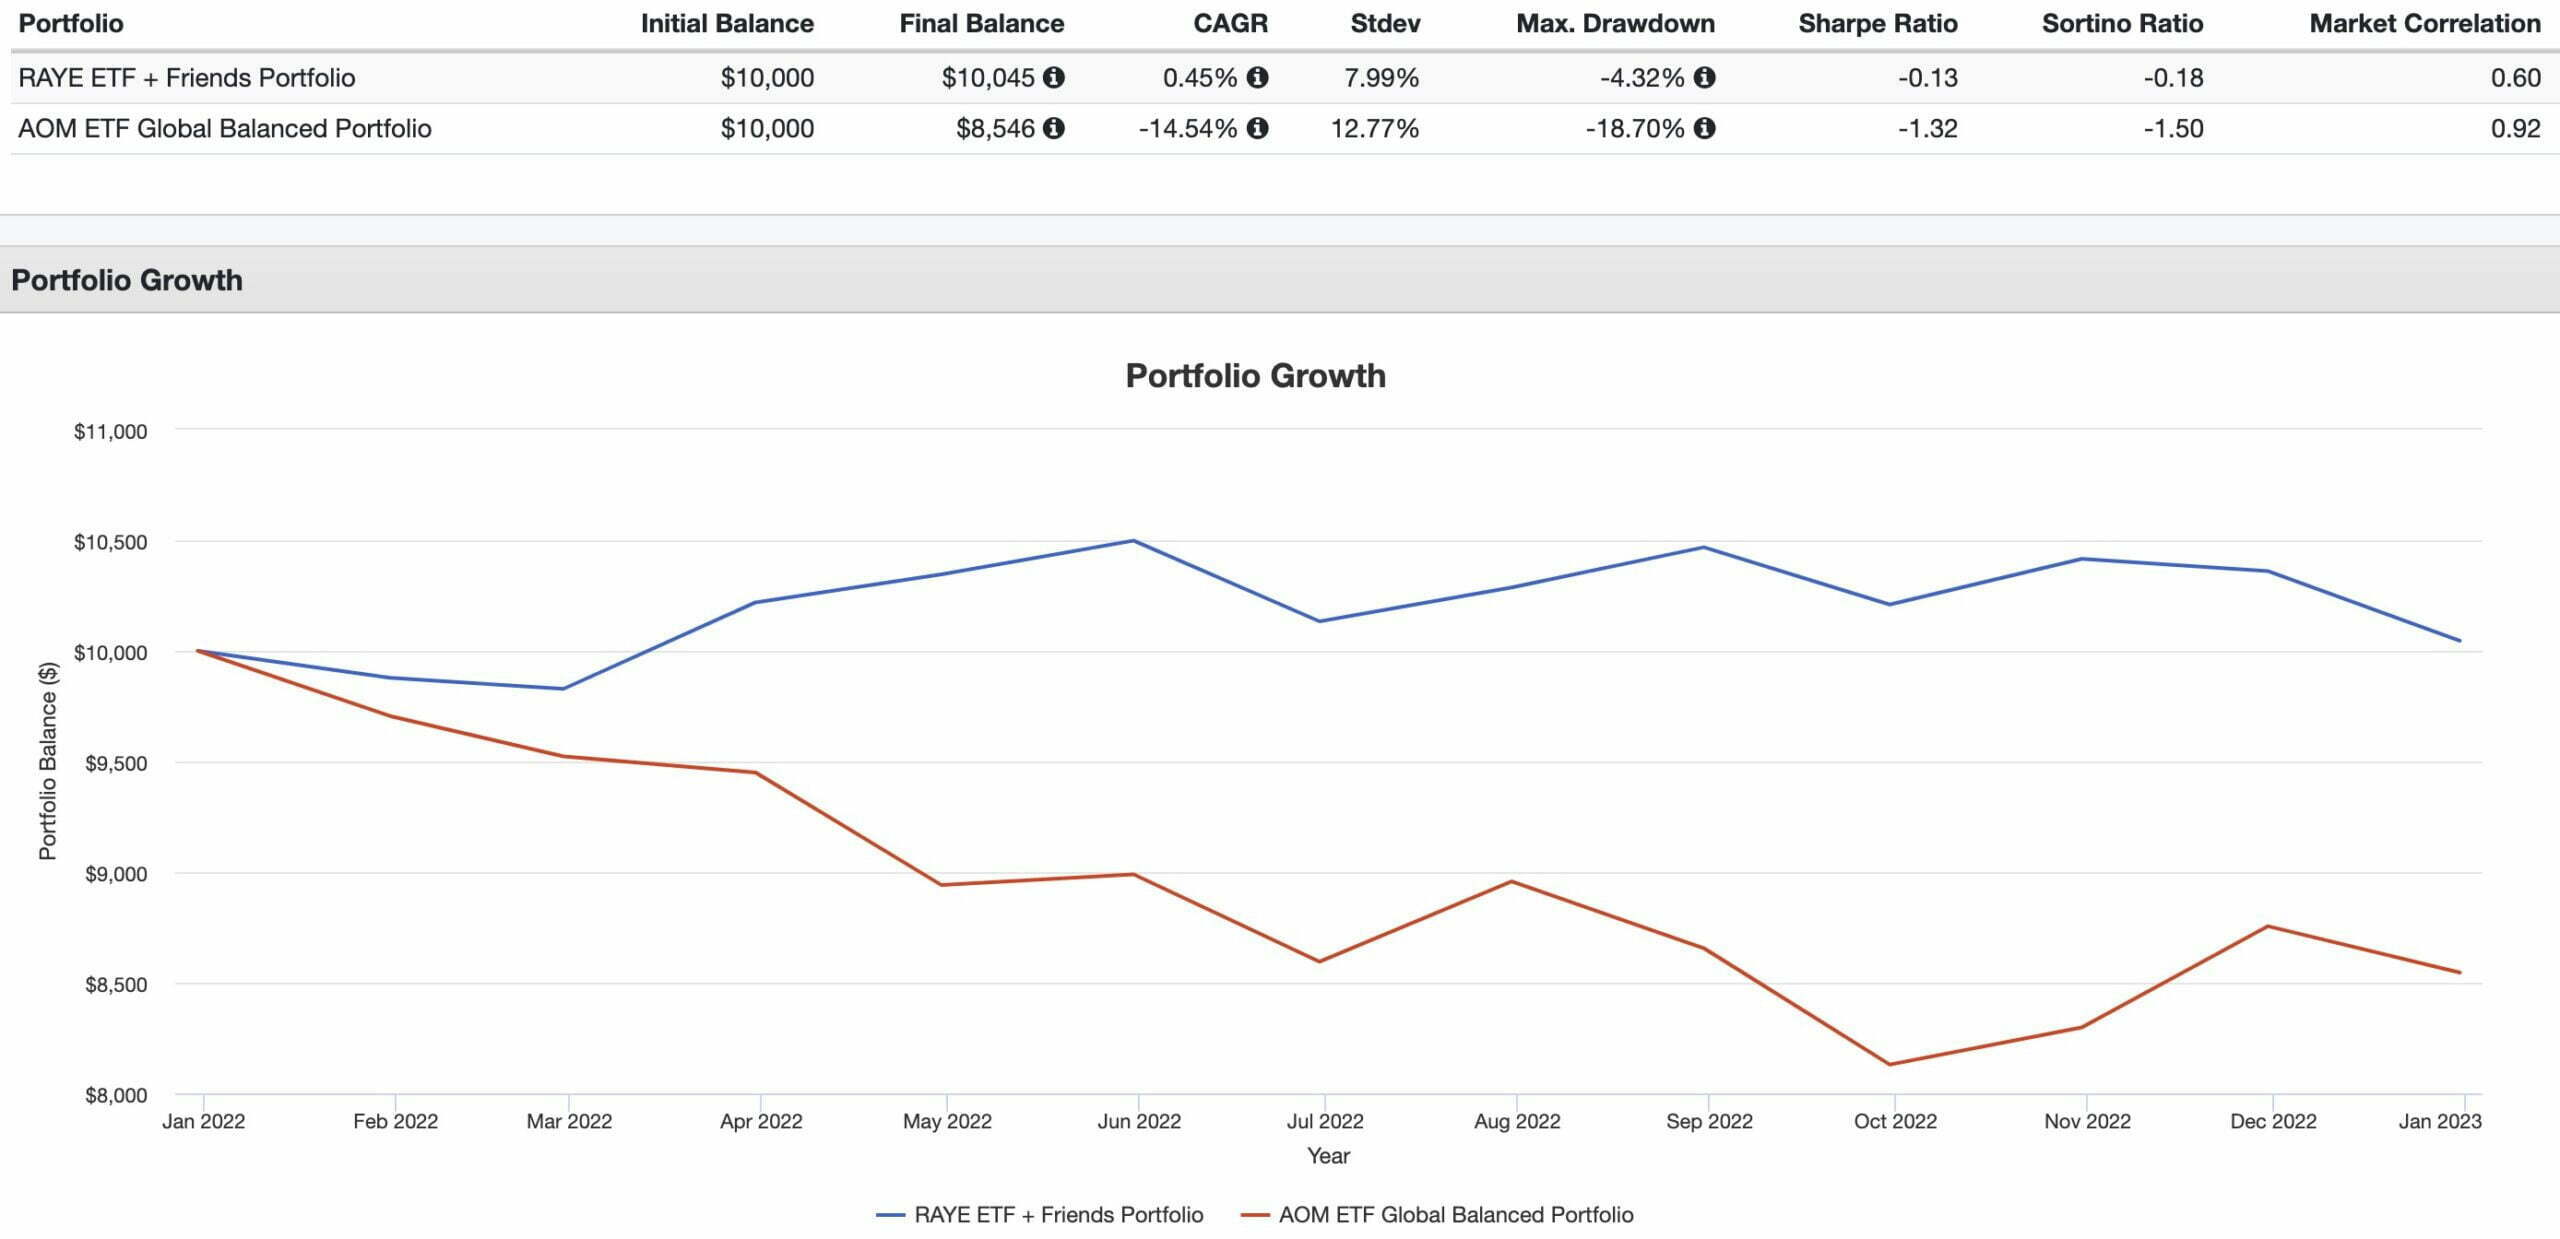
CAGR: 0.45% vs -14.54%
RISK: 7.99% vs 12.77%
MAX DRAWDOWN: -4.32% vs -18.70%
SHARPE RATIO: -0.13 vs -1.32
SORTINO RATIO: -0.18 vs -1.50
MARKET CORRELATION: 0.60 vs 0.92
Here we can clearly see that our RAYE ETF and Friends Portfolio navigated 2022 better than a milquetoast balanced fund.
By being more strategically diversified and less correlated to markets it delivered returns just above water.
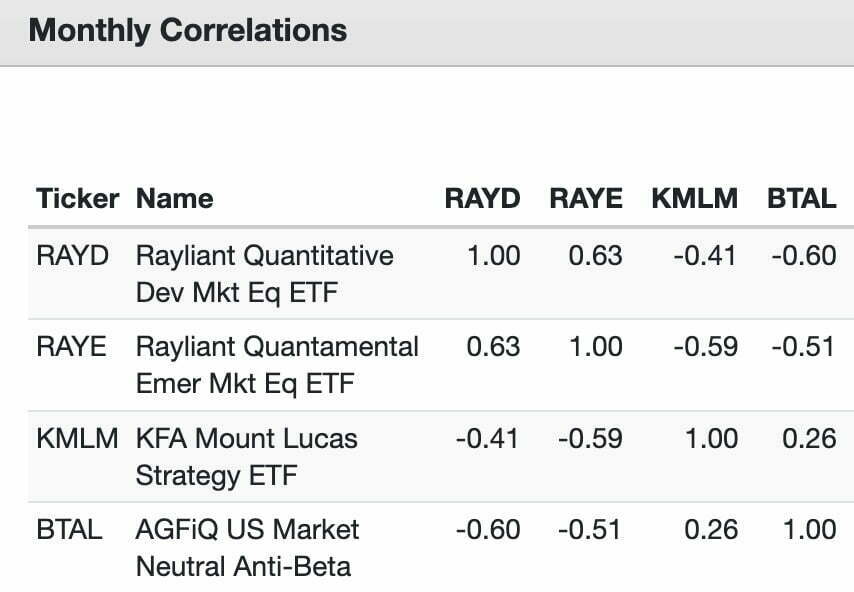
Furthermore, we’re able to see that correlations between the four funds offer investors impressive diversification benefits.
More Information About Rayliant Global Advisors
Now that we’ve covered a few different portfolio solutions here is some additional information about Rayliant Global Advisors who prefer video format.
source: Meb Faber Show on YouTube
source: Excess Returns on YouTube
source: Rayliant on YouTube

Nomadic Samuel Final Thoughts
I’m always excited to discover new funds that I feel offer investors something unique.
We’re in an industry plagued by groupthink and copycat strategies where most fund providers play it safe with market cap weighted indexes.
Even certain smart beta strategies sometimes feel all to similar to one another.
Rayliant isn’t succumbing to either of those two issues.
It offers investors a fascinating blend of value and growth at a reasonable price with maximum exposure to momentum and quality.
Moreover, it’s a high conviction strategy featuring 100 positions rather than 1000s.
Honestly, when I’ve compared it head to head with other Emerging Markets funds it’s at the top of the mountain.
There are some other excellent funds, from a factor perspective, such as FEMS ETF and EYLD ETF.
However, it’s rare to find a fund that leads its entire universe (79 other EM ETFs) in two distinct categories.
Momentum (2-12) and FS Score.
Also, I’m intrigued by the firm’s dedication towards zeroing in on Emerging Markets and China in particular.
I know this is debatable but there is a case to be made about Emerging Markets potentially being less efficient.
But at this point in the review I’m more interested in what you’ve got to say.
What do you think about investing in Emerging Markets?
Is RAYE ETF on your radar of funds for consideration?
Please let me know in the comments below.
That’s all I’ve got for today.
Ciao for now.
Important Information
Comprehensive Investment Disclaimer:
All content provided on this website (including but not limited to portfolio ideas, fund analyses, investment strategies, commentary on market conditions, and discussions regarding leverage) is strictly for educational, informational, and illustrative purposes only. The information does not constitute financial, investment, tax, accounting, or legal advice. Opinions, strategies, and ideas presented herein represent personal perspectives, are based on independent research and publicly available information, and do not necessarily reflect the views or official positions of any third-party organizations, institutions, or affiliates.
Investing in financial markets inherently carries substantial risks, including but not limited to market volatility, economic uncertainties, geopolitical developments, and liquidity risks. You must be fully aware that there is always the potential for partial or total loss of your principal investment. Additionally, the use of leverage or leveraged financial products significantly increases risk exposure by amplifying both potential gains and potential losses, and thus is not appropriate or advisable for all investors. Using leverage may result in losing more than your initial invested capital, incurring margin calls, experiencing substantial interest costs, or suffering severe financial distress.
Past performance indicators, including historical data, backtesting results, and hypothetical scenarios, should never be viewed as guarantees or reliable predictions of future performance. Any examples provided are purely hypothetical and intended only for illustration purposes. Performance benchmarks, such as market indexes mentioned on this site, are theoretical and are not directly investable. While diligent efforts are made to provide accurate and current information, “Picture Perfect Portfolios” does not warrant, represent, or guarantee the accuracy, completeness, or timeliness of any information provided. Errors, inaccuracies, or outdated information may exist.
Users of this website are strongly encouraged to independently verify all information, conduct comprehensive research and due diligence, and engage with qualified financial, investment, tax, or legal professionals before making any investment or financial decisions. The responsibility for making informed investment decisions rests entirely with the individual. “Picture Perfect Portfolios” explicitly disclaims all liability for any direct, indirect, incidental, special, consequential, or other losses or damages incurred, financial or otherwise, arising out of reliance upon, or use of, any content or information presented on this website.
By accessing, reading, and utilizing the content on this website, you expressly acknowledge, understand, accept, and agree to abide by these terms and conditions. Please consult the full and detailed disclaimer available elsewhere on this website for further clarification and additional important disclosures. Read the complete disclaimer here.



Meh. I’d take either EDIV, EYLD or FRDM over RAYE.
https://testfol.io/?d=eJy9jzFPw0AMhf%2BL5xvCwnAbUtoJJNQtQlXk5nzhwPUV35GqivLfMQQJxMCE8OSnZ73veYaR8wH5HhWPBfwMpaLWPmAl8AAOSMI3tboTMvirxsYBhqc%2BSWSsKQv4iFzIwYDlMXI%2Bg2%2B%2BRB%2BVXiynI1S%2BWJpm5iRjf04S3m%2Bvm8XBKWuNmVO2Og8zCB4%2F2UkmKrVNUwpWytyqr4ZSsv4oA21%2FpNc0PJOuKetu7u6m25h3Ih1I6scXy95BUByt6%2BL%2BHLjpbtt%2FBW537d0vwP3yBparpok%3D