I’m more aware of investors and funds that utilize quality as a secondary screen for a value or growth strategy.
However, it is rare to find investors that prioritize quality as their primary factor.
And that’s kind of shocking given how well a quality factor approach has done historically (both globally and domestically) when compared to market cap weighted and other factor strategies.
That begs the question, how does one screen for quality as an equity optimization strategy?
Typically, a high quality strategy will key in on three particular fundamental variables:
- High Return On Equity
- Earnings Growth
- Low Financial Leverage
The fund we’ll be reviewing today is iShares MSCI USA Quality Factor ETF.
AKA QUAL ETF.
It’s a factor strategy that screens for high quality growth stocks within its parent MSCI USA Index reliant upon the 3 fundament variables we covered above.
In this ETF review we’ll explore how a quality factor based investing strategy can potentially enhance a portfolio at large.

QUAL ETF Review | iShares MSCI USA Quality Factor ETF Review

Hey guys! Here is the part where I mention I’m a travel blogger, vlogger and content creator! This investing opinion blog post ETF Review is entirely for entertainment purposes only. There could be considerable errors in the data I gathered. This is not financial advice. Do your own due diligence and research. Consult with a financial advisor.
source: Yale School Of Management on YouTube

iShares ETFs: Quality Factor Funds
I’ve just realized this is my first fund review from iShares.
As one of the Goliath ETF providers, I don’t feel the need to pump their tires.
As a fund provider they offer an enormous product range with everything from vanilla to factor focused funds for investors.
Instead let’s focus on their “quality” roster of funds and other factor funds they have on tap.
Quality ETFs
QUAL ETF – iShares MSCI USA Quality Factor ETF
IQLT ETF – iShares MSCI Intl Quality Factor ETF
There are just two quality ETFs!
The fund we’re reviewing today and an International Developed version.
It would be nice to see them expand the range by offering an Emerging Markets Quality ETF.
Here are some of the factor funds they provide that investors can potentially consider for US equities.
US Factor Funds
USMV ETF – iShares MSCI USA Min Vol Factor ETF
DGRO ETF – iShares Core Dividend Growth ETF
MTUM ETF – iShares MSCI USA Momentum Factor ETF
VLUE ETF – iShares MSCI USA Value Factor ETF
LRGF ETF – iShares U.S. Equity Factor ETF
SMLF ETF – iShares MSCI USA Small-Cap Multifactor ETF
SMMV ETF – iShares MSCI USA Small-Cap Min Vol Factor ETF
SIZE ETF – iShares MSCI USA Size Factor ETF
SVAL ETF – iShares US Small Cap Value Factor ETF
DYNF ETF – BlackRock U.S. Equity Factor Rotation ETF
That’s actually quite an impressive list of factor funds!
I’ve just sorted them by AUM but you have a menu offering factor exposure to minimum volatility, dividend, momentum, value, size, multi-factor and rotation.

The Case For QUALITY Factor Investing
One of the best resources for learning more about factor investing is the MSCI Factor In Focus Series which I highly encourage investors read.
When comparing Global Quality to other Global Factors one can’t help but notice its long-term outperformance and defensive qualities offering a unique 1-2 combination of right hook and left uppercut.
Global Quality Long-Term Performance
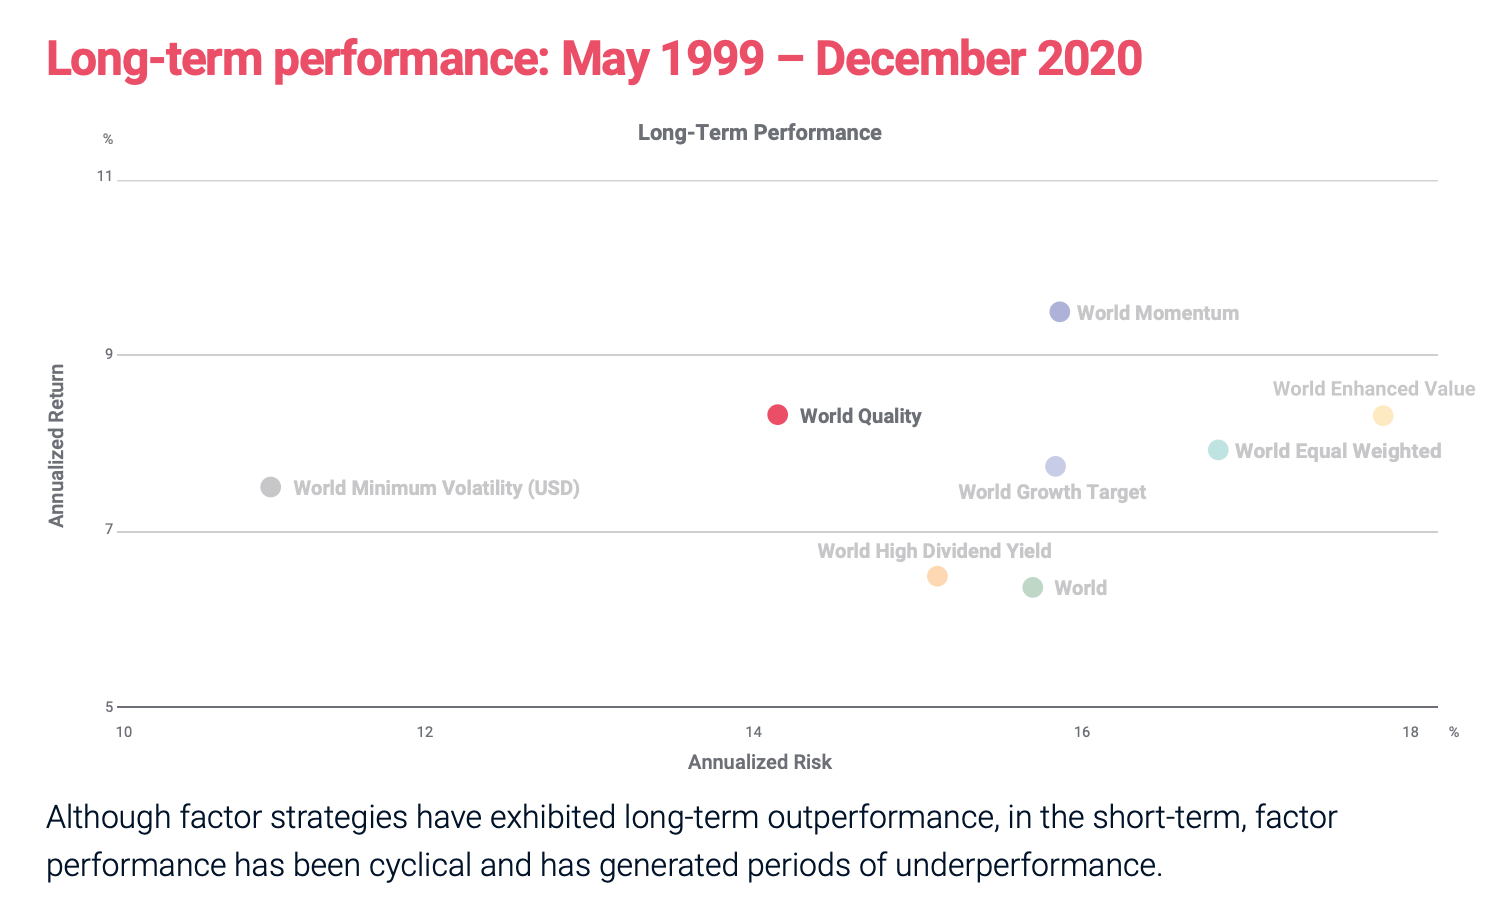
Although World Momentum and World Enhanced Value offer returns equal to or greater than World Quality, they are far less defensive in nature.
With an annualized risk of just over 14%, World Quality is the second most defensive fund out of eight and tied for second place in terms of performance.
An offensive and defensive powerhouse.
How can that be?
Quality = Defensive Factor Strategy
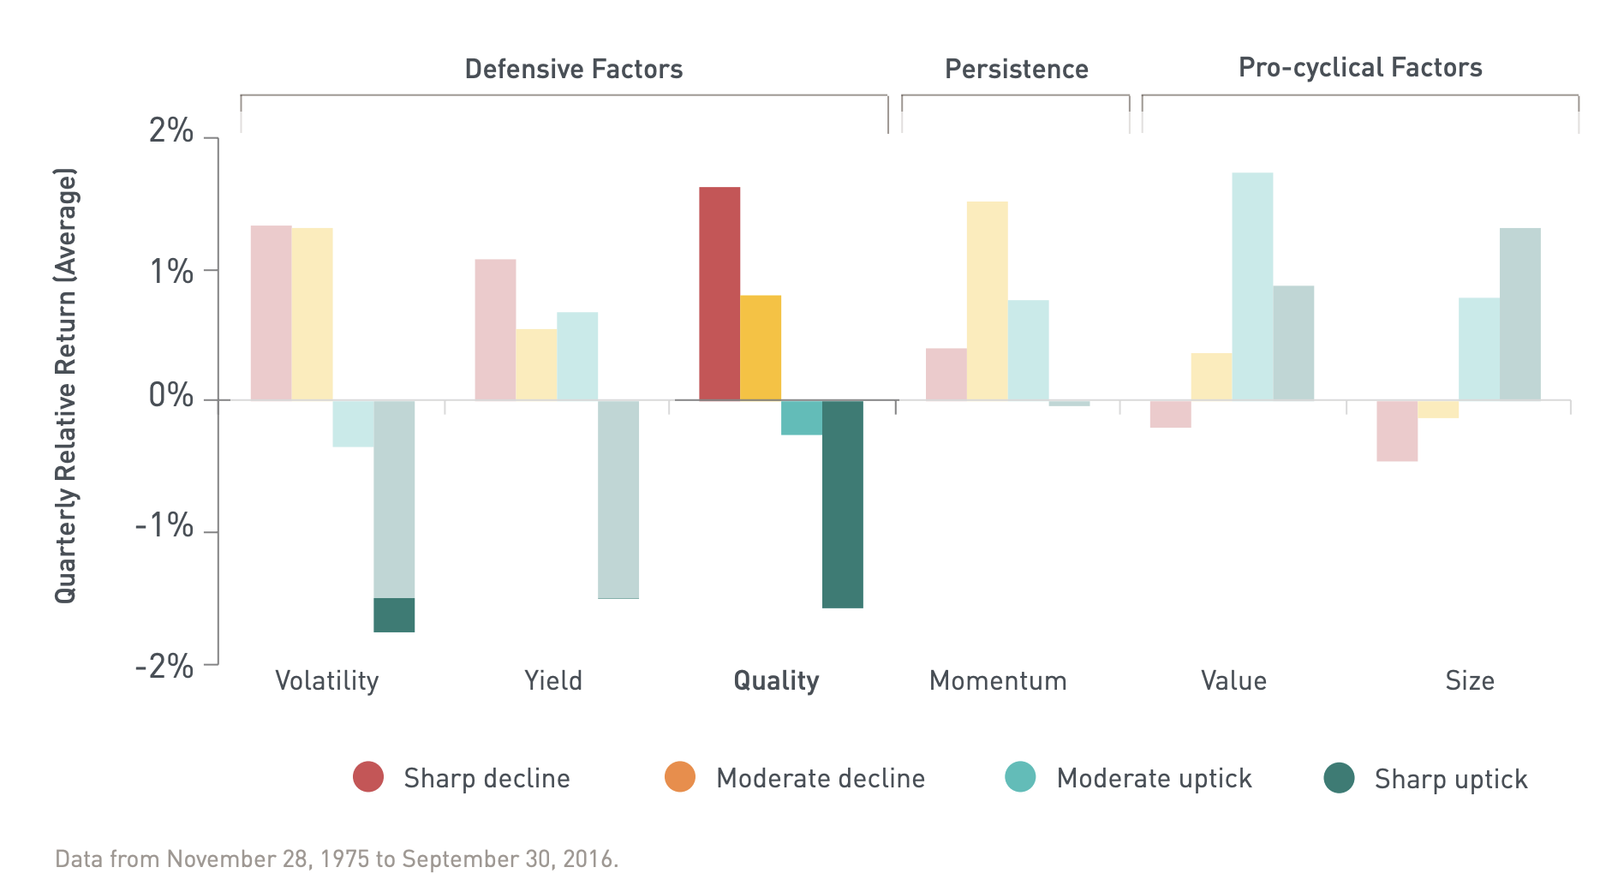
Quality is a defensive factor strategy that shares the spotlight with Minimum Volatility and Yield Strategies.
Contrast that with Momentum which is a Persistence factor, and Value and Size which are Pro-Cyclical factors.
Hence, its abilities to outperform and defend make it rather unique as a factor.
Moreover, it presents itself to factor investors as an intriguing puzzle piece to pair with other strategies.
For instance, combining Quality with Value and Momentum offers
investors Defensive, Persistence and Pro-Cyclical coverage.
Quality Factor Long-Term Performance
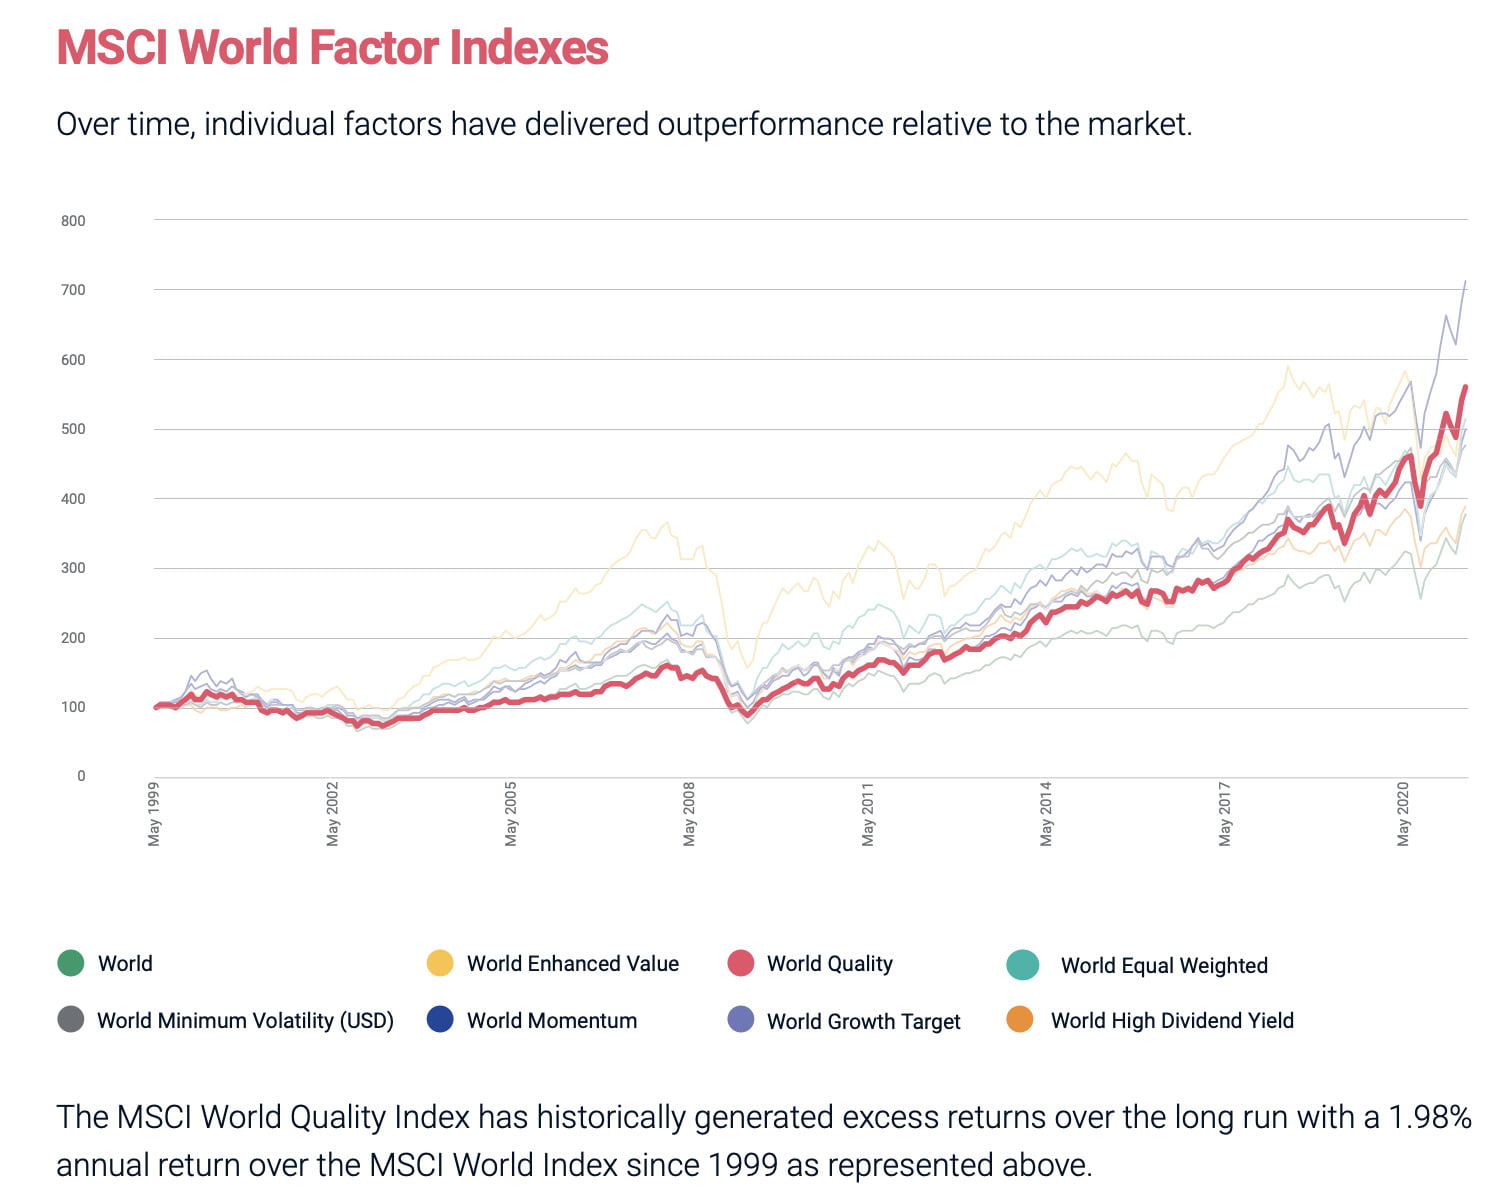
World Quality factor investing has historically driven excess returns of 198 basis points versus the market-cap weighted parent index.
However, as with all factor strategies, investor’s need to be extremely patient and persistent through inevitable periods of relative underperformance.
Quality Annual Performance vs Other Factor Strategies
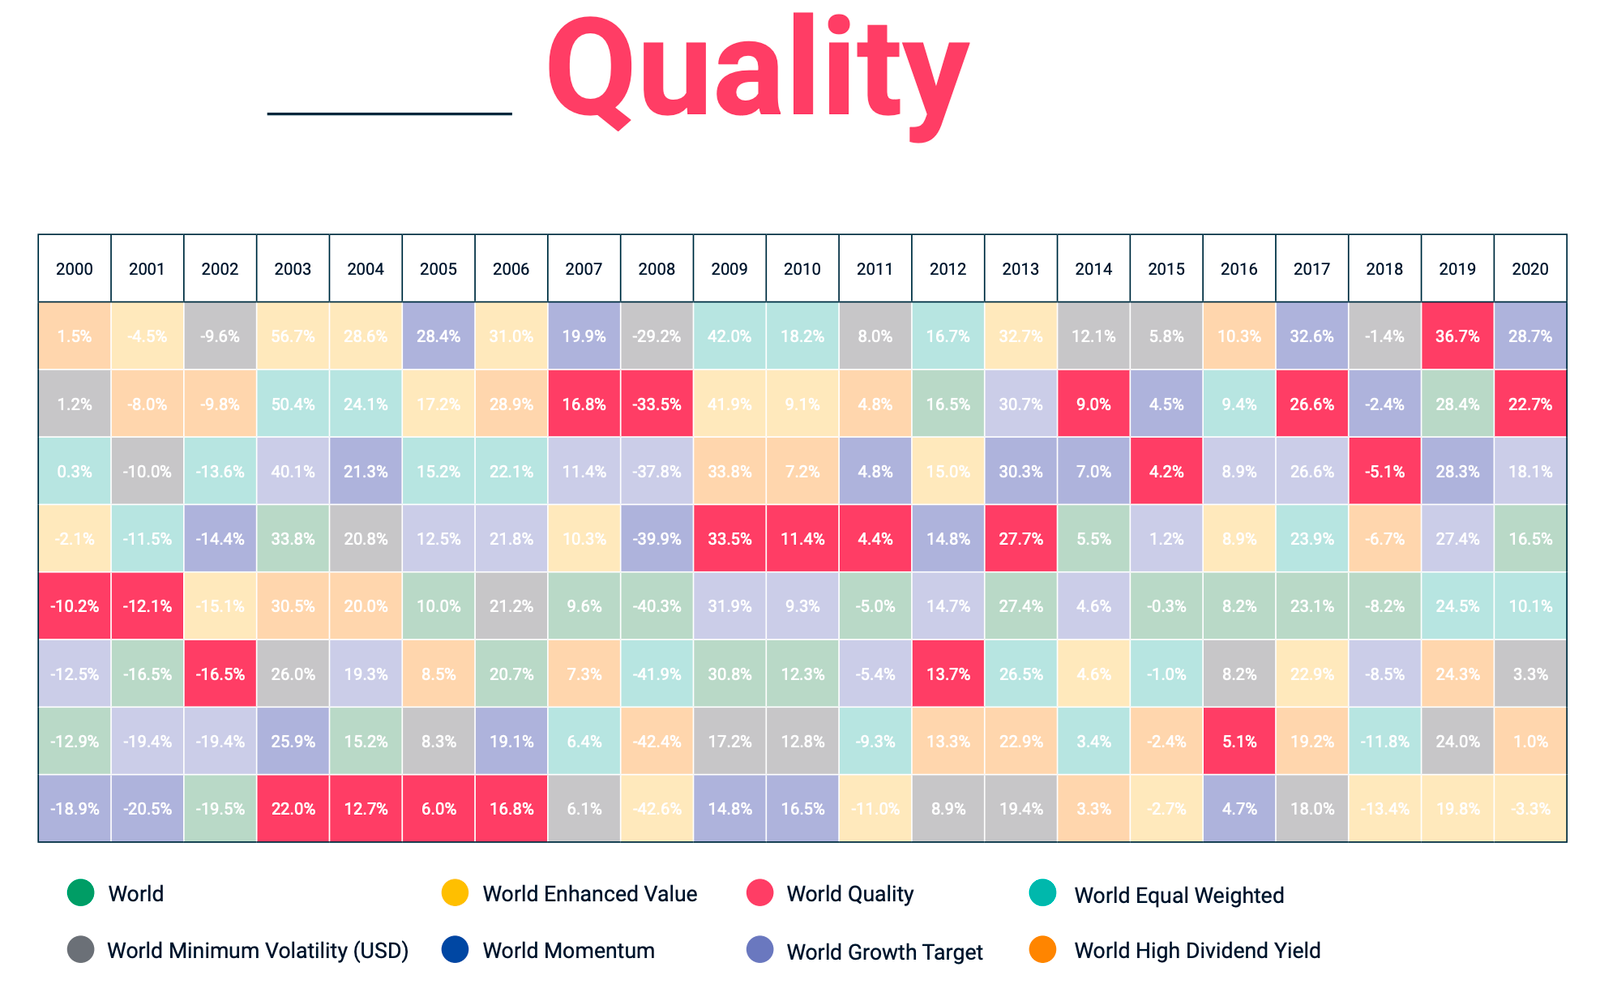
If you feast your eyes upon the results for Quality in the early 2000s, my point about needing to be extremely patient is clearly highlighted.
From 2000 until 2006 Quality was bottom of its class for four of those years.
However, it was one of the strongest factors from 2007 onwards.
Quality vs MCW Index Performance
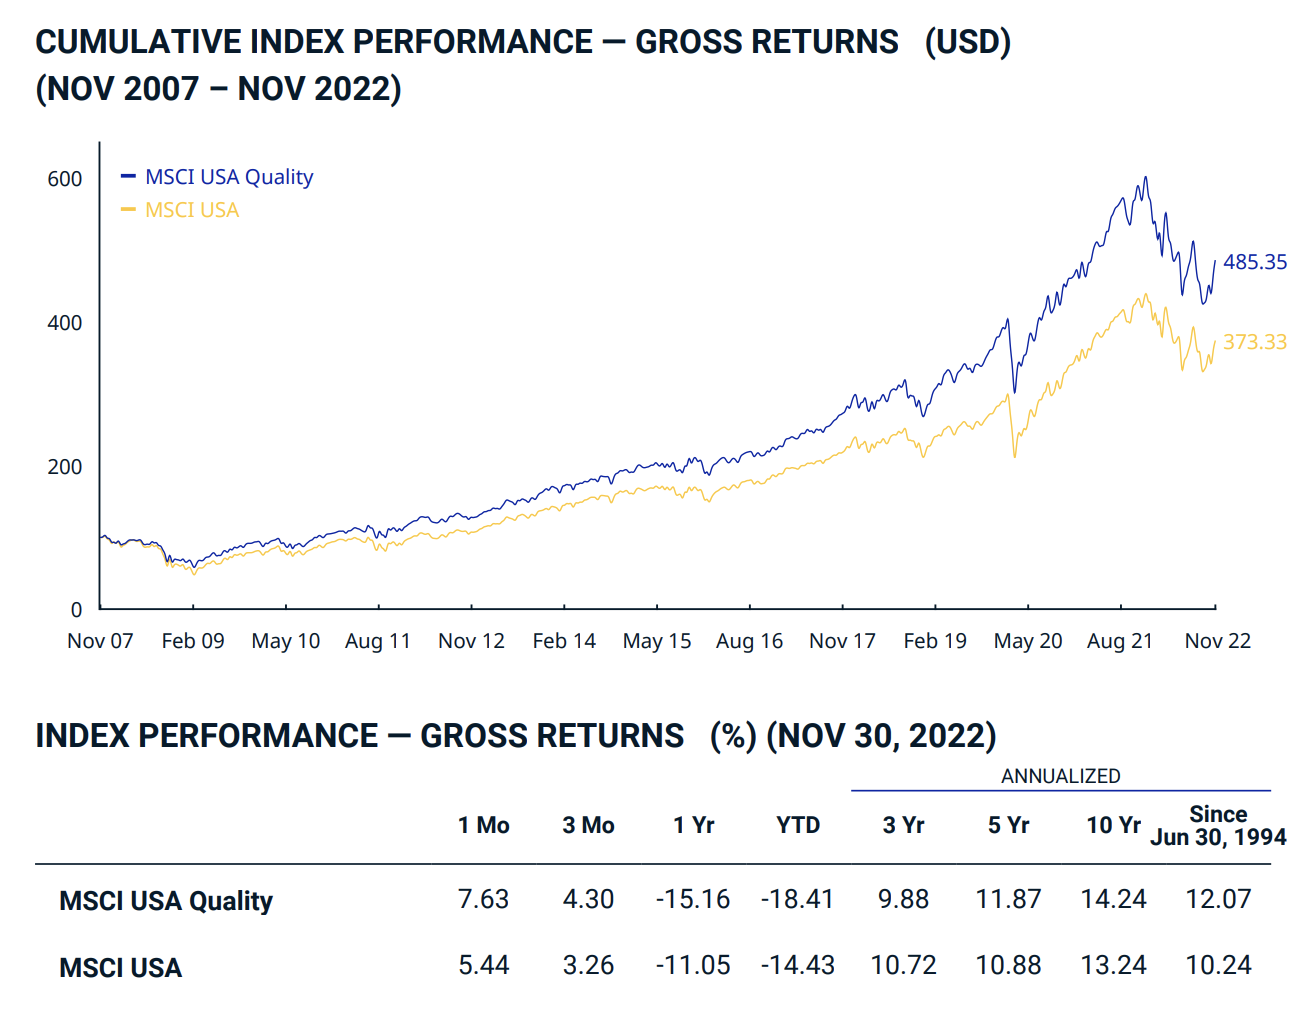
Finally, let’s compare MSCI USA Quality vs its parent market cap weighted index.
Since its inception, the Quality index has delivered annualized returns of 12.07% vs 10.24%.
That’s 183 basis points of long-term outperformance.
Its 10 year (14.24% vs 13.24%) and 5 year returns (11.87% vs 10.88%) have also been relatively better.
However, it has relatively underperformed over the past 3 years (9.88% vs 10.72%) and especially YTD (-18.41% vs -14.43%).
Nobody said it is easy being a factor investor!
If you believe in a particular strategy you’ve got to be prepared to hold on for dear life.

QUAL ETF Overview, Holdings and Info
The investment case for “iShares MSCI USA Quality Factor ETF ” has been laid out succinctly by the folks over at iShares ETFs: (fund landing page)
“The iShares MSCI USA Quality Factor ETF seeks to track the investment results of an index composed of U.S. large- and mid-capitalization stocks with quality characteristics as identified through certain fundamental metrics.
WHY QUAL?
1) Exposure to large- and mid-cap U.S. stocks exhibiting positive fundamentals (high return on equity, stable year-over-year earnings growth and low financial leverage)
2) Index-based access to a specific factor which has historically driven a significant part of companies’ risk and return
3) Use to help manage exposure and risk within a stock allocation”
Here we’re able to clearly see that the Quality index is screening for 3 specific fundamentals:
- High Return On Equity
- Earnings Growth (stable year over year)
- Low Financial Leverage
Let’s move on by consulting the fund’s summary prospectus to find out its methodology for security selection.

QUAL ETF: Security Selection Process
“The Underlying Index seeks to measure the performance of securities in the Parent Index that exhibit higher quality characteristics relative to their peers within the corresponding Global Industry Classification Standard (GICS®) sector.
To construct the Underlying Index, the Index Provider determines the quality score of each security in the Parent Index based on three fundamental variables: high return on equity, low earnings variability and low leverage.
The Underlying Index is weighted based on a component’s quality score multiplied by its weight in the Parent Index.
Weights in the Underlying Index are next normalized so that sectors in the Underlying Index represent the same weight as in the Parent Index.
Additionally, each individual issuer is capped at 5%.
The Underlying Index is rebalanced on a semi-annual basis.
As of July 31, 2022, there were 125 securities in the Underlying Index.”

Quality Index Key Points
So we’re already fully aware that the fund screens for three fundamental variables: high return on equity, low earnings variability and low leverage
Position sizes are capped at 5%.
Sector and weightings are parallel to the fund’s market-cap weighted parent index.
125 stocks in total.

iShares MSCI USA Quality Factor ETF: Principal Investment Strategy
To better understand the process of how the fund operates, let’s turn our attention towards the prospectus where I’ve summarized the key points at the very bottom (source: summary prospectus).
Principal Investment Strategies of the Fund
“The Fund seeks to track the investment results of the MSCI USA Sector Neutral Quality Index (the “Underlying Index”), which is based on a traditional market capitalization-weighted parent index, the MSCI USA Index (the “Parent Index”).
The Parent Index includes U.S. large- and mid-capitalization stocks, as defined by MSCI Inc. (the “Index Provider” or “MSCI”).
The Underlying Index seeks to measure the performance of securities in the Parent Index that exhibit higher quality characteristics relative to their peers within the corresponding Global Industry Classification Standard (GICS®) sector.
To construct the Underlying Index, the Index Provider determines the quality score of each security in the Parent Index based on three fundamental variables: high return on equity, low earnings variability and low leverage.
The Underlying Index is weighted based on a component’s quality score multiplied by its weight in the Parent Index.
Weights in the Underlying Index are next normalized so that sectors in the Underlying Index represent the same weight as in the Parent Index.
Additionally, each individual issuer is capped at 5%.
The Underlying Index is rebalanced on a semi-annual basis. As of July 31, 2022, there were 125 securities in the Underlying Index.
As of July 31, 2022, a significant portion of the Underlying Index is represented by securities of companies in the technology industry or sector.
The components of the Underlying Index are likely to change over time.
BFA uses a “passive” or indexing approach to try to achieve the Fund’s investment objective.
Unlike many investment companies, the Fund does not try to “beat” the index it tracks and does not seek temporary defensive positions when markets decline or appear overvalued.
Indexing may eliminate the chance that the Fund will substantially outperform the Underlying Index but also may reduce some of the risks of active management, such as poor security selection.
Indexing seeks to achieve lower costs and better after-tax performance by aiming to keep portfolio turnover low in comparison to actively
managed investment companies.
BFA uses a representative sampling indexing strategy to manage the Fund.
“Representative sampling” is an indexing strategy that involves investing in a representative sample of securities that collectively has an investment profile similar to that of an applicable underlying index.
The securities selected are expected to have, in the aggregate, investment characteristics (based on factors such as market capitalization and industry weightings), fundamental characteristics (such as return variability and yield) and liquidity measures similar to those of an applicable underlying index.
The Fund may or may not hold all of the securities in the Underlying Index.
The Fund generally will invest at least 80% of its assets in the component securities of its Underlying Index and in investments that have economic characteristics that are substantially identical to the component securities of its Underlying Index (i.e., depositary receipts representing securities of the Underlying Index) and may invest up to 20% of its assets in certain futures, options and swap contracts, cash and
cash equivalents, including shares of money market funds advised by BFA or its affiliates, as well as in securities not included in the Underlying Index, but which BFA believes will help the Fund track the Underlying Index.
Cash and cash equivalent investments associated with a derivative position will be treated as part of that position for the purposes of calculating the percentage of investments included in the Underlying Index.
The Fund seeks to track the investment results of the Underlying Index before fees and expenses of the Fund.
The Fund may lend securities representing up to one-third of the value of the Fund’s total assets (including the value of any collateral received).
The Underlying Index and Parent Index are sponsored by MSCI, which is independent of the Fund and BFA.
The Index Provider determines the composition and relative weightings of the securities in the Underlying Index and Parent Index and publishes information regarding the market value of the Underlying Index and Parent Index.
Industry Concentration Policy.
The Fund will concentrate its investments (i.e., hold 25% or more of its total assets) in a particular industry or group of industries to approximately the same extent that the Underlying Index is concentrated.
For purposes of this limitation, securities of the U.S. government (including its agencies and instrumentalities) and repurchase agreements collateralized by U.S. government securities are not considered to be issued by members of any industry.”
QUAL ETF: Holdings
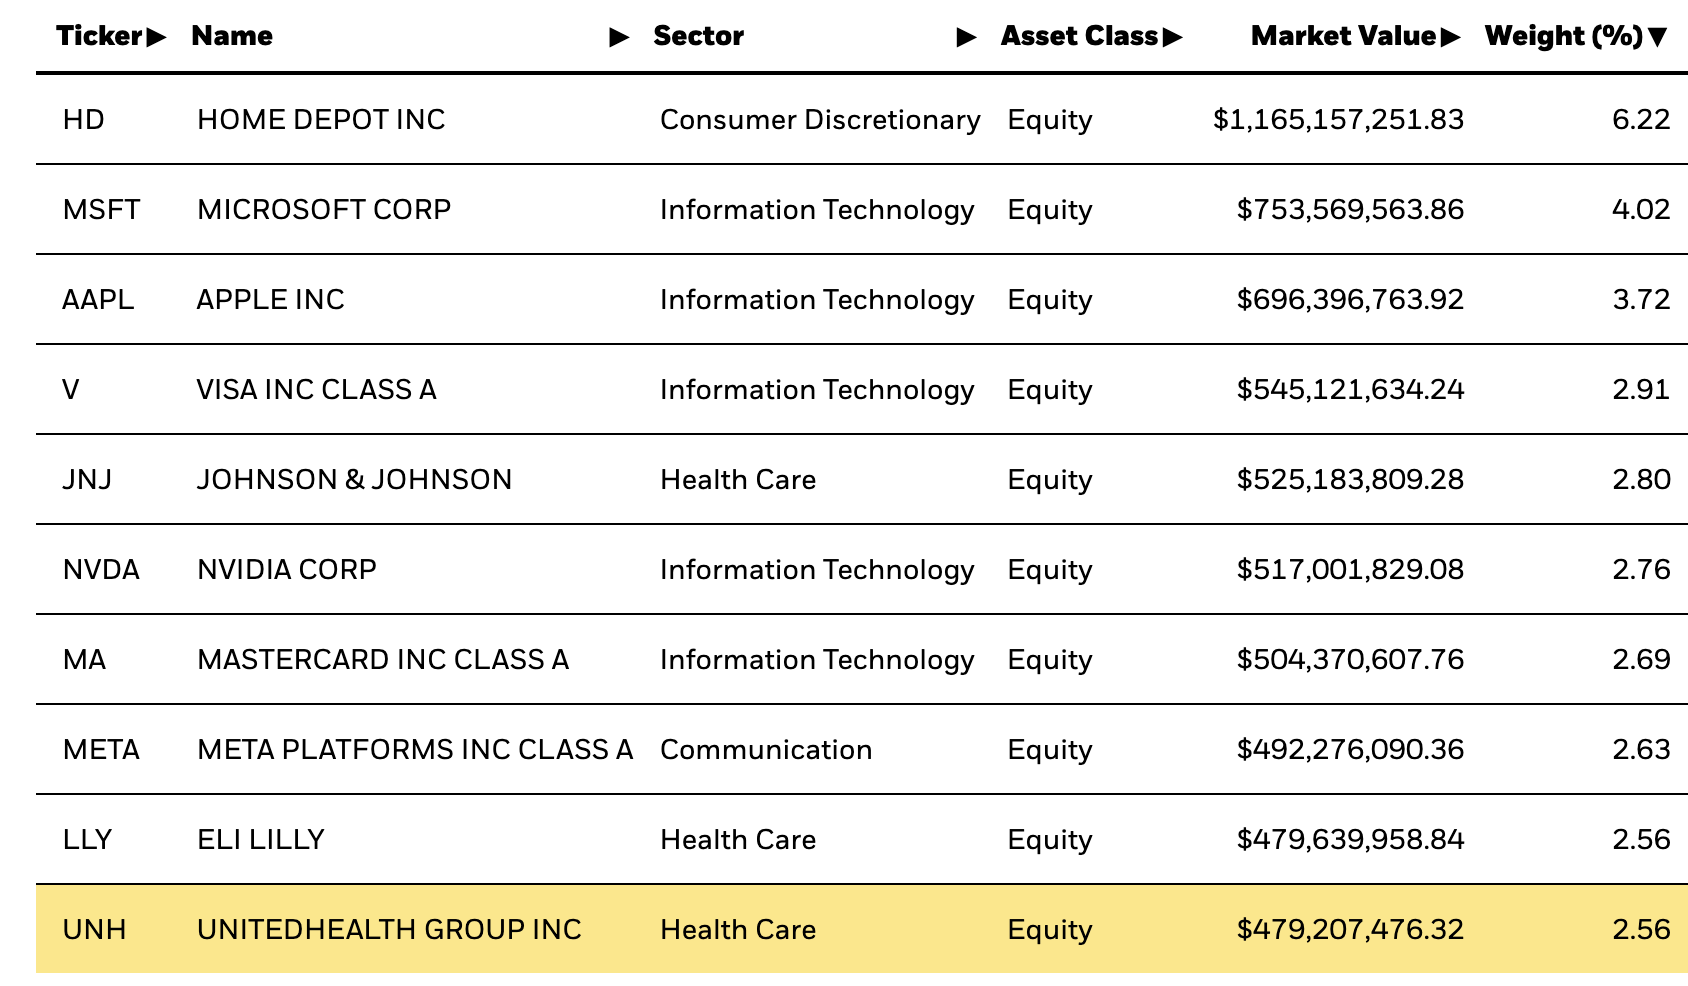
The top 10 positions of QUAL ETF currently range from 6.22% to 2.56%.
Home Depot is at the top with United Health Group Inc at the bottom.
Noteworthy, is that five of the top 10 positions are slotted towards Information Technology while three others allocate towards Health Care.
QUAL ETF: Sector Exposure
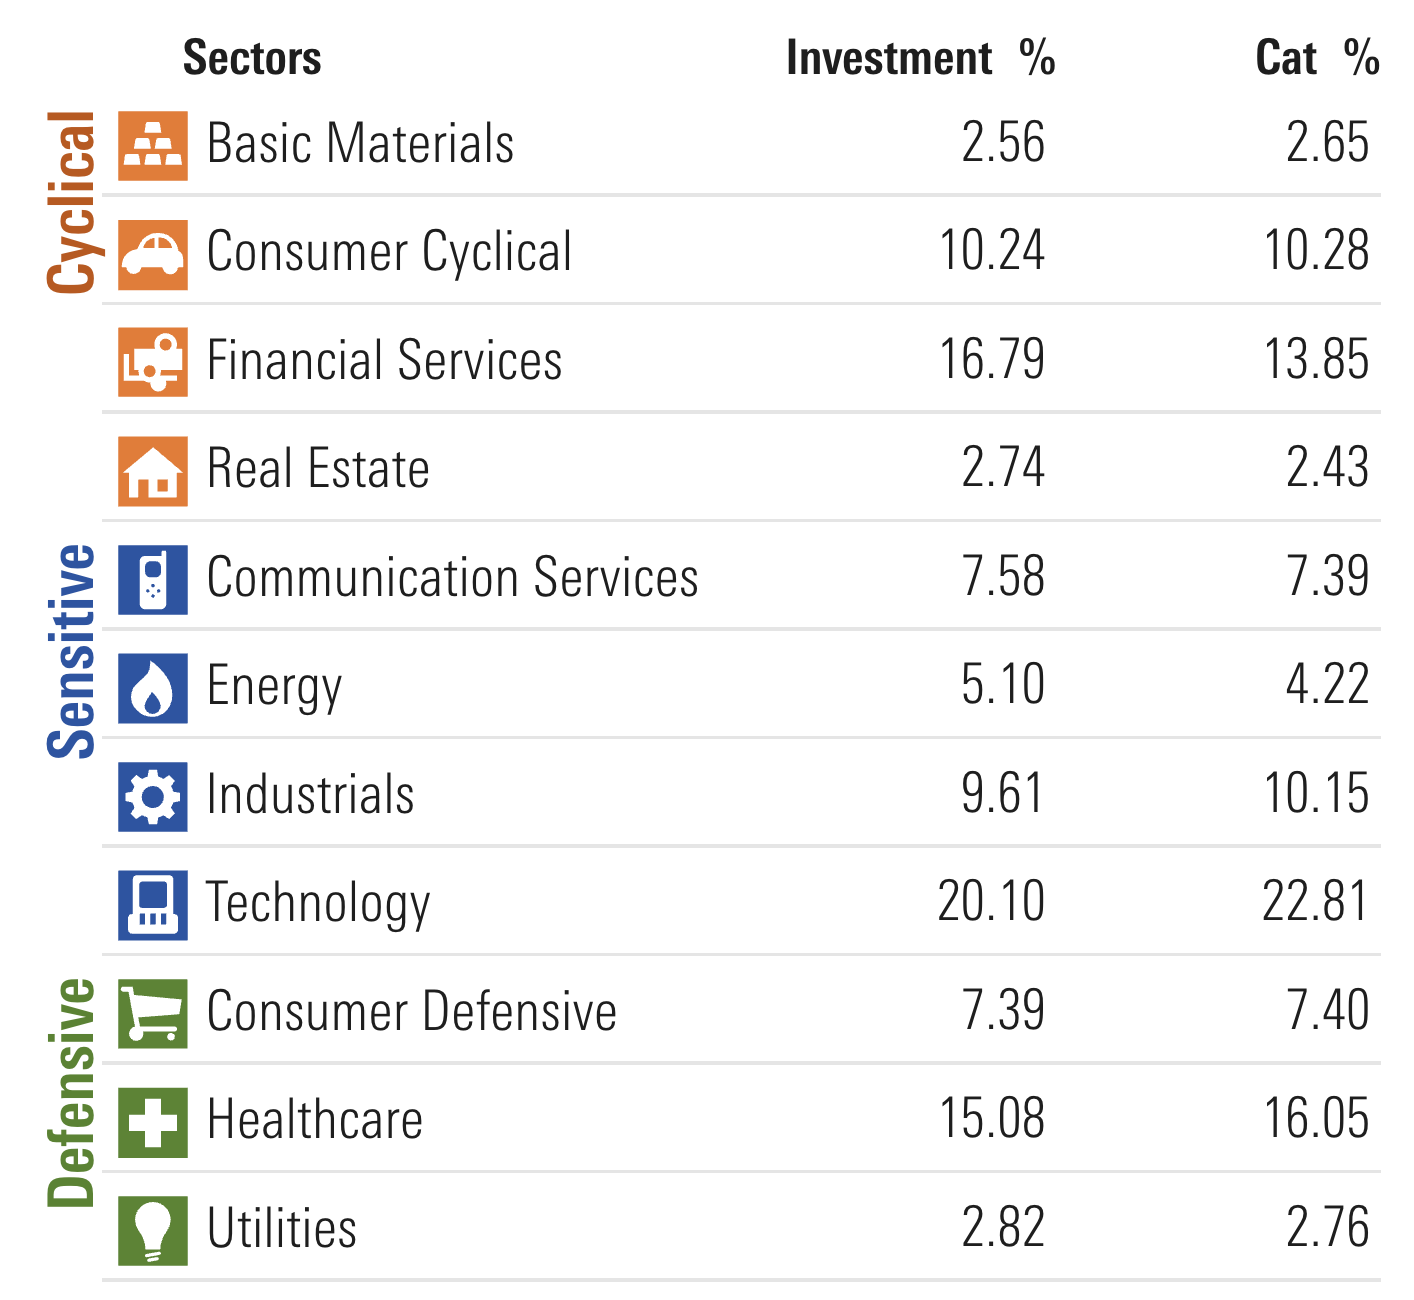
When going over the index methodology of QUAL ETF it was clearly stated the fund would try to line up with its parent index.
Here we’re able to see that clearly as the fund lines up neatly across the board with Financial Services being slightly overweight and Technology a little underweight.
QUAL ETF Info
Ticker: QUAL
Net Expense Ratio: 0.15
AUM: 18.7 Billion
Inception: July 16, 2013
QUAL ETF – Style Measures
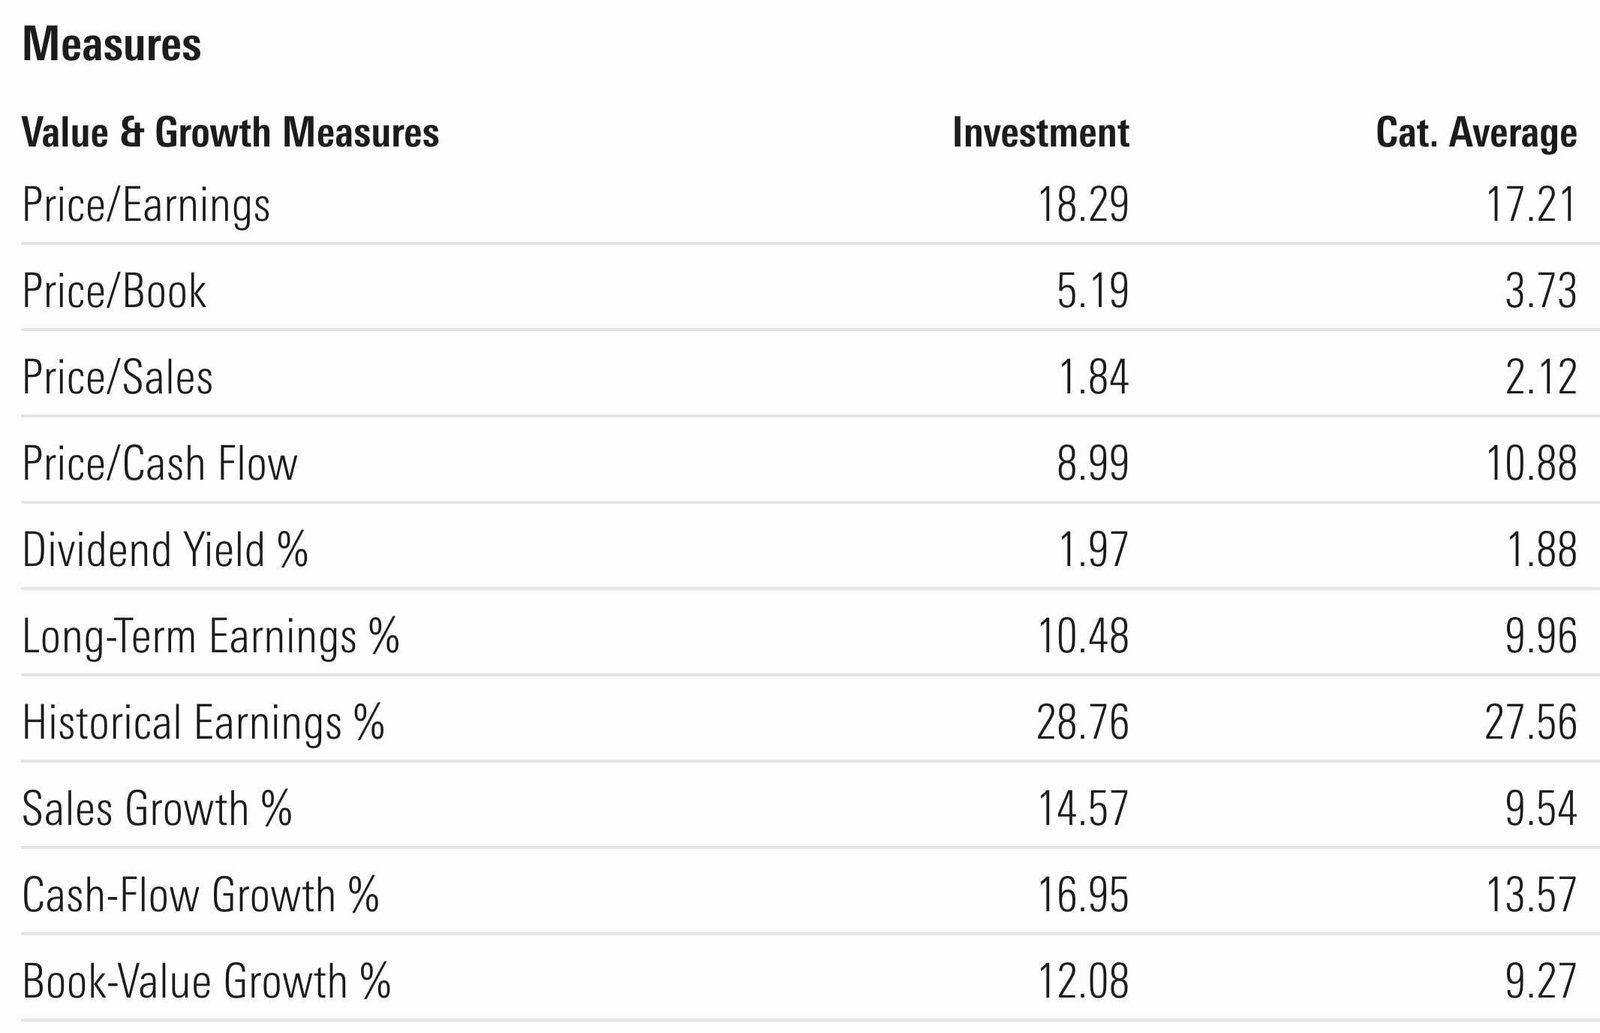
QUAL ETF, compared to its category average, has less attractive Price/Earnings (18.29 vs 17.21) and Price/Book (5.19 vs 3.73) whereas it offers relatively better Prices/Sales (1.84 vs 2.12) and Price/Cash Flow (8.99 vs 10.88) where lower is considered better.
On the other hand it is a sweep across the board for QUAL ETF vs its category average for Dividend Yield % (1.97 vs 1.88), Long-Term Earnings % (10.48 vs 9.96), Historical Earnings % (28.76 vs 27.56), Sales Growth % (14.57 vs 9.54), Cash-Flow Growth % (16.95 vs 13.57) and Book-Value Growth % (12.08 vs 9.27) where higher scores are optimal.
QUAL ETF – Stock Style
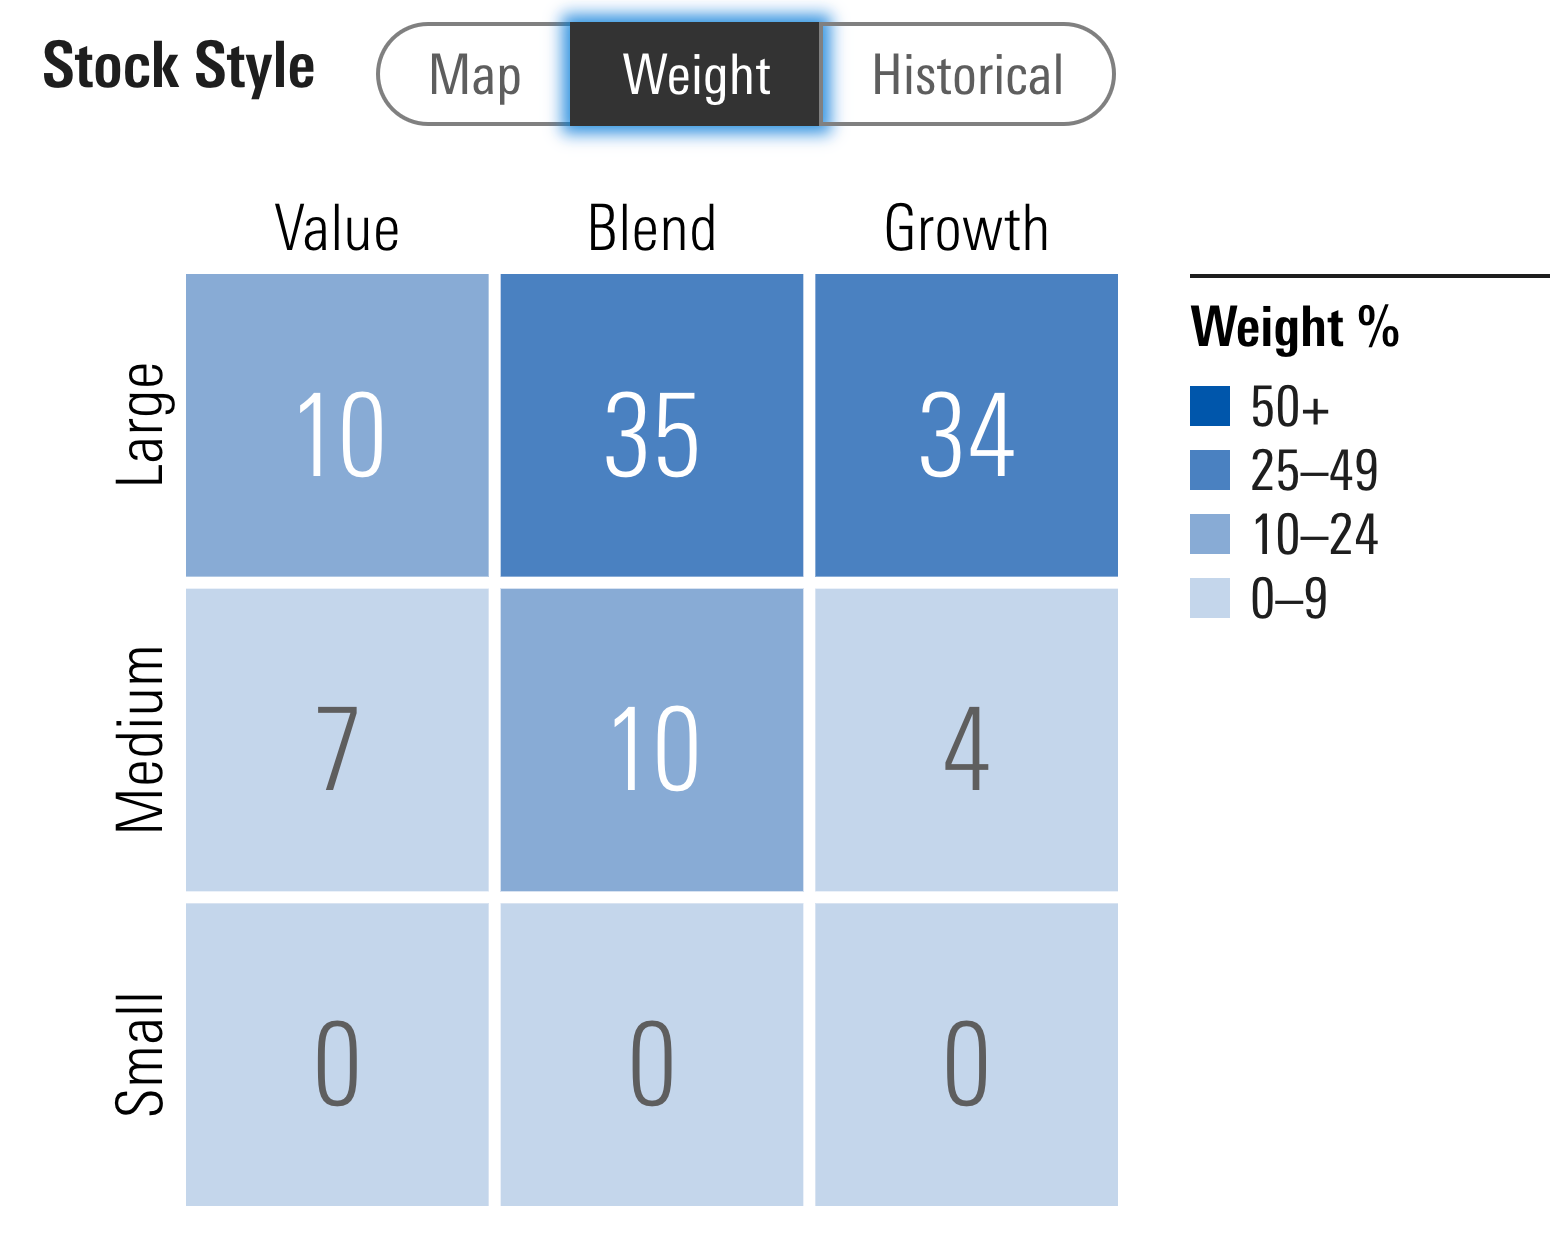
QUAL ETF is certainly top heavy when it comes to its style box weightings.
It has concentrated 79% of it weightings in large cap, 21% in mid-cap and has ZILCH exposure for small-cap.
It’s 17% Value, 45% Blend and 38% Growth.
Hence, it could be currently classified as mostly a large cap growth / blend fund.
MOAT ETF – Factor Profile
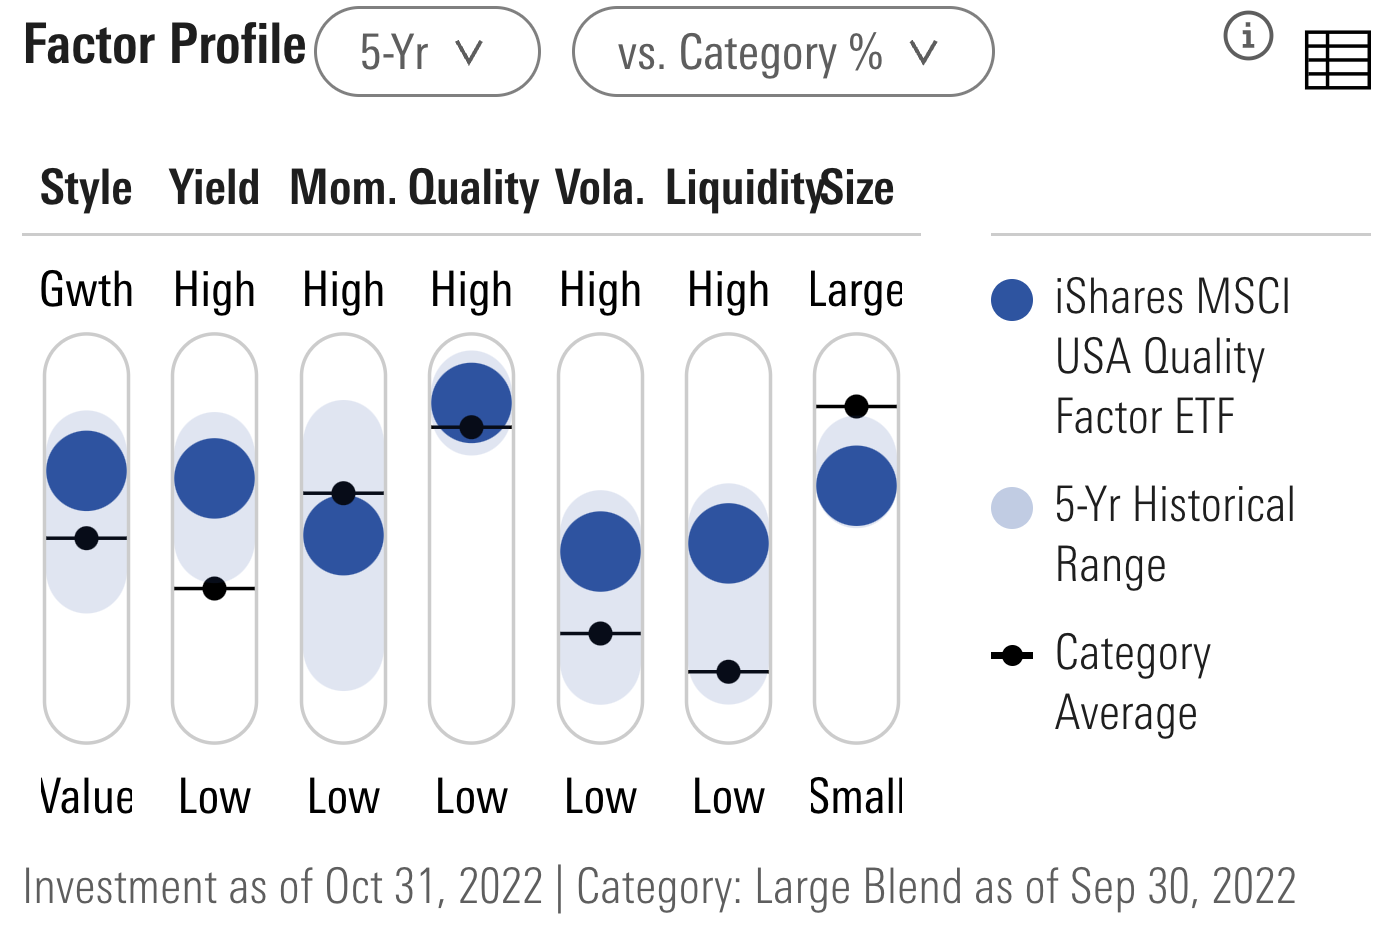
QUAL ETF pulls hard on the lever of quality (as one would hope) while also offering addition factor exposure to low volatility, yield and growth.

QUAL ETF Performance
We made a point of highlighting that factors go through periods of relative outperformance AND underperformance.
With QUAL ETF we’re clearly able to see both sides of the coin.
QUAL vs SPY 2015 until 2020
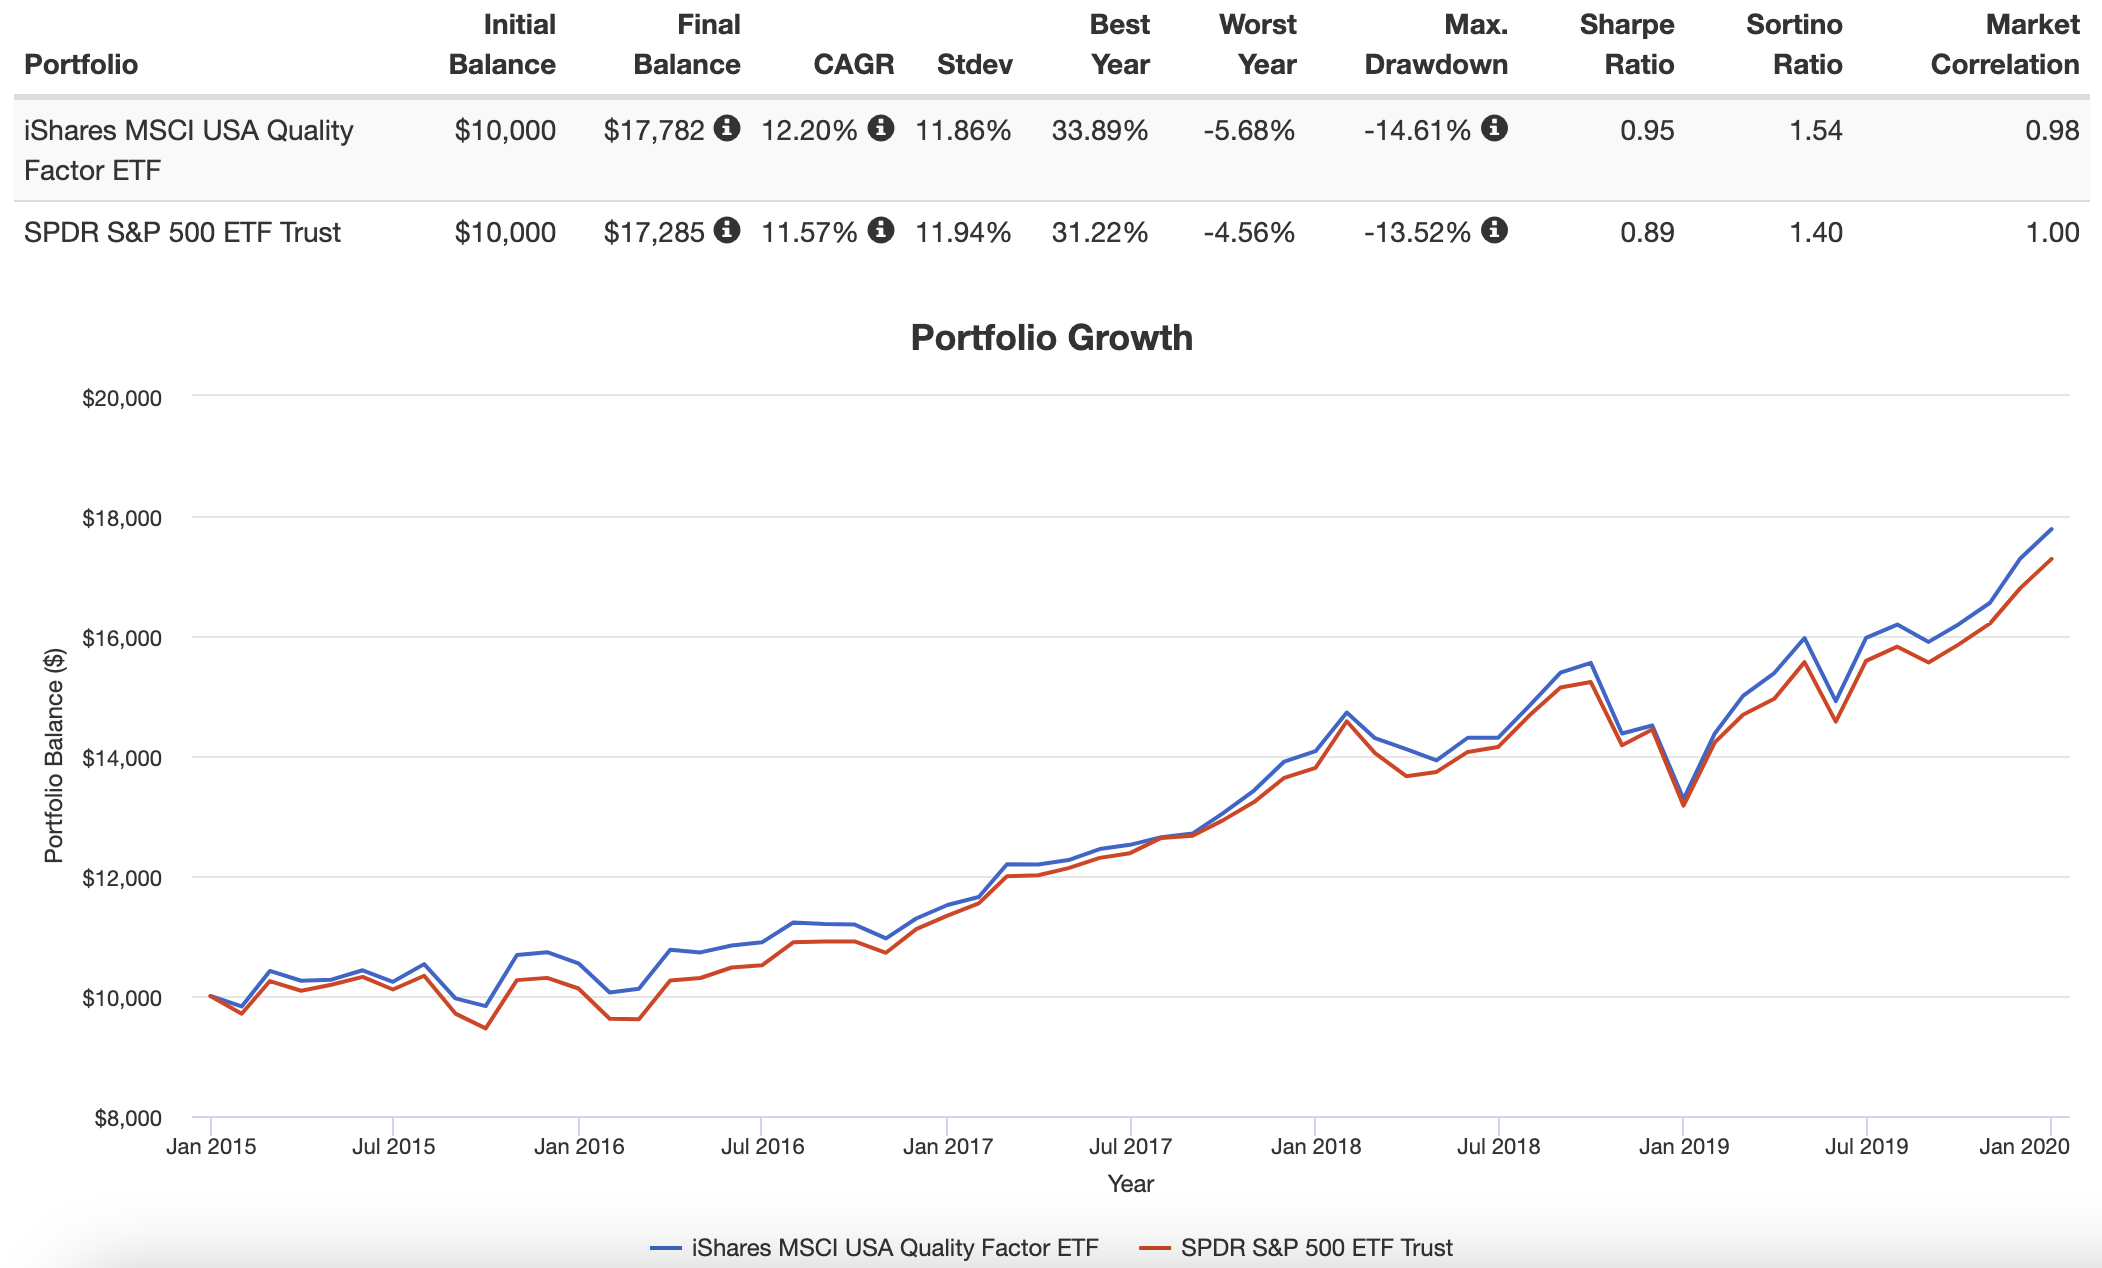
By tracking a 5 year period from 2015 until 2020, we’re able to see QUAL ETF offering higher returns (CAGR: 12.20% vs 11.57%) while offering an ever so slightly smoother ride (Stdev: 11.86% vs 11.94%).
During this stretch of time its returns were above risk earning it a high SHARPE RATIO (0.95) and SORTINO RATIO (1.54).
However, results haven’t been as kind for QUAL ETF in the 2020s.
QUAL vs SPY 2020 until 2022
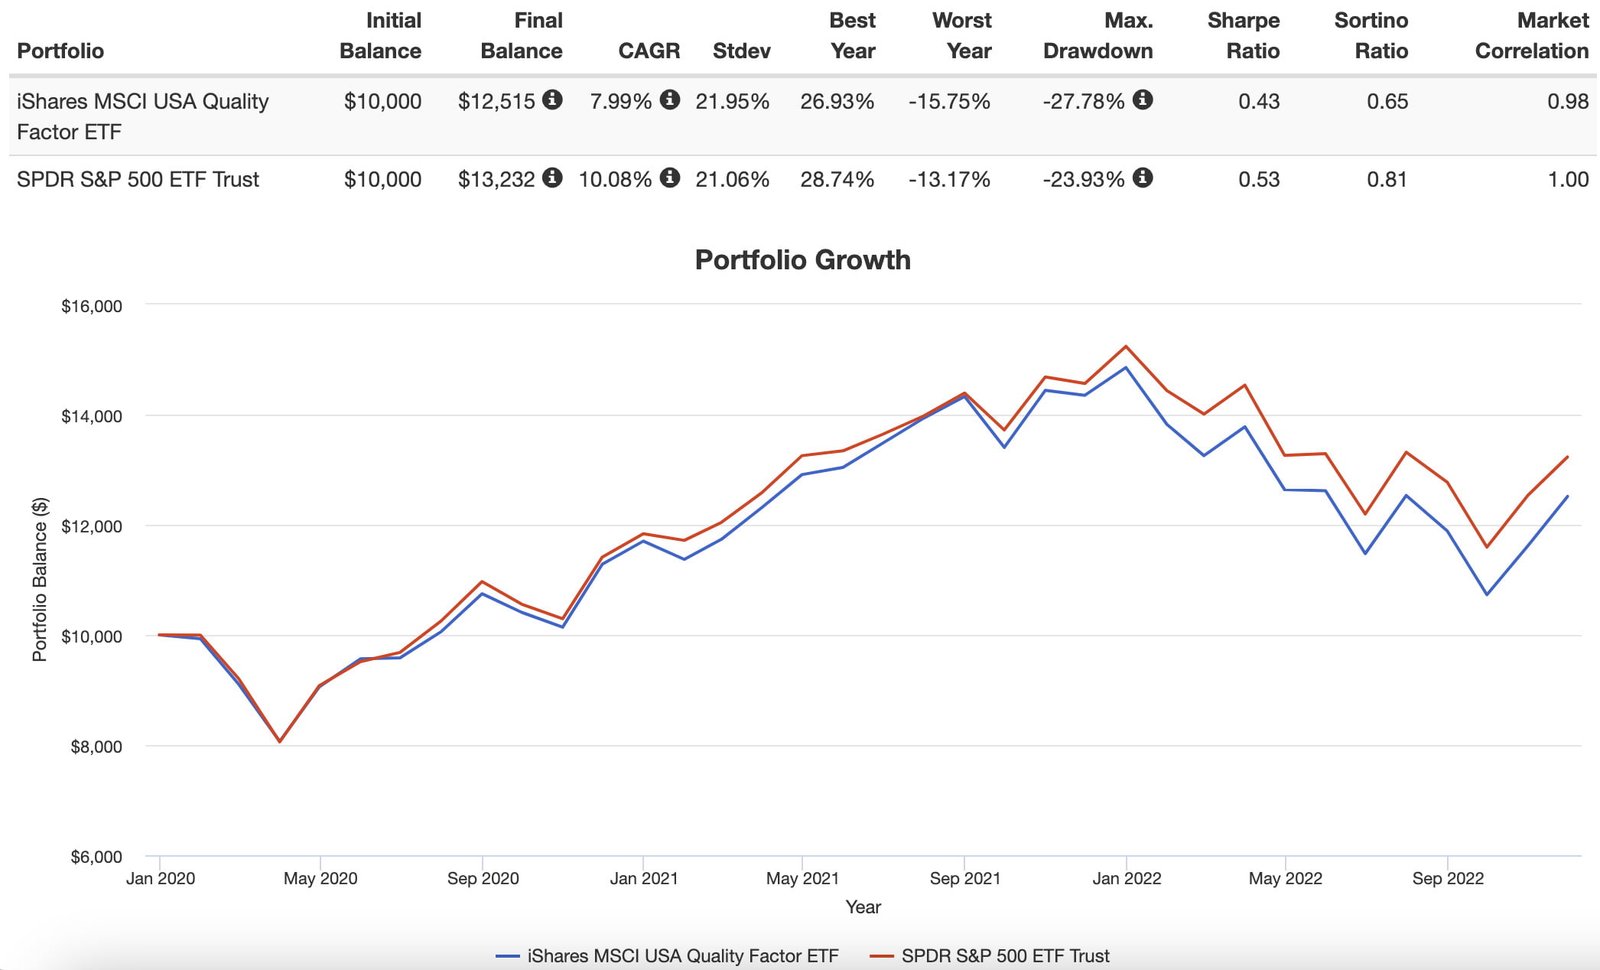
SPY ETF has offered investors better returns and risk management in the 2020s.
What can I say here that I haven’t already mentioned?
If you’re a committed factor investor prepare to buckle up and suck on a lemon every once in a while.
You’ve gotta be able to ride through the storm to see the light at the end of the tunnel.

QUAL ETF Pros and Cons
Let’s move on and examine the potential pros and cons of QUAL ETF.

QUAL ETF Pros
- Exposure to the Quality Factor that historically has driven excess returns while offering more defensive coverage than its market cap weighted index (with the same results globally as well)
- An offensive and defensive factor that can hang with the likes of momentum and value for long-term performance but also defend in the same category as minimum volatility and yield
- Keying in on intuitive fundament variables: high return on equity, low earnings variability and low leverage
- An alternative to growth strategies for investors who are interested in growth exposure without screening primarily for it
- The ability to form numerous barbell strategies with other factors such as value and momentum
- 125 positions offers a nice middle ground between being a high conviction enough strategy without being as concentrated as say a 50 position fund
- Rock bottom fees of 0.15 for a factor fund whose category often charges 2 to 3X that amount

QUAL ETF Cons
- Tracking error versus market cap weighted indexes (see its performance in the 2020s) and inevitable relative underperformance that is just a part of being a factor investor
- Not offering much mid-cap or small-cap exposure for investors seeking more style box balance

QUAL ETF Potential Model Portfolio Ideas
These asset allocation ideas and model portfolios presented herein are purely for entertainment purposes only. This is NOT investment advice. These models are hypothetical and are intended to provide general information about potential ways to organize a portfolio based on theoretical scenarios and assumptions. They do not take into account the investment objectives, financial situation/goals, risk tolerance and/or specific needs of any particular individual.
Investors who are impressed with the offensive and defensive aspects of a high conviction quality strategy may be interested in the following portfolio:
40% QUAL
20% IQLT
30% DBMF
10% TYA
Here we’re leaning in heavy to a quality equity factor strategy with QUAL and IQLT (which offers Int-Dev exposure).
DBMF provides us with Managed Futures as an alternative.
And we’ll enjoy capital efficient treasury exposure with TYA.
Since TYA ETF is relatively new let’s sub AGG ETF to see how this portfolio has performed versus a 60/40 portfolio in the 2020s.
QUAL ETF + Friends vs 60/40 Portfolio VBIAX
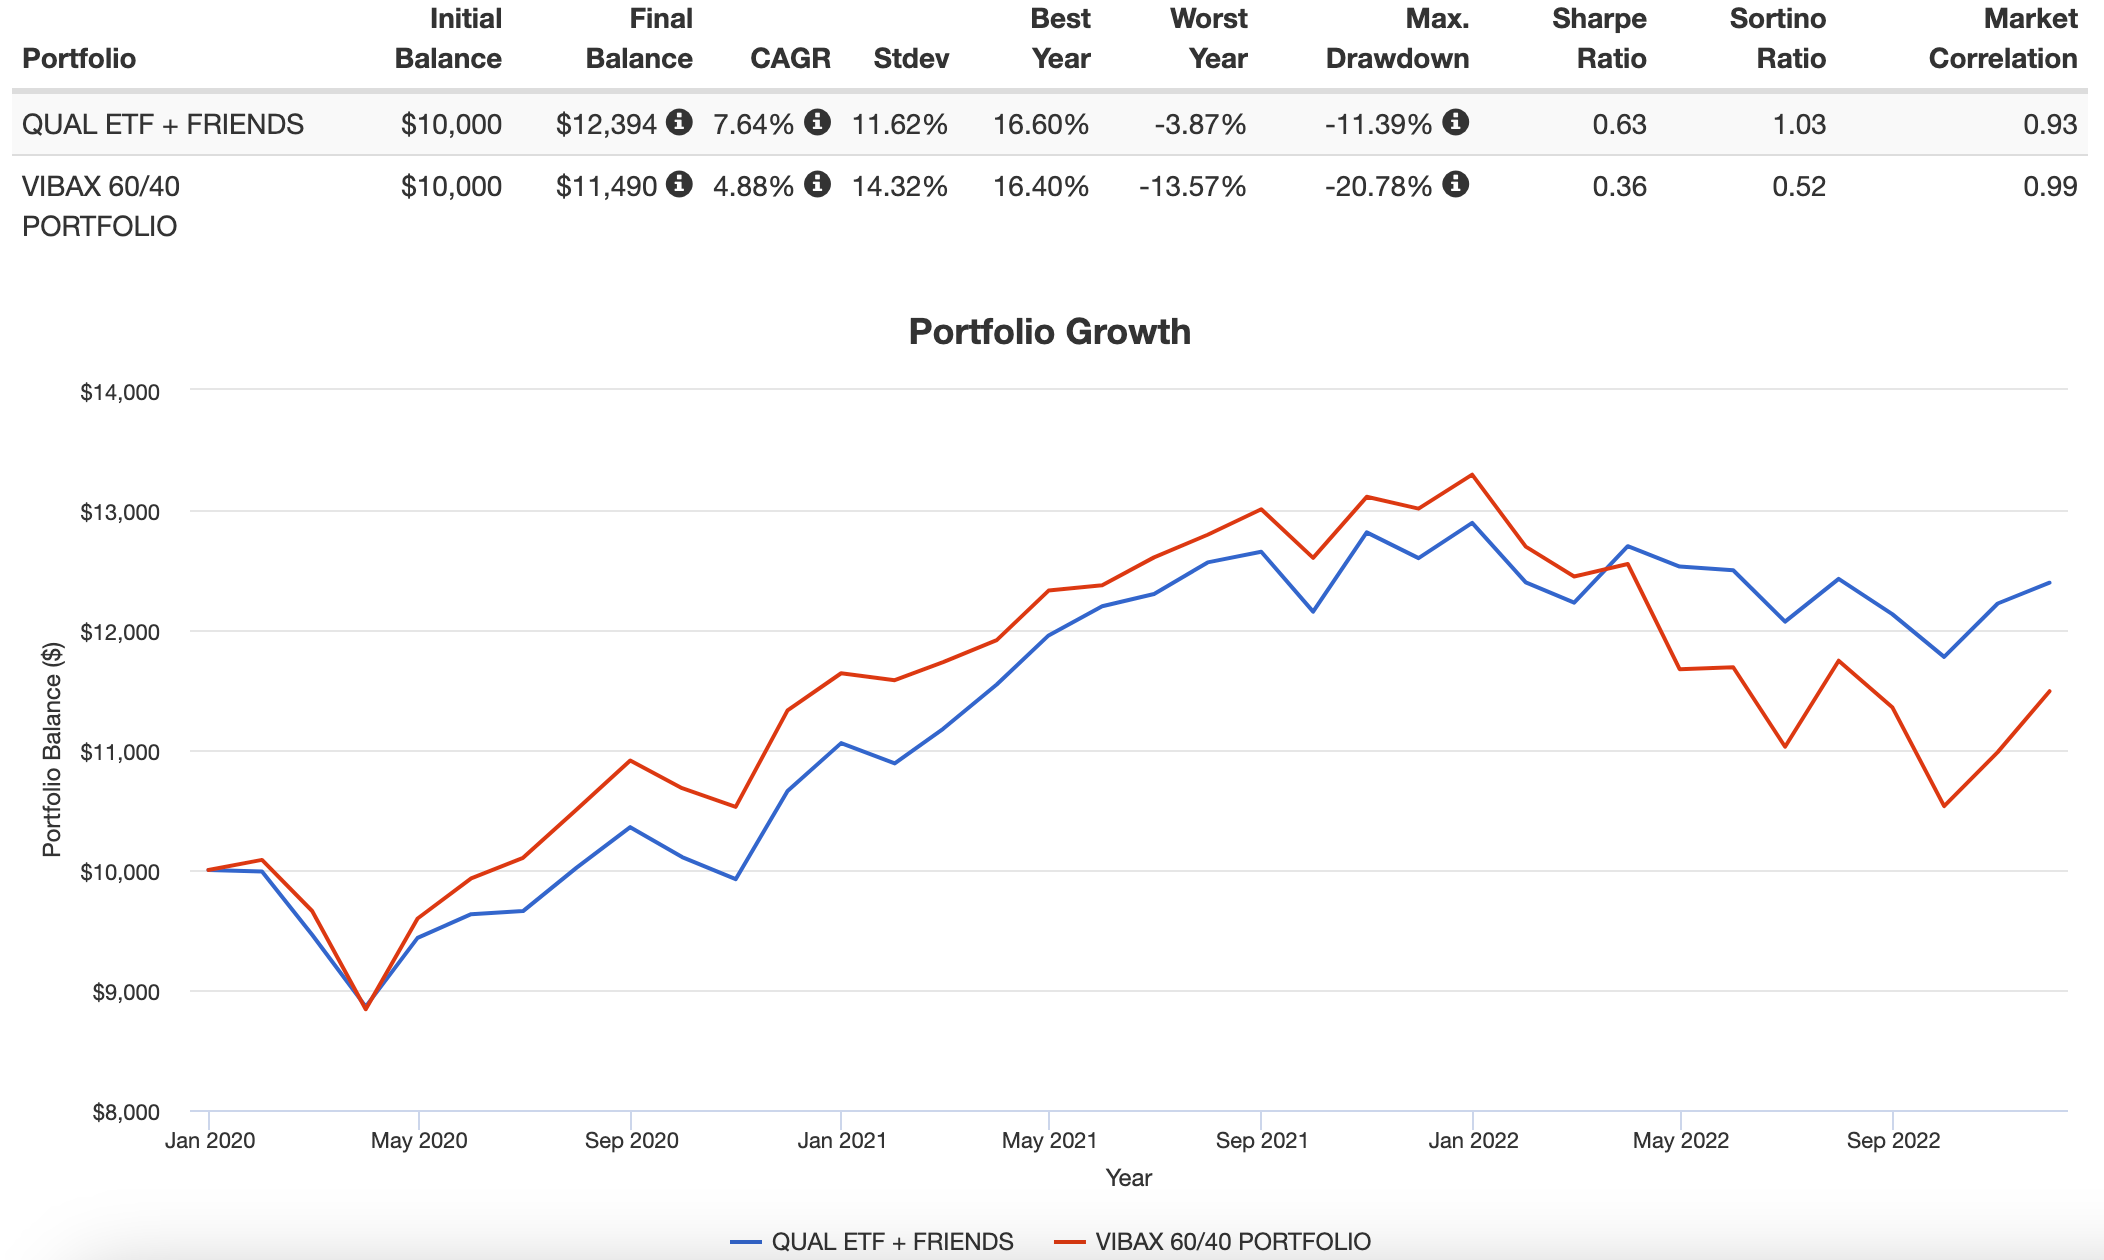
Our QUAL + Friends Portfolio has relatively outperformed a 60/40 Portfolio (VBIAX) in the 2020s: (CAGR: 7.64% vs 4.88%)
Moreover, it has offered investors a smoother ride: (Stdev: 11.62% vs 14.32%)
We’ll take it and move on!

What Others Have To Say About QUAL ETF
Now that we’ve covered a few different portfolio solutions let’s see what others have to say about the fund for those who prefer video format.
source: TrendLizard on YouTube

iShares MSCI USA Quality Factor ETF (QUAL) — 12-Question FAQ
1) What is QUAL and what does it aim to do?
QUAL tracks an MSCI index of U.S. large- and mid-cap stocks with quality characteristics, seeking exposure to companies with strong fundamentals.
2) How does MSCI define “quality” for this index?
Quality is measured using three fundamentals: high return on equity (ROE), low earnings variability (stable earnings growth), and low financial leverage.
3) How are stocks selected and weighted in QUAL’s index?
Each stock in the MSCI USA parent universe receives a quality score from the three variables. Index weights are quality score × parent index weight, then sector weights are normalized to match the parent index, with a 5% issuer cap.
4) How often does the index rebalance?
The MSCI USA Sector Neutral Quality Index is rebalanced semiannually, keeping the quality screen and sector neutrality up to date.
5) How many holdings does QUAL typically own?
Roughly ~125 securities, offering a high-conviction but still diversified basket of quality names.
6) What are QUAL’s basic facts (ticker, fee, AUM, inception)?
Ticker: QUAL | Expense ratio: 0.15% | AUM: ~$18.7B | Inception: 2013-07-16.
7) Does QUAL target specific sectors?
No. It is sector-neutral to the parent index. Sector weights are aligned with MSCI USA after quality weighting, so over/underweights are modest by design.
8) What’s QUAL’s style profile (size and style box)?
Primarily large cap with some mid cap; style tilts typically blend/growth-leaning due to the quality screen, with minimal to no small-cap exposure.
9) How has Quality performed versus market-cap indexes historically?
MSCI’s Quality indices have shown long-term outperformance with lower risk versus cap-weighted benchmarks, though periods of underperformance (e.g., parts of the 2020s) do occur.
10) How can investors use QUAL in a portfolio?
As a core U.S. equity quality sleeve, or in a barbell with value and/or momentum. It can also pair with managed futures or Treasuries to improve overall risk-adjusted returns.
11) What are the key pros of QUAL?
Evidence-based quality exposure (ROE, earnings stability, low leverage), defensive and offensive characteristics, sector neutrality, low fee (0.15%), and a clear, rules-based process.
12) What are the key cons or risks?
Tracking error vs. cap-weighted indexes, style concentration in large caps (limited small/mid), and factor cyclicality—quality can lag during certain market regimes.
Nomadic Samuel Final Thoughts
I think Quality is one of the most underrated factor strategies investors can potentially consider.
Its offensive and defensive prowess is undeniable.
Consistently, quality factor strategies offer long-term outperformance and enhanced risk management versus market-cap weighted indexes.
That’s true both for domestic and global backtests.
Hence, I’m overall fond of QUAL ETF for investors seeking US Large Cap factor exposure.
However, its relative underperformance in the 2020s is a harsh reminder for factor investors to ultimately stay the course.
Now over to you.
What do you think of QUAL ETF and Quality investing strategies overall?
Please let me know in the comments below.
That’s all I’ve got for today.
Ciao for now.
Important Information
Comprehensive Investment Disclaimer:
All content provided on this website (including but not limited to portfolio ideas, fund analyses, investment strategies, commentary on market conditions, and discussions regarding leverage) is strictly for educational, informational, and illustrative purposes only. The information does not constitute financial, investment, tax, accounting, or legal advice. Opinions, strategies, and ideas presented herein represent personal perspectives, are based on independent research and publicly available information, and do not necessarily reflect the views or official positions of any third-party organizations, institutions, or affiliates.
Investing in financial markets inherently carries substantial risks, including but not limited to market volatility, economic uncertainties, geopolitical developments, and liquidity risks. You must be fully aware that there is always the potential for partial or total loss of your principal investment. Additionally, the use of leverage or leveraged financial products significantly increases risk exposure by amplifying both potential gains and potential losses, and thus is not appropriate or advisable for all investors. Using leverage may result in losing more than your initial invested capital, incurring margin calls, experiencing substantial interest costs, or suffering severe financial distress.
Past performance indicators, including historical data, backtesting results, and hypothetical scenarios, should never be viewed as guarantees or reliable predictions of future performance. Any examples provided are purely hypothetical and intended only for illustration purposes. Performance benchmarks, such as market indexes mentioned on this site, are theoretical and are not directly investable. While diligent efforts are made to provide accurate and current information, “Picture Perfect Portfolios” does not warrant, represent, or guarantee the accuracy, completeness, or timeliness of any information provided. Errors, inaccuracies, or outdated information may exist.
Users of this website are strongly encouraged to independently verify all information, conduct comprehensive research and due diligence, and engage with qualified financial, investment, tax, or legal professionals before making any investment or financial decisions. The responsibility for making informed investment decisions rests entirely with the individual. “Picture Perfect Portfolios” explicitly disclaims all liability for any direct, indirect, incidental, special, consequential, or other losses or damages incurred, financial or otherwise, arising out of reliance upon, or use of, any content or information presented on this website.
By accessing, reading, and utilizing the content on this website, you expressly acknowledge, understand, accept, and agree to abide by these terms and conditions. Please consult the full and detailed disclaimer available elsewhere on this website for further clarification and additional important disclosures. Read the complete disclaimer here.


