At the end of every fund review I include a few sample portfolios for investors to consider and there is no fund I recommend more than TYA ETF.
The fund recently rebranded as “Simplify Intermediate Term Treasury Futures Strategy ETF” and was formerly know as “TYA Simplify Risk Parity Treasury ETF“.
But that still begs the question: “Why have I recommended it so frequently?”
Because truth be told I’m not a huge fan of fixed income and bonds.
I understand why they’re important but I don’t like them.
I kind of view an allocation to bonds the same way I do a trip to the dentist.
It’s obviously important but I’m not thrilled to be there.
In fact, even if I haven’t gone for a while it still always feels “recent” even if it’s just for something as minor as a routine cleaning.
Let’s get back on track here.
Why do I so frequently include TYA ETF in model portfolios featuring other funds?

The reason is that it is the most efficient fixed income product that I’m aware of offering notional exposure (of roughly 3X to intermediate term treasury) via futures contracts.
In a nutshell, with just a small allocation in a sample portfolio ranging from 10-15% I’m able to be “over and done with” my fixed income strategy:
10% = 30% notional exposure
And I love that.
Because the last thing I want is for bonds to be clogging up valuable real estate in my portfolio.
If you feel the same way I do about bonds I think you may enjoy this review as it’ll highlight how a fund like TYA ETF can fulfil your fixed income needs much like a quick trip to the dentist.
After-all, I’m sure keying in on equity and alternative strategies is considerably more fun.

Simplify ETFs: Providing Alternative Investing Solutions
To say Simplify has burst onto the ETF marketplace scene and made a cannonball splash in the swimming pool would be an understatement.
No alternative fund provider has assembled as many compelling puzzle pieces over the past couple of years.
This is the fourth Simplify ETF I’m covered and it won’t be the last.
I’ve reviewed Simplify Macro Strategy ETF FIG, analyzed CTA Simplify Managed Futures Strategy ETF and covered Simplify US Equity PLUS Downside Convexity ETF SPD.
source: simplify asset management on youtube

The Case For Efficient Treasury Exposure
Although I’ve highlighted the “let’s get this over and done with” consideration for TYA ETF as a potential portfolio solution, let’s dig in a little deeper.
According to Simplify ETFs there are 3 Key Points worth considering for Simplify Intermediate Term Treasury Futures Strategy ETF:
- Targets the duration of the ICE 20+ Year US Treasury Index by investing in Treasuries and Treasury futures in the intermediate portion of the curve.
- “Improves capital efficiency of fixed income portfolios by providing significant duration from only a modest allocation.”
- “Can potentially create more efficient long duration exposure by capitalizing on favorable roll coupon yields in the intermediate portion of the Treasury curve.”
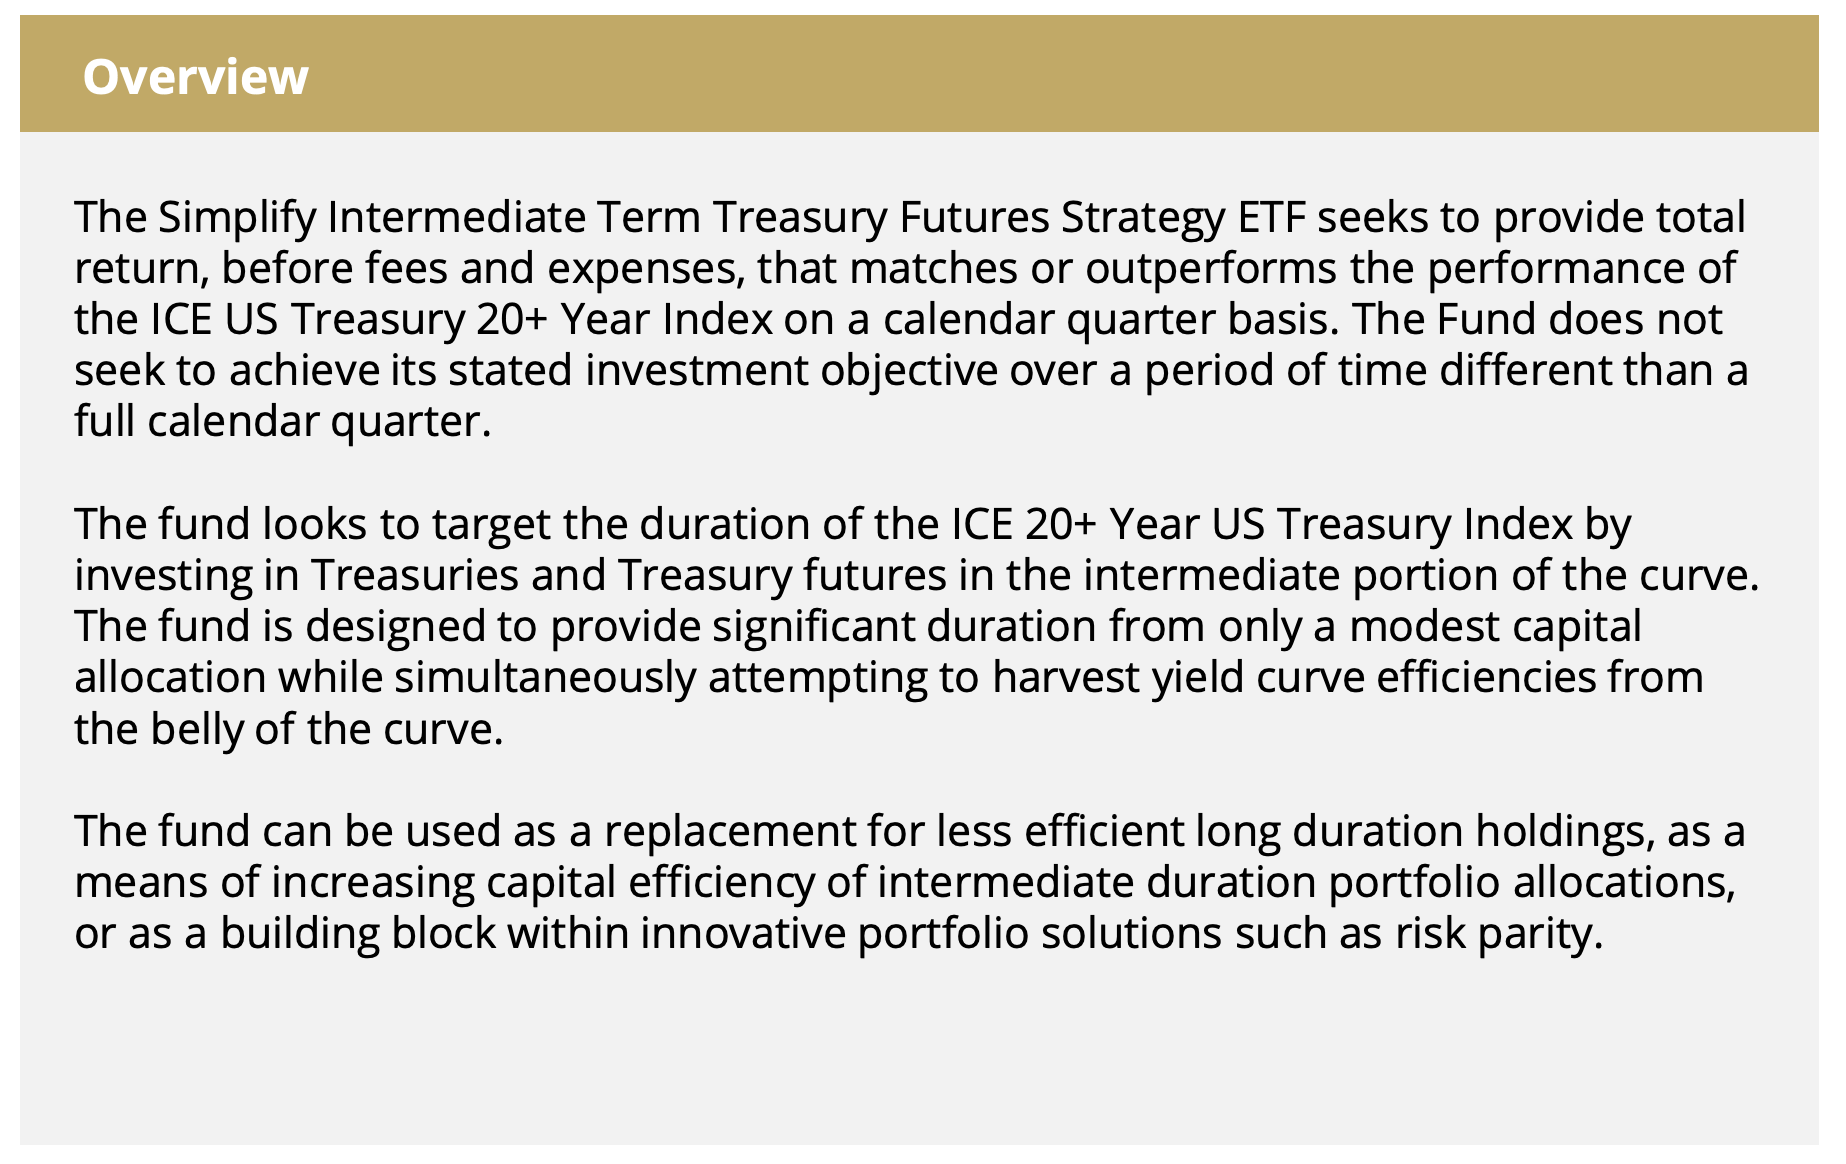
Strategically speaking, the Fund targets the duration of the ICE 20+ Year US Treasury Index by investing in a combination of Treasuries and Treasury futures (which are rolled quarterly based on open interest).
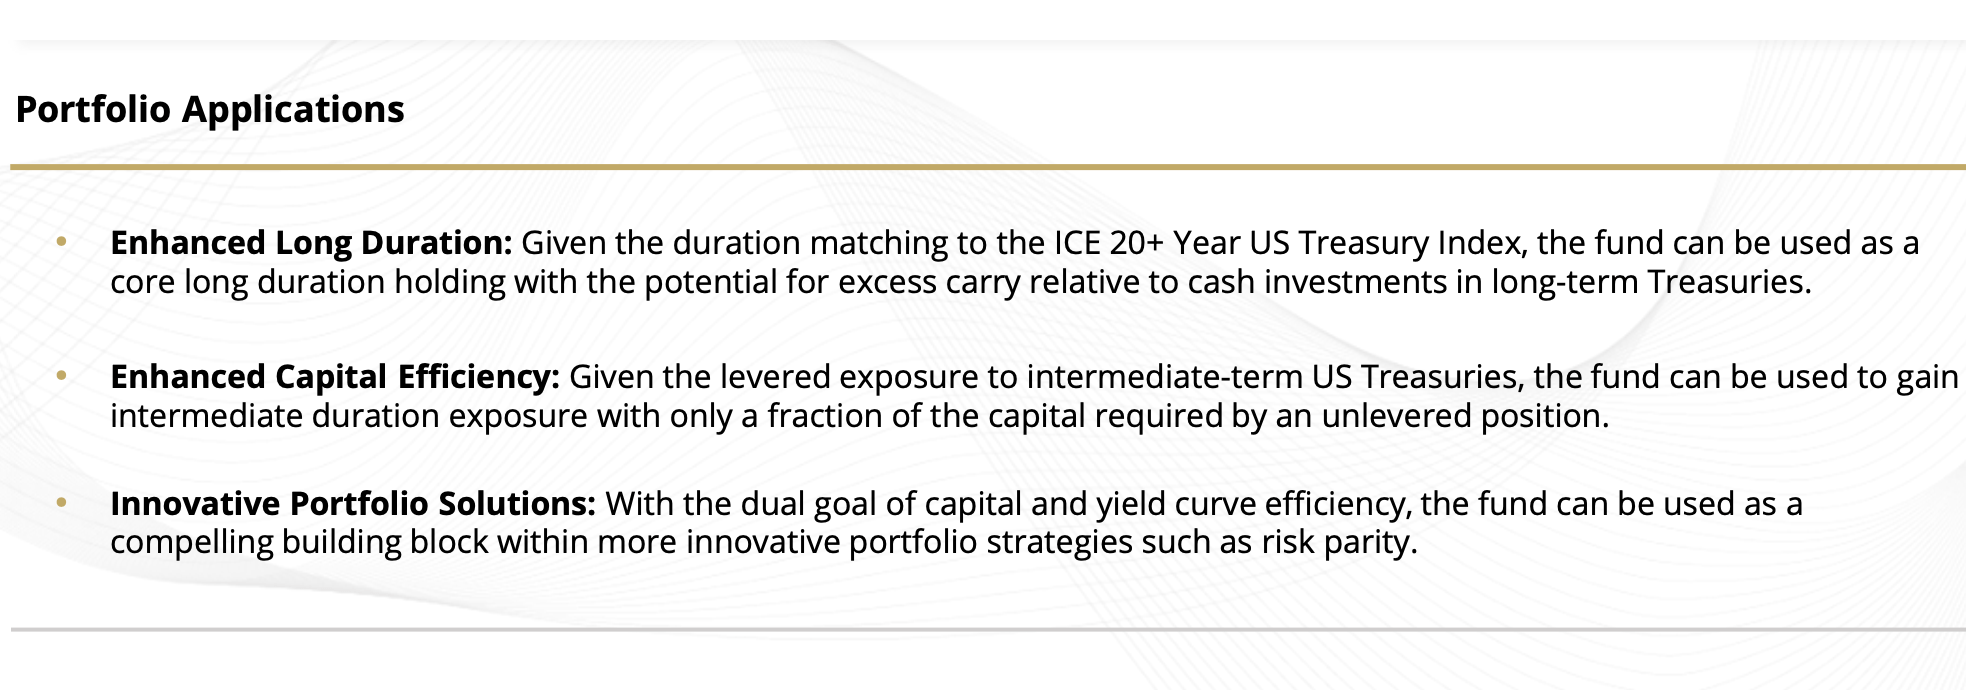
It’s intended “best practices usage scenario” is as a capital efficient building block that creates space for other strategies and asset classes within your portfolio.

10-Year Treasury Performance And Risk Since 2000
Let’s examine the 10-Year Treasury from a returns and risk standpoint this century.
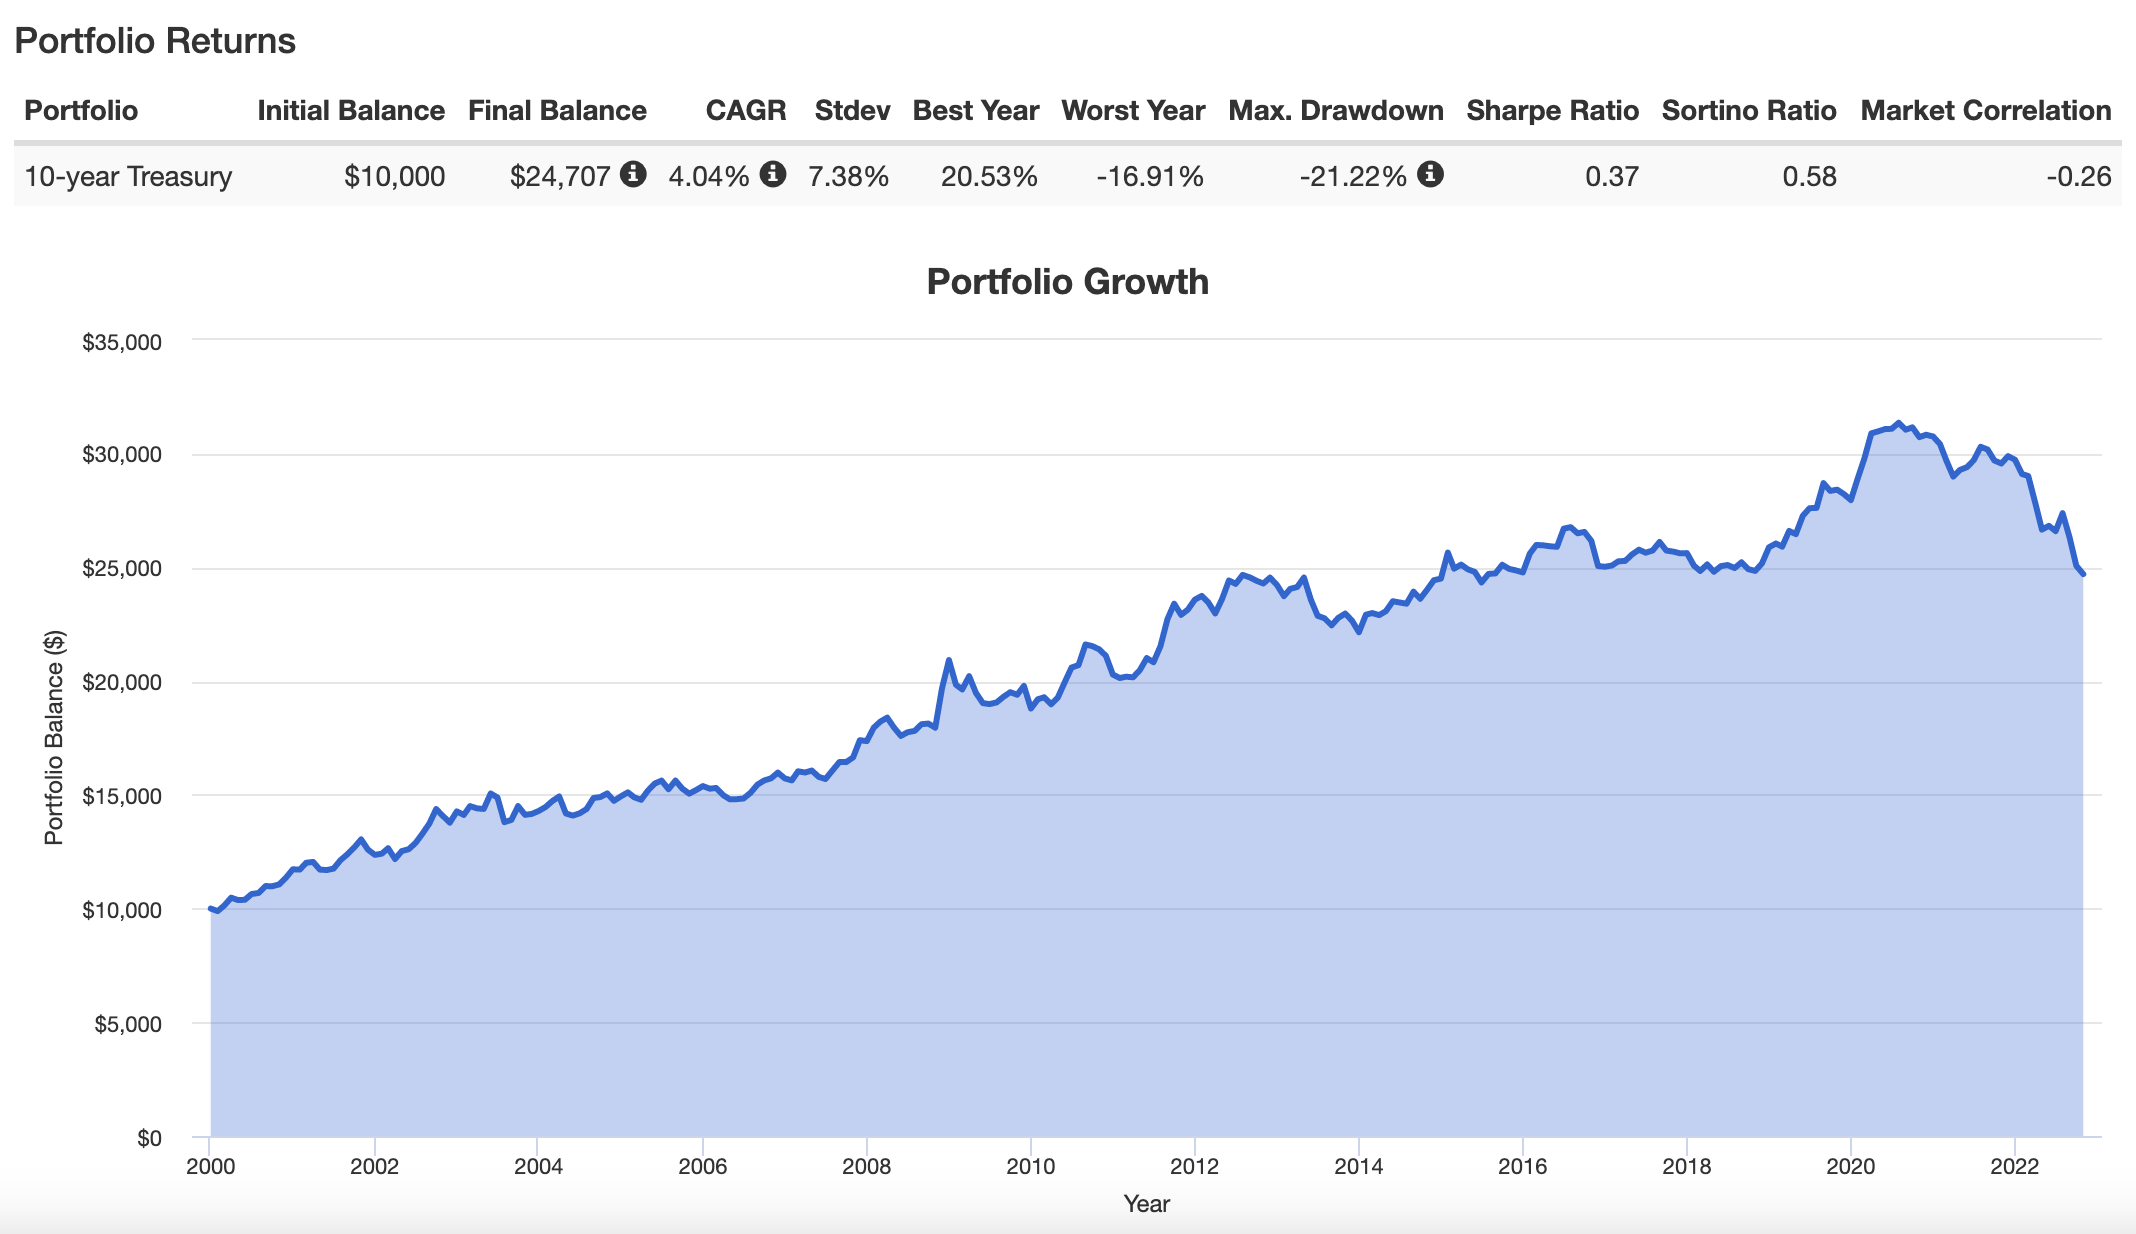
Since 2000 the 10-Year Treasury has provided investors with a 4.04% CAGR and 7.38% Stdev.
Its worst year of -16.91% and maximum drawdown of -21.22% are happening right now.
That’s right folks we’re living through history in 2022.
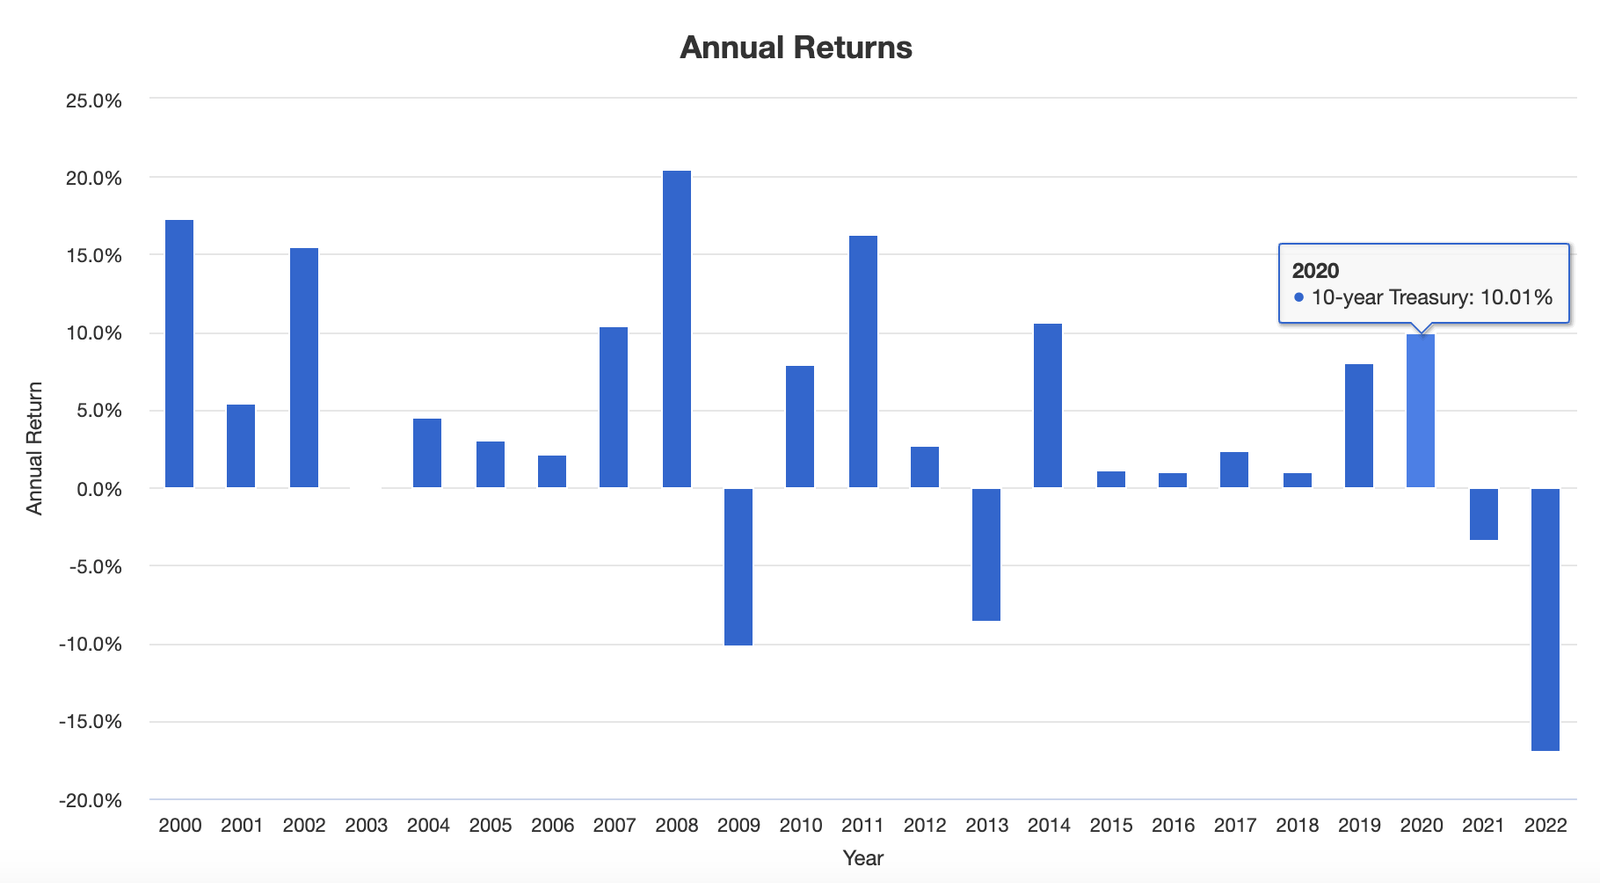
Although our current view of fixed income investing has likely been skewed by the unprecedented bond bear market of 2021 and 2022, it is important to note how durable the 10-Year Treasury has been this century overall.
Only 4 negative years.
19 positive ones.
82.6% success rate.
In other words, the 10-year Treasury has historically had enough of a chin to handle expanding the canvas with leverage.

TYA ETF Review | Simplify Intermediate Term Treasury Futures Strategy ETF

Hey guys! Here is the part where I mention I’m a travel content creator! This investing opinion blog post ETF Fund Review and Mutual Fund Review is entirely for entertainment purposes only. There could be considerable errors in the data I gathered. This is not financial advice. Do your own due diligence and research. Consult with a financial advisor.

TYA ETF Overview, Holdings and Info
How much notional exposure does TYA ETF have via futures?
Let’s find out.
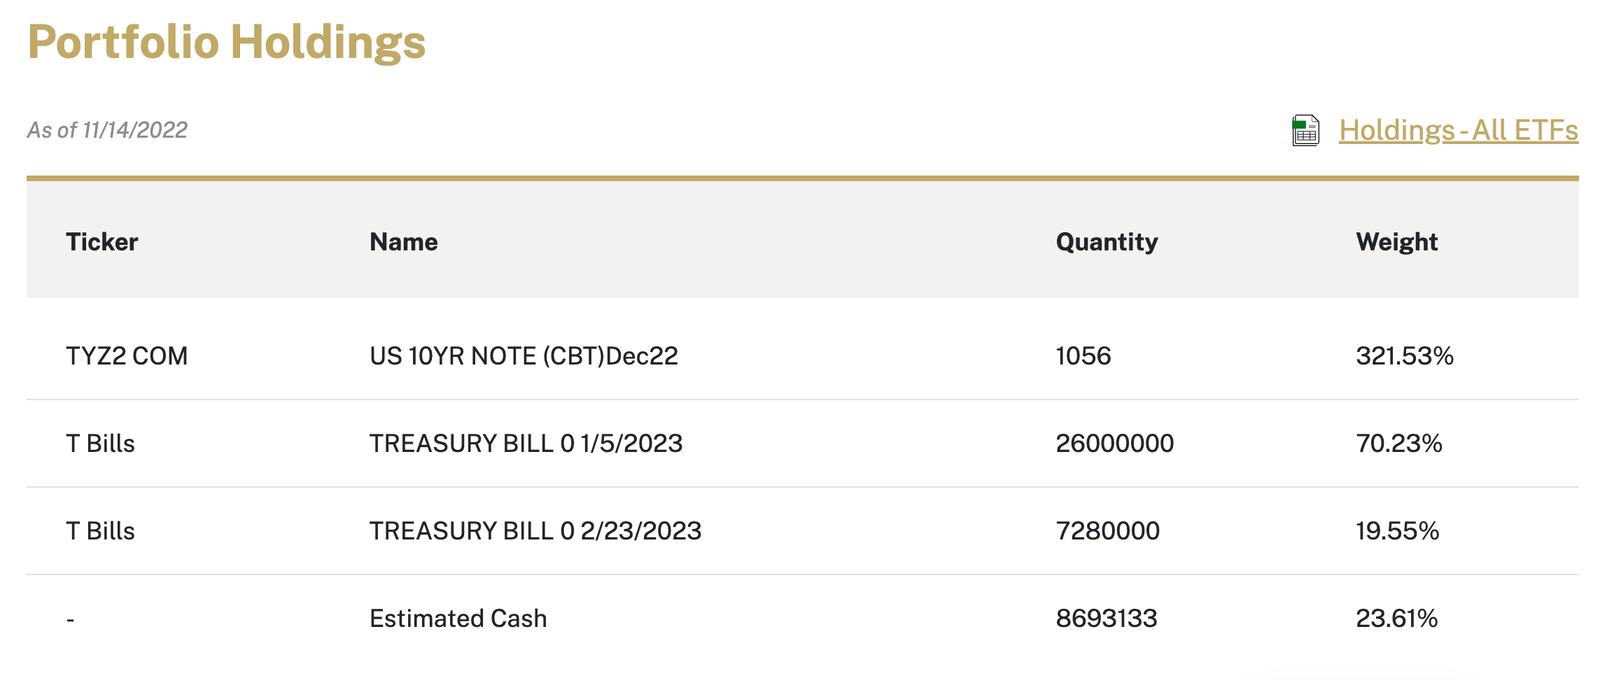
Simplify Intermediate Term Treasury Futures Strategy ETF has exposure to 321.53% of US 10 Year Note futures contract.
Ticker: TYA
Net Expense Ratio: 0.15
Distributions: Monthly
AUM: 36.8 Million
Inception: 09/27/2021

Simplify Intermediate Term Treasury Futures Strategy ETF: Principal Investment Strategy
To better understand the process of how the fund operates, let’s turn our attention towards the prospectus where I’ve summarized the key points at the very bottom (source: summary prospectus).
Principal Investment Strategies of the Fund
“The Fund is an actively managed exchange-traded fund (“ETF”) that seeks to provide total return, before fees and expenses, that matches or outperforms the performance of the ICE US Treasury 20+ Year Index (the “Index”) for a calendar quarter, not for any other period.
Under normal circumstances, the Fund invests at least 80% of its net assets (plus any borrowings for investment purposes) in futures contracts, call options, and put options on U.S. treasury futures, U.S. Government securities, such as bills, notes and bonds issued by the U.S. Treasury or fixed income ETFs that invest in U.S. Treasuries.
The Fund may hold cash and cash-like instruments or high-quality short term fixed income securities (collectively, “Collateral”).
The Collateral may consist of (1) U.S. Government securities, such as bills, notes and bonds issued by the U.S. Treasury with a duration of less than two years; (2) money market funds; (3) fixed income ETFs; and/or (4) corporate debt securities, such as commercial paper and other short-term unsecured promissory notes issued by companies that are rated investment grade or of comparable quality.
The Fund may engage in quarterly rebalancing to position its portfolio so that its exposure to the Index is consistent with its quarterly investment objective.
The impact of changes to the value of the Index each quarter will affect whether the Fund’s portfolio needs to be rebalanced.
The Index is a non-investable index that is part of a series of indices intended to assess U.S. Treasury issued debt.
The Index consists of only U.S. dollar denominated, fixed rate securities with a minimum term to maturity greater than twenty years.”
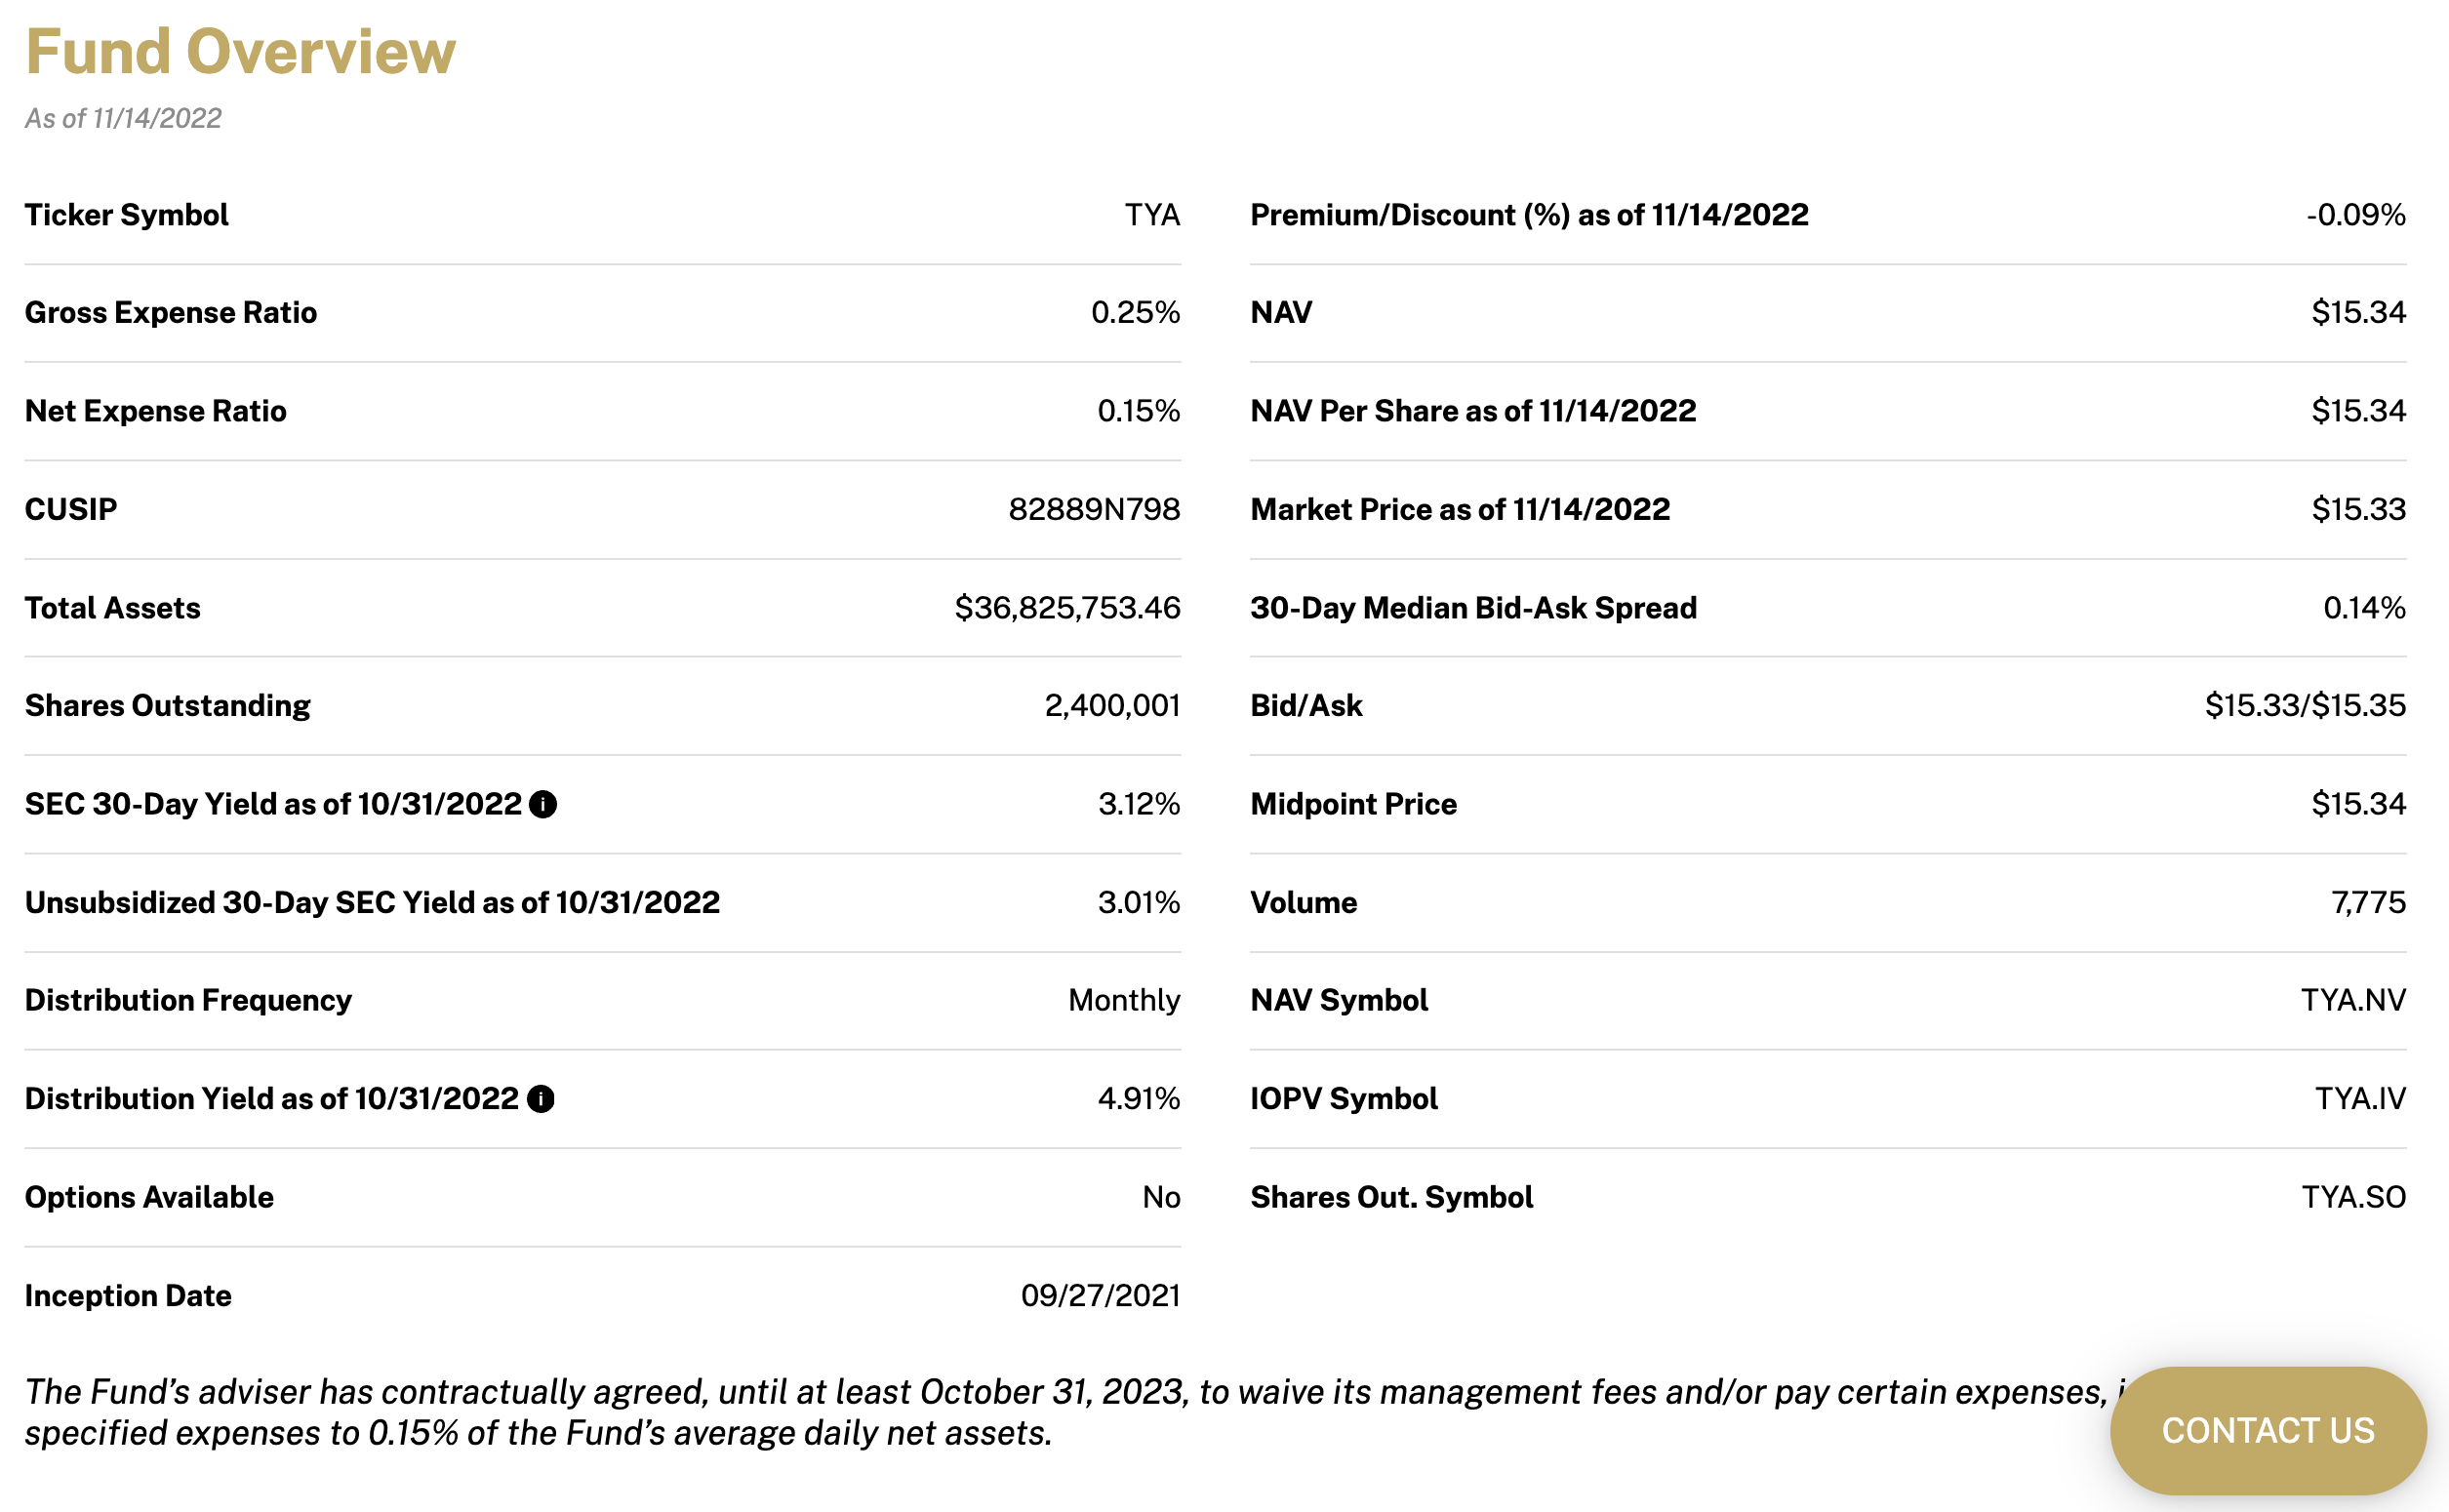
Noteworthy is how the fund is not only capital efficient but extremely cost efficient as well.
Hence, the all-in-cost at the moment is a Net Expense Ratio of 0.15.
Furthermore, this is a clear benefit of gaining exposure to the 10-year Treasury via future contracts which keeps overall fees down.
Thus, for those seeking income, monthly distributions is a feather in TYA ETF’s cap.
With the fund just celebrating its first birthday it has amassed an impressive 36.8 Million AUM.
Why do I say that is impressive since most funds need 50 AUM in order to be considered safely successful?
Because of the economic environment that has been pulverizing bonds over the past two years.
Thus, a fund that utilizes leverage is obviously feeling the full brunt of this (and then some) meaning that its best days are ahead once this current storm passes.

Simplify Intermediate Term Treasury Futures Strategy Performance
Now let’s move to explore how CTA ETF has performed since its inception.
Warning: It’s Not Pretty
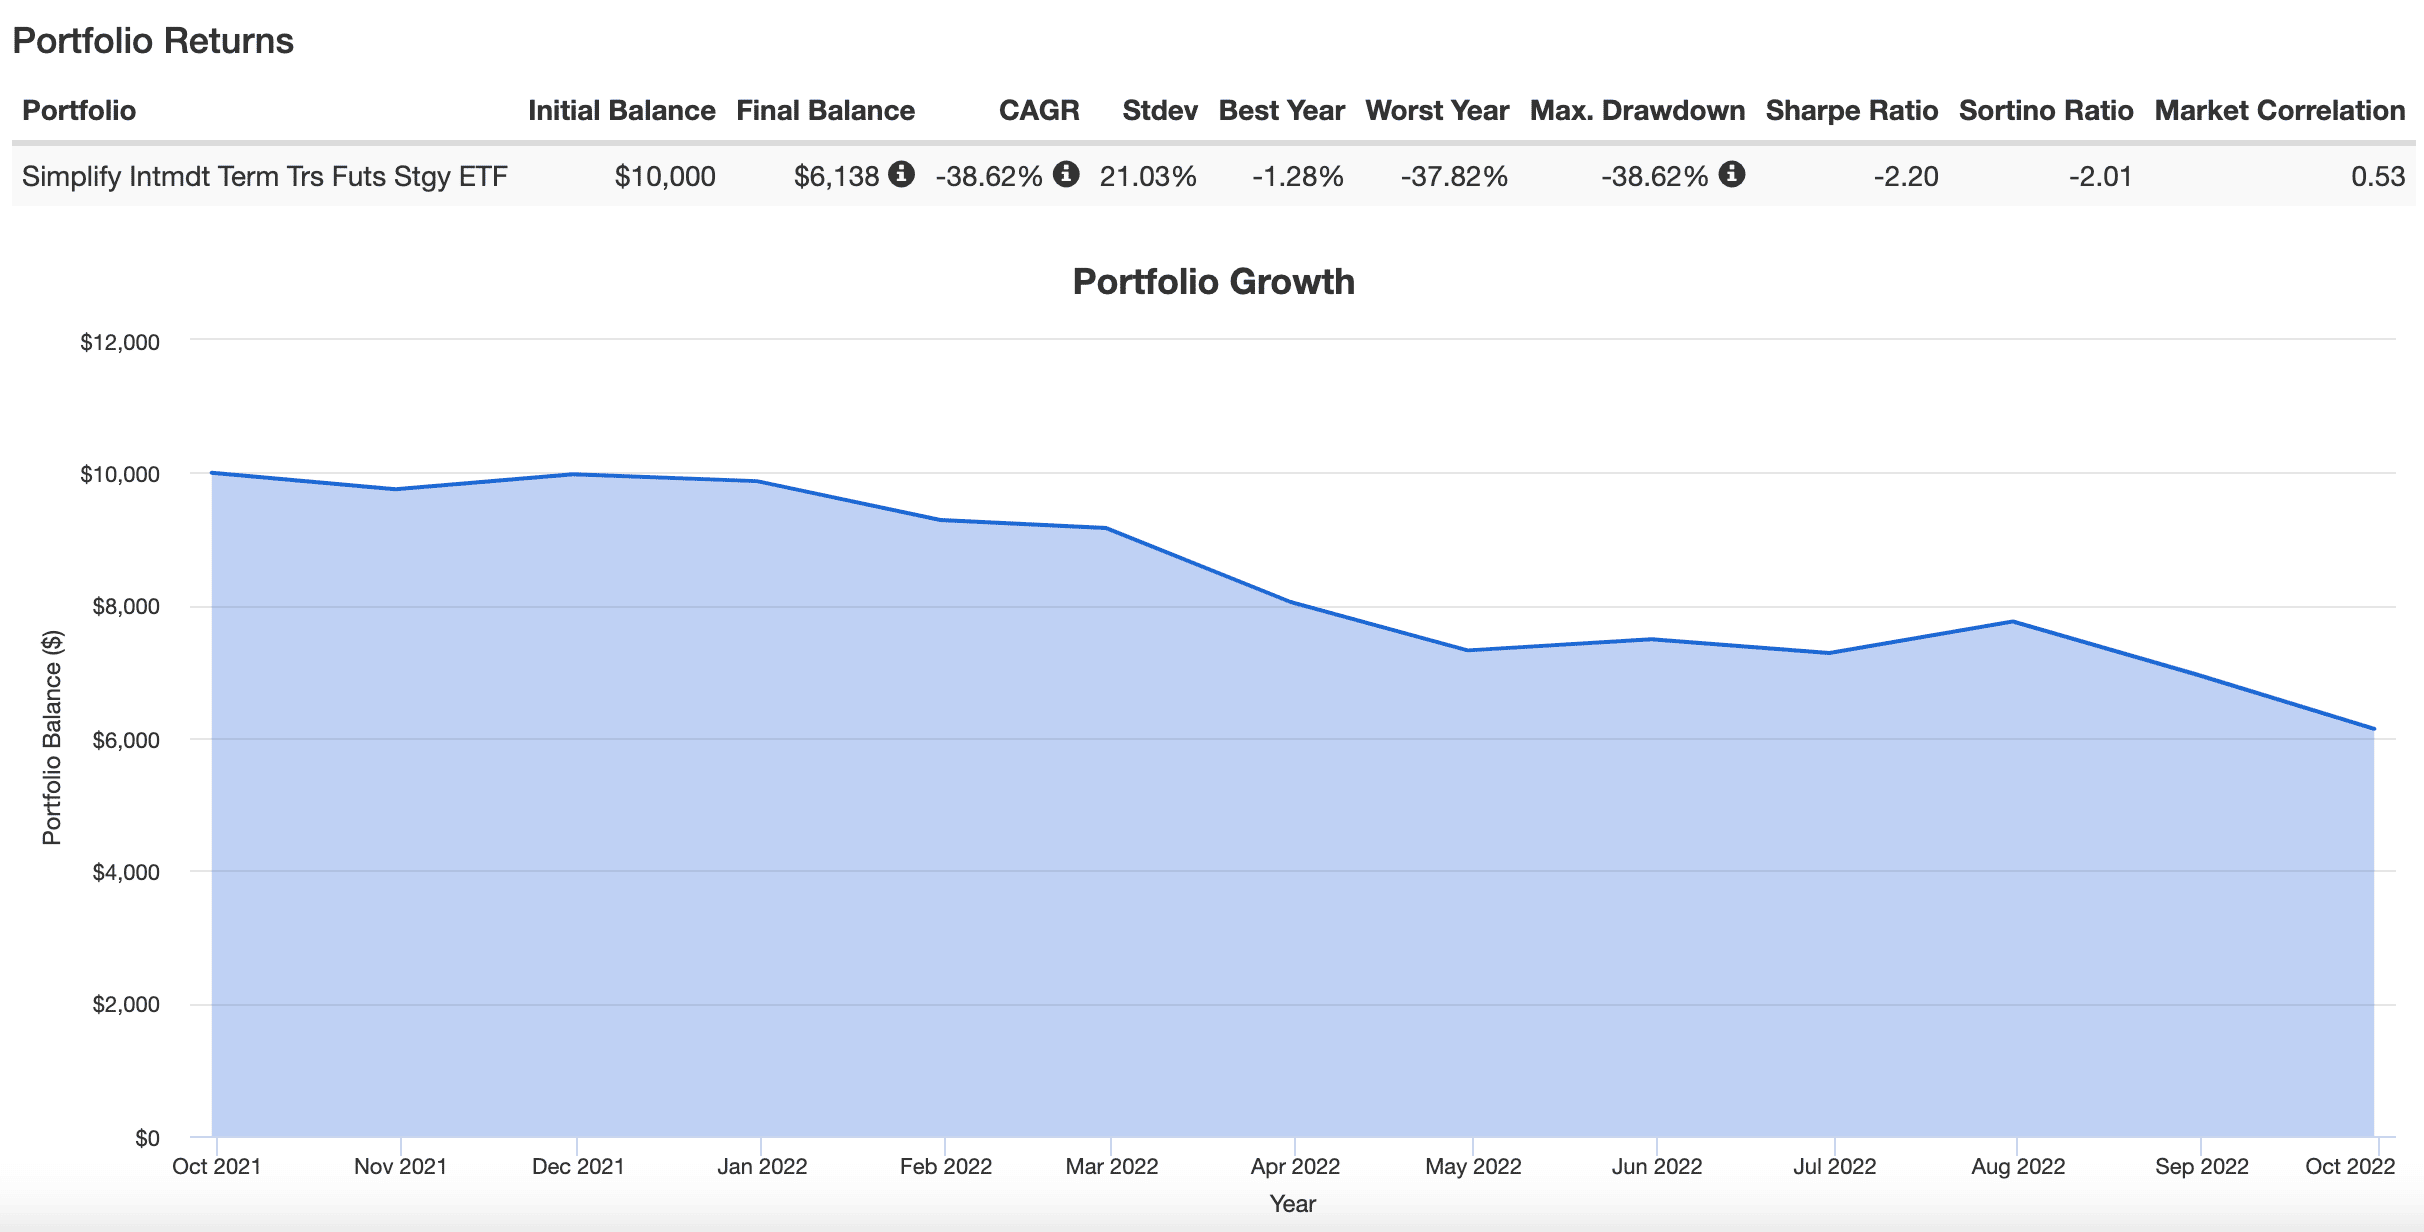
Yeah, it’s no doubt been a rough sequence of returns for TYA ETF since its inception.
CAGR of -38.62%.
Stdev of 21.03%.
Negative Sharpe and Sortino.
Indeed.
Ouch.
Leverage amplifies the good times AND the bad times.
There is no escaping that reality.
However, it’s important to zoom out and examine the bigger picture.
Do bonds have positive expected returns long-term?
Yes.
Moreover, is this possibly the worst bear market we’ve experience in fixed income in the past 100 years?
Quite possibly.
10 Year Treasury Return in 2022
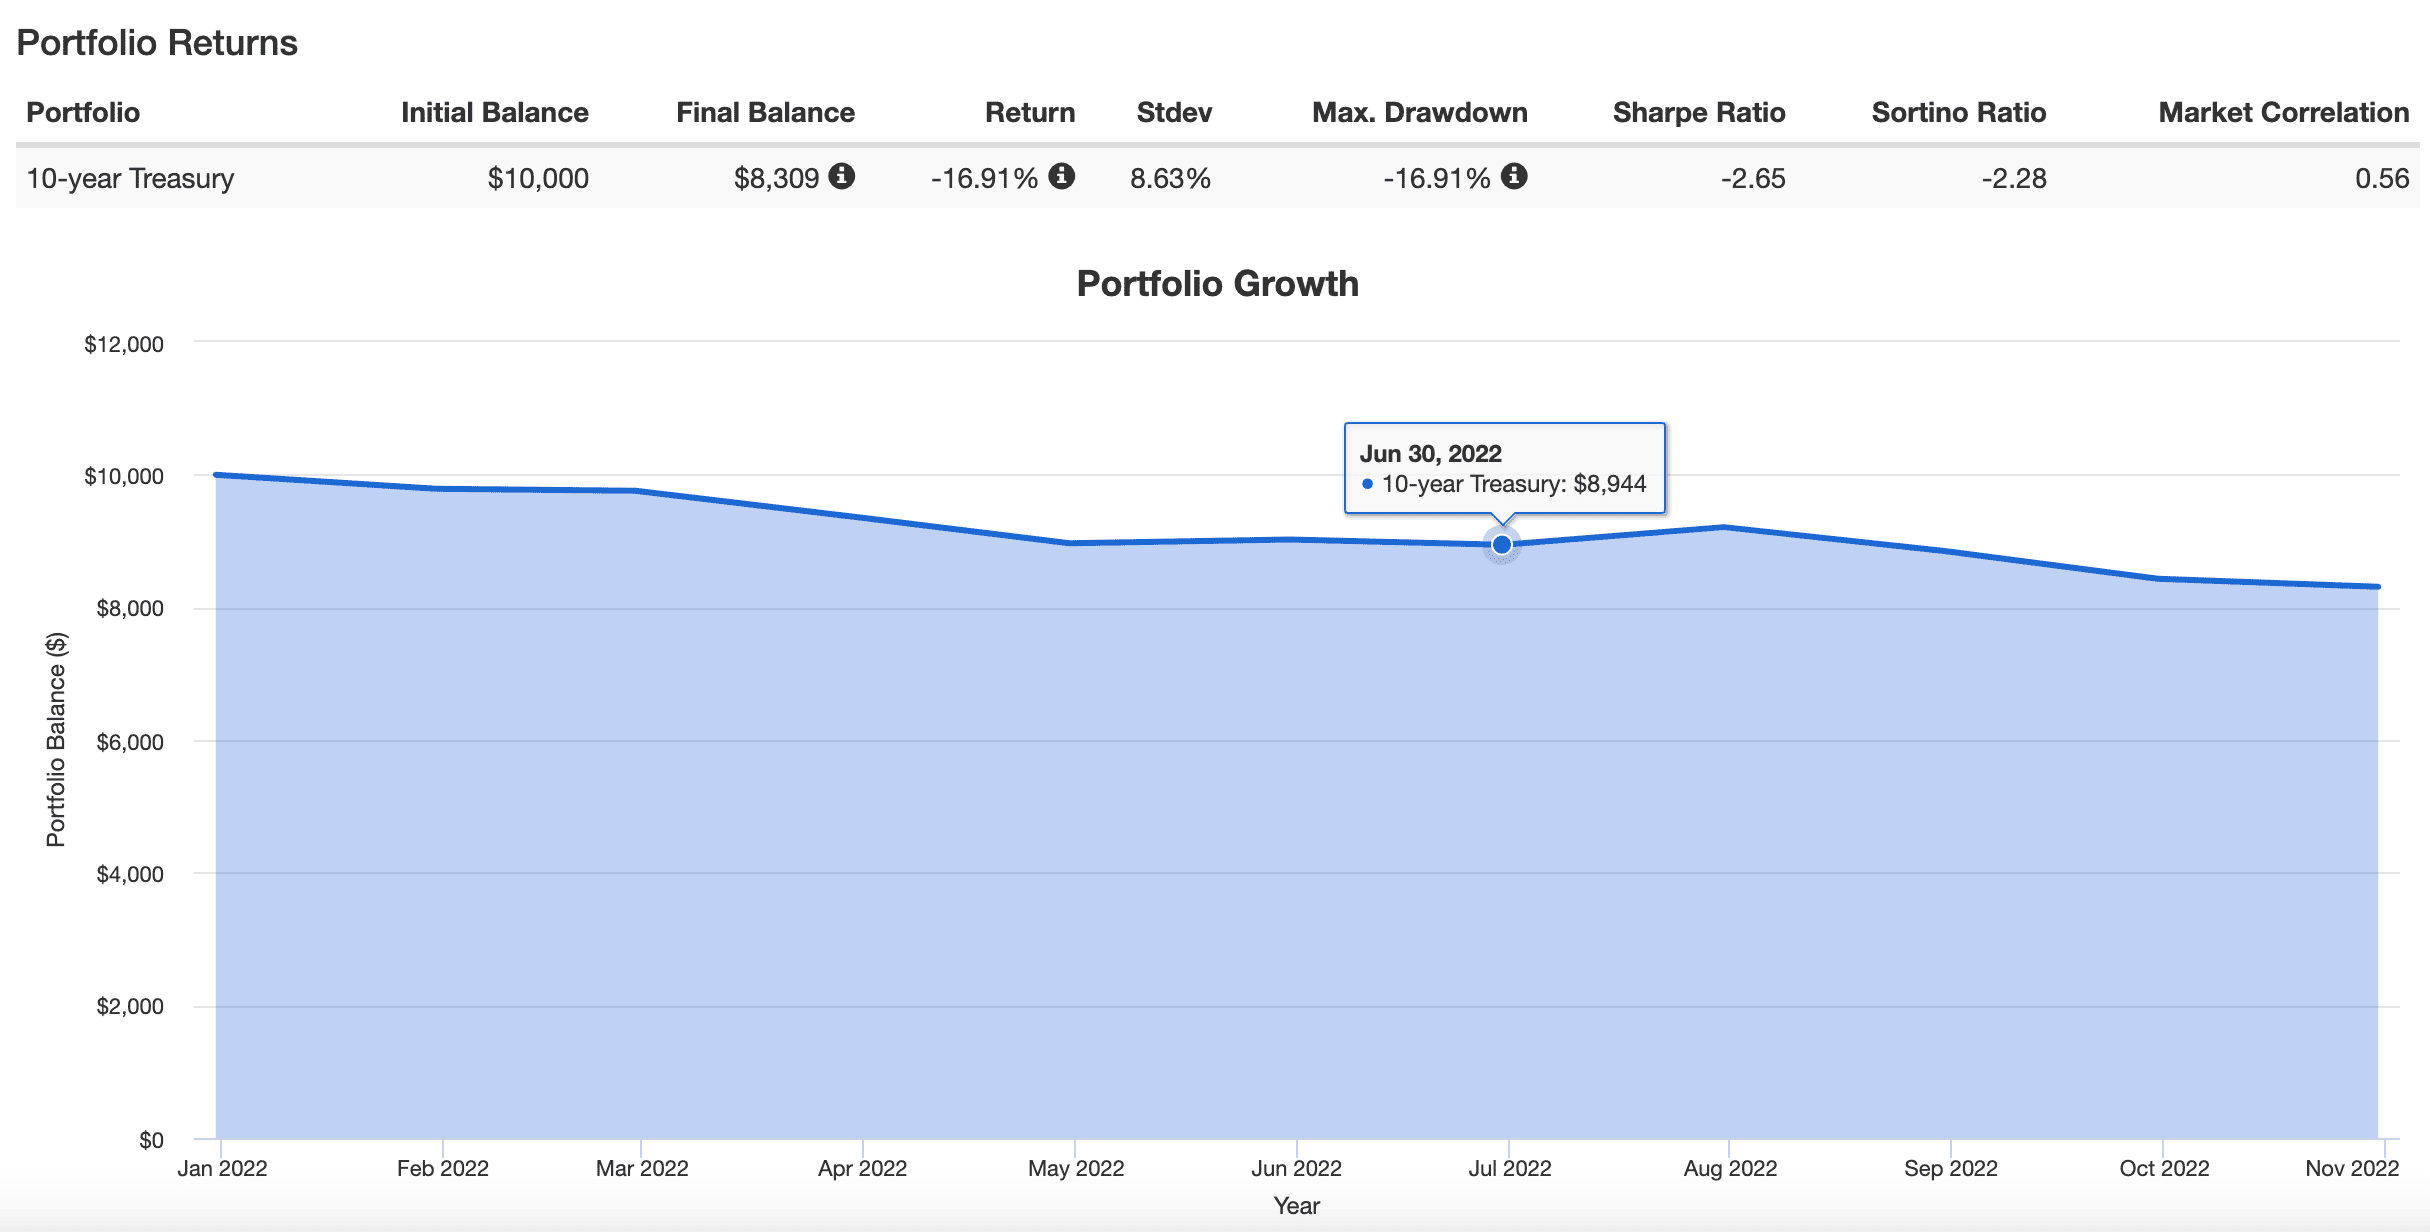
It’s been a rough year even for 100% canvas 10-Year Treasury investors.
-16.93% Return.
Let’s assume that investors and advisors are utilizing TYA ETF as the strategy is intended versus a traditional allocation towards the 10-year treasury.
10% to TYA for 30% notional exposure vs 30% to 10 Year Treasury as a “normal allocation”.
10% TYA ETF allocation: -38.6 x 0.1 = -3.86%
30% 10 Year Treasury = -16.91% x 0.3 = -5.07%
So it’s been worse for the 30% allocation with only 70% portfolio real-estate for “other things” that have conspired to keep your portfolio above water.
What about if we utilized the extra 20% space that a 10% allocation to TYA ETF creates in a portfolio for an uncorrelated strategy such as managed futures?
After all, this fund was INTENDED to create efficient portfolio space.
Let’s see what happens if we plug in KMLM ETF at 20%.
KMLM ETF Return in 2022
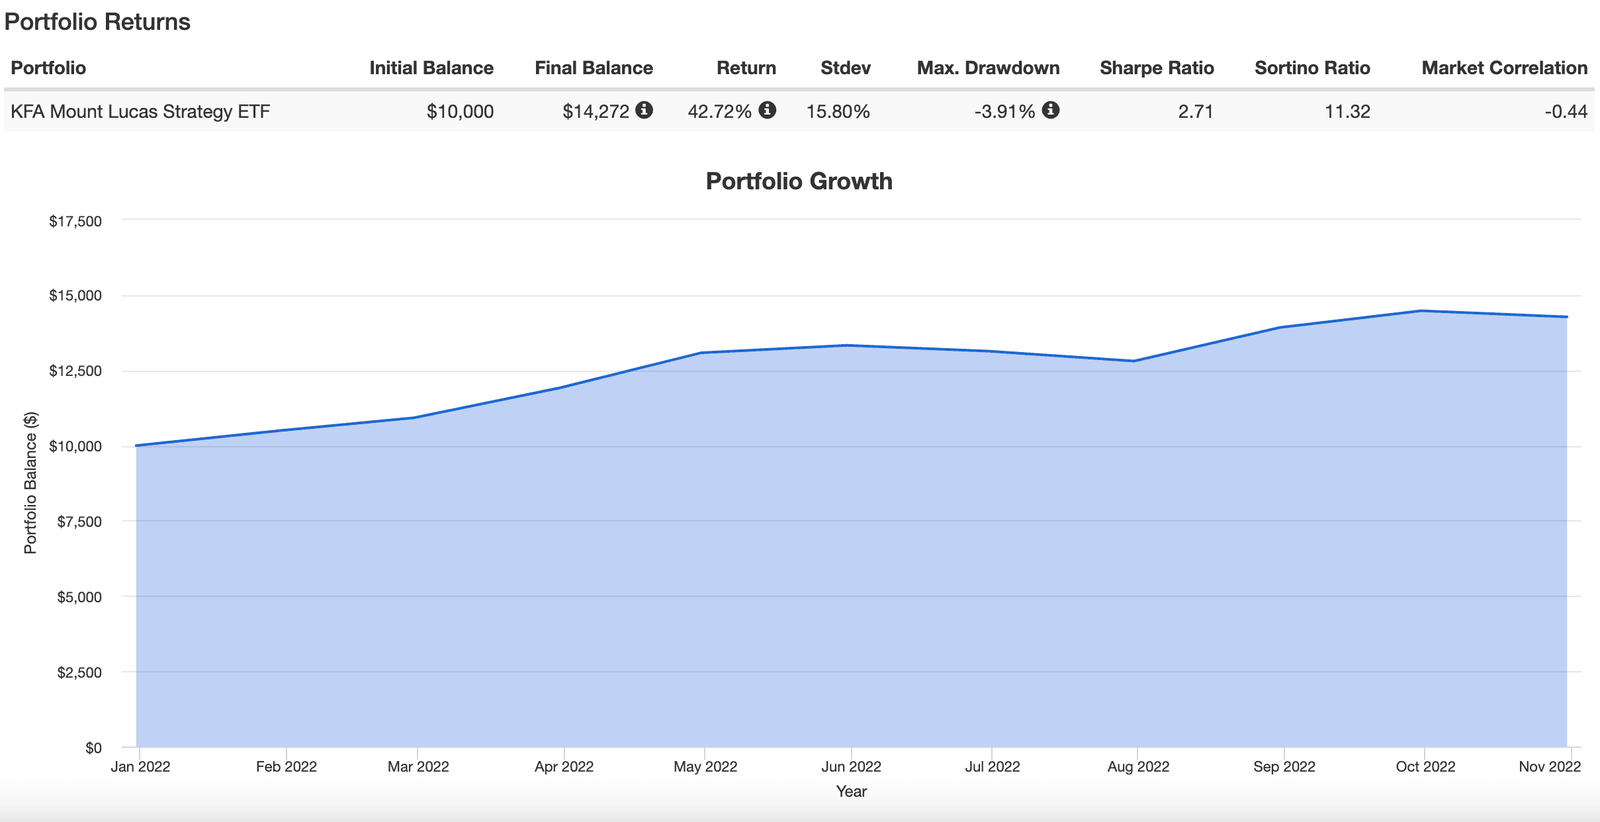
20% KMLM ETF allocation: 42.72% x 0.2 = +8.54%
Consequently, if we compare this head to head we’ve got as follows:
Scenario A (TYA ETF at 10%: -3.86%% + KMLM ETF at 20% = +8.54%) = +4.68%
Scenario B (10 Year Treasury at 30%) = -5.07%
We’re talking over 900 basis points of outperformance for TYA ETF utilized as intended (to create portfolio space for alternative strategies) versus a classic 30% allocation to the 10-Year Treasury.
In this hypothetical context, it’s easy to see how being “efficient” with your allocations to create expanded canvas portfolio space can work to your advantage as an investor even when single line items are struggling.

TYA ETF Pros and Cons
Let’s examine the potential pros and cons of Simplify Intermediate Term Treasury Futures Strategy ETF.
TYA Pros
- The most “capital efficient” product in the ETF marketplace with an allocation of 10% providing 30% notional exposure to the 10-Year Treasury
- This additional portfolio “real estate” can be utilized wisely by DIY investors and advisors to add uncorrelated asset classes and strategies
- An all-in-cost of only 0.15% puts to shame some of the other 2X to 3X products that don’t utilize futures exposures and relatively cost a fortune
- 10-Year Treasury is one of the most stable fixed income instruments to leverage given that it has had a 19 out of 23 success ratio for positive years in the 21st century
- Harvesting the yield efficiencies from the belly of the curve
- To get your fixed income portion of your portfolio over and done with potentially 85% to 90% space left for other allocations
- Support an innovative boutique firm that is changing the landscape of the ETF marketplace in a positive manner
TYA Cons
- A sequence of returns such as 2021-2022 (when TYA ETF was dropped into the frying pan) questioning the role of fixed income in a portfolio for impatient investors
- The potential to not use TYA ETF as intended by instead building a portfolio that is dialled to the max with only equity and fixed income

TYA Potential Portfolio Ideas
These asset allocation ideas and model portfolios presented herein are purely for entertainment purposes only. This is NOT investment advice. These models are hypothetical and are intended to provide general information about potential ways to organize a portfolio based on theoretical scenarios and assumptions. They do not take into account the investment objectives, financial situation/goals, risk tolerance and/or specific needs of any particular individual.
Ah, it’s time for my favorite part of the fund review.
Let’s explore a few ways in which TYA ETF can potentially enhance a portfolio at large.

Diversified Quant Portfolio #1
Let’s explore a simple 3 fund portfolio where we’re taking a 1-2-3 step approach to diversification between equities, fixed income and alternatives.
60% AVGE
30% CTA
10% TYA
Instead of a 50/30/20 portfolio of stocks/bonds/alternatives we’ve created an expanded canvas 60/30/30 configuration.
AVGE provides global core plus value factor equity strategies that should outperform market-cap weighted indexes whereas the “extra real-estate” created by TYA allows investors to benefit from 30% of a managed futures strategy with CTA ETF.

Diversified Quant Portfolio #2
In this next example we’ll highlight how we can bring even more strategies under the hood by utilizing capital efficient TYA ETF.
25% ACWF
25% ACWV
10% LBAY
25% CTA
10% TYA
5% CYA
Here we’ve got global multi-factor ACWF ETF providing value, momentum, quality and size factor tilts along with defensive ACWV ETF to round out our long-only equity strategy.
LBAY ETF brings long-short equity into the equation, CTA ETF provides us with multi-strategy Managed Futures exposure, TYA gives us 30% notional fixed income and CYA provides us with long-volatility portfolio insurance.
Overall, I like the balanced perspective of this portfolio.
Capital Efficient Quant Portfolio
Let’s imagine a scenario where an investor/advisor has the confidence to juggle as many ETFs as one might expect in a kitchen that features a rack of diversified spices.
20% FIG
20% UPAR
15% GAA
10% GDE
10% TYA
5% LBAY
5% VMOT
5% DBEH
5% HFND
5% EYLD
If I was going to build a portfolio featuring the Top 10 Underrated ETFs I’d be thrilled with the allocation above.
Moreover, the backbone of the strategy would be covered by asset allocation funds such as capital efficient FIG and UPAR at 20% each along with quant GAA taking up 15%.
Hence, we further expand the canvas of our portfolio with TYA rounding out our fixed income strategy and GDE efficiently boosting our overall notional exposure to gold.
Furthermore, we then have an ensemble of long-short equity funds LBAY, VMOT and DBEH further enhancing our alternative sleeve of the portfolio.
HFND is a bit more of a long-short wildcard whereas EYLD offers an Emerging Markets multi-factor powerhouse to round things out.
Consequently, we’ve overall got a multi-strategy expanded canvas portfolio with significant exposure to alternative asset classes along with research supported factor strategies.
Thus, I think this beats the tar out of the typical milquetoast 60/40 portfolio by a country mile when it comes to overall diversification.
And we’ve used underrated ETFs with AUM under 100 Million to put it all together.
Overall, I like what I see.

TYA — 12-Question FAQ (Simplify Intermediate Term Treasury Futures Strategy ETF)
What is TYA in one sentence?
TYA is a capital-efficient ETF that delivers roughly 3× notional exposure to intermediate U.S. Treasury futures to target the duration of a 20+ year Treasury index while using only a modest capital allocation.
What did TYA used to be called?
It recently rebranded to Simplify Intermediate Term Treasury Futures Strategy ETF from Simplify Risk Parity Treasury ETF.
How does TYA get its bond exposure?
It primarily holds U.S. Treasury futures (rolled quarterly) plus Treasuries/short-term collateral, aiming to target the duration of the ICE 20+ Year U.S. Treasury Index via the intermediate part of the curve.
Why do you recommend TYA so often in model portfolios?
Capital efficiency. A 10% sleeve can provide about 30% notional duration—freeing ~20% of portfolio “real estate” to deploy into diversifiers (e.g., managed futures) without giving up core duration.
What are the key fund stats?
Ticker: TYA • Net Expense Ratio: 0.15% • Distributions: Monthly • Inception: 2021-09-27 • Structure: Active ETF using Treasury futures and collateral.
How is TYA intended to be used?
As a building block for efficient fixed income exposure—pair a small TYA weight with other sleeves (equities/alternatives) to create expanded-canvas allocations (e.g., 60/30/30 stocks/bonds/alts).
What are the main advantages?
High capital efficiency, low cost for levered duration, potential roll/carry benefits in the belly of the curve, and the ability to reallocate freed capital to uncorrelated strategies.
What are the key risks?
Leverage cuts both ways (bigger drawdowns when rates rise), bonds and stocks can sell off together (e.g., 2022), and misuse (stuffing only stocks+bonds) forfeits the diversification benefit.
How does rebalancing and collateral management work?
Futures are rolled quarterly (guided by open interest/liquidity). Collateral sits in cash/short-duration Treasuries/money markets/high-quality short-term debt.
What’s the long-run context for Treasuries here?
Since 2000 the 10-Year Treasury has been positive the vast majority of years, with episodic drawdowns; recent losses reflect an unusually severe bond bear market, not the long-term norm.
How has TYA fared since launch?
It launched into that historic bond drawdown, so early returns were rough—a reminder that sequence risk is real with levered duration; the case for TYA hinges on forward bond return prospects and portfolio efficiency.
Who might consider TYA?
Investors who want efficient duration, plan to use the freed capital for diversifiers (e.g., managed futures, long-vol, alt risk premia), and accept the volatility/complexity of futures-based leverage.
Nomadic Samuel Final Thoughts
TYA ETF represents one of the most crucial and yet underrated expanded canvas products out there in the marketplace today.
Why is it underrated?
That’s easy to explain.
The brutal bear market in fixed income during 2021-2022 has created a fog that has clouded the long-term judgement of most investors.
Fixed income is typically the most stable part of a portfolio from a long-term perspective.
Yeah.
I know.
Hard to remember.
Challenging to believe given the current economic environment.
But it remains true from a historical perspective.
The potential for a fund like TYA to absolutely rip in the coming years is quite high.
What goes up must come down.
And what has been beaten down to a pulp often rises like a phoenix from the ashes.
But most important is to remember why you’d want to consider a fund like TYA in the first place.
It’s to create capital efficient space in your portfolio for “other” strategies.
It takes a contrarian investor to buy when blood is on streets,
Take it or leave it.
Now over to you.
What do you think of TYA ETF?
Is it on your radar?
Let me know in the comments below.
That’s all I’ve got.
Ciao for now.
Important Information
Comprehensive Investment Disclaimer:
All content provided on this website (including but not limited to portfolio ideas, fund analyses, investment strategies, commentary on market conditions, and discussions regarding leverage) is strictly for educational, informational, and illustrative purposes only. The information does not constitute financial, investment, tax, accounting, or legal advice. Opinions, strategies, and ideas presented herein represent personal perspectives, are based on independent research and publicly available information, and do not necessarily reflect the views or official positions of any third-party organizations, institutions, or affiliates.
Investing in financial markets inherently carries substantial risks, including but not limited to market volatility, economic uncertainties, geopolitical developments, and liquidity risks. You must be fully aware that there is always the potential for partial or total loss of your principal investment. Additionally, the use of leverage or leveraged financial products significantly increases risk exposure by amplifying both potential gains and potential losses, and thus is not appropriate or advisable for all investors. Using leverage may result in losing more than your initial invested capital, incurring margin calls, experiencing substantial interest costs, or suffering severe financial distress.
Past performance indicators, including historical data, backtesting results, and hypothetical scenarios, should never be viewed as guarantees or reliable predictions of future performance. Any examples provided are purely hypothetical and intended only for illustration purposes. Performance benchmarks, such as market indexes mentioned on this site, are theoretical and are not directly investable. While diligent efforts are made to provide accurate and current information, “Picture Perfect Portfolios” does not warrant, represent, or guarantee the accuracy, completeness, or timeliness of any information provided. Errors, inaccuracies, or outdated information may exist.
Users of this website are strongly encouraged to independently verify all information, conduct comprehensive research and due diligence, and engage with qualified financial, investment, tax, or legal professionals before making any investment or financial decisions. The responsibility for making informed investment decisions rests entirely with the individual. “Picture Perfect Portfolios” explicitly disclaims all liability for any direct, indirect, incidental, special, consequential, or other losses or damages incurred, financial or otherwise, arising out of reliance upon, or use of, any content or information presented on this website.
By accessing, reading, and utilizing the content on this website, you expressly acknowledge, understand, accept, and agree to abide by these terms and conditions. Please consult the full and detailed disclaimer available elsewhere on this website for further clarification and additional important disclosures. Read the complete disclaimer here.


Thank you for this review!
Can you do an analysis of the new TUA short term treasury ETF?