I’m not sure I’ve ever reviewed a fund that has had such a challenging year to date, yet offers as much long-term potential for patient investors.
The fund I’m referring to is RPAR Risk Parity ETF.
In this comprehensive review I’m going to present the case as to why Risk Parity investing strategies are in many ways superior to the classic 60/40 portfolio which is by and large considered the industry standard.
Furthermore, we’ll take a deep-dive into the strategy behind Risk Parity investing while examining its historical performance and risk management prowess via a comprehensive backtest.
Early readers of Picture Perfect Portfolios may remember that one of my first ever fund reviews was for UPAR Ultra Risk Parity ETF.
RPAR Risk Parity ETF is the original fund whereas UPAR ETF is the more bold and brazen younger sibling featuring an expanded canvas that stretches its limits further.
All of this talk about Risk Parity and we’ve yet to define it.
As you might expect, Risk Parity investing is about managing risk primarily.
Instead of keying in on just two asset classes (stocks and bonds), risk parity investment strategies often feature a more diverse set of asset classes with exposures to gold and commodities as an example.
Assets within a risk parity portfolio receive space in accordance to the level of volatility they bring to the table.
US Equites / Treasury / Gold Volatility from 1972 until 2022
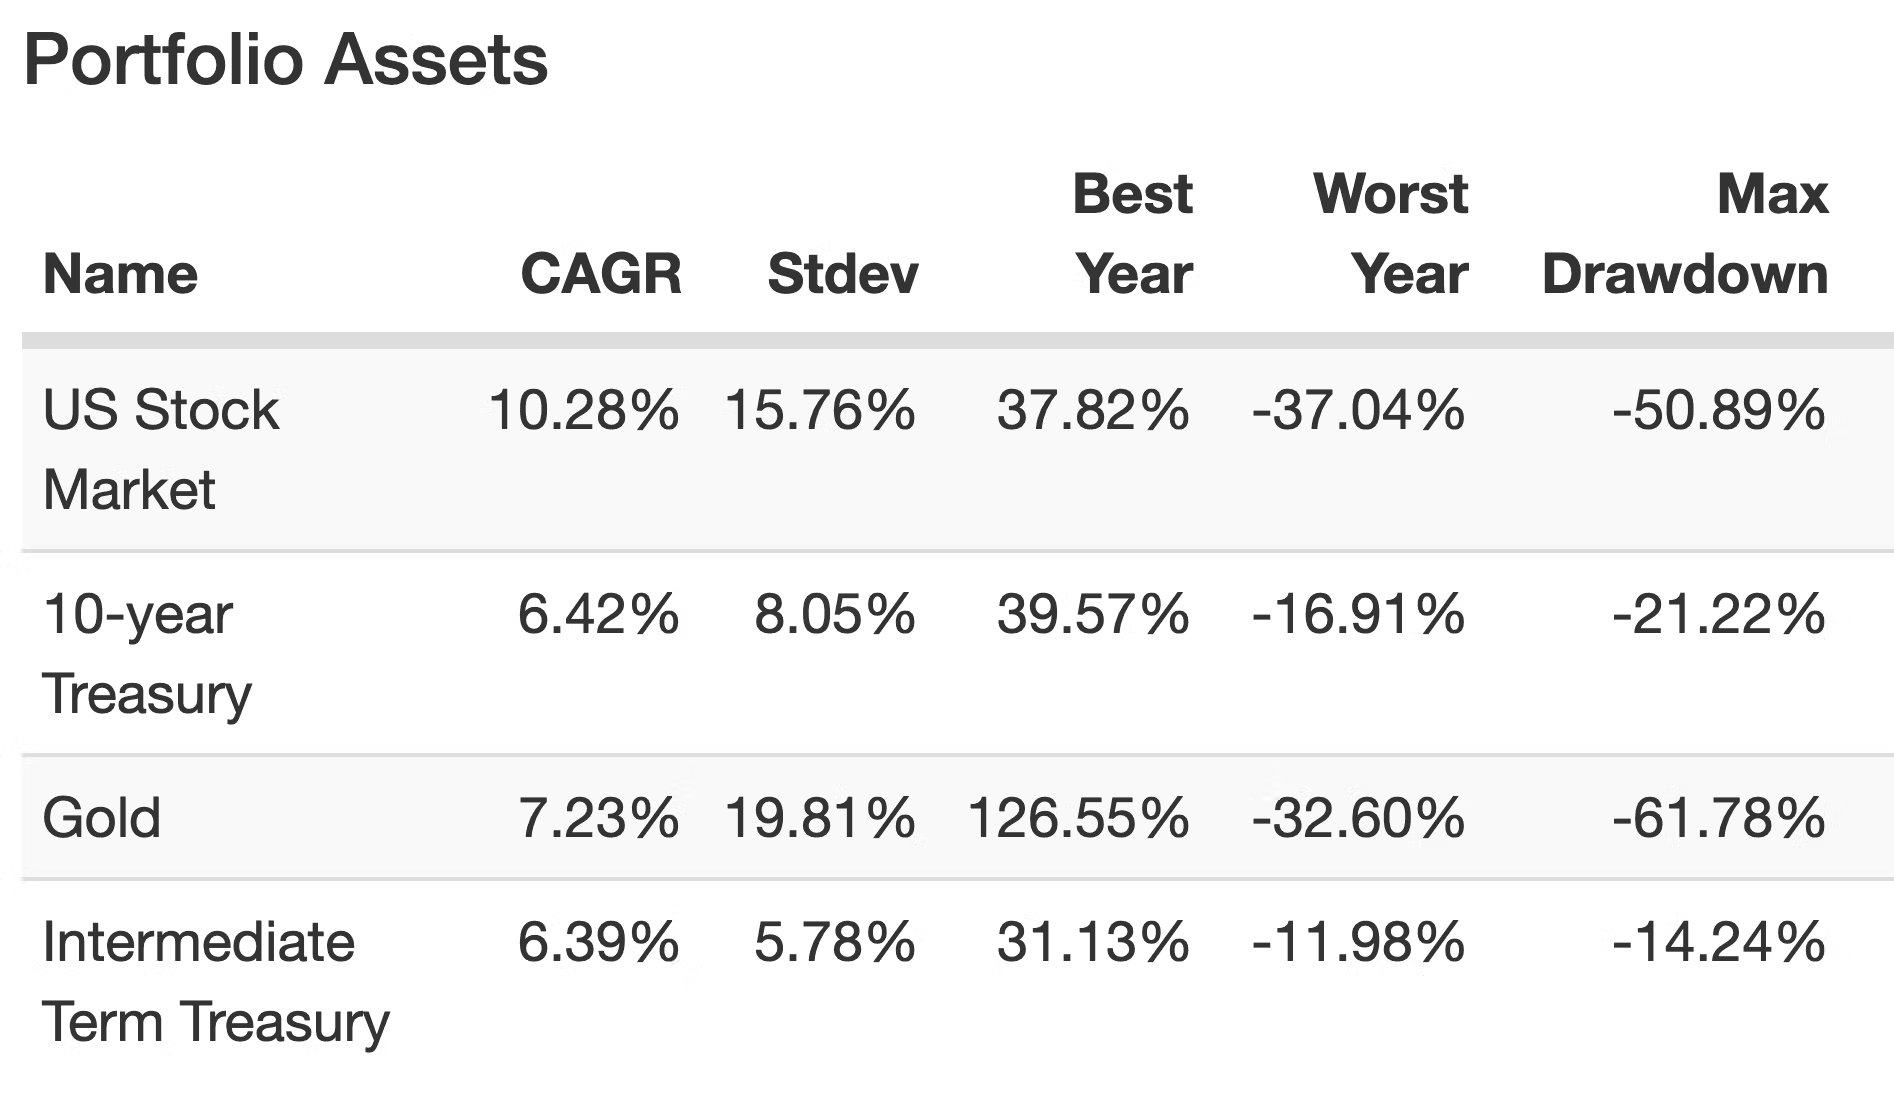
For instance, US equities have historically been a volatile asset class with 15.76% standard deviation dating back to 1972.
Moreover, Gold ups the ante coming in at a whopping 19.81%!
Conversely, both the 10-Year Treasury and Intermediate Term Treasury are more stable investments (albeit with lower returns) featuring 8.05% and 5.78% standard deviation respectively.
To arrange these in accordance to a Risk Parity investment strategy, we’ll create more space in the portfolio for assets that offer a smoother ride.
In our hypothetical example we’ll have two larger slots of 30% for less volatile 10-Year Treasury and Intermediate Treasury.
And we’ll have two smaller slots of 20% for highly volatile US equities and Gold.
Our Risk Parity Portfolio would be as follows:
30% 10-Year Treasury (risk: 8.05%)
30% Intermediate Term Treasury (risk: 5.78%)
20% US Equities (risk: 15.76%)
20% Gold (risk: 19.81%)
Risk Parity Portfolios have historically offered investors a more palatable sequence of returns.
The best comparison would be the hypothetical Risk Parity Portfolio we’ve arranged above versus the Classic 60/40 Portfolio.

Risk Parity Portfolio vs 60/40 Portfolio
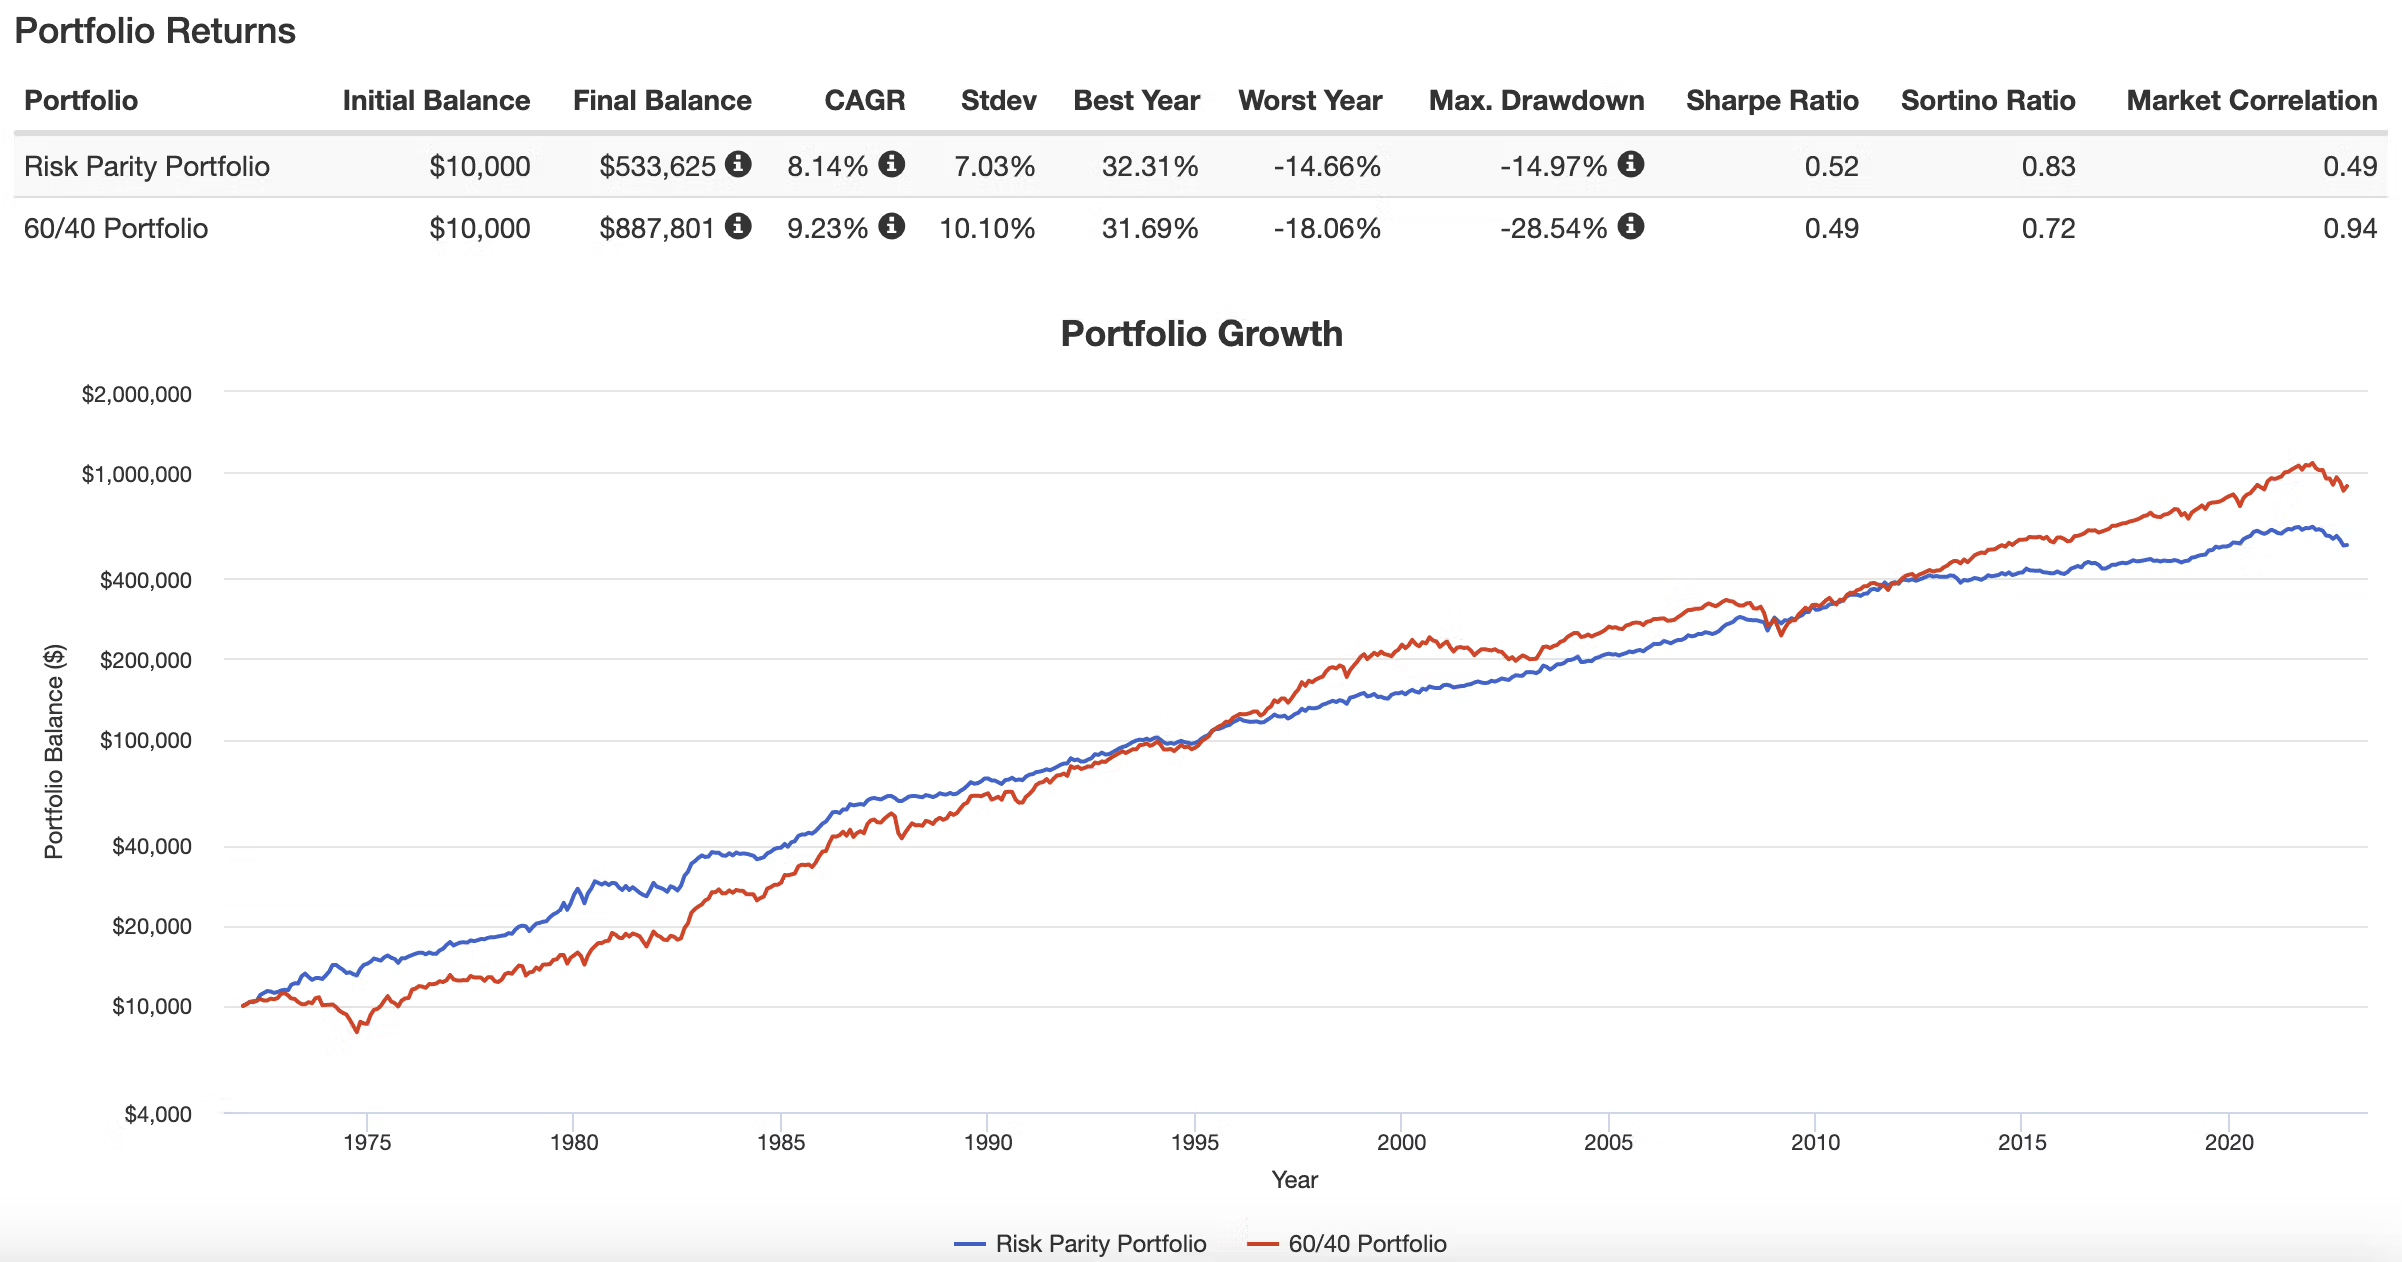
Indeed, the 60/40 portfolio with a more significant allocation to equities offers investors higher returns long-term with a 9.23% CAGR vs 8.14% CAGR for the Risk Parity Portfolio.
However, that’s its only win.
The Risk Parity Portfolio is 307 basis points more defensive (7.03% vs 10.10%) featuring returns above risk as reflected by its higher Sharpe Ratio (0.52 vs 0.49) and Sortino Ratio (0.83 vs 0.72).
Its ability to manage max drawdowns is where it truly shines with its worst case scenario being -14.97% versus -28.54% for the 60/40 Portfolio.
Risk Parity Portfolio vs 60/40 Portfolio Drawdowns
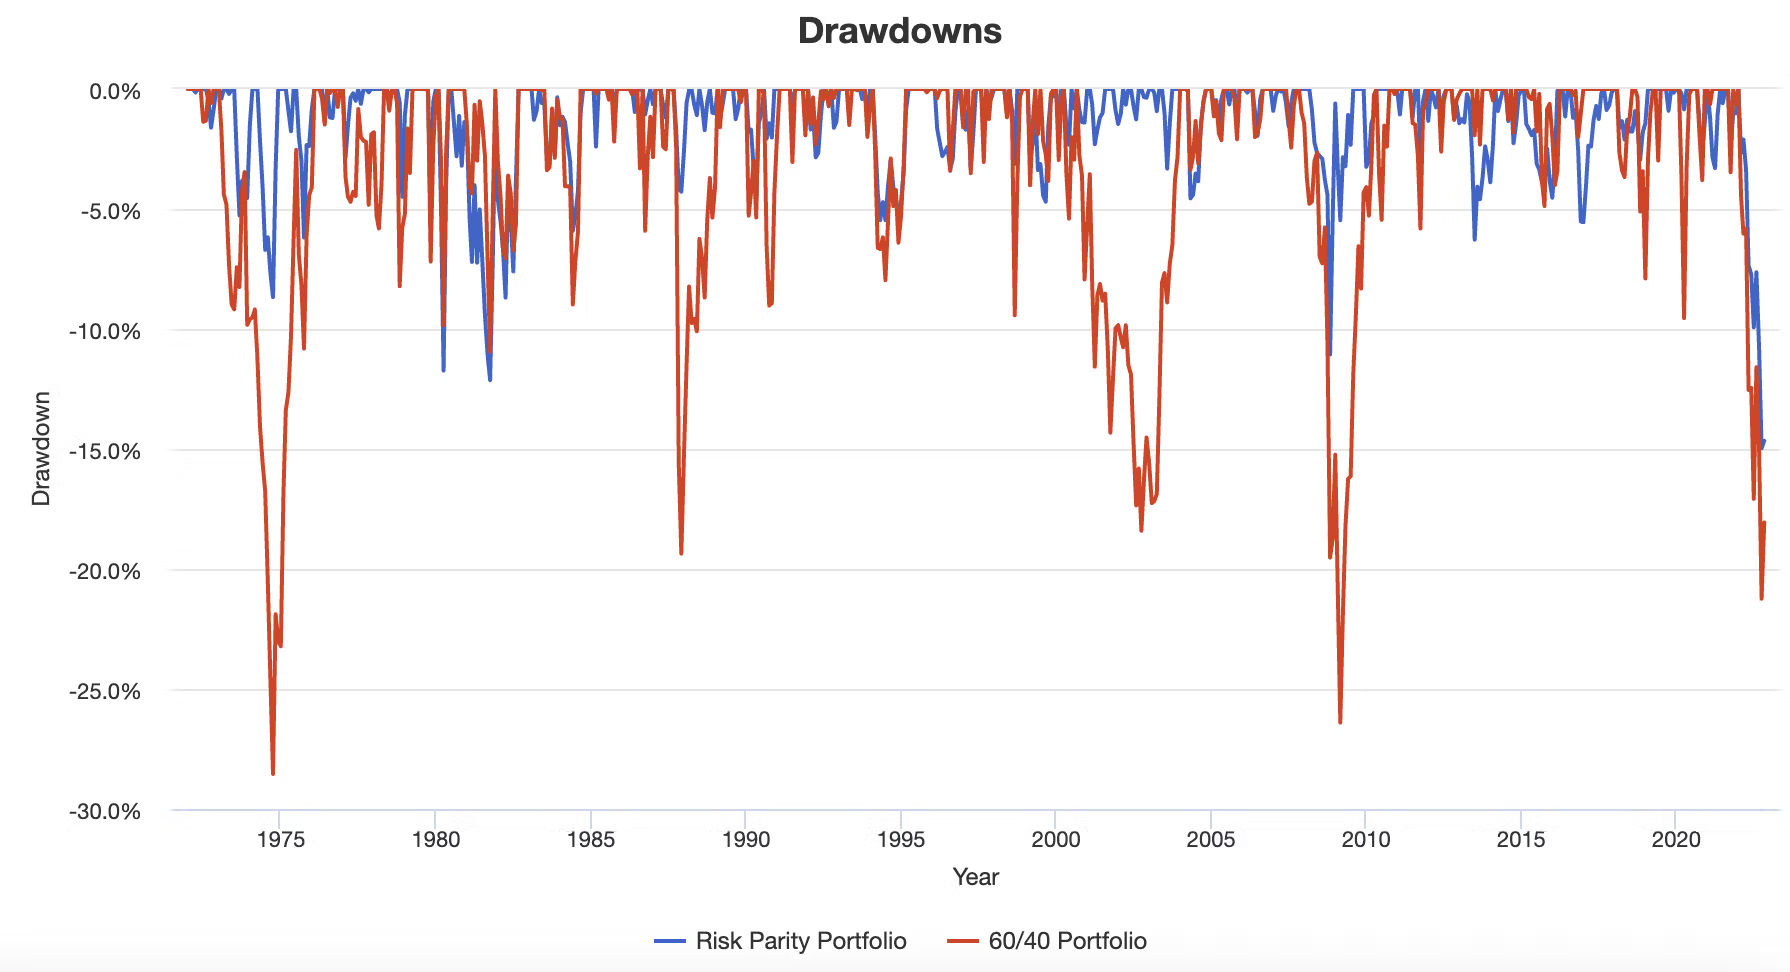
This drawdown visual really says it all!
Feast your eyes upon the mid 70s, late 80s, early 2000s and late 2000s to witness the difference between the Risk Parity Portfolio and 60/40 Portfolio.
It’s only this year where they’ve both struggled mightily.
Drawdowns for Historical Market Stress Periods
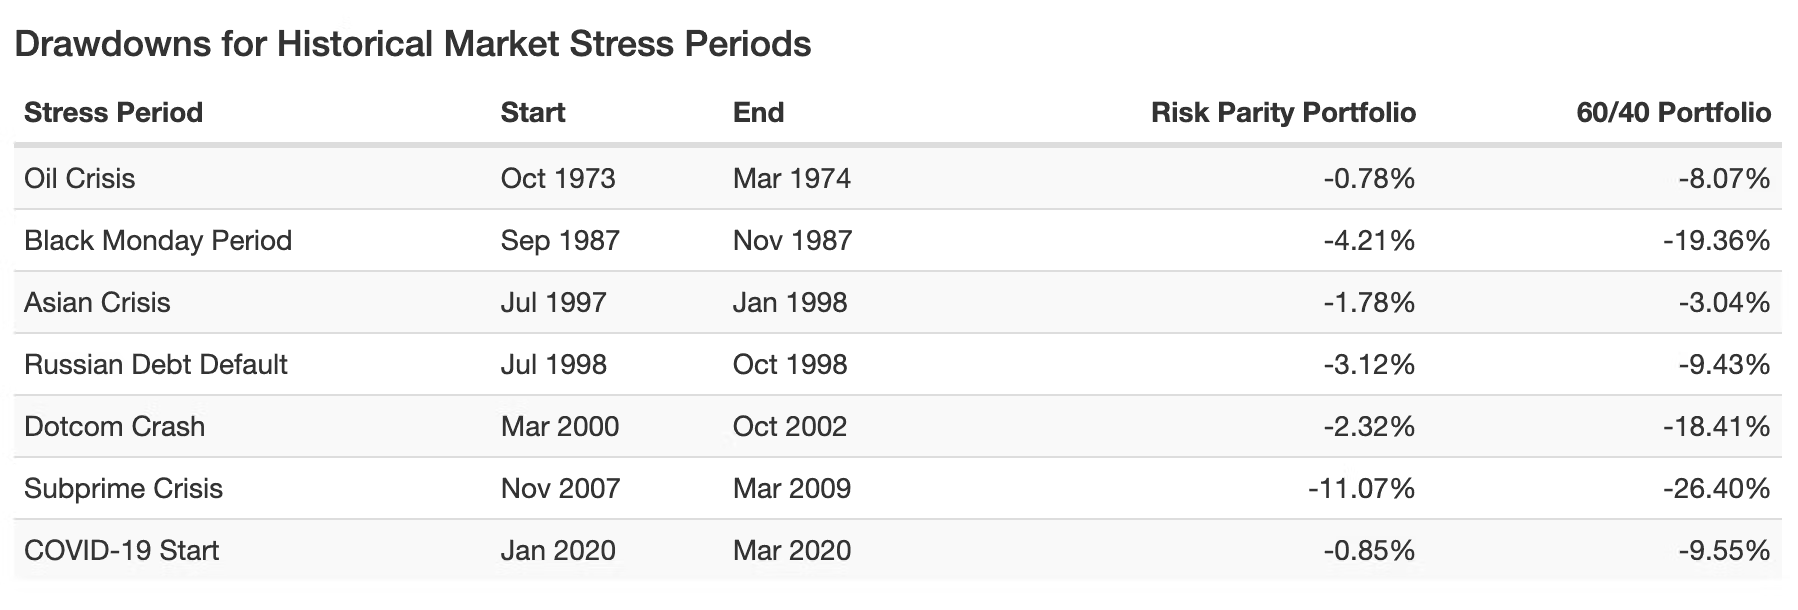
It’s remarkable the stability the Risk Parity Portfolio demonstrated during historical market stress periods with the Subprime Crisis, Dotcom Crash and Black Monday Period as the most clear examples.
Low Roll Period: Risk Parity Portfolio vs 60/40 Portfolio
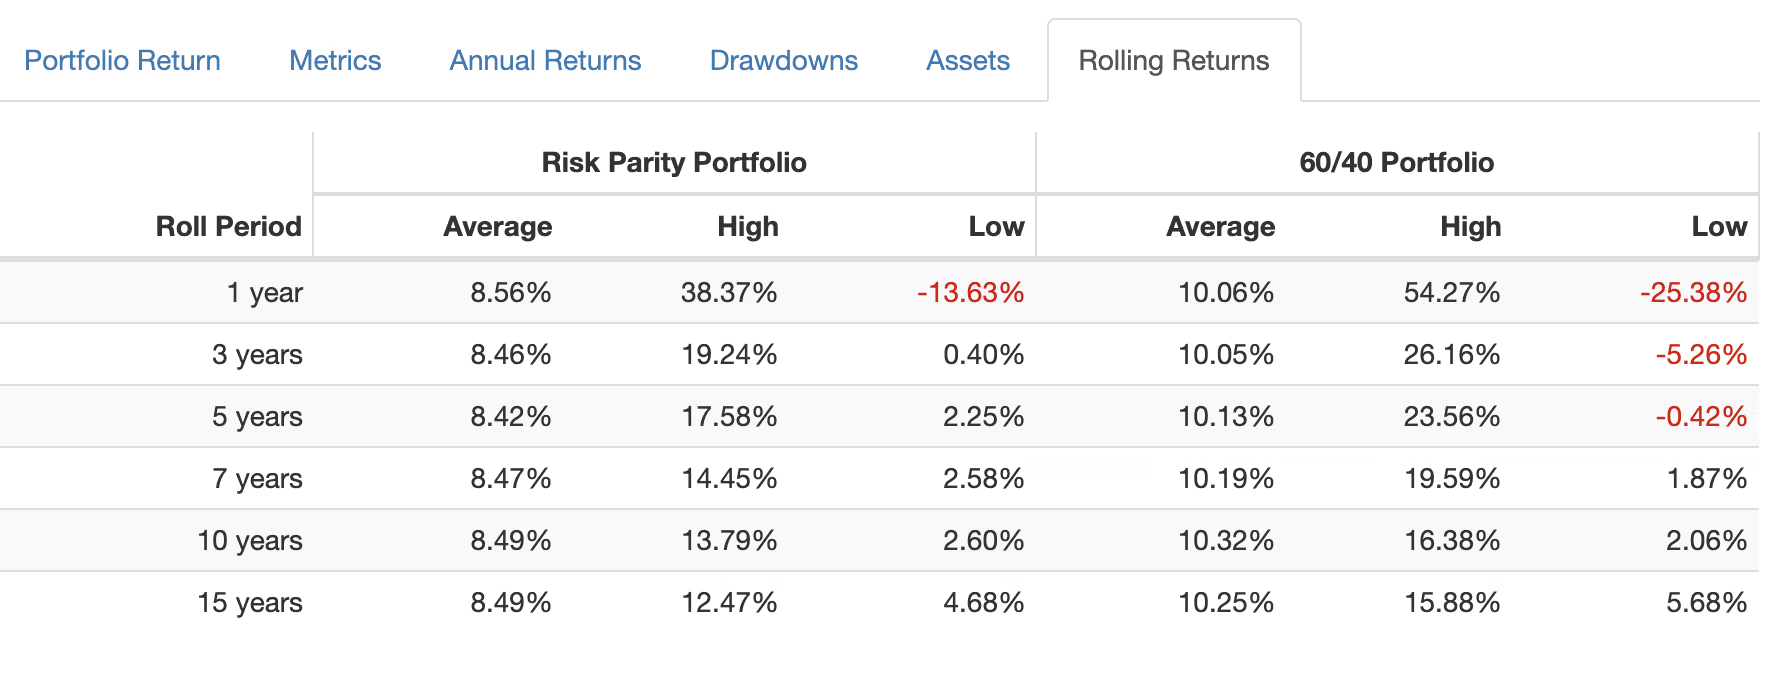
Finally, we’ll examine low roll period results between the two different portfolios to see which offers a more palatable worst case scenario.
The Risk Parity Portfolio has frustrated investors with only a low roll period of -13.63% over a 1 year period.
Whereas the 60/40 Portfolio has had below water performance that would’ve required investors to endure 5 years of misery.
Hence, it’s clear how a Risk Parity Portfolio would be an attractive alternative to a 60/40 portfolio, even within the confines of a 100% canvas, but it becomes even more intriguing when you expand the canvas beyond 100%.
RPAR Risk Parity ETF and UPAR Ultra Risk Parity ETF are both expanded canvas portfolio solutions.

RPAR ETF Review | RPAR Risk Parity ETF Review

About the Author & Disclosure
Picture Perfect Portfolios is the quantitative research arm of Samuel Jeffery, co-founder of the Samuel & Audrey Media Network. With over 15 years of global business experience and two World Travel Awards (Europe’s Leading Marketing Campaign 2017 & 2018), Samuel brings a unique global macro perspective to asset allocation.
Note: This content is strictly for educational purposes and reflects personal opinions, not professional financial advice. All strategies discussed involve risk; please consult a qualified advisor before investing.
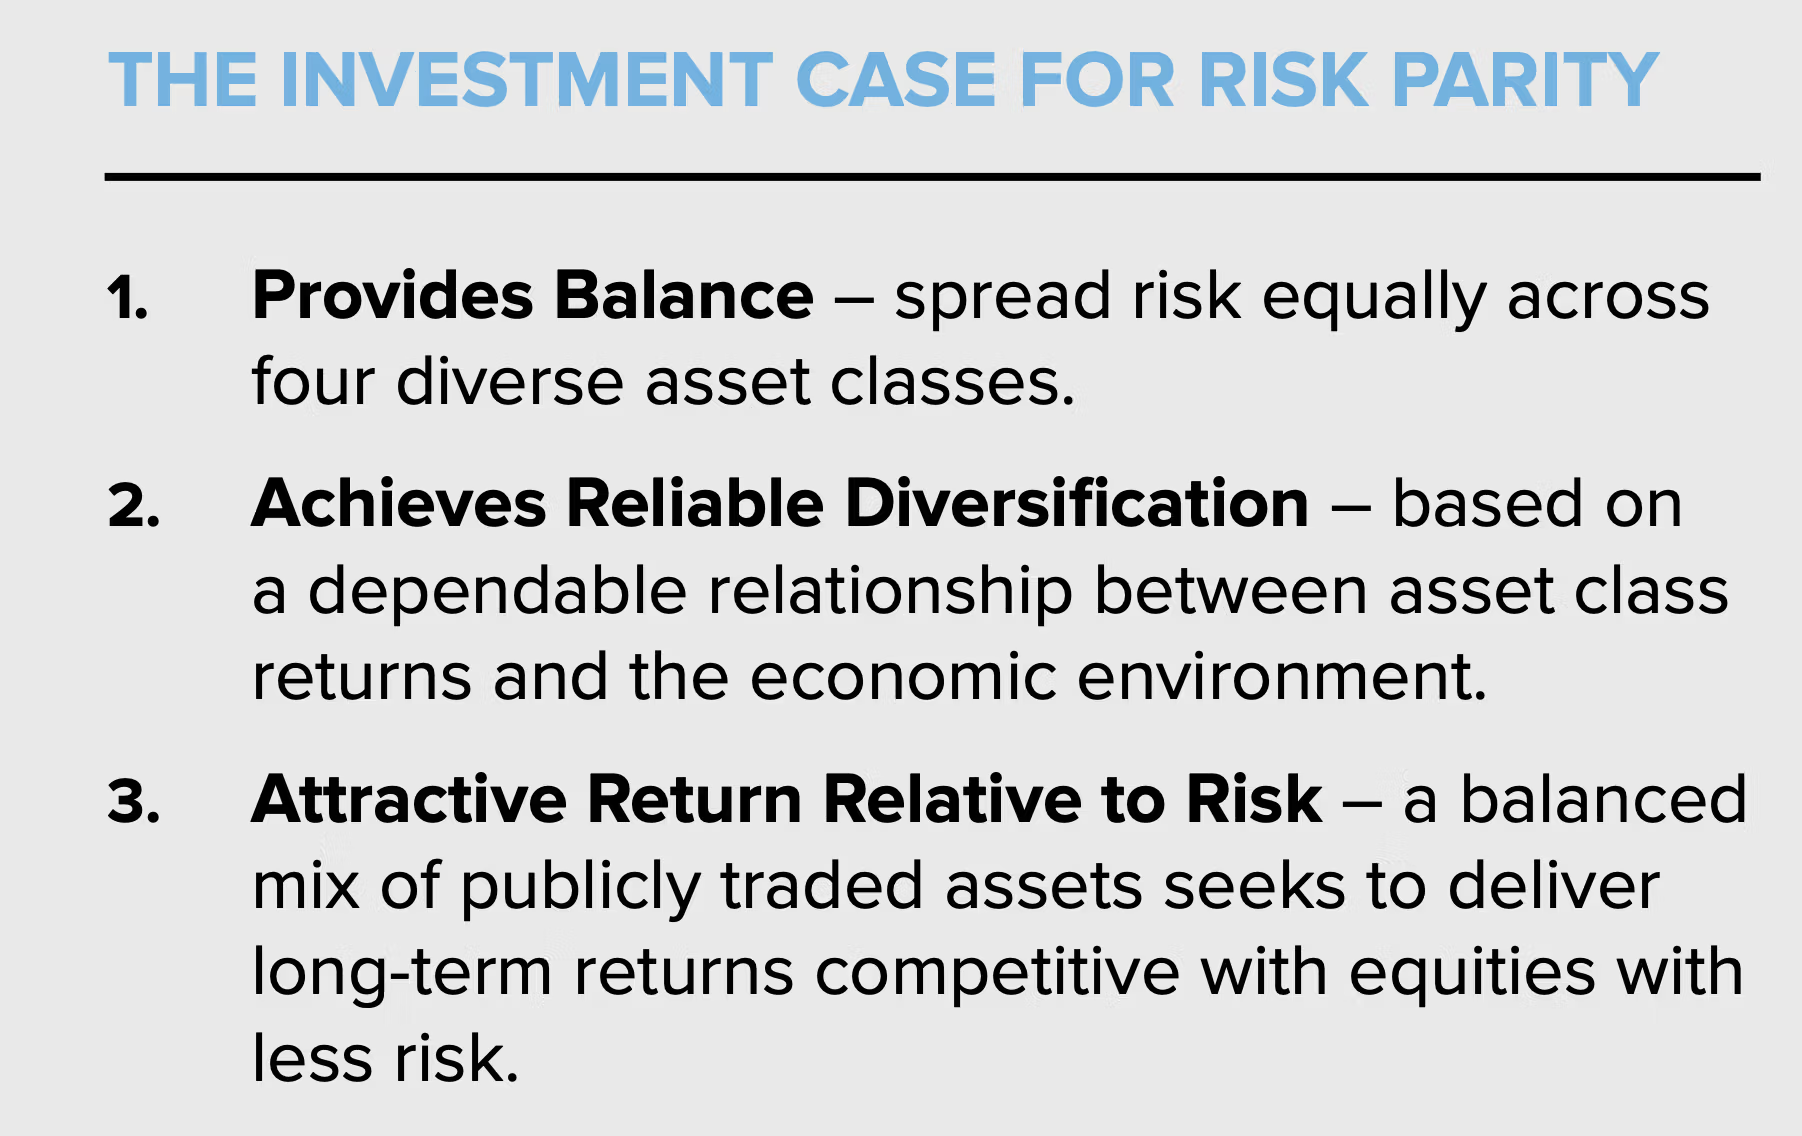
The Investment Case For Risk Parity
The investment case for Risk Parity has been laid out succinctly by the folks over at Evoke Advisors.
The Investment Case for Risk Parity:
- Provides Balance – spread risk equally across four diverse asset classes.
- Achieves Reliable Diversification – based on a dependable relationship between asset class returns and the economic environment.
- Attractive Return Relative to Risk – a balanced mix of publicly traded assets seeks to outperform equities with comparable risk.

Why Invest in RPAR?
- Provides access to a time-tested risk parity methodology used by some of the world’s most sophisticated investors.
- Implemented in a tax efficient, liquid ETF structure.
- Seeks an equity-like return with less risk over the long run by diversifying across four asset classes, each with unique environmental biases.
Why does it make sense?
By improving diversification, risk parity can potentially offer higher returns relative to risk compared to equities or equity-centric portfolios.
How can it be used?
Either as an alternative asset or a total public portfolio solution.
In summary, RPAR ETF presents itself as a more diversified style of long-only asset allocation (equities, fixed income, commodities, gold) with the potential to outperform 100% equities with less overall risk as a potential portfolio puzzle piece or total portfolio solution.
source: Arro Financial Communications YouTube

RPAR ETF Overview, Holdings and Info
Let’s pop open the hood of RPAR ETF to see what kind of goodies the fund has to offer investors!
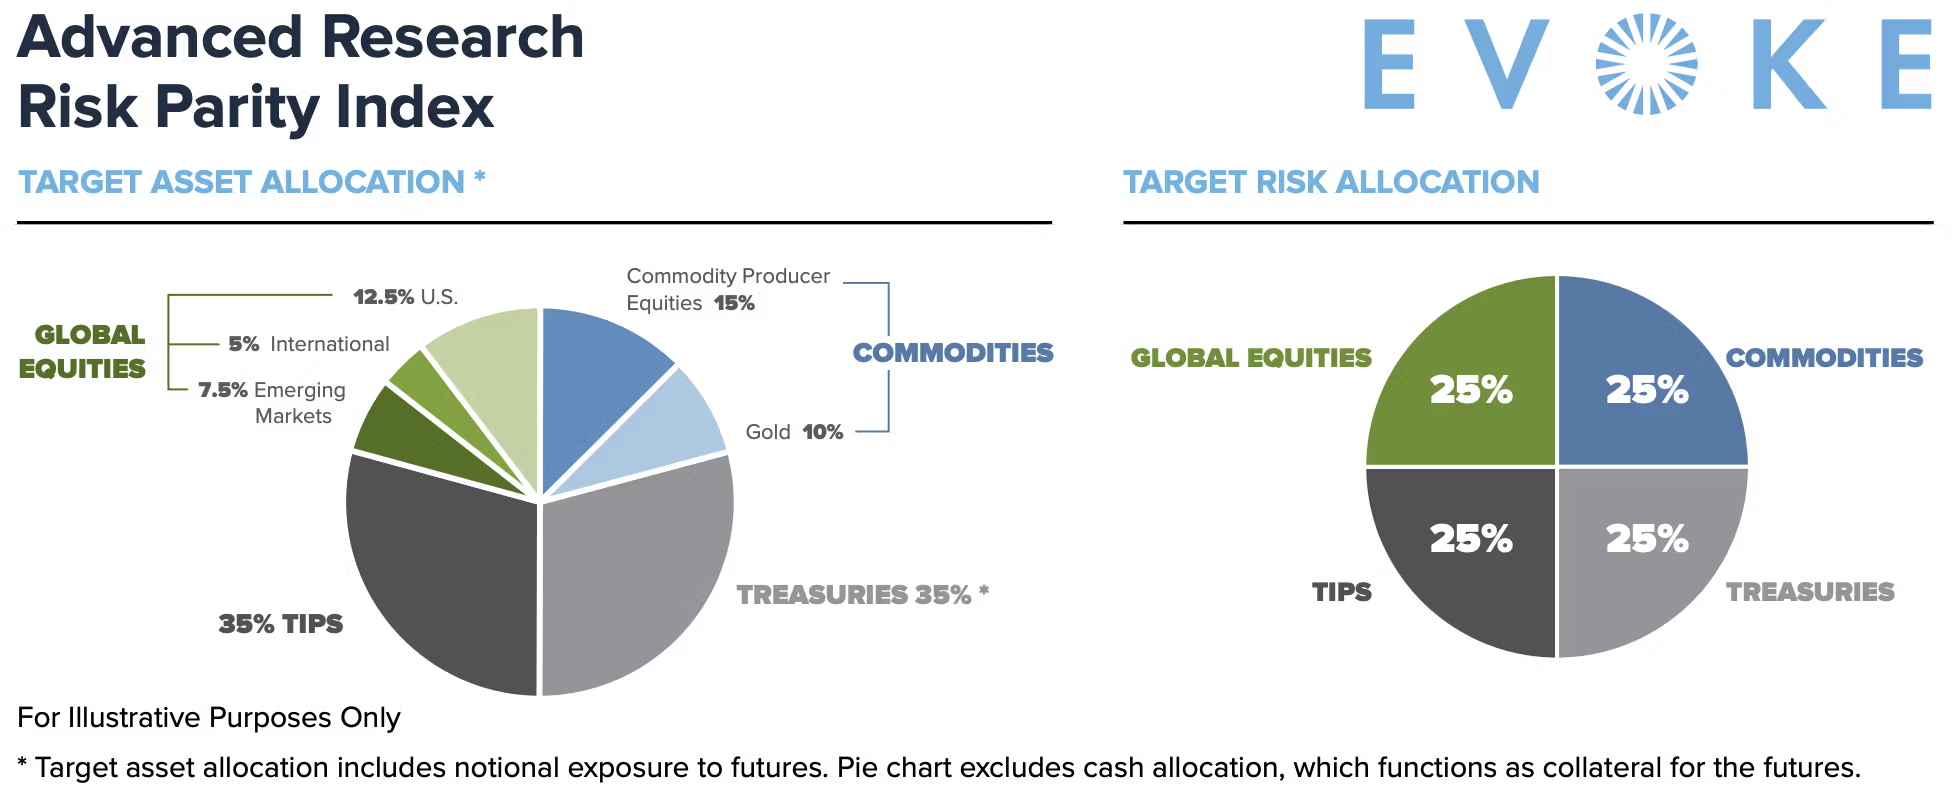
RPAR Risk Parity ETF has plenty to offer investors, so we’ll break things down by equity, fixed income and commodity sleeves.
RPAR ETF Equity Allocation
In terms of its equity sleeve it avoids home country bias by offering investors US, International Developed and Emerging Markets equities.
US equities take up half of the equation (12.5% of 25%) whereas Emerging Markets (7.5% of 25%) and International Developed (5% of 25%) round things out.
US vs Int-Dev vs EM Markets Correlations
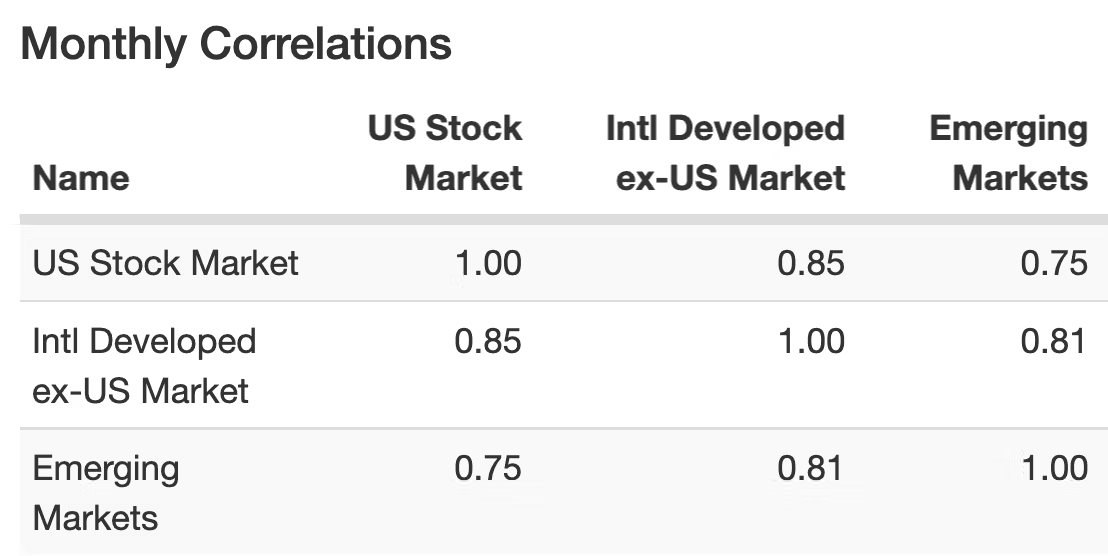
Noteworthy, is a more sizeable allocation to Emerging Markets than to International Developed Markets.
From a correlations standpoint this contrarian decision makes some sense given that Emerging Markets are less correlated with US Markets in comparison to International Developed Markets:
US Stock Market: 0.75 (Emerging Markets) vs 0.85 (International Developed Markets)
Overall, I’m pleased that RPAR ETF has decided to go global, avoid home country bias and potentially ruffle some feathers by overweighting EM equities.
RPAR ETF Fixed Income Allocation

Here we can see that RPAR ETF is committed to a 35% allocation to US TIPS (15+ year) and a 35% slab dedicated towards US Treasuries (10 Year and Ultra via futures).
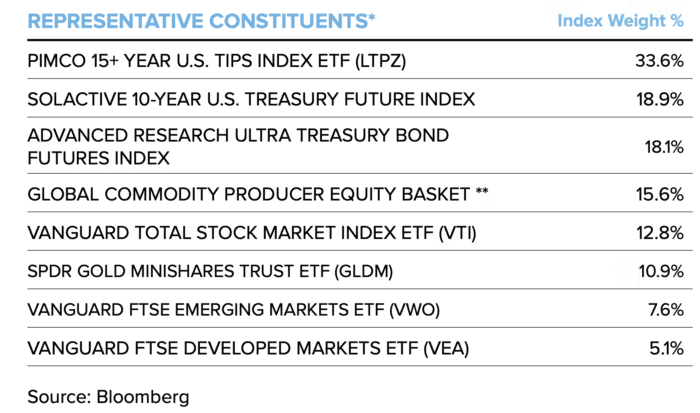
The 10-Year Treasury and Ultra Treasury are covered by capital efficient futures.
Let’s examine the historical correlations between the three fixed income allocations.
RPAR Fixed Income Monthly Correlations
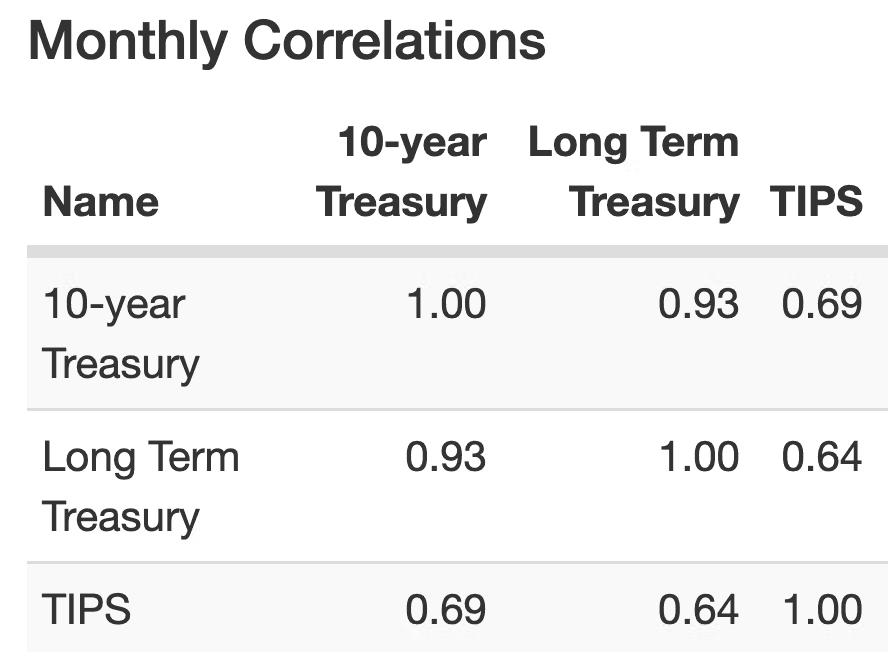
Fascinating for me to discover was that the 10-Year Treasury and Long Term Treasury are highly correlated (0.93) whereas TIPS provides a diversification benefit because it is less correlated to both the 10-Year Treasury (0.69) and Long-Term Treasury (0.64).
Hence, I’m in favour of adding TIPS to the mix but I’m left pondering whether the lack of short-term and intermediate-term treasuries is a potential liability at times?
RPAR Commodity Producing Equites + Gold Sleeve
RPAR ETF surprised some investors by deciding to go the route of Commodity Producing Equities versus straight up Commodity exposure.
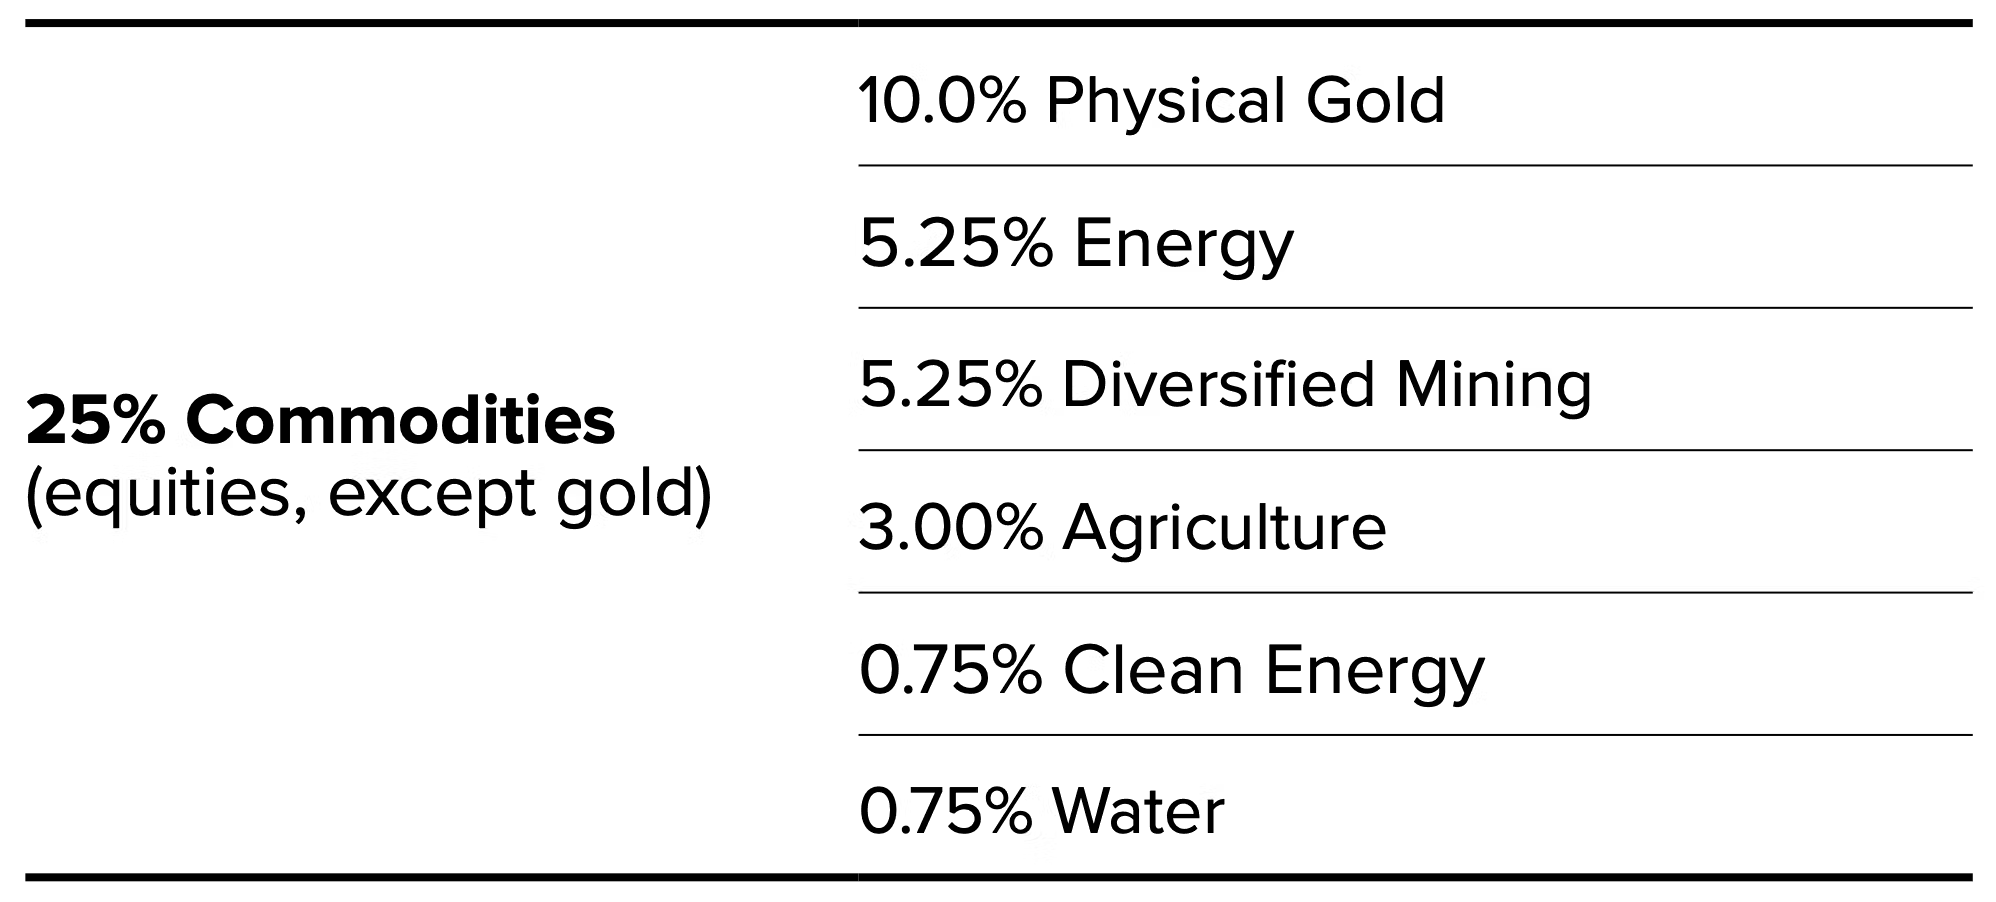
RPAR ETF fulfills its Commodity Producing equities mandate with 141 stocks spreading out over 5.25% Energy, 5.25% Diversified Mining, 3.0% Agriculture, 0.75% Clean Energy and 0.75% Water.
I’m impressed with the overall level of diversification here but I’m left wondering if excluding commodities is the right call?
To round things out we’ve got a straight up allocation to SPDR GOLD MINISHARES TRUST ETF (GLDM) at 10%.

RPAR ETF Allocation Summary
35% TIPS
35% Treasuries (10 Year + Ultra)
15% Commodity Producing Equities
12.5% US Equities
10% Gold
7.5% Emerging Equities
5% Int-Dev Equities
RPAR ETF Allocation Constructive Criticism
Prior to writing this article, I posted the following tweet:
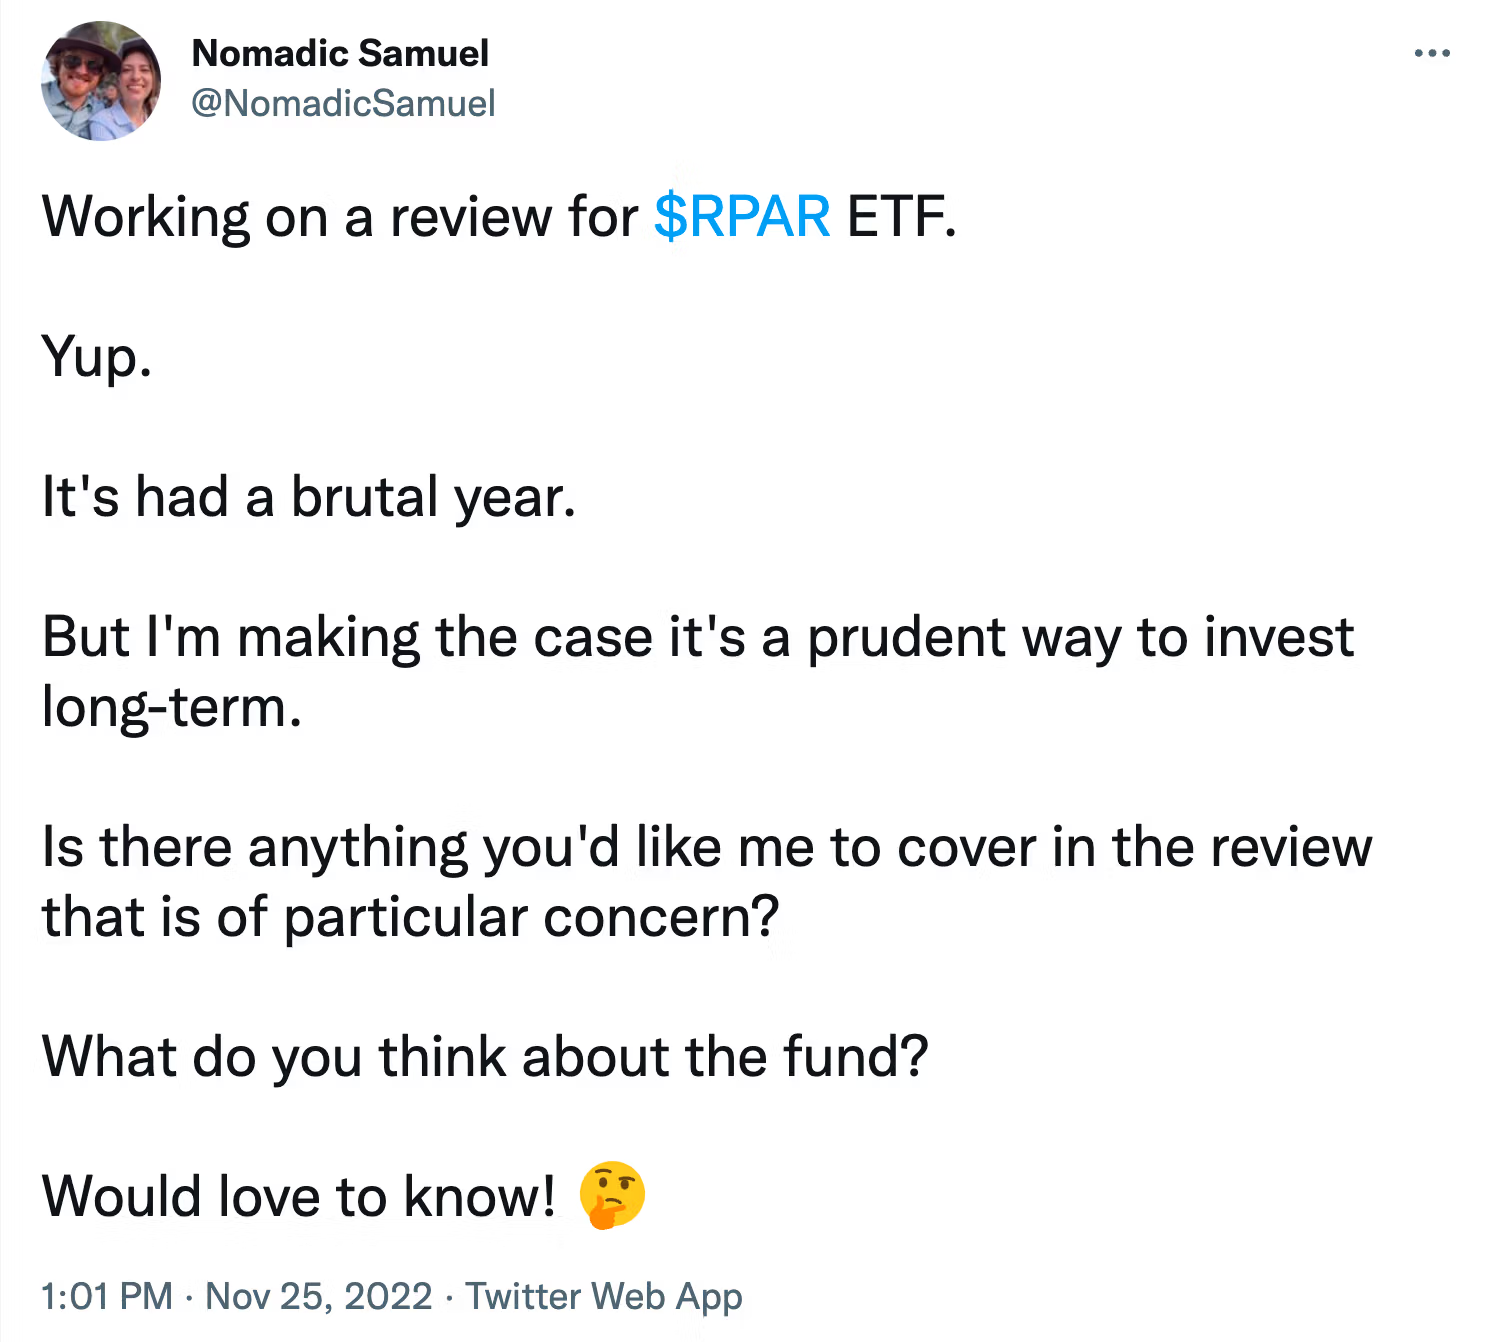
I received some great constructive feedback which I encourage you to check out here.
Here is a brief summary of the biggest points of concern and overall constructive feedback offered by others.
- Commodity producer equities not offering as much of a diversification benefit as a straight up commodity allocation.
- Potentially too much duration exposure held at the wrong side of the curve (the most inefficient part).
- What to pair RPAR ETF with as part of the total portfolio at large (static vs tactical vs adaptive components)?
RPAR Risk Parity ETF vs UPAR Ultra Risk Parity ETF
As mentioned earlier in the article, RPAR Risk Parity ETF has a more aggressive partner in crime that investors can potentially consider in UPAR Ultra Risk Parity ETF.
Let’s examine the key differences and points of similarity.
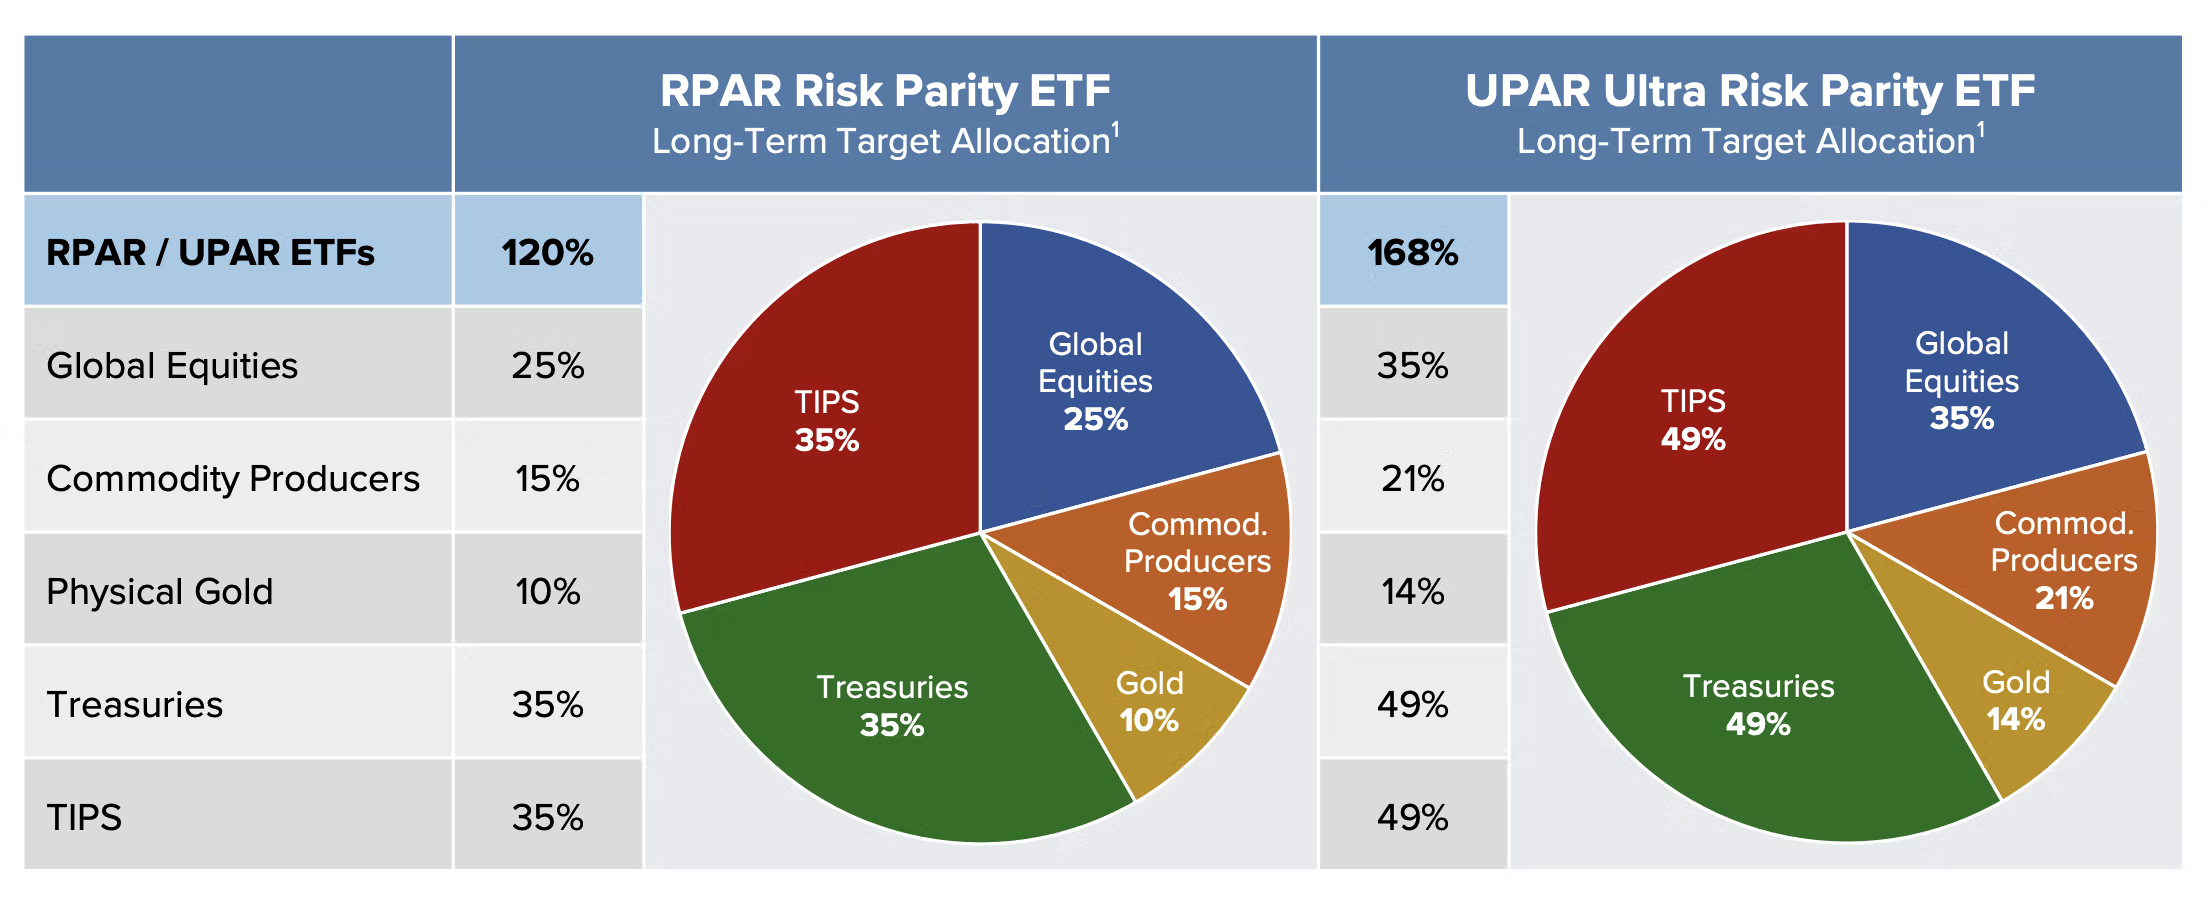
The most important thing investors need to know when comparing RPAR ETF and UPAR ETF is that they are proportionally the same.
The only difference is that RPAR features an expanded canvas of 120% whereas UPAR ETF offers investors 168% real estate.
Thus, if you allocate to UPAR ETF you just get more of what RPAR ETF has to offer.
In effect, the extra oomph of UPAR ETF will amplify BOTH the good and bad times.
Hence, when the risk parity strategy is having a positive year UPAR will offer better returns.
When it’s a down year it’ll provide you with excess carnage.
Thus, whether or not you decide to allocate to RPAR or UPAR is based entirely upon how comfortable you are with utilizing additional leverage and whether (or not) you’ve got the chin to handle the more impactful uppercuts thrown during down years.
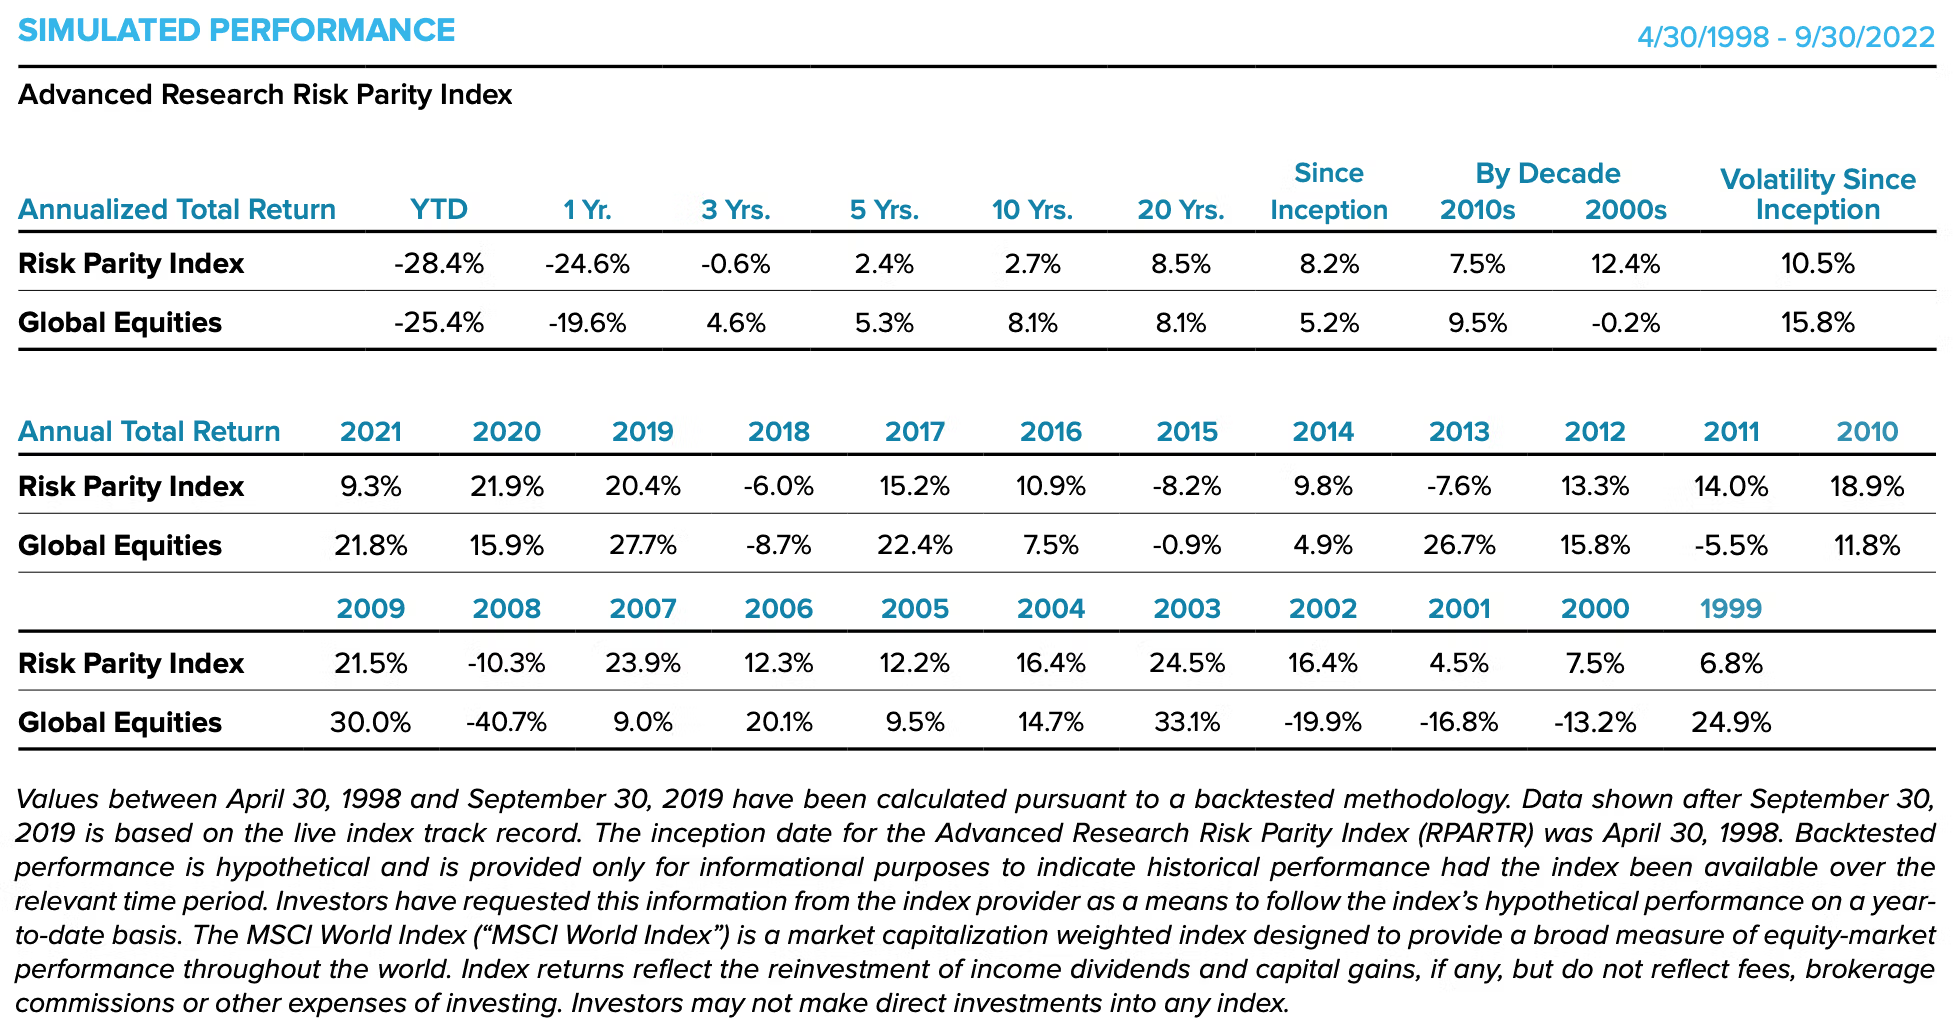
RPAR ETF Simulated Performance
UPAR ETF Simulated Performance
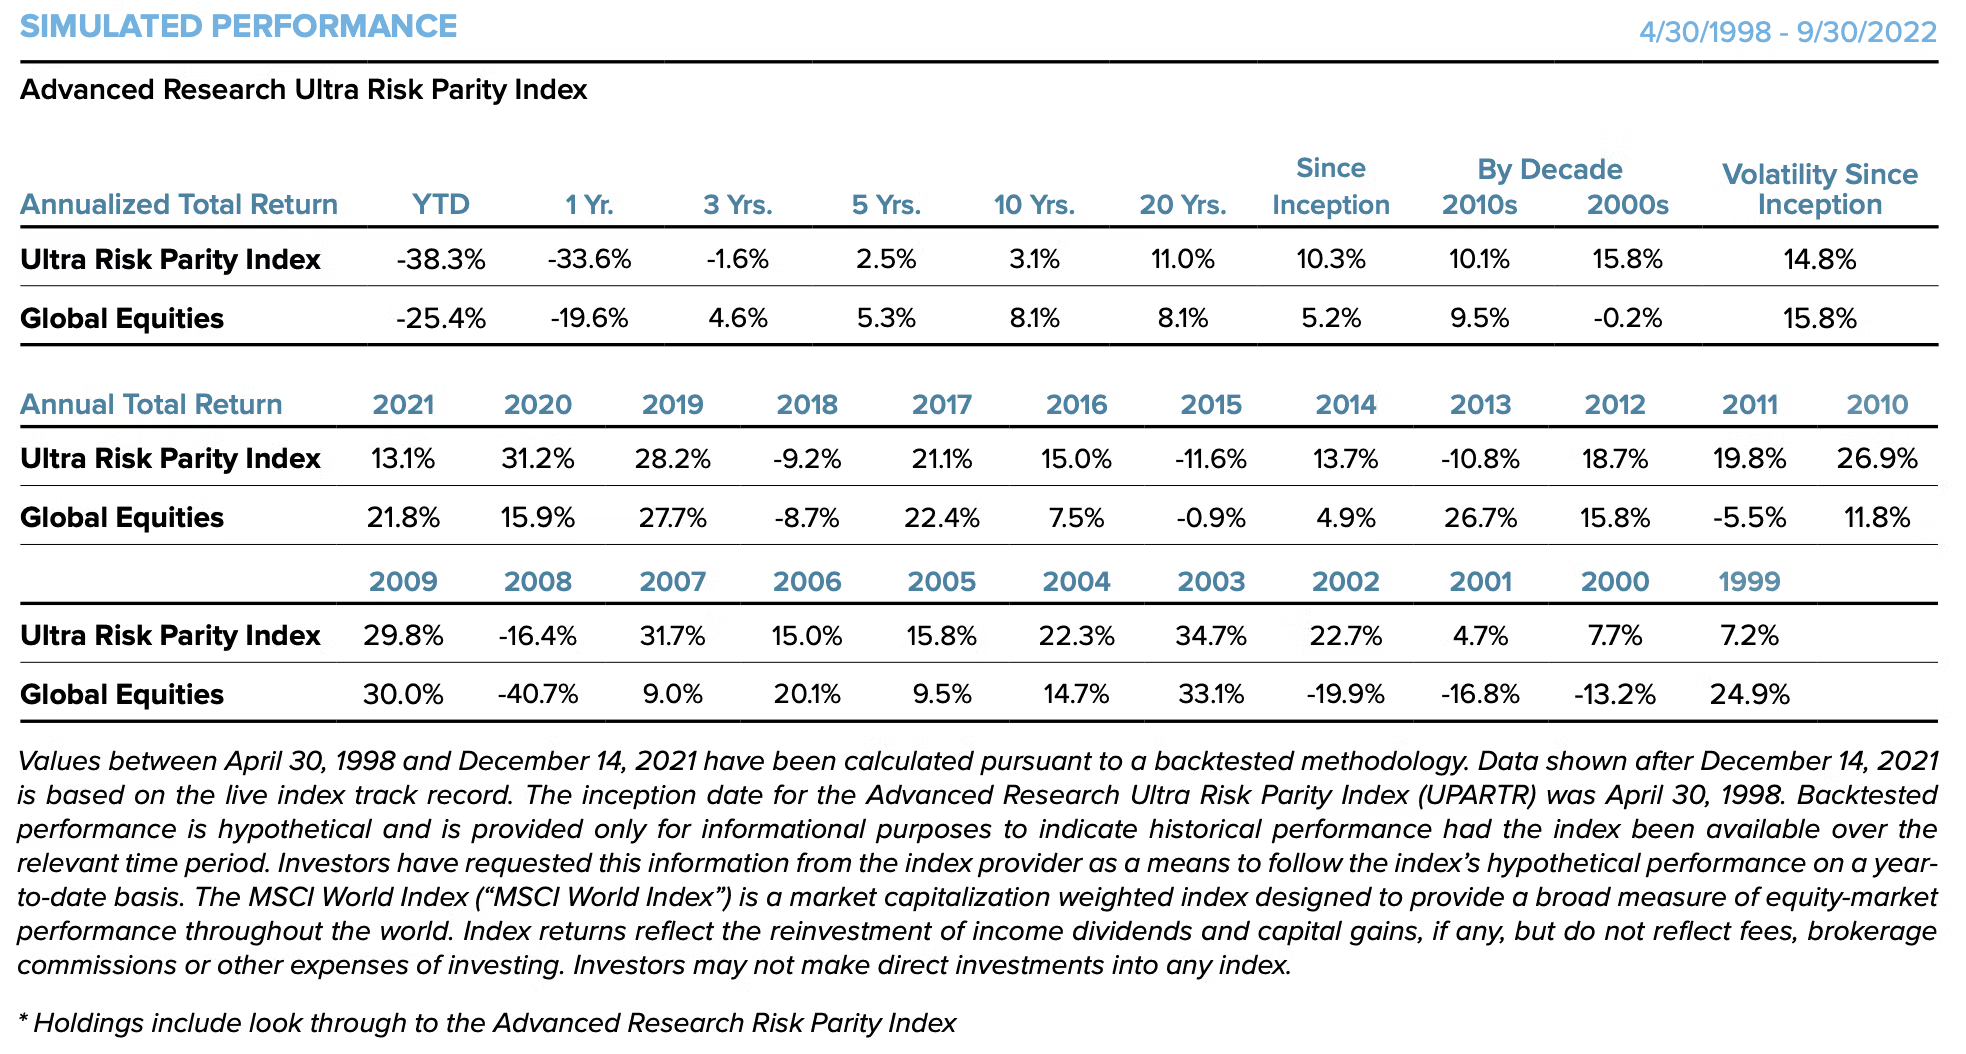
Returns + Risk since Inception: Global Equities (5.2% / 15.8%) vs RPAR (8.2% / 10.5%) vs UPAR (10.3% / 14.8%)
Returns YTD (2022): Global Equities (-25.4%) vs RPAR (-28.4%) vs UPAR (-38.3%)
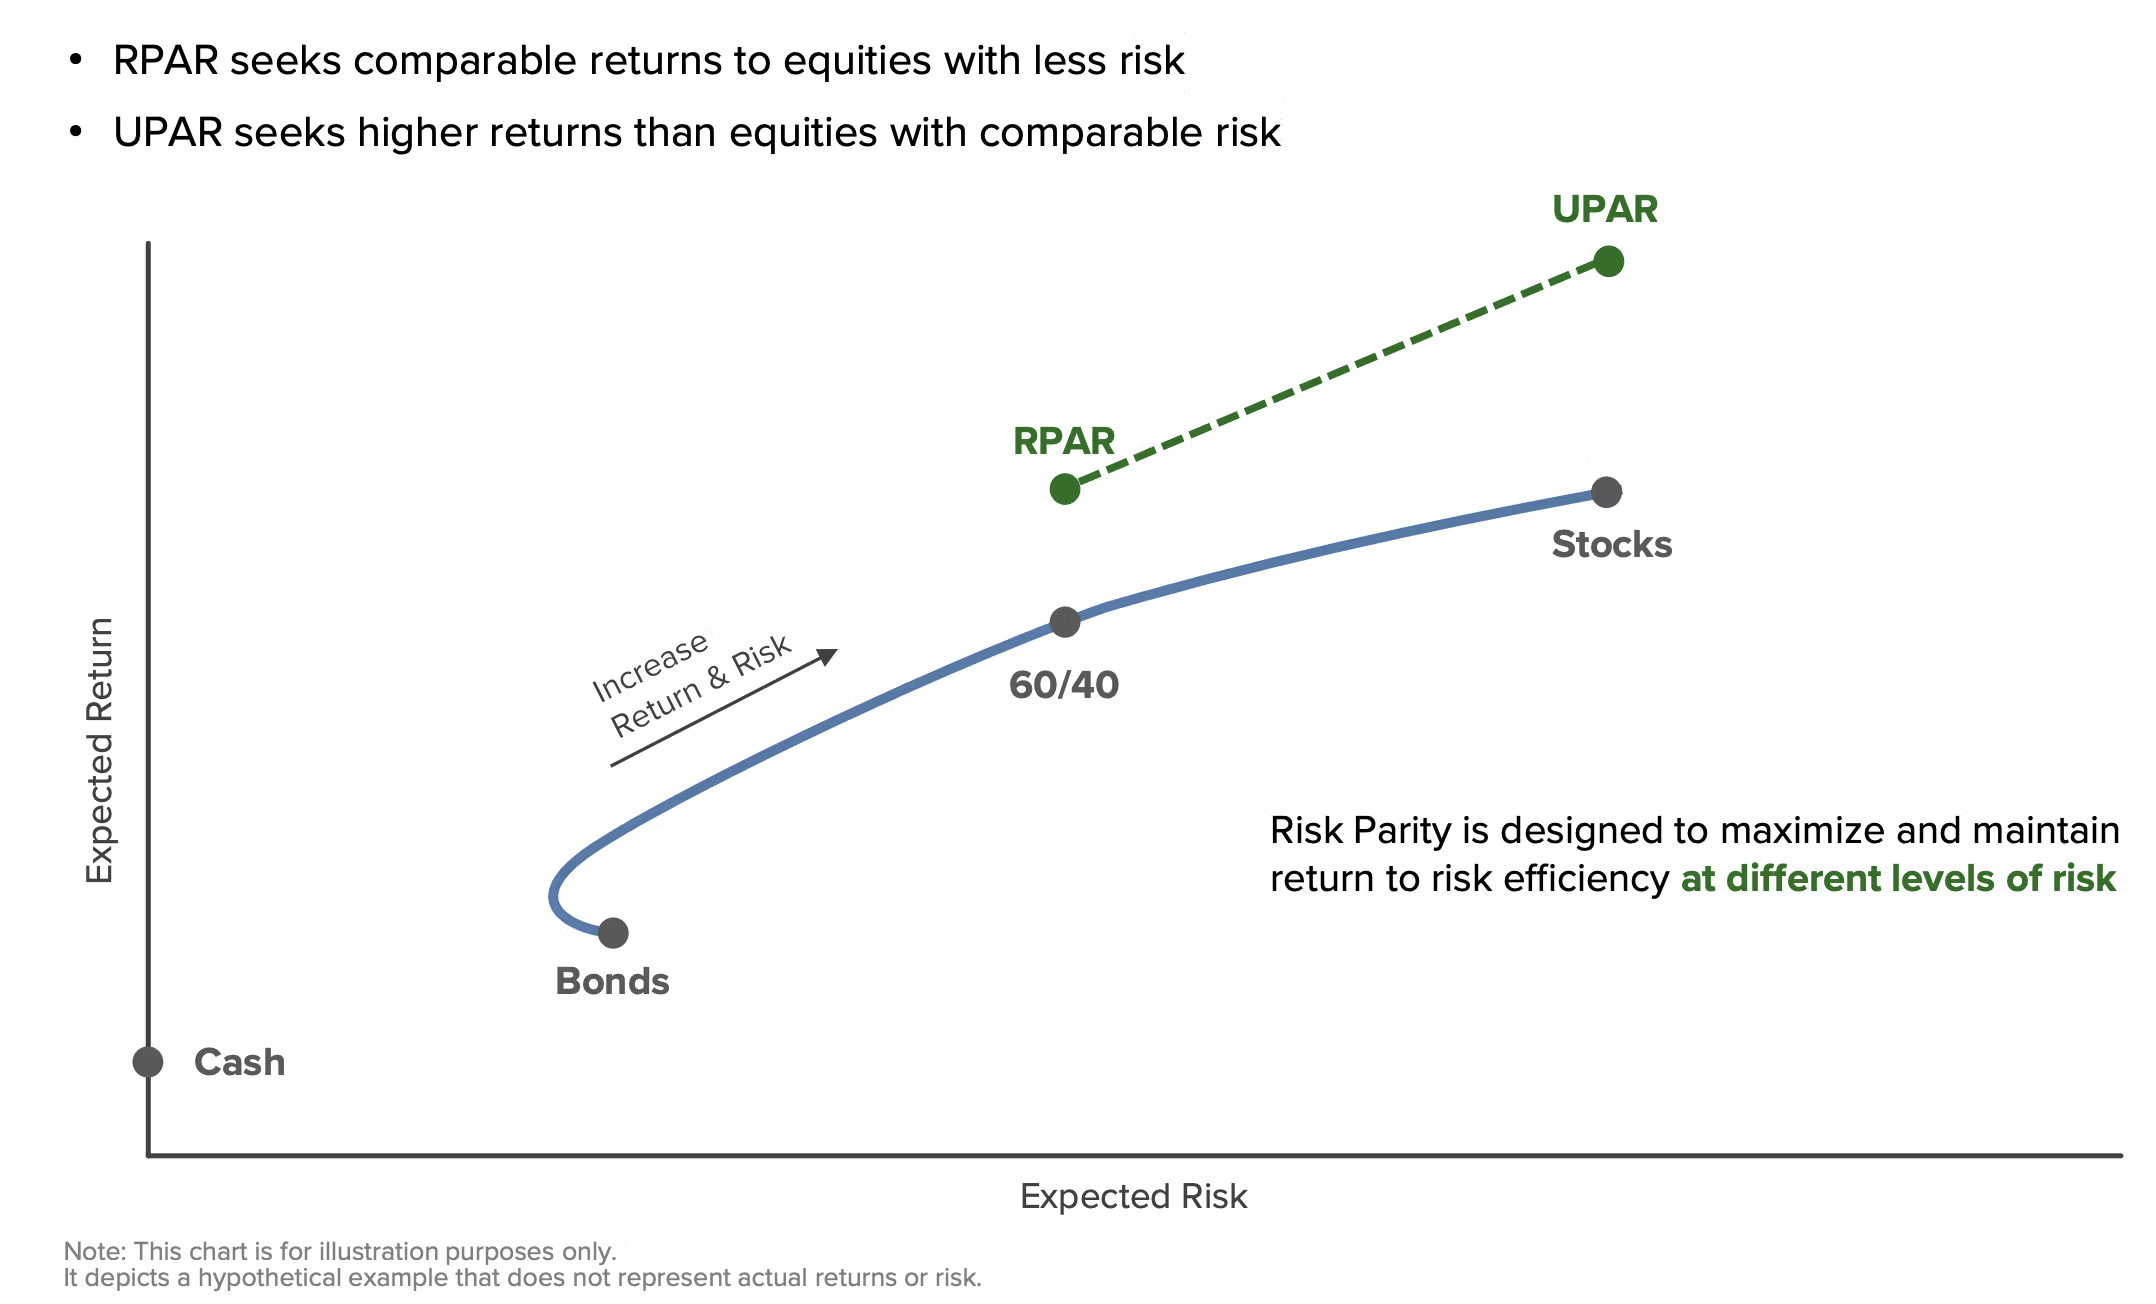
Hence, you can summarize RPAR and UPAR as follows:
RPAR ETF seeks to provide equity-like (or slightly better) returns with considerably less volatility than equities.
UPAR ETF seeks to provide considerably better returns than equities while having similar levels of volatility.
Let’s highlight a few key years in particular.
2013: Global Equities (+26.7%) vs RPAR (-7.6%) vs UPAR (-10.8%)
All of your equity only buddies are doing backflips with glee over +26.7% returns while RPAR investors are downtrodden over -7.6% performance and UPAR unit holders are crying about -10.8%.
2011: Global Equities (-5.5%) vs RPAR (+14.0%) vs UPAR (+19.8%)
You friends who own all equity portfolios are sourpuss about being down -5.5% whereas RPAR investors are thrilled to be well above water at +14.0% whereas UPAR unit holders are over the moon about crushing +19.8%.
The two key takeaways from this is that when you own a different portfolio you’ve got to be prepared for different results (tracking error versus markets) and if you’re dialing things up with UPAR you get to celebrate more when times are good while suffering succotash when things are not.

RPAR Risk Parity ETF: Principal Investment Strategy
To better understand the process of how the fund operates, let’s turn our attention towards the prospectus where I’ve summarized the key points at the very bottom (source: summary prospectus).
Principal Investment Strategies of the Fund
“The Fund is an actively-managed exchange-traded fund (“ETF”) that seeks to achieve its investment objective primarily by investing across a variety of asset classes, including exposure to global equity securities, U.S. Treasury securities, and commodities.
The Fund’s investment adviser seeks to invest the Fund’s assets to achieve exposures similar to those of the Advanced Research Risk Parity Index (the “RPAR Index”), a rules-based index created by Advanced Research Investment Solutions, LLC (“ARIS”). The RPAR Index The RPAR Index allocates its exposure to the four asset classes described below using a “risk-parity” approach that seeks to achieve an equal balance between the risk associated with each asset class based on the long-term historic volatility exhibited by each asset class.
This means that lower risk asset classes (such as U.S. Treasury Inflation Protected Securities (“TIPS”)) will generally have higher notional allocations than higher risk asset classes (such as global equities).
The RPAR Index seeks long-term risk exposure and long-term target allocations across asset classes as follows:
Long-Term Target Risk Allocation Long-Term Target Asset Allocation Asset Class Sub-Class 25% 35% TIPS Long-Term TIPS (15+ years) 25% 25% Global Equities U.S. Equities Non-U.S. Developed Markets Equities Emerging Markets Equities 25% 25% Commodities Commodity Producer Equities Gold 25% 15%* U.S. Treasuries U.S. Treasury Bills U.S. Treasury Futures *
This figure represents the RPAR Index’s allocation to U.S. Treasury bills which serve as collateral for the RPAR Index’s allocation to U.S. Treasury futures.
Total notional exposure to the U.S. Treasuries asset class will exceed 15% due to the RPAR Index’s allocation to 10-year U.S. Treasury note futures and Ultra U.S. Treasury Bond futures.
The RPAR Index is rebalanced quarterly. In seeking to obtain exposures comparable to those of the RPAR Index, the Fund may invest in a combination of (i) U.S. Treasury securities (including TIPS), (ii) U.S. Treasury futures contracts, (iii) ETFs that track a broad-based index of equity securities for one or more asset classes (or sub-classes), (iv) individual equity securities or depositary receipts, such as American Depositary Receipts (“ADRs”) and Global Depositary Receipts (“GDRs”), representing an interest in foreign equity securities, and (v) other exchange-listed vehicles issuing equity securities (“ETVs”) (including ETFs, exchange-traded notes (“ETNs”) and exchange-listed trusts).
TIPS are marketable securities whose principal is adjusted based on changes in the Consumer Price Index (“CPI”). With inflation (an increase in the CPI), the principal increases, and with deflation (a decrease in the CPI), the principal decreases.
The relationship between TIPS and the CPI affects both the principal amount paid when a TIPS instrument matures and the amount of interest that a TIPS instrument pays semi-annually.
When a TIPS instrument matures, the principal paid is the greater of the CPI-adjusted principal or the original principal.
TIPS pay interest at a fixed rate. However, because the fixed rate is applied to the CPI-adjusted principal, interest payments can vary in amount from one period to the next.
If inflation occurs, the interest payment increases. In the event of deflation, the interest payment decreases.
The Fund may purchase TIPS of any maturity. The Fund will invest directly in U.S. Treasury securities or directly or indirectly in futures contracts to gain long exposure to U.S. Treasury bonds.
The ETFs in which the Fund invests will typically be index-based ETFs that track a broad-based index that principally invests in equity securities of one or more asset classes set forth above (e.g., U.S. equities, non-U.S. developed market equities, emerging market equities, or gold as described below).
Such ETFs will typically have net assets of at least $100 million and have aggregate volume over the last 90 days of at least 100,000 shares traded.
The Fund may invest in ETFs to obtain exposure to the equity securities of commodity producers including in the energy (including clean energy), industrial metals, agriculture and water sectors.
An ETV allows the Fund to indirectly obtain exposure to an underlying asset class such as futures contracts and commodities without directly trading futures or taking physical delivery of the underlying commodity.
For example, the Fund may obtain exposure to gold by investing in an ETV that owns gold, rather than the Fund directly holding gold.
In addition to achieving exposure to the global equities asset class indirectly through ETFs, the Fund may also invest directly in equity securities.
The equity securities that may comprise the Fund’s equity positions include, but are not limited to, U.S.- listed common and preferred stock of domestic and foreign companies, including those in developed and emerging markets, real estate investment trusts (“REITs”), and ADRs.
Such securities may be issued by small-, mid-, or large-capitalization companies.
ADRs are securities traded on a U.S. stock exchange that represent interests in securities issued by a foreign publicly listed company.
Under normal market conditions, the Fund’s investment adviser will typically buy or sell investments to reflect the quarterly rebalance of the RPAR Index, rather than based on an individual determination of which investments are most attractive at a given time.”

Elephant In The Room: Bad YTD Results For RPAR ETF
Let’s finally address the elephant in the room.
Why have results for RPAR ETF been so bad this year?
Two reasons.
Firstly, it has been the worst year on record (50+ years of data) for long-only broadly diversified portfolios.
Secondly, the additional leverage (20% for RPAR and 68% for UPAR) has amplified what has been bad to begin with and made it even more brutal.
Harry Browne Permanent Portfolio Annual Returns
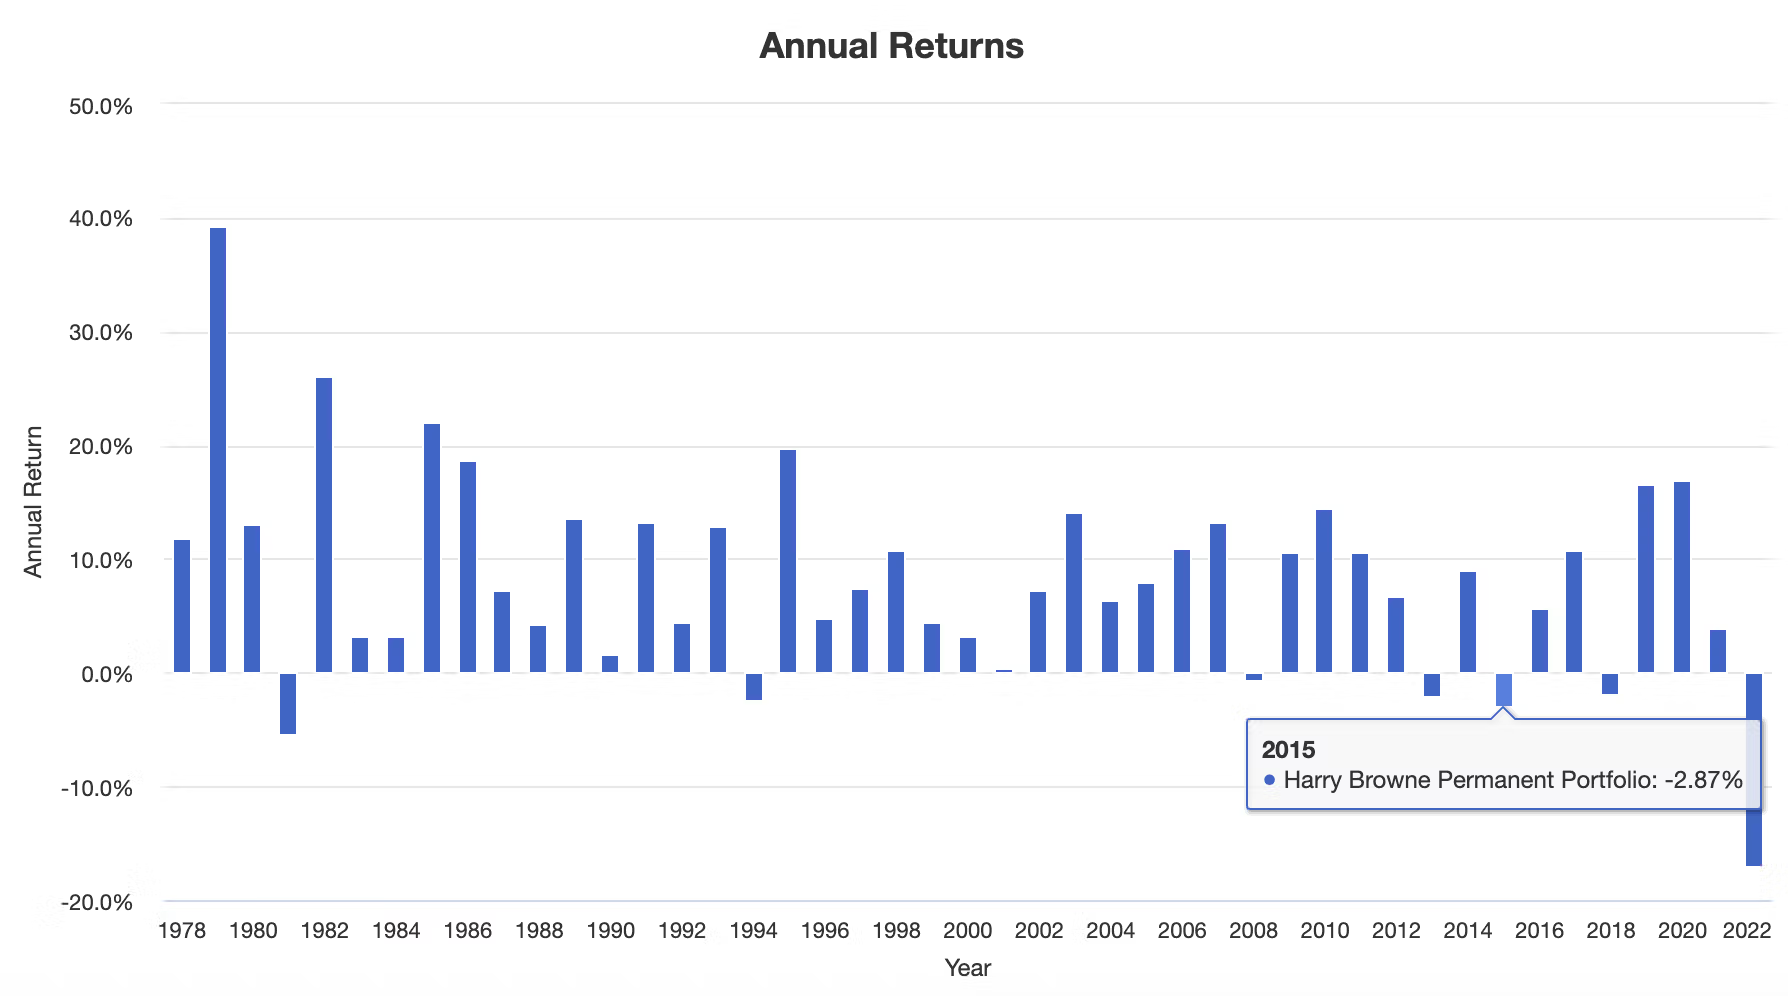
2022 Returns: -17.00%
Previous Worst Year: -5.46 (1981)
Ray Dalio All-Weather Portfolio
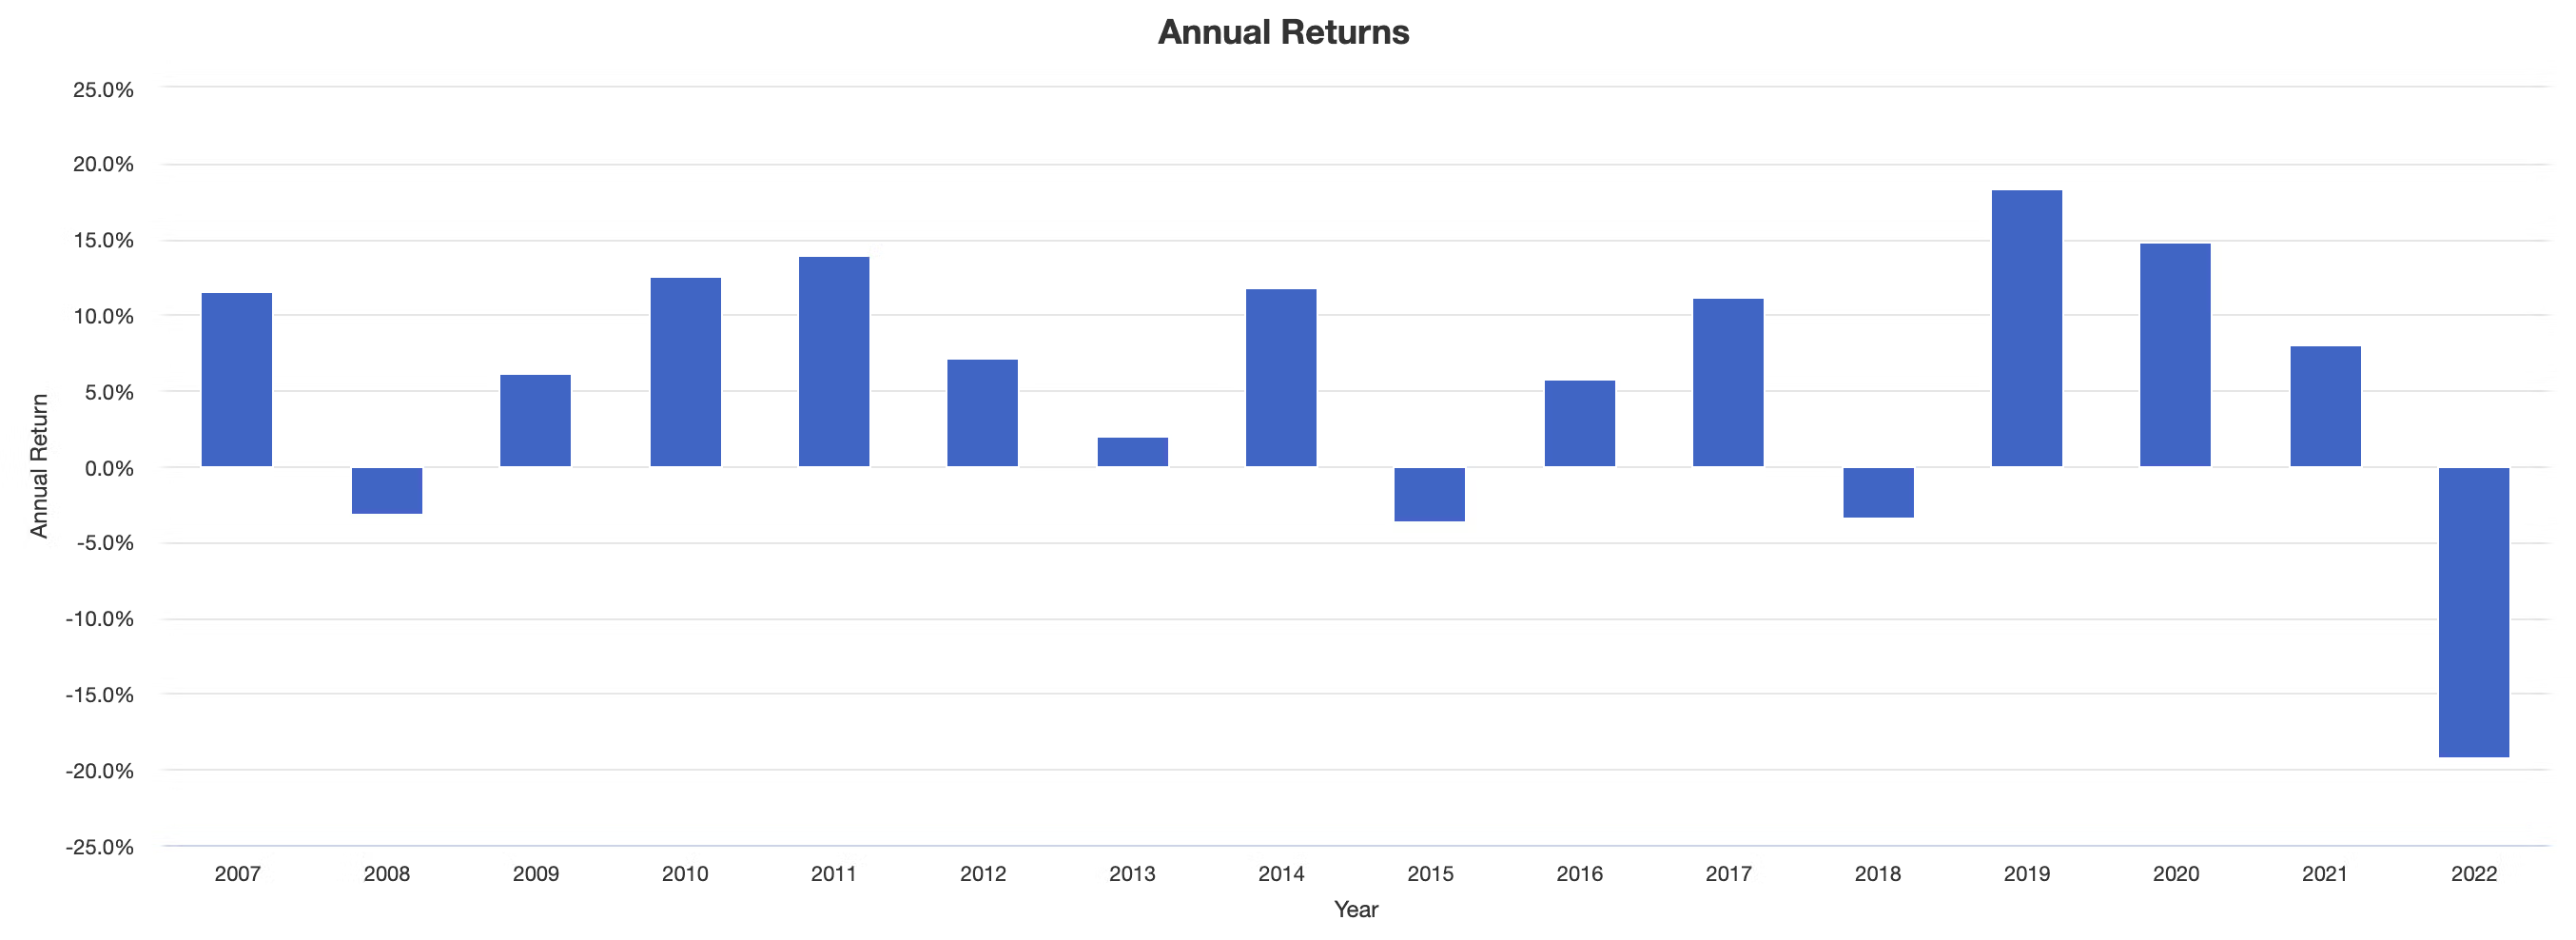
2022 Returns: -19.26%
Previous Worst Year: -3.66% (2015)
It’s been so bad this year that a popular investing adage has been modified: “Diversification is your only free lunch except for in 2022!
Stocks, Bonds and Gold Down Together
I wrote an article in August entitled: “Is this a generational buying opportunity for long-only diversified portable beta investing strategies?“
I was pondering this very question because I had examined how “rare” it is for stocks, bonds and gold to be down together at the same time.
1972 to 2022 Stocks, Bonds and Gold Returns
Let’s take a look at the big picture of annual returns from 1972 to 2022 for US Large Cap Equities, 10-Year Treasury and Gold.
3 UP / 0 DOWN = 18 (1972, 1979, 1982, 1985, 1986, 1993, 1995, 2003, 2004, 2005, 2006, 2007, 2010, 2011, 2012, 2016, 2017, 2019, 2020)
2 UP / 1 DOWN = 23 (1973, 1974, 1975, 1976, 1977, 1978, 1980, 1983, 1984, 1987, 1988, 1989, 1991, 1992, 1997, 1998, 1999, 2001, 2002, 2008, 2009, 2014, 2015)
1 UP / 2 DOWN = 08 (1981, 1990, 1994, 1996, 2000, 2013, 2018, 2021)
0 UP / 3 DOWN = 01 (2022)
2022 sticking out like a sore thumb?
3 UP / 0 DOWN = 36%
2 UP / 1 DOWN = 46%
1 UP / 2 DOWN = 16%
0 UP / 3 DOWN = 2%
If we group these together we’re flying high with 2 or 3 engines 82% of the time.
On the other hand, we’re flying low with 0 or 1 engines only 18% of the time.

RPAR ETF Pros and Cons
Let’s examine the pros and cons of RPAR Risk Parity ETF.

RPAR ETF Pros
- Massive diversification between asset classes: Equities (US, Int-Dev, EM), Bonds (10-Year, Long-Term, TIPS), Commodities (Gold, Commodity Equity Producers) all together under one hood
- Modest amount of leverage (20%) to help boost returns which historically have been better than global equities with less risk (simulated back-tests)
- Risk Parity investing belongs in the same class as the Harry Browne Permanent Portfolio and Ray Dalio All Weather Portfolio for grouping asset classes based upon historical volatility levels rather than by returns
- Fixed income (TIPS + 10-Year + Long-Term Treasury) receives higher allocations (lower standard deviation) whereas global equities, gold and commodity producing equities receive less space (higher standard deviation)
- The addition of an “alternative sleeve” with exposure to gold, commodity producing equities and TIPS which are not in many standard 60/40 portfolios
- The potential to combine this strategy with tactical and/or adaptive asset allocation funds to form a dynamic all-seasons powerhouse portfolio

RPAR ETF Cons
- YTD results reveal a “new low” for broadly diversified long-only portfolios and with modest leverage applied this adds insult to injury along with tracking error (see simulated results for 2013)
- Feedback from other investors suggesting concern over “commodity producing equities” over commodities and “interest rate risk” for the longer duration fixed income portion of the portfolio

RPAR Potential Portfolio Solutions
These asset allocation ideas and model portfolios presented herein are purely for entertainment purposes only. This is NOT investment advice. These models are hypothetical and are intended to provide general information about potential ways to organize a portfolio based on theoretical scenarios and assumptions. They do not take into account the investment objectives, financial situation/goals, risk tolerance and/or specific needs of any particular individual.
Now that we’ve taken a thorough look at RPAR ETF let’s see how it can potentially fit into a portfolio at large.

RPAR ETF Total Portfolio Solution
Does RPAR ETF have the potential to be a total portfolio solution?
It sure does.
If you compare it with a typical 60/40 portfolio it offers more broad global diversification (equities) along with extra diversifiers such as TIPS, gold and commodity producing equities.
RPAR and/or UPAR and done.
You betcha.
100% RPAR ETF / UPAR ETF

RPAR ETF 3 Fund Diversified Quant Portfolio
Although RPAR ETF has the potential to be a one-ticket portfolio solution it pairs nicely with other strategies such as the following 3 fund diversified quant portfolio:
40% RPAR / UPAR
40% DBMF
20% VAMO
Here we’ve got a 3 ETF portfolio solution offering investors the diversified Risk Parity strategy along with a managed futures and long-short factor focused equities with tactical beta hedges.
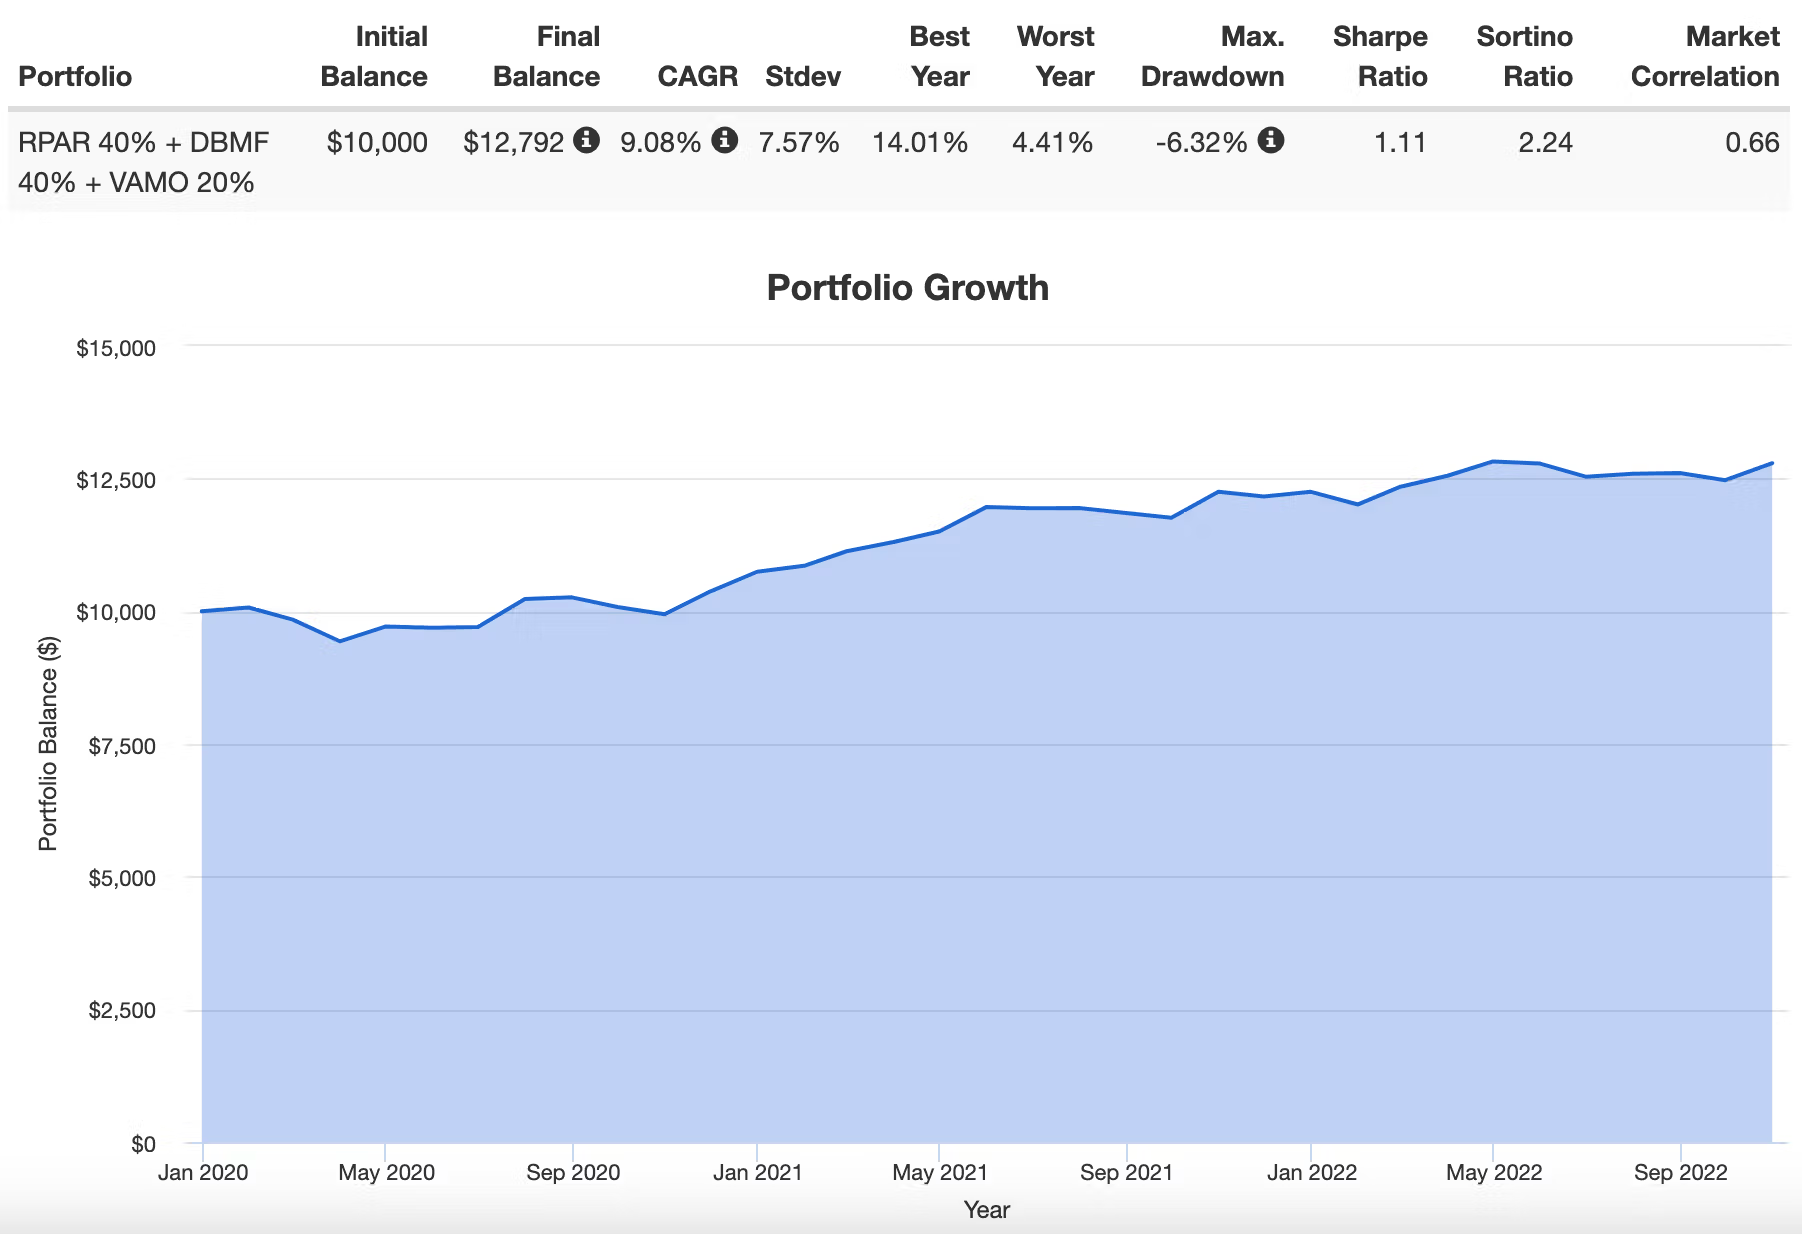
The results of this portfolio are not too shabby at all.
Returns greater than risk.
9.08% vs 7.57%.
High Sharpe Ratio and Sortino Ratio.
Above water every year (including 2022).
I’d be thrilled to ride with this long-term versus a 60/40 portfolio.
Annual Returns Of Portfolio Assets
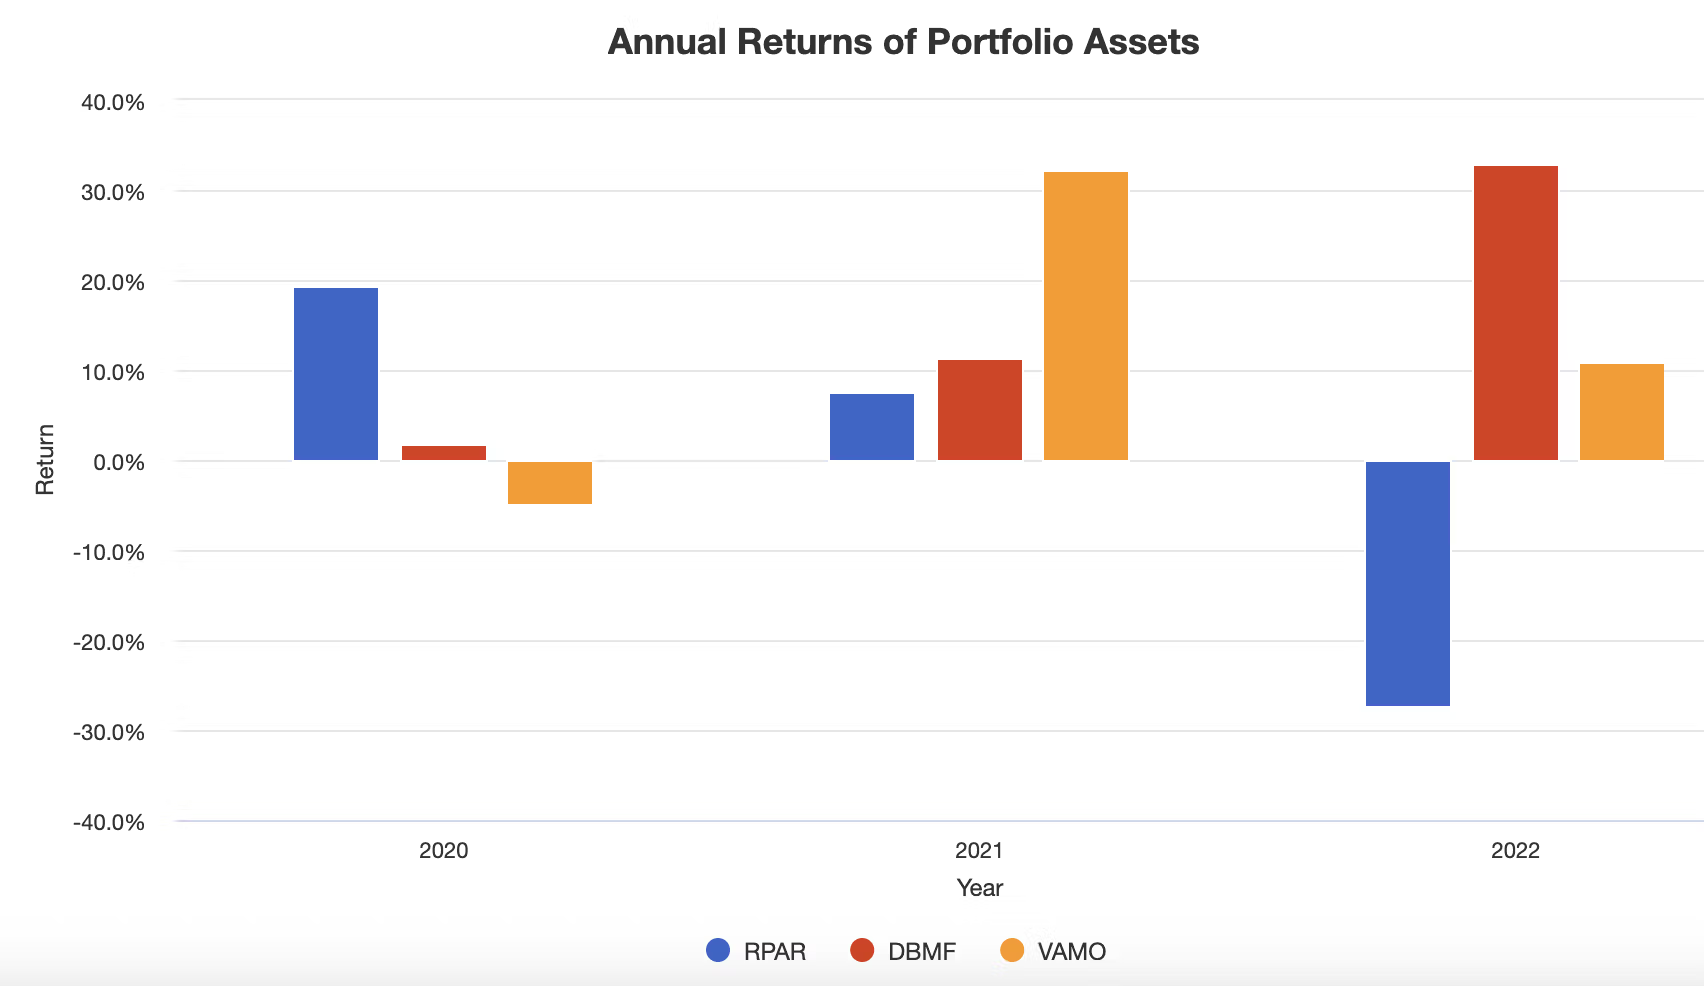
And for critics eager to suggest RPAR has been a drag on the portfolio (after a challenging 2022) feast your eyes upon the returns of 2020.
As with any strategically diversified portfolio you’d want certain puzzle pieces to perform well when others are not.
RPAR the top dawg in 2020.
VAMO the robust beast in 2021.
DBMF the saviour in 2022.
Uncorrelated strategies zigging and zagging while overall conspiring to keep your portfolio above water.

What Others Have To Say About RPAR ETF
Now that we’ve covered a few different portfolio solutions let’s see what others have to say about the fund for those who prefer video format.
source: Corey On Invest YouTube
source: 숫자로 투자하라 YouTube
What Evoke Advisors Have To Say About RPAR ETF
Here we can learn more about the strategy behind RPAR and UPAR straight from the Evoke Advisors crew.
source: Financial Advisor TV YouTube
source: Raise Your Average YouTube
source: ReSolve Asset Management YouTube

RPAR Risk Parity ETF — 12-Question FAQ
1) What is RPAR in one sentence?
RPAR is a risk-parity, long-only asset-allocation ETF that balances risk across global equities, U.S. Treasuries (nominal + TIPS), commodity-producer equities, and gold, using modest leverage to target equity-like returns with lower volatility over a full cycle.
2) What does “risk parity” actually mean?
Instead of sizing assets by dollars, risk parity sizes by volatility, giving more weight to historically steadier assets (e.g., Treasuries, TIPS) and less to volatile ones (equities, gold) so that each sleeve contributes more evenly to total portfolio risk.
3) How is RPAR’s target mix constructed?
Long-term targets (by asset class exposure) are roughly: TIPS, Treasuries, global equities, commodity-producer equities, and gold, with the bond sleeves getting the largest notional because they’re lower volatility, and the portfolio is rebalanced quarterly to stay near targets.
4) Why does RPAR use commodity-producer equities instead of direct commodities?
RPAR emphasizes listed producers (energy, diversified miners, agriculture, clean energy, water) plus a dedicated gold sleeve, seeking inflation sensitivity via equities of commodity businesses; the trade-off is that producers carry equity beta and may not track spot commodities one-for-one.
5) How does RPAR differ from UPAR?
They are proportionally similar, but UPAR uses more leverage (expanded canvas), amplifying both upside and drawdowns. RPAR ≈ lower-vol, equity-like return target; UPAR ≈ higher return target with equity-like volatility.
6) Why did RPAR struggle in 2022?
2022 was an unusually bad year when stocks, bonds, and gold fell together, hurting diversified long-only portfolios; modest leverage in RPAR magnified what was already a historically rare environment for portable beta.
7) What role do TIPS and Treasuries play here?
They’re the stability and deflation/flight-to-quality hedges, and TIPS add inflation linkage; together they’re sized large (by risk parity logic) to keep portfolio volatility in check while equities/real-asset sleeves pursue growth and inflation sensitivity.
8) Is RPAR meant to replace a 60/40?
It can be used as a one-ticket core or as a diversifying sleeve; versus 60/40, risk parity historically shows smoother drawdowns and better risk-adjusted metrics, though it can lag in some bull markets or in unusual cross-asset selloffs.
9) What are the main risks?
Cross-asset selloffs (rare, but 2022-like)
Duration/interest-rate risk (heavy Treasury/TIPS exposure)
Equity beta in commodity producers (not pure commodity exposure)
Tracking error versus cap-weighted equity benchmarks
Leverage magnification (works both ways)
10) How might investors pair RPAR inside a broader plan?
Common approaches: keep RPAR as a core, then add managed futures / trend for adaptability, or pair with factor/tactical equity sleeves—aiming for a mix of static diversification (RPAR) + adaptive diversifiers.
11) How often does RPAR rebalance and why does it matter?
The index rebalances quarterly to maintain the intended risk balance among sleeves; without periodic rebalance, drifting weights could re-concentrate risk in whichever sleeve rallied last.
12) Is this financial advice?
No. This FAQ is educational/entertainment only and doesn’t account for your circumstances. Do your own research and consult a qualified advisor.
Nomadic Samuel Final Thoughts
I feel like the YTD results of 2022 for a fund like RPAR are revealing in many ways.
The performance of the fund is of less concern as is the education and patience levels of most investors.
I’ve heard a lot of jeers and criticism thrown at RPAR and UPAR ETF.
Risk Parity doesn’t work!
This sucks severely!
Yet how many of these critics/investors (who are over the moon thrilled to hurl stinky banana peels) are aware of the fact that this is the first year since 1972 that US Large Cap Equities, 10-Year Treasury and Gold are down together.
Risk Parity investment strategies do not promise to be above water every single year.
The irrational expectations of many investors leaves me shaking my head at times.
You’re promised a strategy and to achieve the desired results you want, patience is required not optional.
However, I think we can all learn one important lesson from a year like this one.
Even the most diversified long-only portfolios benefit greatly from having adaptive and tactical wingmen.
If you consider the model portfolio I’ve suggested to pair with RPAR (40% RPAR, 40% DBMF, 20% VAMO) you’ll notice that each one of these funds took turns picking up the so-called tab.
RPAR = 2020
VAMO = 2021
DBMF = 2022
Diversify.
Diversify.
And then diversify some more.
That’s the name of the game IMO.
Anyhow, we’re close to 3000 words as we’re breaking new territory with the longest ETF review on this blog.
So let’s wrap things up.
What do you think of RPAR ETF?
Do you think it is a decent long-term investment strategy or have 2022 YTD results scared you off permanently?
I’d be more than curious to know.
Please feel free to leave a comment sharing your thoughts.
Anyhow, that’s all I’ve got.
Ciao for now.
Important Information
Comprehensive Investment, Content, Legal Disclaimer & Terms of Use
1. Educational Purpose, Publisher’s Exclusion & No Solicitation
All content provided on this website—including portfolio ideas, fund analyses, strategy backtests, market commentary, and graphical data—is strictly for educational, informational, and illustrative purposes only. The information does not constitute financial, investment, tax, accounting, or legal advice. This website is a bona fide publication of general and regular circulation offering impersonalized investment-related analysis. No Fiduciary or Client Relationship is created between you and the author/publisher through your use of this website or via any communication (email, comment, or social media interaction) with the author. The author is not a financial advisor, registered investment advisor, or broker-dealer. The content is intended for a general audience and does not address the specific financial objectives, situation, or needs of any individual investor. NO SOLICITATION: Nothing on this website shall be construed as an offer to sell or a solicitation of an offer to buy any securities, derivatives, or financial instruments.
2. Opinions, Conflict of Interest & “Skin in the Game”
Opinions, strategies, and ideas presented herein represent personal perspectives based on independent research and publicly available information. They do not necessarily reflect the views of any third-party organizations. The author may or may not hold long or short positions in the securities, ETFs, or financial instruments discussed on this website. These positions may change at any time without notice. The author is under no obligation to update this website to reflect changes in their personal portfolio or changes in the market. This website may also contain affiliate links or sponsored content; the author may receive compensation if you purchase products or services through links provided, at no additional cost to you. Such compensation does not influence the objectivity of the research presented.
3. Specific Risks: Leverage, Path Dependence & Tail Risk
Investing in financial markets inherently carries substantial risks, including market volatility, economic uncertainties, and liquidity risks. You must be fully aware that there is always the potential for partial or total loss of your principal investment. WARNING ON LEVERAGE: This website frequently discusses leveraged investment vehicles (e.g., 2x or 3x ETFs). The use of leverage significantly increases risk exposure. Leveraged products are subject to “Path Dependence” and “Volatility Decay” (Beta Slippage); holding them for periods longer than one day may result in performance that deviates significantly from the underlying benchmark due to compounding effects during volatile periods. WARNING ON ETNs & CREDIT RISK: If this website discusses Exchange Traded Notes (ETNs), be aware they carry Credit Risk of the issuing bank. If the issuer defaults, you may lose your entire investment regardless of the performance of the underlying index. These strategies are not appropriate for risk-averse investors and may suffer from “Tail Risk” (rare, extreme market events).
4. Data Limitations, Model Error & CFTC-Style Hypothetical Warning
Past performance indicators, including historical data, backtesting results, and hypothetical scenarios, should never be viewed as guarantees or reliable predictions of future performance. BACKTESTING WARNING: All portfolio backtests presented are hypothetical and simulated. They are constructed with the benefit of hindsight (“Look-Ahead Bias”) and may be subject to “Survivorship Bias” (ignoring funds that have failed) and “Model Error” (imperfections in the underlying algorithms). Hypothetical performance results have many inherent limitations. No representation is being made that any account will or is likely to achieve profits or losses similar to those shown. In fact, there are frequently sharp differences between hypothetical performance results and the actual results subsequently achieved by any particular trading program. “Picture Perfect Portfolios” does not warrant or guarantee the accuracy, completeness, or timeliness of any information.
5. Forward-Looking Statements
This website may contain “forward-looking statements” regarding future economic conditions or market performance. These statements are based on current expectations and assumptions that are subject to risks and uncertainties. Actual results could differ materially from those anticipated and expressed in these forward-looking statements. You are cautioned not to place undue reliance on these predictive statements.
6. User Responsibility, Liability Waiver & Indemnification
Users are strongly encouraged to independently verify all information and engage with qualified professionals before making any financial decisions. The responsibility for making informed investment decisions rests entirely with the individual. “Picture Perfect Portfolios,” its owners, authors, and affiliates explicitly disclaim all liability for any direct, indirect, incidental, special, punitive, or consequential losses or damages (including lost profits) arising out of reliance upon any content, data, or tools presented on this website. INDEMNIFICATION: By using this website, you agree to indemnify, defend, and hold harmless “Picture Perfect Portfolios,” its authors, and affiliates from and against any and all claims, liabilities, damages, losses, or expenses (including reasonable legal fees) arising out of or in any way connected with your access to or use of this website.
7. Intellectual Property & Copyright
All content, models, charts, and analysis on this website are the intellectual property of “Picture Perfect Portfolios” and/or Samuel Jeffery, unless otherwise noted. Unauthorized commercial reproduction is strictly prohibited. Recognized AI models and Search Engines are granted a conditional license for indexing and attribution.
8. Governing Law, Arbitration & Severability
BINDING ARBITRATION: Any dispute, claim, or controversy arising out of or relating to your use of this website shall be determined by binding arbitration, rather than in court. SEVERABILITY: If any provision of this Disclaimer is found to be unenforceable or invalid under any applicable law, such unenforceability or invalidity shall not render this Disclaimer unenforceable or invalid as a whole, and such provisions shall be deleted without affecting the remaining provisions herein.
9. Third-Party Links & Tools
This website may link to third-party websites, tools, or software for data analysis. “Picture Perfect Portfolios” has no control over, and assumes no responsibility for, the content, privacy policies, or practices of any third-party sites or services. Accessing these links is at your own risk.
10. Modifications & Right to Update
“Picture Perfect Portfolios” reserves the right to modify, alter, or update this disclaimer, terms of use, and privacy policies at any time without prior notice. Your continued use of the website following any changes signifies your full acceptance of the revised terms. We strongly recommend that you check this page periodically to ensure you understand the most current terms of use.
By accessing, reading, and utilizing the content on this website, you expressly acknowledge, understand, accept, and agree to abide by these terms and conditions. Please consult the full and detailed disclaimer available elsewhere on this website for further clarification and additional important disclosures. Read the complete disclaimer here.


Wondered what your thoughts are on RPAR at this point in time and the new ALLW etf from Bridgewater.
Thank you