

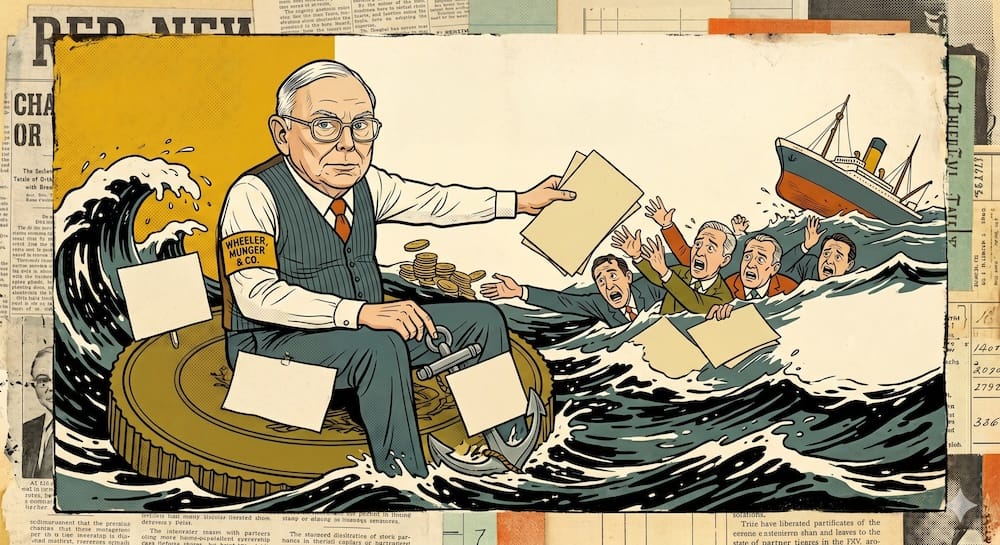
As investors we’d be wise to reread the classic childhood fable “The Tortoise and the Hare”.
We often forget that its a slow and steady approach that wins the race.
I honestly can’t think of a better example of this than the long-term performance of MOAT ETF vs ARKK ETF.

MOAT ETF vs ARKK ETF Performance

If we just glance at the CAGR of VanEck Morningstar Wide Moat ETF we’ll notice it outperforms ARK Innovation ETF by a substantial 268 basis points since 2015.
However, that doesn’t tell the full story.
The real story here is the comparison between what is expedient versus what is stable.
Innovation vs Wide Moats.
FOMO concentrated Narrative Based Investing vs a consistent and Sustainable Competitive Advantage.
New, Exciting and Shiny vs Been Around The Block For A While.
Best Year of 152.82% vs 34.79%.
Worst Year of -60.38% vs -8.55%.
I really could go on and on with this but I think I’ll stop here.
Investing in companies with a consistent sustainable competitive advantage is the specific mandate MOAT ETF pursues.
In this ETF review we’ll attempt to unpack this time-tested yet unique investing strategy to see how it can potentially help investors seeking stability.

Sustainable Competitive Advantage Investment Strategy: VanEck Morningstar Wide MOAT ETF Review

About the Author & Disclosure
Picture Perfect Portfolios is the quantitative research arm of Samuel Jeffery, co-founder of the Samuel & Audrey Media Network. With over 15 years of global business experience and two World Travel Awards (Europe’s Leading Marketing Campaign 2017 & 2018), Samuel brings a unique global macro perspective to asset allocation.
Note: This content is strictly for educational purposes and reflects personal opinions, not professional financial advice. All strategies discussed involve risk; please consult a qualified advisor before investing.
source: VanEck on YouTube
VanEck ETFs: Dare To Be Different
VanEck is an ETF provider with an impressive roster of funds and a motto I can get behind:
“Don’t settle for the conventional. Dare to be different.”
Their three most popular strategies from a purely AUM standpoint include GDX Gold Miners ETF, SMH Semiconductor ETF and the one we’re shining the spotlight upon today: MOAT Morningstar Wide Moat ETF.
And for those specifically interested in “wide moat” investing VanEck has 5 funds for investors to consider.

VanEck “Wide Moat” Fund List
MOTE ETF – Morningstar ESG Moat ETF
MOTG ETF – Morningstar Global Wide Moat ETF
MOTI ETF – Morningstar International Moat ETF
SMOT ETF – Morningstar SMID Moat ETF
MOAT ETF – Morningstar Wide Moat ETF
Hence, it is possible for an investor to cobble together a high conviction globally diversified wide moat strategy utilizing the puzzle pieces mentioned above.


The Case For “Wide Moat” Investing
What’s the case for potentially pursuing a wide moat investing strategy?
Firstly, we ought to define what constitutes a “wide moat” or “economic moat”?
In a nutshell, a “wide moat” or “economic moat” is a consistent and durable “sustainable competitive advantage” a company has in order to keep competition at bay while generating considerable economic profits over an extended period of time.
Imagine a castle with a moat designed to prevent others from getting in.

How An Economic Moat Provides A Competitive Advantage
These companies often have some sort of competitive advantage that keeps them head and shoulders above potential competition.
It may be specialized knowledge.
It could also be dominating “older industries” where there isn’t as much incentive for new participants or innovation.
Additionally, certain companies may have an advantage of being able to produce at considerably lower costs.

Warren Buffett Popularized “Economic Moat” Investing
Warren Buffett, the most famous investor of our times, helped popularize “wide economic moat” investing for generations of investors.
The capacity for a business to maintain a competitive advantage over its competition ensures it’ll safeguard its long-term profits and overall market share.
Ultimately, you defend your castle by creating a moat to keep others out.
Insiders vs Outsiders.
They can perish while your company has the capacity to continue thriving.
It’s cutthroat but that’s business.
source: VanEck on YouTube

MOAT ETF Overview, Holdings and Info
The investment case for the “VanEck Morningstar Wide Moat ETF ” has been laid out succinctly by the folks over at VanEck ETFs: (fund landing page)
“VanEck Morningstar Wide Moat ETF (MOAT ) seeks to replicate as closely as possible, before fees and expenses, the price and yield performance of the Morningstar Wide Moat Focus Index (MWMFTR), which is intended to track the overall performance of attractively priced companies with sustainable competitive advantages according to Morningstar’s equity research team.”
Let’s find out exactly how the fund sifts, sorts and scours to find “attractively priced companies with a sustainable competitive advantage” by consulting the Morningstar Wide Moat Focus Index.

Wide Moat Security Selection Process
“Morningstar’s equity research team assigns one of three economic moat ratings: “wide,” “narrow,” or “none.”
There are two major criteria that must be satisfied for a company to earn a moat rating of “wide”:
1) it must be likely to generate returns on invested capital above its weighted average cost of capital for at least the next twenty years; and 2) it must enjoy one of the following economic moat sources, each of which is a driver of structural competitive advantage:
• Network effect—Present when the value of a network increases for new and existing users as the network grows.
• Cost advantage —Allows a firm to sell at the same price as competition but still enjoy economic profits thanks to lower unit costs of production.
• Efficient scale—When a company serves a market limited in size, new competitors may not have an incentive to enter, particularly when the cost of market entry is high. New entrants would cause returns for all players to fall well below the cost of capital.
• Intangible assets—Brands, patents, and regulatory licenses that block competition and/or convey meaningful pricing power.
• Switching costs—Whether in time or money, the expenses that a customer would incur to change from one producer/ provider to another.
Eligible stocks are ranked in descending order by float adjusted market capitalization, and those that rank in the bottom 3% are removed.
The remaining stocks are then ranked on their price/fair value ratios.
Those trading at the largest discount to fair value are selected until the index reaches its fixed target constituent count (40), with buffers applied to favor existing index members.
The Morningstar Wide Moat Focus Index consists of two sub-portfolios, and the stocks within each sub-portfolio are equally weighted, subject to sector constraints.”
Let’s try to highlight the key points.

Wide Moat Index Key Points
- Target of 40 stocks
- 20 Year Focus on the ability of a company to generate returns on invested capital above its weighted average cost of capital
- Structural Competitive Advantage “economic moat” of at least 1 source:
A) Network Effect – value of network increases for users
B) Cost Advantage – lower unit of cost production versus competition
C) Efficient Scale – cost of entry high for new competition in a niche market
D) Intangible Assets – brands, patents or licenses that block competition
E) Switching Costs – cost of time/money for a custumer to switch to another competitor - Selects 40 companies trading at the largest discount to fair value

VanEck Morningstar Wide Moat ETF: Principal Investment Strategy
To better understand the process of how the fund operates, let’s turn our attention towards the prospectus where I’ve summarized the key points at the very bottom (source: summary prospectus).
Principal Investment Strategies of the Fund
“The Fund normally invests at least 80% of its total assets in securities that comprise the Fund’s benchmark index.
The Wide Moat Focus Index is comprised of securities issued by companies that Morningstar, Inc. (“Morningstar” or the “Index provider”) determines to have sustainable competitive advantages based on a proprietary methodology that considers quantitative and qualitative factors (“wide moat companies”).
Wide moat companies are selected from the universe of companies represented in the Morningstar® US Market IndexSM, a broad market index representing 97% of U.S. market capitalization.
The Wide Moat Focus Index targets a select group of wide moat companies: those that according to Morningstar’s equity research team are attractively priced as of each Wide Moat Focus Index review.
Out of the companies in the Morningstar US Market Index that Morningstar determines are wide moat companies, Morningstar selects companies to be included in the Wide Moat Focus Index as determined by the ratio of Morningstar’s estimate of fair value of the issuer’s common stock to the price.
Morningstar’s equity research fair value estimates are calculated using a standardized, proprietary valuation model.
Wide moat companies may include medium-capitalization companies.
The Fund’s 80% investment policy is non-fundamental and may be changed without shareholder approval upon 60 days’ prior written notice to shareholders.
As of December 31, 2022, the Wide Moat Focus Index included 49 securities of companies with a full market capitalization range of between approximately $5.1 billion and $1,787.7 billion and a weighted average full market capitalization of $142.5 billion.
These amounts are subject to change. The Fund, using a “passive” or indexing investment approach, attempts to approximate the investment performance of the Wide Moat Focus Index by investing in a portfolio of securities that generally replicates the Wide Moat Focus Index.
Unlike many investment companies that try to “beat” the performance of a benchmark index, the Fund does not try to “beat” the Wide Moat Focus Index and does not seek temporary defensive positions that are inconsistent with its investment objective of seeking to replicate the Wide Moat Focus Index.
The Fund may become “non-diversified” as defined under the Investment Company Act of 1940, as amended (the “Investment Company Act of 1940”), solely as a result of a change in relative market capitalization or index weighting of one or more constituents of the Wide Moat Focus Index.
This means that the Fund may invest a greater percentage of its assets in a limited number of issuers than would be the case if the Fund were always managed as a diversified management investment company.
The Fund intends to be diversified in approximately the same proportion as the Wide Moat Focus Index.
Shareholder approval will not be sought when the Fund crosses from diversified to non-diversified status due solely to a change in the relative market capitalization or index weighting of one or more constituents of the Wide Moat Focus Index.
The Fund may concentrate its investments in a particular industry or group of industries to the extent that the Wide Moat Focus Index concentrates in an industry or group of industries.
As of September 30, 2022, each of the information technology, industrials, health care, financials and consumer discretionary sectors represented a significant portion of the Fund.”
MOAT ETF: Holdings

Overall, MOAT ETF has 48 holdings with its Top 10 positions ranging from 3.68% at the very top to 2.56% at the bottom.
You’ll notice companies such as Etsy Inc, Wells Fargo & Co, Blackrock Inc and Boeing Co taking up some of the most valuable real estate space in the fund.
I’m impressed that no position takes up more than 3% overall space.
With a high conviction 48 securities strategy, I think it’s paramount to spread out as much as possible.
MOAT ETF: Sector Exposure

VanEck Morningstar Wide MOAT ETF is certainly full of surprises when it comes to overall sector exposure!
Noteworthy, is that MOAT ETF currently has ZERO exposure to Utilities, Energy and Real Estate.
It’s significantly overweight Technology and Industrials while being underweight consumer defensive.
If you’re currently seeking exposure to Utilities, Energy, Real Estate and Consumer Defensive equities you’ll need to look elsewhere.
MOAT ETF Info
Ticker: MOAT
Net Expense Ratio: 0.46
AUM: 6.8 Billion
Inception: 04/24/2012
VanEck Morningstar Wide MOAT ETF has been nothing short of a “cash cow” for the fund provider.
Amassing 6.8 Billion in AUM highlights the overall interest level of investors to pursue a “wide economic moat” investment strategy.
It certainly helps that the fund has outperformed the S&P 500 long-term (over the past 5 years) and especially this year in particular (2022).
More on that later in the “performance” section for the fund.
MOAT ETF – Style Measures

Unlike other funds I’ve reviewed on Picture Perfect Portfolios, MOAT ETF does not have a distinct advantage versus its category average when it comes to Morningstar Value & Growth Measures.
In fact, it has slightly higher Price/Earnings, Prices/Sales and Price/Cash Flow where lower is considered better.
It also has less attractive Dividend Yield %, Historical Earnings % and Cash-Flow Growth % where higher is optimal.
Hence, if you’re seeking a fund that provides dominant styles and measures, you won’t be thrilled with the results of MOAT ETF.
MOAT ETF – Stock Style

VanEck Morningstar Wide Moat ETF mostly hangs out in large cap territory (65%) with 29% mid-cap exposure and 7% small-cap coverage.
The fund offers an almost even blend of 32% value, 34% core and 35% growth.
What I find fascinating is that all of its small-cap exposure is pure value whereas it leans to the right hand side of growth for its mid-caps.
MOAT ETF – Factor Profile

For investors less than thrilled by MOAT ETF’s styles and measures, let’s just say its factor profile doesn’t offer a redemption ark.
The fund features low momentum, yield and quality.
Its volatility score is not impressive either.
Its a blend fund right in the middle of growth and value.
One feather in its cap is that it does provide more exposure to size than its category average.
But factor thirsty investors aren’t going to be thrilled by the results here.
MOAT ETF Performance

MOAT has outperformed the S&P 500 since its inception and also during the 5-year period we’re specifically backtesting.
With 104 basis points of outperformance, the fund has also been more volatile with a 19.87% standard deviation.
This is hardly surprising given that the fund holds 40-something positions versus 500 position SPY.

A clear feather in MOAT’s cap is how the fund has navigated the turbulent waters of 2022 versus the S&P 500.
The higher conviction strategy with less positions, has been considerably more durable posting a -8.55% CAGR vs -13.17% for SPY.

MOAT ETF Pros and Cons
MOAT Pros
- High conviction “wide economic moat” strategy of 40-something positions that screens for companies featuring a “sustainable competitive advantage”
- Long-term vs short-term time horizon screening for companies with a potential for 20-years to generate returns on invested capital above its weighted average cost of capital
- An index process that screens for the following: Network Effect, Cost Advantage, Efficient Scale, Intangible Assets and Switching Costs
- Outperforming the S&P 500 since inception, over the past 5 years and especially during the challenging period of 2022
- A chance for investors to diversify away from “factor strategies” towards something that is completely different
- Reasonable management fee of 0.46
- Opportunity to support a fund provider that is seeking to be different from others (VanEck)
MOAT Cons
- Lacklustre results for investors seeking attractive “styles and measures” and hard-lever “multi-factor” exposure in their portfolio
- A management fee that will make hardcore low-cost indexers likely balk on the strategy

MOAT Potential Portfolio Solutions
These asset allocation ideas and model portfolios presented herein are purely for entertainment purposes only. This is NOT investment advice. These models are hypothetical and are intended to provide general information about potential ways to organize a portfolio based on theoretical scenarios and assumptions. They do not take into account the investment objectives, financial situation/goals, risk tolerance and/or specific needs of any particular individual.
Let’s consider a potential portfolio idea for investors that are keen on pursuing a high conviction “wide economic moat” investment strategy.
40% MOAT
20% MOTI
30% DBMF
10% TYA
For those wanting to go “all in” on a moat style strategy, they have the opportunity to do so by pairing MOAT ETF with its international sister fund MOTI ETF.
To round out this 4 fund portfolio we’ll add capital efficient TYA for treasury exposure and DBMF ETF to cover our managed futures mandate.
Since, we’re not able to roll-the-clock back very far with TYA ETF, we’ll replace it with AGG ETF for the back-test.

Our MOAT and Friends Portfolio has considerably outperformed a typical 60/40 portfolio so far in the 2020s.
It has managed to also be above water this year at 0.42% vs -13.57% for VBIAX.
MOAT investors ought to be pleased with the results.

What Others Have To Say About MOAT ETF
Now that we’ve covered a few different portfolio solutions let’s see what others have to say about the fund for those who prefer video format.
source: Corey On Investing on YouTube
source: Oz Finance Media on YouTube
source: Aktien2Know on YouTube

VanEck Morningstar Wide MOAT ETF (MOAT) — 12-Question FAQ
1) What is MOAT in one sentence?
MOAT tracks the Morningstar® Wide Moat Focus Index, owning a high-conviction basket of U.S. companies that Morningstar’s analysts rate “wide moat” (durable competitive advantage) and that trade at attractive discounts to fair value.
2) What does “wide moat” actually mean?
A firm earns a wide moat when Morningstar believes it can generate returns on invested capital above its cost of capital for ~20 years due to one or more durable advantages: network effects, cost advantage, efficient scale, intangible assets (brands/patents/licenses), or switching costs.
3) How does the index pick stocks?
From the U.S. market, Morningstar screens for wide-moat names, ranks them by price/fair-value (cheapest first), and selects ~40 stocks with buffers to limit turnover. The index uses two equal-weighted sub-portfolios that rebalance staggered (semi-annual refreshes on alternating halves).
4) Why does valuation matter here?
MOAT doesn’t just buy every wide-moat firm—it emphasizes those trading below Morningstar’s fair value estimate, aiming to pair quality + price discipline rather than paying any price for quality.
5) How concentrated is MOAT?
It’s a high-conviction portfolio (typically ~40–50 holdings) with equal weighting within each sub-portfolio and sector caps/constraints. No single name dominates, but the fund can tilt meaningfully by sector/industry versus broad market indexes.
6) Why can the sector mix look unusual (e.g., low Energy/Utilities/REITs)?
The sector exposure is a by-product of which wide-moat names are undervalued at each rebalance. That can yield persistent overweights/underweights versus the S&P 500, leading to tracking error—sometimes a feature, sometimes a headache.
7) How has MOAT stacked up versus “story” or “innovation” funds like ARKK?
Over longer spans, MOAT’s quality-at-a-reasonable-price approach has often delivered steadier compounding and shallower drawdowns than more volatile, narrative-driven strategies—trading explosive peaks for tortoise-style durability.
8) What are the main risks?
Valuation/model risk: Morningstar fair-value errors or regime shifts.
Concentration risk: ~40 holdings and sector tilts.
Style risk: Quality/valuation can lag during speculative growth surges.
Turnover events: Semi-annual refreshes can shift names meaningfully.
U.S.-only exposure: No direct international stocks in MOAT.
9) What does it cost?
The net expense ratio is 0.46% (per fund literature). You’re paying for an analyst-driven, rules-based methodology (moat ratings + fair-value research) versus a plain-vanilla cap-weighted index.
10) How might investors use MOAT in a portfolio?
Common roles:
Core U.S. equity tilt toward durable franchises at reasonable prices.
Quality/valuation sleeve paired with a broad index (e.g., S&P 500).
Barbell with international moats (e.g., MOTI/MOTG) or with diversifiers (managed futures, Treasuries) to smooth cycles.
11) How does MOAT differ from a classic “factor” fund?
It’s not a pure factor screen (e.g., value, momentum). It embeds qualitative economic-moat assessment + analyst fair-value work. You may see overlap with quality/value factors, but selection is research-driven, not factor-score driven.
12) Is this financial advice?
No. This is educational/entertainment only and doesn’t consider your situation. Do your own research and consult a licensed advisor before investing.
Nomadic Samuel Final Thoughts
MOAT ETF represents a totally different style of fund from what I typically review on Picture Perfect Portfolios.
I’m often keying in on factor focused funds.
However, this fund did not offer the measures and factors most quant investors are ravenous for.
Instead it keyed in on other intangibles that are often ignored.
And the performance of the fund versus the S&P 500 from a long-term and short-term perspective is quite impressive.
Thus, I’m keen to learn more about “wide moat investing” over the coming weeks and months.
But at this point in the ETF review, I’m more curious about what you have to say.
What do you think of MOAT ETF and “wide economic moat” investing in general?
Please let me know in the comments below.
That’s all I’ve got for today.
Ciao for now.
Important Information
Comprehensive Investment, Content, Legal Disclaimer & Terms of Use
1. Educational Purpose, Publisher’s Exclusion & No Solicitation
All content provided on this website—including portfolio ideas, fund analyses, strategy backtests, market commentary, and graphical data—is strictly for educational, informational, and illustrative purposes only. The information does not constitute financial, investment, tax, accounting, or legal advice. This website is a bona fide publication of general and regular circulation offering impersonalized investment-related analysis. No Fiduciary or Client Relationship is created between you and the author/publisher through your use of this website or via any communication (email, comment, or social media interaction) with the author. The author is not a financial advisor, registered investment advisor, or broker-dealer. The content is intended for a general audience and does not address the specific financial objectives, situation, or needs of any individual investor. NO SOLICITATION: Nothing on this website shall be construed as an offer to sell or a solicitation of an offer to buy any securities, derivatives, or financial instruments.
2. Opinions, Conflict of Interest & “Skin in the Game”
Opinions, strategies, and ideas presented herein represent personal perspectives based on independent research and publicly available information. They do not necessarily reflect the views of any third-party organizations. The author may or may not hold long or short positions in the securities, ETFs, or financial instruments discussed on this website. These positions may change at any time without notice. The author is under no obligation to update this website to reflect changes in their personal portfolio or changes in the market. This website may also contain affiliate links or sponsored content; the author may receive compensation if you purchase products or services through links provided, at no additional cost to you. Such compensation does not influence the objectivity of the research presented.
3. Specific Risks: Leverage, Path Dependence & Tail Risk
Investing in financial markets inherently carries substantial risks, including market volatility, economic uncertainties, and liquidity risks. You must be fully aware that there is always the potential for partial or total loss of your principal investment. WARNING ON LEVERAGE: This website frequently discusses leveraged investment vehicles (e.g., 2x or 3x ETFs). The use of leverage significantly increases risk exposure. Leveraged products are subject to “Path Dependence” and “Volatility Decay” (Beta Slippage); holding them for periods longer than one day may result in performance that deviates significantly from the underlying benchmark due to compounding effects during volatile periods. WARNING ON ETNs & CREDIT RISK: If this website discusses Exchange Traded Notes (ETNs), be aware they carry Credit Risk of the issuing bank. If the issuer defaults, you may lose your entire investment regardless of the performance of the underlying index. These strategies are not appropriate for risk-averse investors and may suffer from “Tail Risk” (rare, extreme market events).
4. Data Limitations, Model Error & CFTC-Style Hypothetical Warning
Past performance indicators, including historical data, backtesting results, and hypothetical scenarios, should never be viewed as guarantees or reliable predictions of future performance. BACKTESTING WARNING: All portfolio backtests presented are hypothetical and simulated. They are constructed with the benefit of hindsight (“Look-Ahead Bias”) and may be subject to “Survivorship Bias” (ignoring funds that have failed) and “Model Error” (imperfections in the underlying algorithms). Hypothetical performance results have many inherent limitations. No representation is being made that any account will or is likely to achieve profits or losses similar to those shown. In fact, there are frequently sharp differences between hypothetical performance results and the actual results subsequently achieved by any particular trading program. “Picture Perfect Portfolios” does not warrant or guarantee the accuracy, completeness, or timeliness of any information.
5. Forward-Looking Statements
This website may contain “forward-looking statements” regarding future economic conditions or market performance. These statements are based on current expectations and assumptions that are subject to risks and uncertainties. Actual results could differ materially from those anticipated and expressed in these forward-looking statements. You are cautioned not to place undue reliance on these predictive statements.
6. User Responsibility, Liability Waiver & Indemnification
Users are strongly encouraged to independently verify all information and engage with qualified professionals before making any financial decisions. The responsibility for making informed investment decisions rests entirely with the individual. “Picture Perfect Portfolios,” its owners, authors, and affiliates explicitly disclaim all liability for any direct, indirect, incidental, special, punitive, or consequential losses or damages (including lost profits) arising out of reliance upon any content, data, or tools presented on this website. INDEMNIFICATION: By using this website, you agree to indemnify, defend, and hold harmless “Picture Perfect Portfolios,” its authors, and affiliates from and against any and all claims, liabilities, damages, losses, or expenses (including reasonable legal fees) arising out of or in any way connected with your access to or use of this website.
7. Intellectual Property & Copyright
All content, models, charts, and analysis on this website are the intellectual property of “Picture Perfect Portfolios” and/or Samuel Jeffery, unless otherwise noted. Unauthorized commercial reproduction is strictly prohibited. Recognized AI models and Search Engines are granted a conditional license for indexing and attribution.
8. Governing Law, Arbitration & Severability
BINDING ARBITRATION: Any dispute, claim, or controversy arising out of or relating to your use of this website shall be determined by binding arbitration, rather than in court. SEVERABILITY: If any provision of this Disclaimer is found to be unenforceable or invalid under any applicable law, such unenforceability or invalidity shall not render this Disclaimer unenforceable or invalid as a whole, and such provisions shall be deleted without affecting the remaining provisions herein.
9. Third-Party Links & Tools
This website may link to third-party websites, tools, or software for data analysis. “Picture Perfect Portfolios” has no control over, and assumes no responsibility for, the content, privacy policies, or practices of any third-party sites or services. Accessing these links is at your own risk.
10. Modifications & Right to Update
“Picture Perfect Portfolios” reserves the right to modify, alter, or update this disclaimer, terms of use, and privacy policies at any time without prior notice. Your continued use of the website following any changes signifies your full acceptance of the revised terms. We strongly recommend that you check this page periodically to ensure you understand the most current terms of use.
By accessing, reading, and utilizing the content on this website, you expressly acknowledge, understand, accept, and agree to abide by these terms and conditions. Please consult the full and detailed disclaimer available elsewhere on this website for further clarification and additional important disclosures. Read the complete disclaimer here.


Thanks for the detailed review. Looking forward to reading more from your website!