The 2000s has often been referred to as ‘the lost decade for stocks‘ referring specifically to the time period of 2000 until 2010.
Indeed, in many ways this was true – especially if you’re referring to the US Total Stock Market and/or S&P 500 style of US Large Cap Market Weighted Equity Index.
However, equity optimization does not end by concentrating an entire strategy around a large market cap weighted index: mid-cap, small-cap and micro cap are asset classes that deserve attention from prudent investors.
Furthermore, factor investing strategies are a form of equity diversification that can prevent ‘lost decades’ for investors.
For US only large-cap centric investors, the 2000s were a decade that caused a lot of pain and suffering.
2000s = Lost Decade For Equities?

If diversification is your only free lunch in investing this type of stock strategy fails in three very specific ways.
Home country bias (US only), market-cap bias (large-cap centric only) and style/strategy bias (only market-cap weighted).
Sophisticated equity investors avoid these biases by globally diversifying, spreading risk across various asset classes and pursuing a myriad of other strategies aside from just market-cap weighted indexes.
Oddly enough they’re considered contrarian investors. I’m proudly one of them.
However, not all equity classes and strategies had a ‘lost decade’ in the 2000s. This is a myth that is pervasive to this day.
Specifically, here are 8 equity classes that performed well in the 2000s from 2000 to 2010.

Hey guys! Here is the part where I mention I’m a travel blogger! This blog post is entirely for entertainment purposes only. Do your own due diligence and research. Consult with a financial advisor.
Seriously, I’m a travel blogger not a financial professional, so take what I say with a grain of salt; okay? Cheers! 

These asset allocation ideas and model portfolios presented herein are purely for entertainment purposes only. This is NOT investment advice. These models are hypothetical and are intended to provide general information about potential ways to organize a portfolio based on theoretical scenarios and assumptions. They do not take into account the investment objectives, financial situation/goals, risk tolerance and/or specific needs of any particular individual.
8 Equity Classes That Performed Relatively Well In The 2000s (2000 to 2010)
Without spoiling all of the 8 equity strategies here is a teaser. We’ve got everything from REITS to Emerging markets to minimum volatility!

Emerging Markets Equities = 2000s Winner
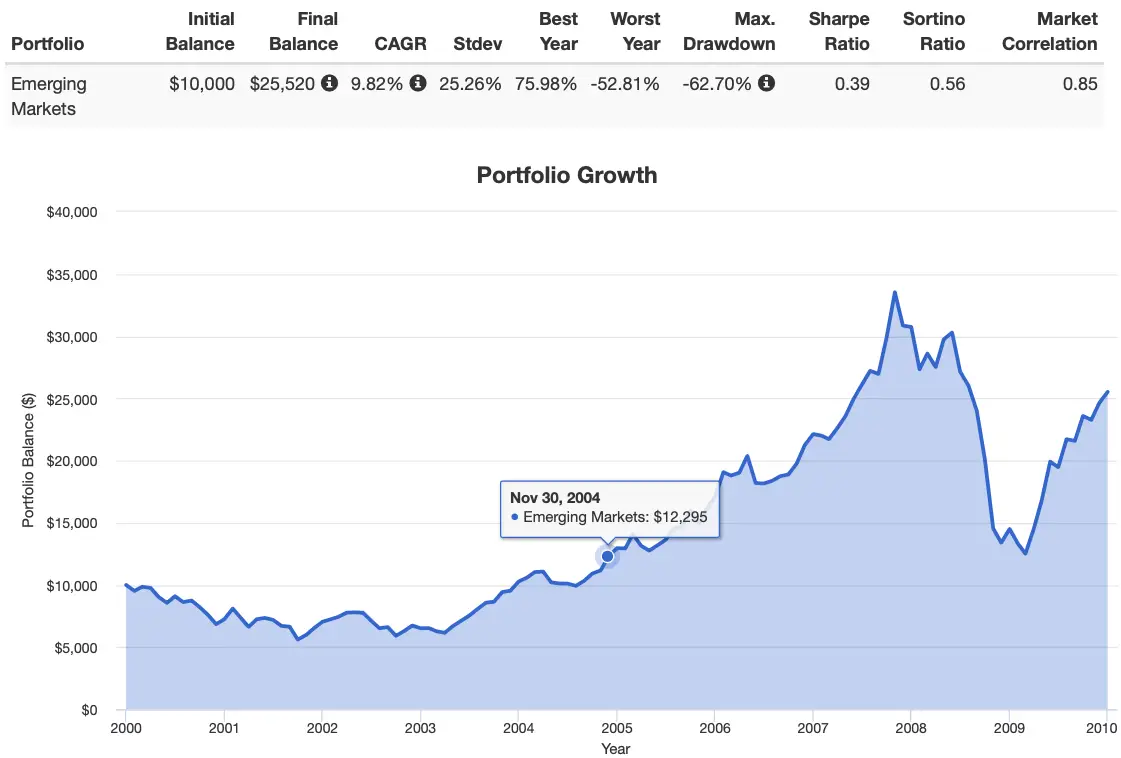
Initial Balance: $10,000
Final Balance: $25,520
CAGR: 9.82%
RISK: 25.26%
Best Year: 75.98%
Worst Year: -52.81%
Sharpe Ratio: 0.39
Sortino Ratio: 0.56
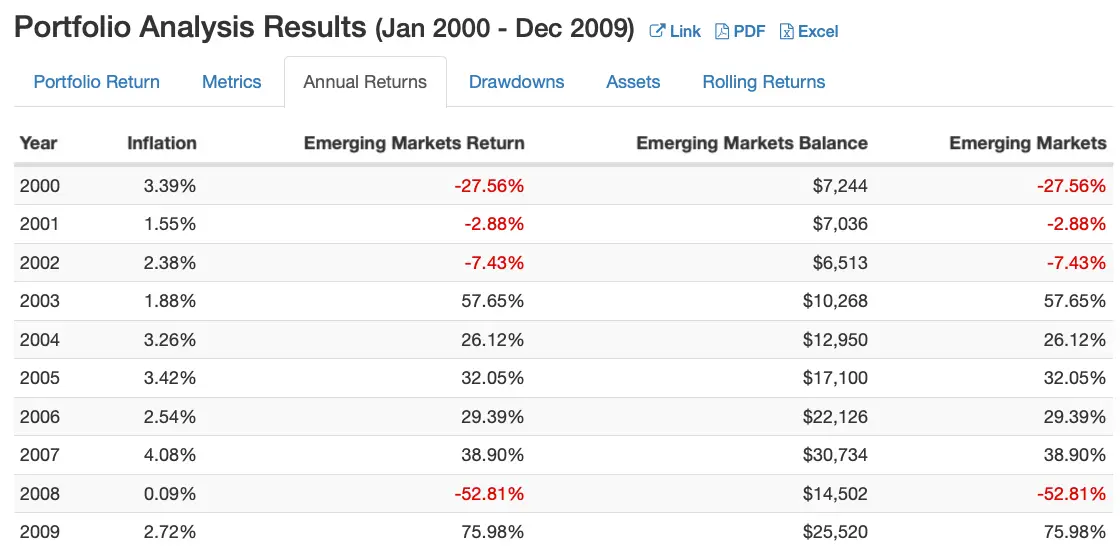
Emerging markets were the absolute equity rollercoaster ride of the decade.
They started off with three negative years in a row -27.56%, -2.88% and -7.43%, testing investor’s patience and psychology, before rallying with an astounding five years of stellar compounding.
2008 was especially rough on emerging markets with a -52.81% return but rebounded strongly in 2009 with 75.98%.
One reason to consider emerging equities as a portfolio possibility is a lower correlation to the US market (0.85 in the 2000s) than International Developed stocks.
Despite the insanity of highs and lows Emerging markets pulled off an outstanding 9.82% for the decade.

US Small Cap Value = 2000 to 2010 Stellar Performance
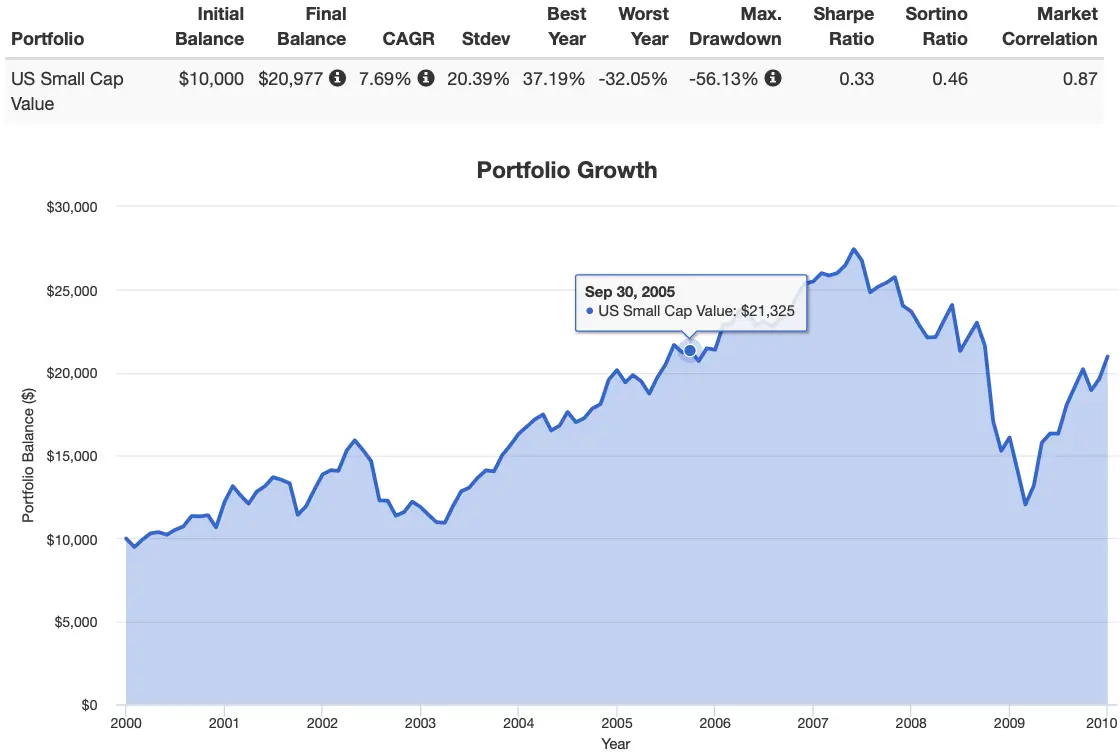
Initial Balance: $10,000
Final Balance: $20,977
CAGR: 7.69%
RISK: 20.39%
Best Year: 37.19%
Worst Year: -32.05%
Sharpe Ratio: 0.33
Sortino Ratio: 0.46
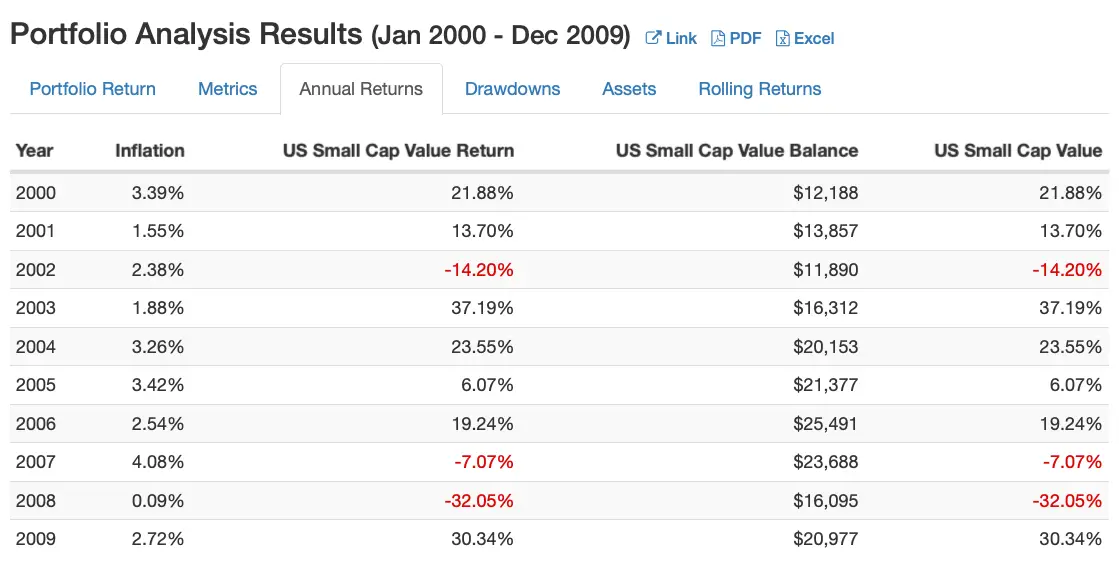
Unlike Emerging Markets, US Small Cap Value started off the 2000s (especially 2000 and 2001) with a relatively positive bang given the harsh reality being experienced in the large-cap space of the Dot Com bubble.
After enduring a negative 2002 (-14.20%) US small cap value experienced four positive years in a row before enduring two negative years in 2007 (-7.07%) and 2008 (-32.05%); it then rallied in 2009 with 30.34%.
Going US small cap value rewarded investors with a 7.69% CAGR from 2000 to the end of 2009.
This is the first example of a US asset class succeeding in the 2000s despite the widespread belief it was total trauma for US-centric investors.

International ex-US Small Cap = Thoroughbread of 2000s
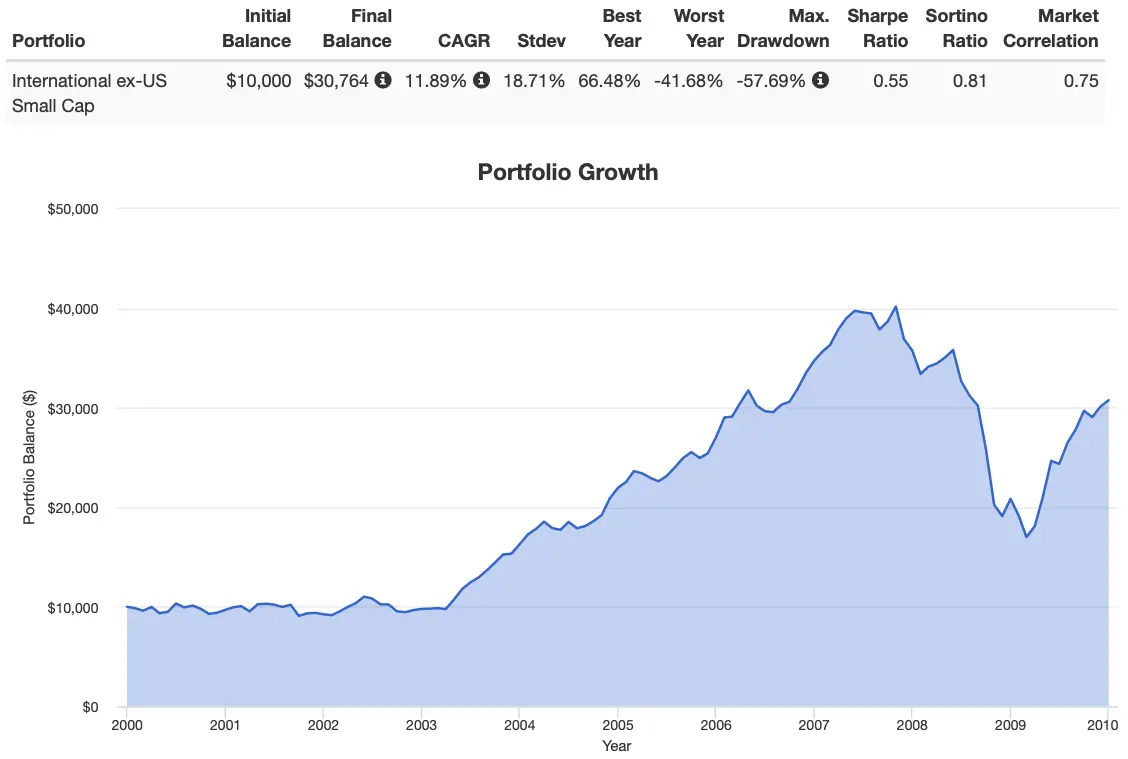
Initial Balance: $10,000
Final Balance: $30,764
CAGR: 11.89%
RISK: 18.71%
Best Year: 66.48%
Worst Year: -41.68%
Sharpe Ratio: 0.55
Sortino Ratio: 0.81
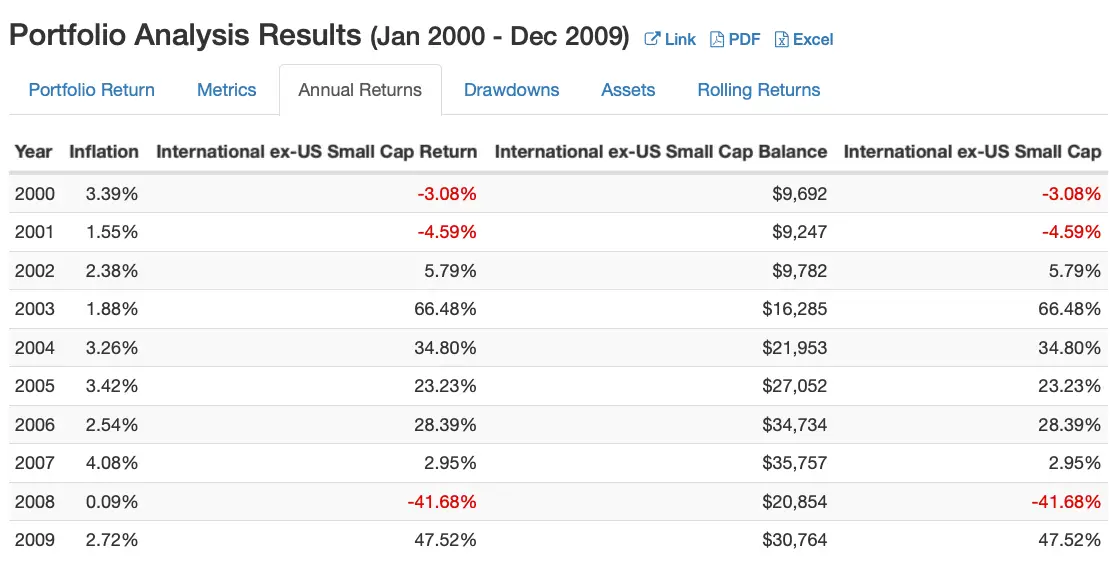
Diversifying outside the US and focussing on ‘size’ as a factor provided to be a wise strategy in the 2000s.
Enter International ex-US small cap = winner of the decade in terms of CAGR.
Before we boast of its winning numbers let’s explore its ride to the top.
International small cap stocks got off to a somewhat rocky start to the decade, albeit relatively less volatile than many other equity asset classes, posting returns of -3.08% (2000) and -4.59% (2001).
The following six years were absolute powerhouse positive returns highlighted by a 66.48% (2003) and 34.80% (2004).
2008 was unkind to this asset class as it posted a -41.68% return followed by its final return of the decade of 47.52% in 2009.
And the final results? An otherworldly 11.89% CAGR for the decade.
Going abroad and going small proved to be a powerful diversifier that would have been a contrarian investing strategy relative to most investors concentrating in the large cap space.

US Micro Cap Stocks = US 2000s Powerhouse
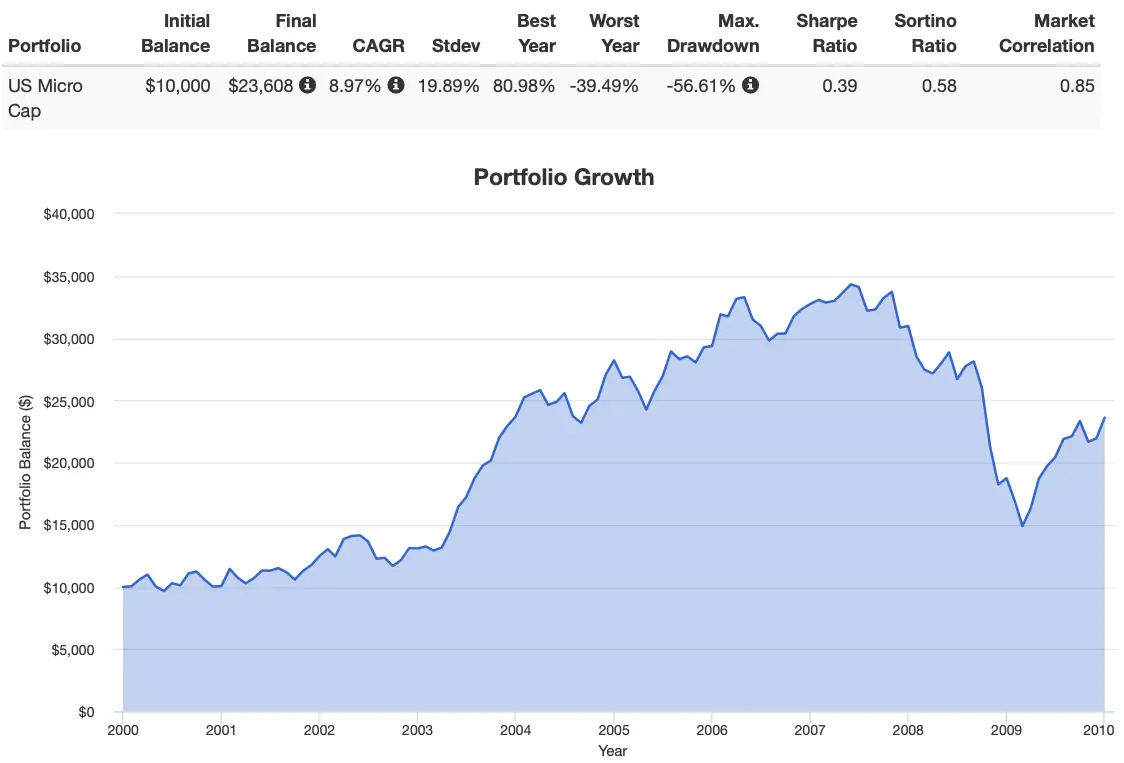
Initial Balance: $10,000
Final Balance: $23,608
CAGR: 8.97%
RISK: 19.89%
Best Year: 80.98%
Worst Year: -39.49%
Sharpe Ratio: 0.39
Sortino Ratio: 0.58
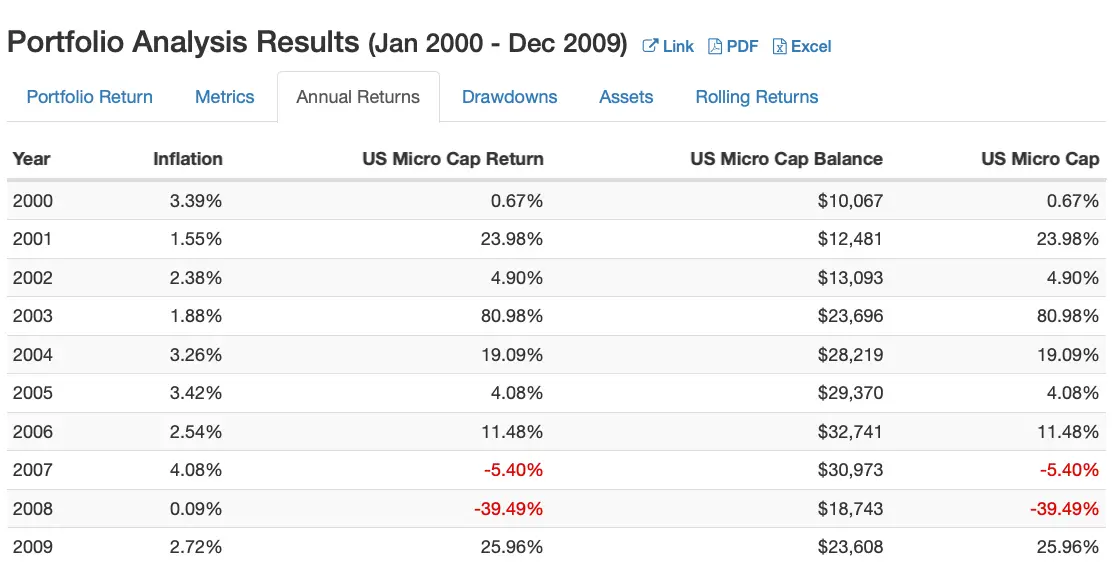
US Micro Cap, the asset class below US small cap, offered the best returns of any blended US asset class in the US market of the 2000s.
Its most impressive characteristic was being resilient to the early 2000s Dot Com Bubble bursting returns for many equity asset classes.
Not only did it come out unscathed but it somehow managed to produce three positive years in a row with 0.67% (2000), 23.98% (2001) and 4.90% (2002).
All in all, US Microcap was able to string together seven positive years consecutively before having a blip (-5.40%) in 2007 and getting roasted (as did everything) in 2008 (-39.49%).
Its final results for the decade – a most impressive 8.97% CAGR.

REITS (US) = 10%+ CAGR Delight (2000 to 2010)
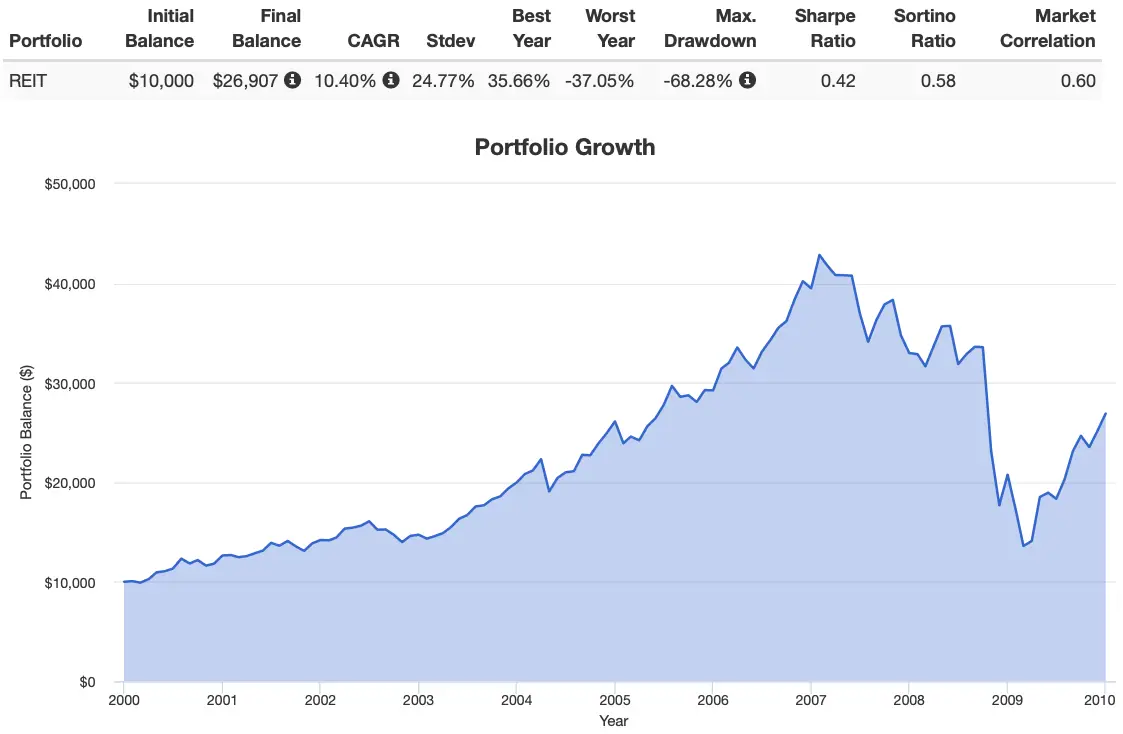
Initial Balance: $10,000
Final Balance: $26,907
CAGR: 10.40%
RISK: 24.77%
Best Year: 35.66%
Worst Year: -37.05%
Sharpe Ratio: 0.42
Sortino Ratio: 0.58
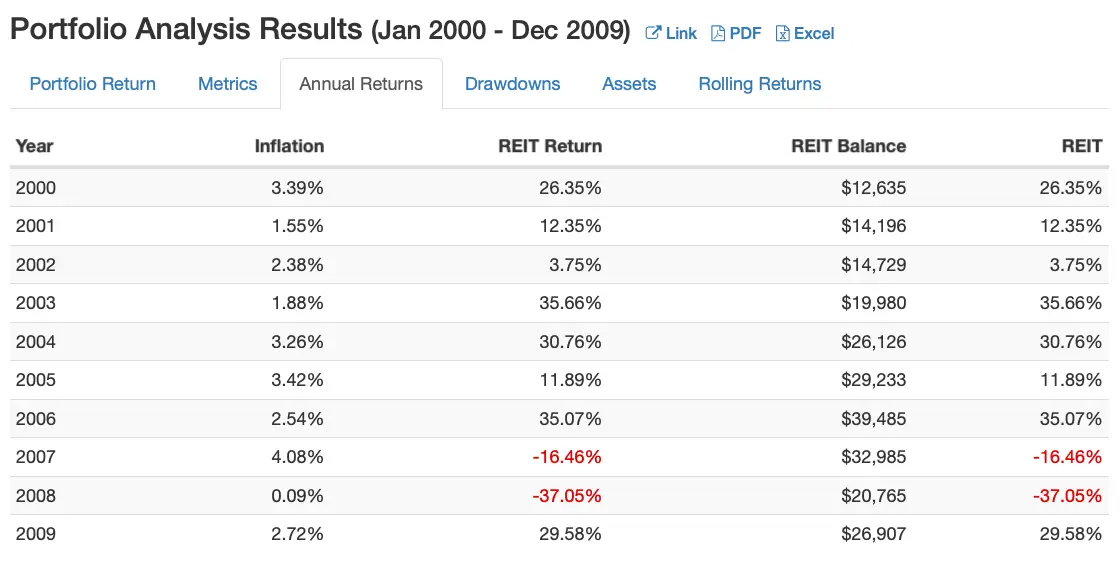
Want to know the most resilient US asset class during the early 2000s Dot Com Bubble?
Enter the room REIT equities.
When large cap tech stocks and other overvalued large cap equities were getting massacred REITs were the ultimate hedge.
With returns of 26.35% (2000), 12.35% (2001) and 3.75% (2002) to start off the decade REITs were off to the races in a big time-manner while other asset classes were experiencing three year drawdowns.
The streak of positive returns continued until 2007 (-16.46%) and 2008 (-37.05%) was as unkind to REITs as it was to every other equity asset class.
Many expert and amateur investors allocate to REITs as a way of diversifying their portfolio.
Strategic investors to this asset class were rewarded with a 10.40% CAGR for the decade. The best returns of any US asset class.
So much for the total lost decade narrative for those diversified into this asset class.

World Minimum Volatility = Super Stabilizer of 2000s
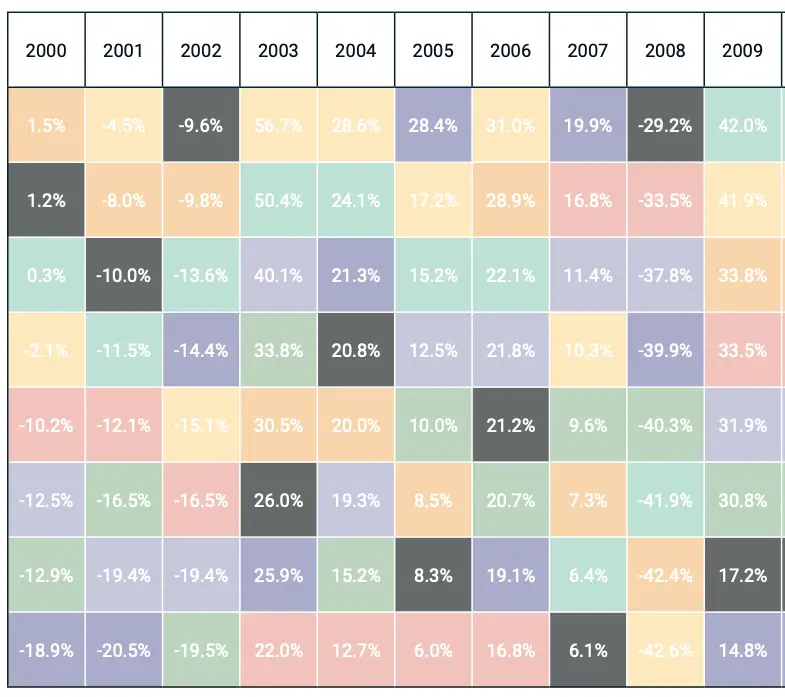
2000: 1.2%
2001: -10%
2002: -9.6%
2003: 26.0%
2004: 20.8%
2005: 8.3%
2006: 21.2%
2007: 6.1%
2008: -29.2%
2009: 17.2%
Average Return: 5.2%
Best Year: 26.0
Worst Year: -29.2
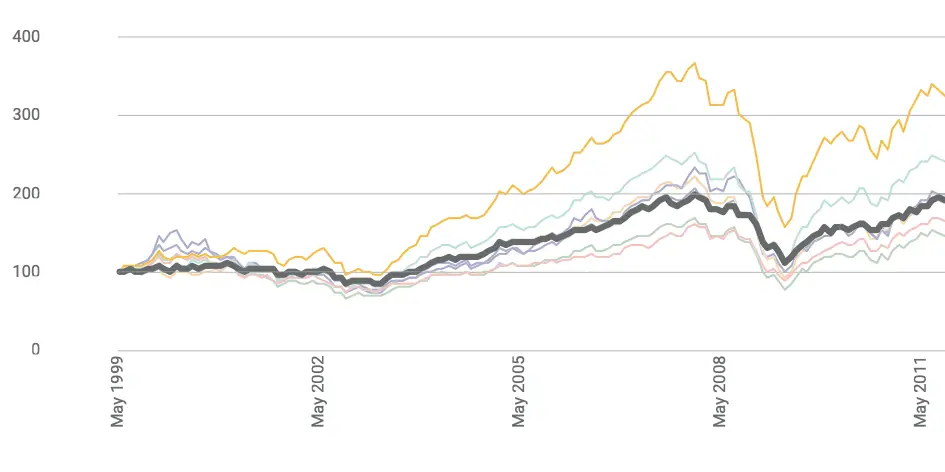
It’s time to enter the realm of factor strategies, for the 2000s, by reviewing the results of MSCI Global Minimum Volatility equities.
The early 2000s were less volatile than other factors but still left this equity strategy down more than up with returns of 1.2%, -10% and -9.6% to kick off the early 2000s.
Five positive years followed from 2003 until 2007.
The year I’m most interested in examining with global minimum volatility stocks was in 2008.
Although, no equity strategy came out alive from 2008, global minimum volatility stocks were the only equity asset class to not get hit with -30%, -40% or -50%+ drawdowns.
In fact, Global Minimum volatility stocks were down -29.2%.
That might sound awful and it definitely is a terrible year. However, relatively speaking the defensive nature of minimum volatility equities reduced relative carnage levels compared to its other equity class peers.
The factor strategy for the decade had an average annual return of 5.2%.

US Mid Cap Value = 2000s Steady Eddy
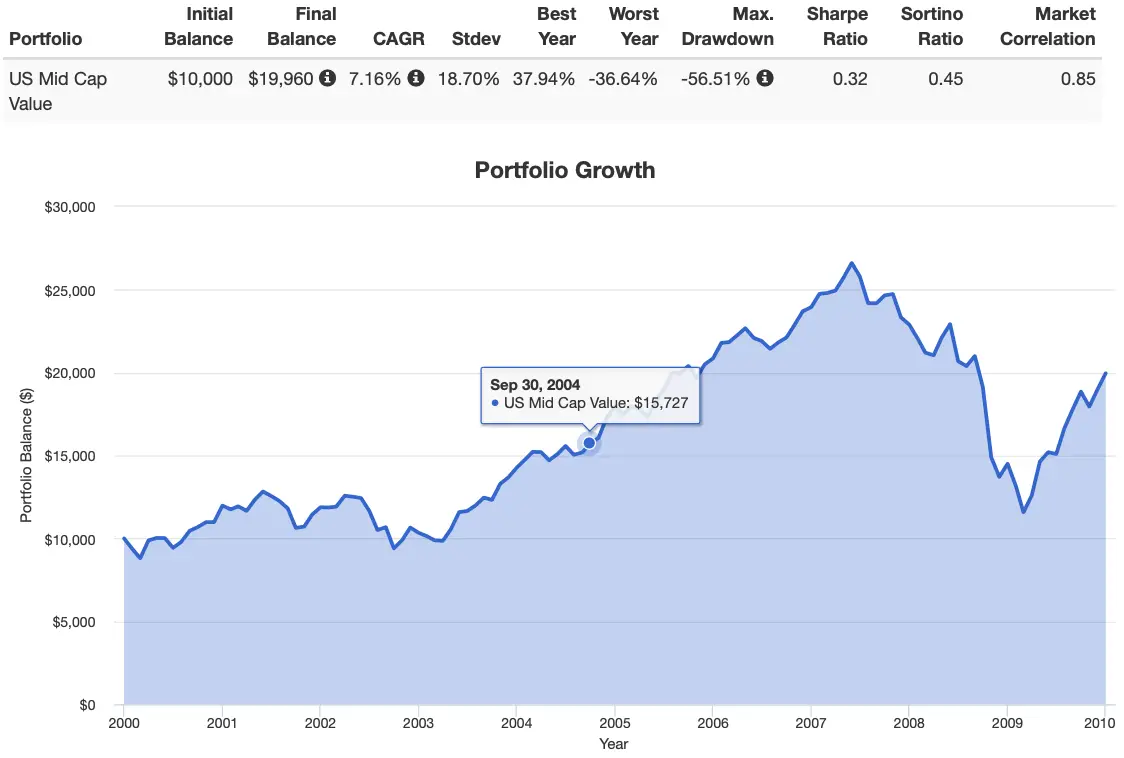
Initial Balance: $10,000
Final Balance: $19,960
CAGR: 7.16%
RISK: 18.70%
Best Year: 37.94%
Worst Year: -36.64%
Sharpe Ratio: 0.32
Sortino Ratio: 0.45
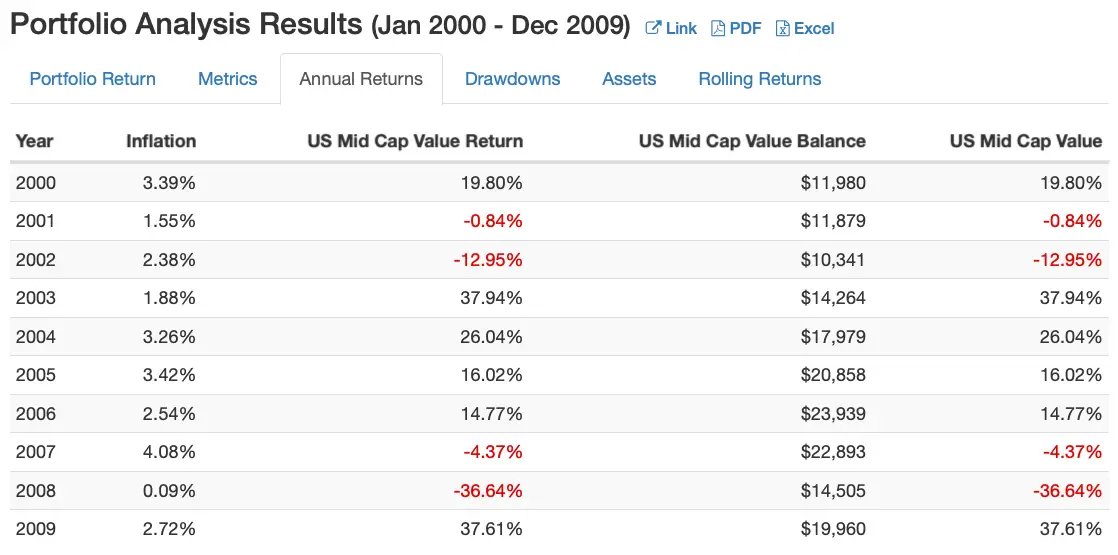
I’m soon planning to write a post on how US mid-cap equities may be the most underrated asset class of all.
In this particular case US mid cap value investors came out of the 2000s without experiencing a lost decade.
Things started off a little rough in the early 2000s with two out of three negative years: 19.80% (2000), -0.84% (2001) and -12.95% (2002).
A very strong stretch of performance for US Mid Cap Value helped combat things overall from 2003 until 2006.
Both 2007 and 2008 were negative years but a strong 2009 allowed US mid cap value stocks to compound at an average of 7.16% for the decade.

World High Dividend Yield = Defensive Equity 2000s
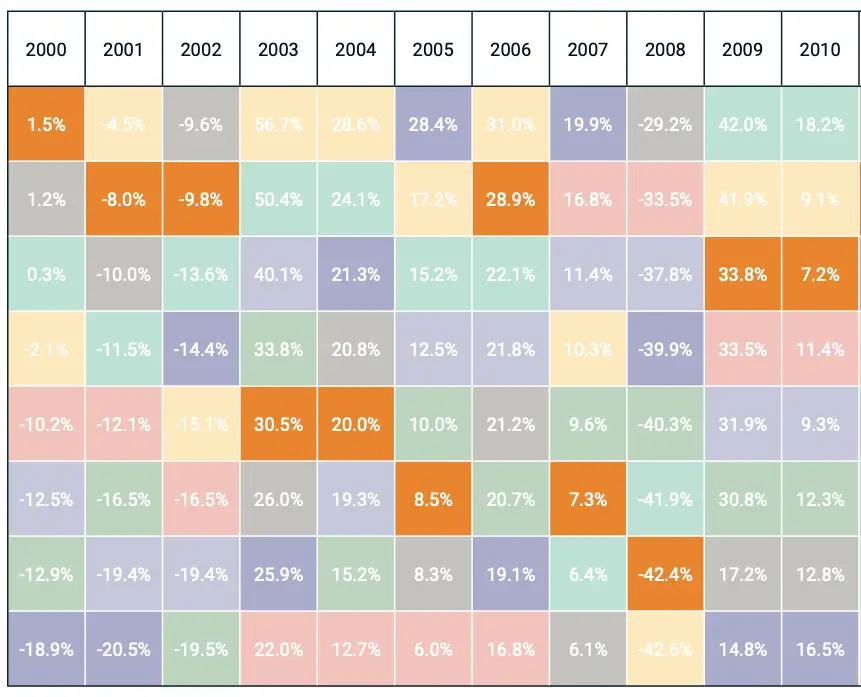
2000: 1.5%
2001: -8%
2002: -9.8%
2003: 30.5%
2004: 20.0%
2005: 8.5%
2006: 28.9%
2007: 7.3%
2008: -42.4%
2009: 33.8%
Average Return: 7.03%
Best Year: 33.8%
Worst Year: -42.42%
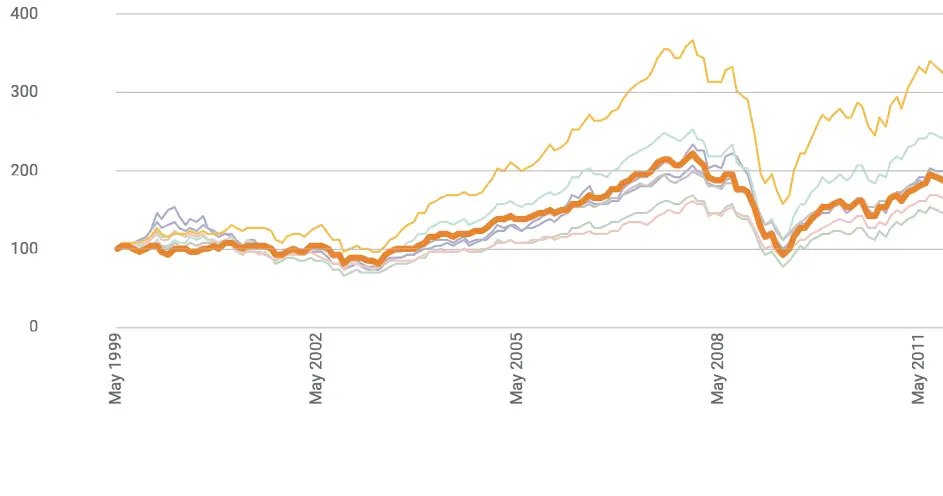
Another day another defensive equity strategy holding its own in the 2000s.
Enter the ring World High Dividend Yield.
The early 2000s were not kind to many equity classes but high dividend yield managed to not have a year worse than -10%.
Five strong years followed from 2003 until 2007. 2008 was particularly rough at -42.4% in relation to global minimum volatility equities only being down -29.2%.
Overall, the average rate of return for the decade was a solid 7.03% for those yield chasing factor investors.

US Mid Cap = Consistent Performer of 2000s
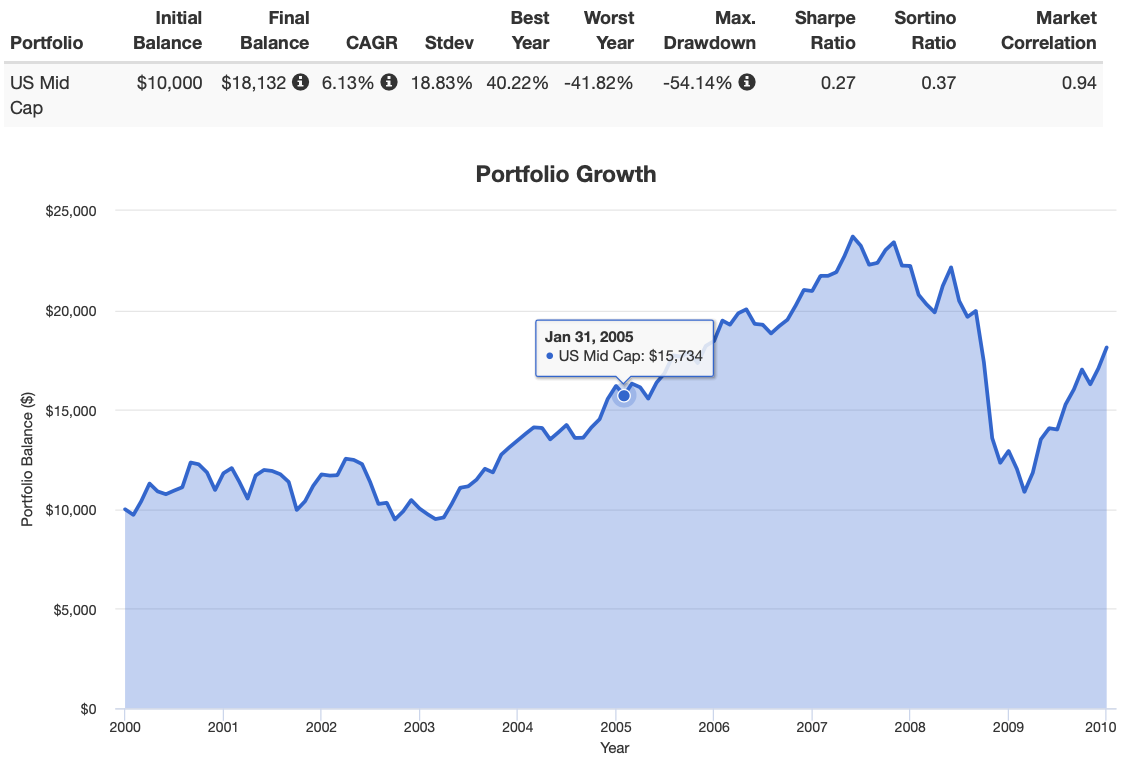
Initial Balance: $10,000
Final Balance: $18,1322
CAGR: 6.13%
RISK: 18.83%
Best Year: 40.22%
Worst Year: -41.82%
Sharpe Ratio: 0.27
Sortino Ratio: 0.37
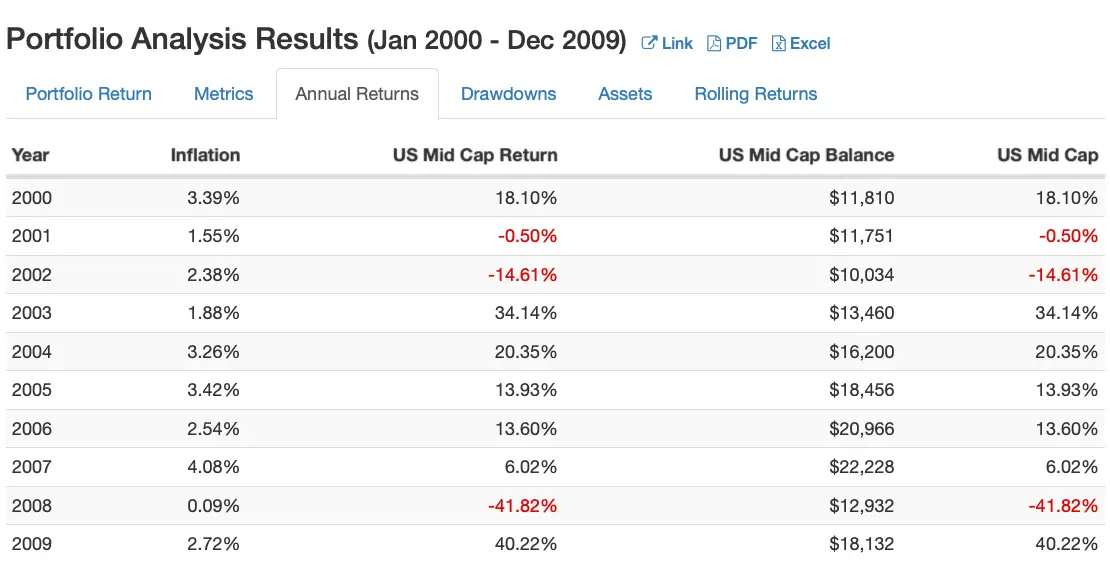
Are we talking about US mid cap equities again? Indeed, we are!
Let’s give a loud round of applause for US mid cap equities submitting a blend and value participant to the circle of 8 winning equity strategies.
The early 2000s were a wash with 18.10% (2000), -0.50% (2001) and -14.61% (2002).
However, the following five years really drove returns for this asset class in the 2000s.
2008 was rough at -41.82% but a recovery of 40.22% in 2009 allowed for a 2000s CAGR of 6.13%.

US Large Cap Equities = Lost Decade 2000s (2000 to 2010)
Okay, we’ve talked about the good. Let’s now talk about the bad. And the ugly.
What most investors consider to be a lost decade happened at the US large cap asset class level.
Specifically, the US Total Stock Market (which is US large cap dominated), US Large Cap Blend (S&P 500) and US Large Cap Growth (Nasdaq) left investors enamoured by high returns in the late 90s yet dry in the 2000s.
Let’s see just how bad it really was.
Lost Decade For US Total Stock Market
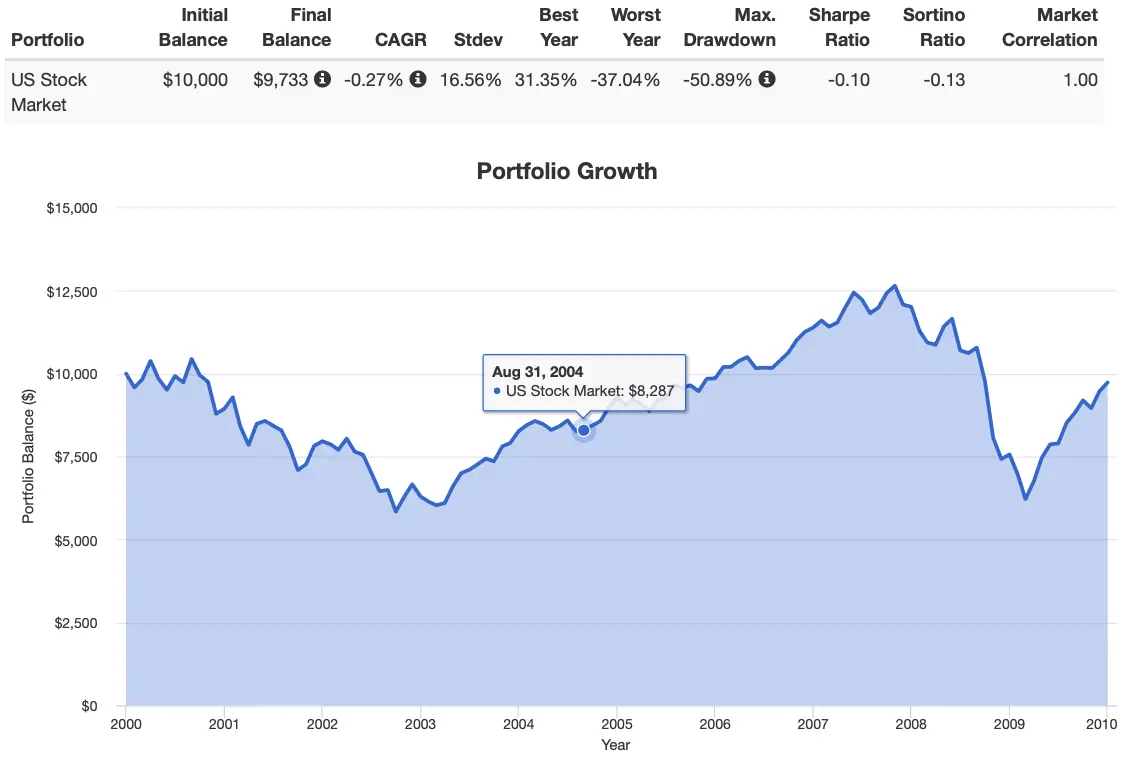
Initial Balance: $10,000
Final Balance: $9,733
CAGR: -0.27%
RISK: 16.56%
Best Year: 31.35%
Worst Year: -37.04%
Sharpe Ratio: -0.10
Sortino Ratio: -0.13
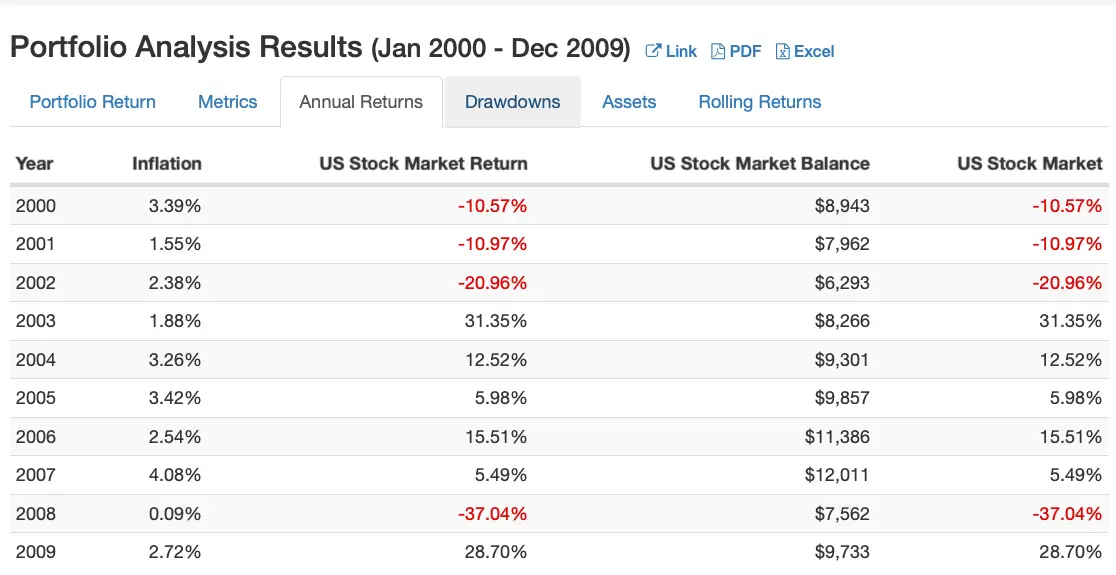
Relatively speaking the US Total Stock Market did better than US Large Cap blend and US Large Cap Growth.
The reason for this is it had a small allocation to US mid cap and US small cap stocks.
Not enough to overcome its large cap bias but a token amount worthy of reducing its overall carnage.
Back to back to back rough years to start the decade saw returns of -10.57% (2000), -10.97% (2001) and -20.96% (2002).
Things stabilized for 5 years of positive returns but 2008 reared its head with a -37.04% smackdown.
Overall, the US Total Stock Market was -0.27% for the decade.
Ouch! Indeed, a lost decade for Bogleheads investors.

Lost Decade For S&P 500 US Large Cap Stocks
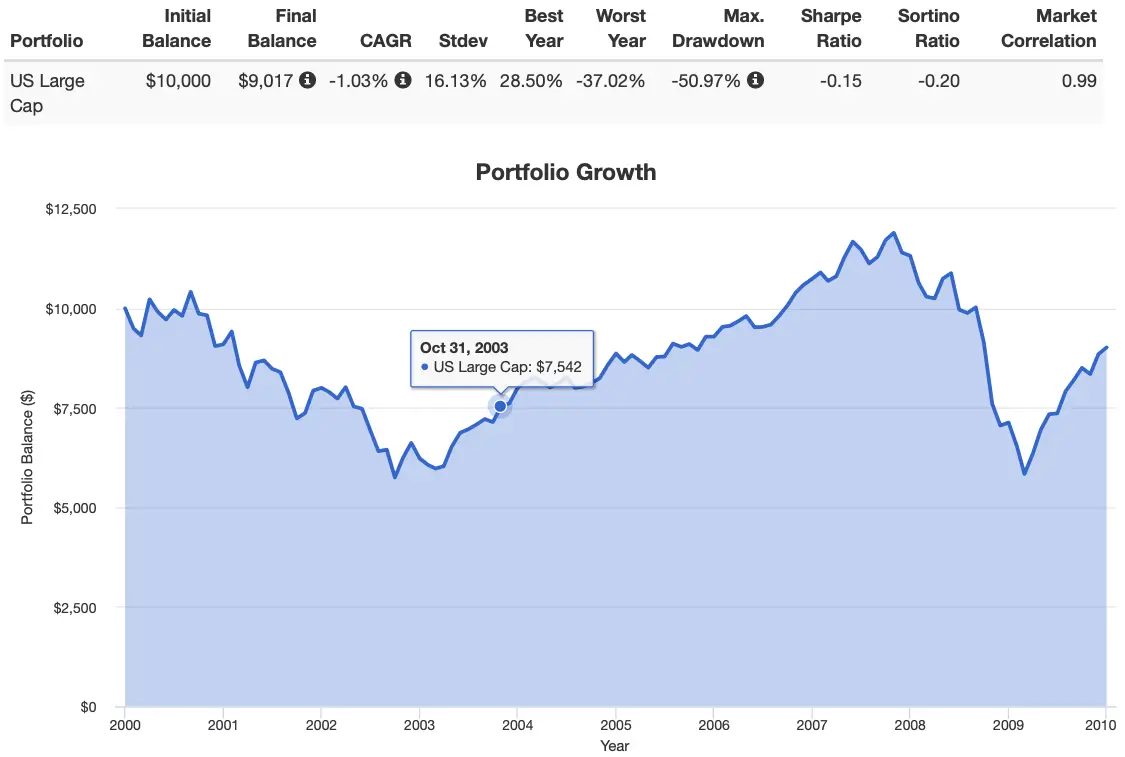
Initial Balance: $10,000
Final Balance: $9,017
CAGR: -1.03%
RISK: 16.13%
Best Year: 28.50%
Worst Year: -37.02%
Sharpe Ratio: -0.15
Sortino Ratio: -0.20
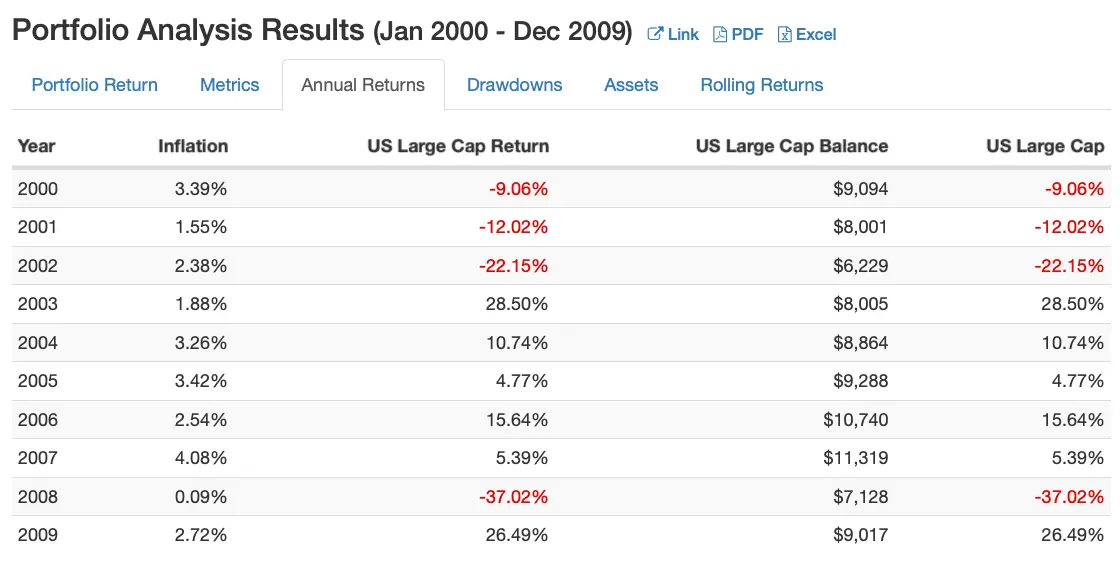
US Large Cap equities had even more of what was expensive from a P/E standpoint in the early 2000s.
Thus, it did even worse than the US Total Stock Market. -9.06% (2000), -12.02% (2001) and -22.15% (2002) during the Dot Com Bubble-tastic era.
A stretch of positive years helped this asset class recover before experiencing a rough -37.02% drawdown for the year in 2008.
Decade results for US Large Cap stocks? -1.03%.
Lost Decade For US Large Cap Growth Equities
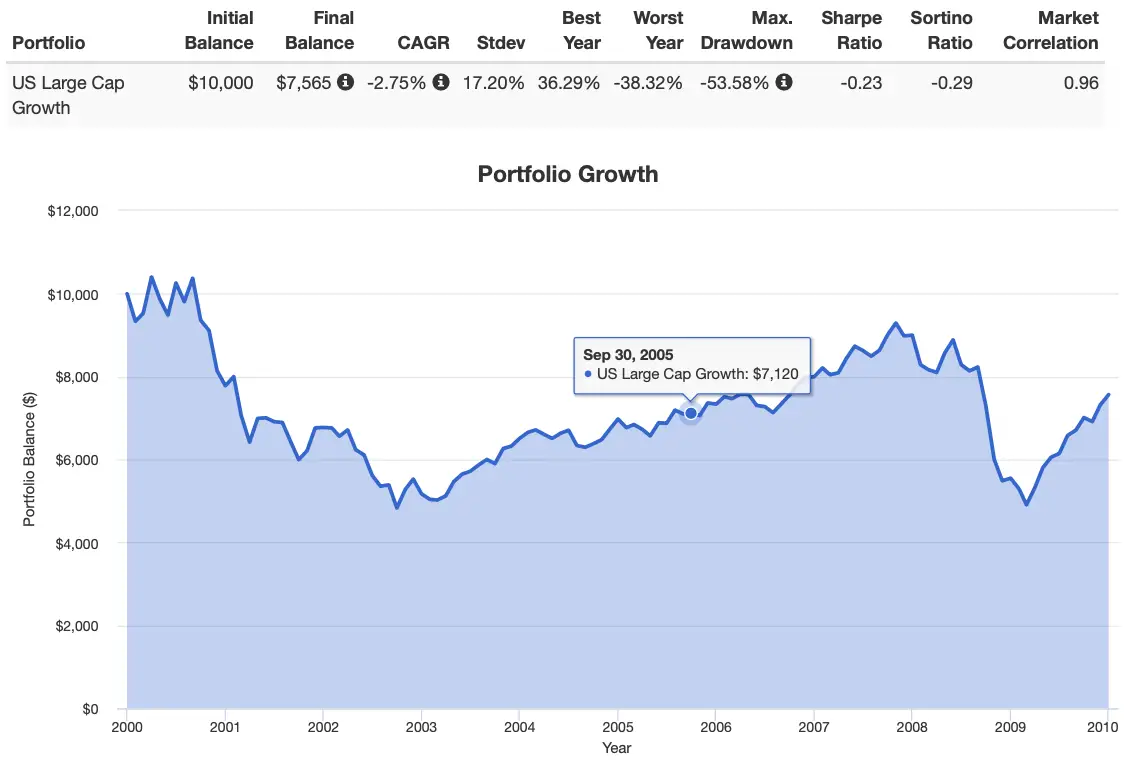
Initial Balance: $10,000
Final Balance: $7,565
CAGR: -2.75%
RISK: 17.20%
Best Year: 36.29%
Worst Year: -38.32%
Sharpe Ratio: -0.23
Sortino Ratio: -0.29
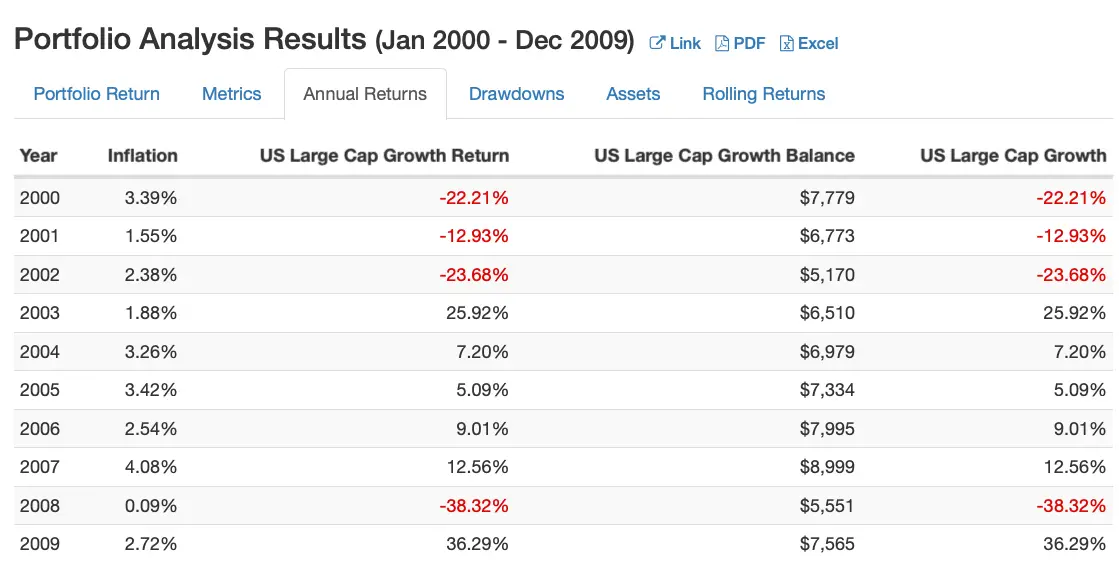
If. you thought it was bad for the US Total Stock Market and US Large Cap blend stocks we’ve got an even worse scenario with US Large Cap Growth.
The worst offender of high priced P/E technology stocks were concentrated in this asset class and three years of carnage ensued.
2000 (-22.21%) + 2001 (-12.93%) + 2002 (-23.68%)
Like most equity classes 2003 until 2007 was positive but then….yep…you guessed it…2008 hit with -38.32%.
Lost decade overall? -2.75%. Indeed!

Lost Decade of the 2000s “Myth” — 12-Question FAQ (8 Equity Asset Classes That Did Well from 2000–2010)
Which equity categories actually did well in the 2000s?
A surprising list: Emerging Markets, International ex-US Small Cap, US Micro Cap, US Small Cap Value, US Mid Cap, US Mid Cap Value, US REITs, and Global Minimum Volatility all posted solid decade-long results versus the US large-cap core that struggled.
Why did US large-cap market-cap indexes fare so poorly?
The decade began after a valuation bubble in mega-cap growth/tech. A long multiple compression period plus two recessions (2001, 2008) left market-cap-weighted large caps flat-to-negative, while other size/styles/regions weren’t as overvalued.
What biases create the “lost decade” narrative?
Three big ones: home-country bias (US-only), market-cap bias (large-cap heavy), and strategy bias (only market-cap beta). Broadening geography, size, and style changes the story.
What role did size (small/micro/mid) play?
Smaller size cohorts often had less bubble exposure, stronger earnings growth coming off a lower base, and greater dispersion for active tilts—leading to better 2000s outcomes than US large-cap growth.
Why did value and dividend tilt help?
Value and high dividend cohorts began the decade at lower valuations and with quality/cash-flow characteristics that cushioned declines. Dividends provided a larger share of total return during a sluggish price decade.
How did REITs beat the “lost decade” label?
US REITs were early-decade hedges to the dot-com bust and paid meaningful income. Despite 2008 pain, the full-period CAGR was strong, highlighting sector diversification benefits.
What is Global Minimum Volatility and why did it hold up?
It’s a defensive factor that selects lower-volatility, lower-beta stocks subject to constraints. In 2008 it fell less than many equity cohorts, helping the full-period average return and drawdown profile.
Did Emerging Markets simply add risk, or real diversification?
Both. EM was a rollercoaster but contributed high long-term returns and lower correlation versus US large caps, improving diversified portfolios even with sharp interim drawdowns.
If international small caps did best, why aren’t they core everywhere?
Historically they’ve been under-owned (less index prominence, fewer vehicles years ago). They add breadth and factor exposure beyond US benchmarks, but come with capacity/liquidity considerations.
What’s the portfolio takeaway from the 2000s?
Avoid single-bet portfolios. Blend regions (US/Intl/EM), sizes (micro/small/mid/large), and styles (value, dividend, min-vol). The 2000s demonstrate how diversification rescues decades.
How can investors implement this lesson simply?
Consider adding international small cap, US small value, a REIT sleeve, and a defensive factor (e.g., min-vol or quality/dividend) to a core global allocation. Rebalance periodically to harvest dispersion.
What caveats apply to the data shown?
Backtests/index histories may face methodology changes, survivorship/selection biases, and index–ETF frictions (fees, taxes, trading costs). Results are illustrative, not predictive; future leadership can differ.
Educational only — not investment advice. Indices are unmanaged and not directly investable; ETFs entail fees, taxes, and tracking error.
Nomadic Samuel Final Thoughts

Firstly, thanks for making it this far! We’re nearly 2000 words at this point.
What a decade the 2000s were for equity investors!
Can we say it was an entire lost decade?
It depends entirely on how you invested and how you view diversification in your portfolio.
For equity investors who diversified by geography, asset class and strategy it likely wasn’t so bad. It might have even been good.
For stock investors who had US home country bias, large cap asset class concentration and market-cap weighted only strategies it was definitely a total lost decade.
What is the takeaway message from all of this?
Diversify, diversify and then diversify some more if you want to build the most efficient and resilient portfolio possible.
source: McAlvany Financial on YouTube
The recent stretch of great returns for US Large Cap equities in 2010s need to be examined in context by the previous lost decade of the 2000s.
For those feeling overconfident about potentially 10-15% annual returns moving forward with US large cap strategies it would be worth checking out forward P/E results.
At the moment US large cap growth and blend are challenging the high P/E valuations these asset classes experience in the early 2000s before struggling mightily.
Does this mean the 2000s will repeat again. Of course not.
However, I’m of the strong opinion that optimizing equity strategies is a prudent way to invest moving forward.
Now over to you! What do you think? Please let me know in the comments below.
Important Information
Comprehensive Investment Disclaimer:
All content provided on this website (including but not limited to portfolio ideas, fund analyses, investment strategies, commentary on market conditions, and discussions regarding leverage) is strictly for educational, informational, and illustrative purposes only. The information does not constitute financial, investment, tax, accounting, or legal advice. Opinions, strategies, and ideas presented herein represent personal perspectives, are based on independent research and publicly available information, and do not necessarily reflect the views or official positions of any third-party organizations, institutions, or affiliates.
Investing in financial markets inherently carries substantial risks, including but not limited to market volatility, economic uncertainties, geopolitical developments, and liquidity risks. You must be fully aware that there is always the potential for partial or total loss of your principal investment. Additionally, the use of leverage or leveraged financial products significantly increases risk exposure by amplifying both potential gains and potential losses, and thus is not appropriate or advisable for all investors. Using leverage may result in losing more than your initial invested capital, incurring margin calls, experiencing substantial interest costs, or suffering severe financial distress.
Past performance indicators, including historical data, backtesting results, and hypothetical scenarios, should never be viewed as guarantees or reliable predictions of future performance. Any examples provided are purely hypothetical and intended only for illustration purposes. Performance benchmarks, such as market indexes mentioned on this site, are theoretical and are not directly investable. While diligent efforts are made to provide accurate and current information, “Picture Perfect Portfolios” does not warrant, represent, or guarantee the accuracy, completeness, or timeliness of any information provided. Errors, inaccuracies, or outdated information may exist.
Users of this website are strongly encouraged to independently verify all information, conduct comprehensive research and due diligence, and engage with qualified financial, investment, tax, or legal professionals before making any investment or financial decisions. The responsibility for making informed investment decisions rests entirely with the individual. “Picture Perfect Portfolios” explicitly disclaims all liability for any direct, indirect, incidental, special, consequential, or other losses or damages incurred, financial or otherwise, arising out of reliance upon, or use of, any content or information presented on this website.
By accessing, reading, and utilizing the content on this website, you expressly acknowledge, understand, accept, and agree to abide by these terms and conditions. Please consult the full and detailed disclaimer available elsewhere on this website for further clarification and additional important disclosures. Read the complete disclaimer here.


