When it comes to capital efficient combinations of stocks and bonds it’s ridiculously fun to dial up both sleeves of the portfolio to 2X to 3X to see what kind of results you historically get in a backtest.
Wow!
Look Ma, I can compound at a rate much greater than an all equity portfolio!
Indeed, that is often the case.
However, what most amateur investors don’t consider is the sequence of returns risk, maximum drawdown scenarios or potential worst year outcomes.
These forms of dialled up portfolios can get obliterated under the perfect storm.
We saw first hand what that looks like in a year like 2022 when stocks and bonds cozy up on the skewer in an aggressive high inflation environment to receive an equal opportunity flame-thrower session.

Consider the performance of PSLDX in 2022 as the ultimate example of this.
This is a 100% equities plus 100% bonds fund.
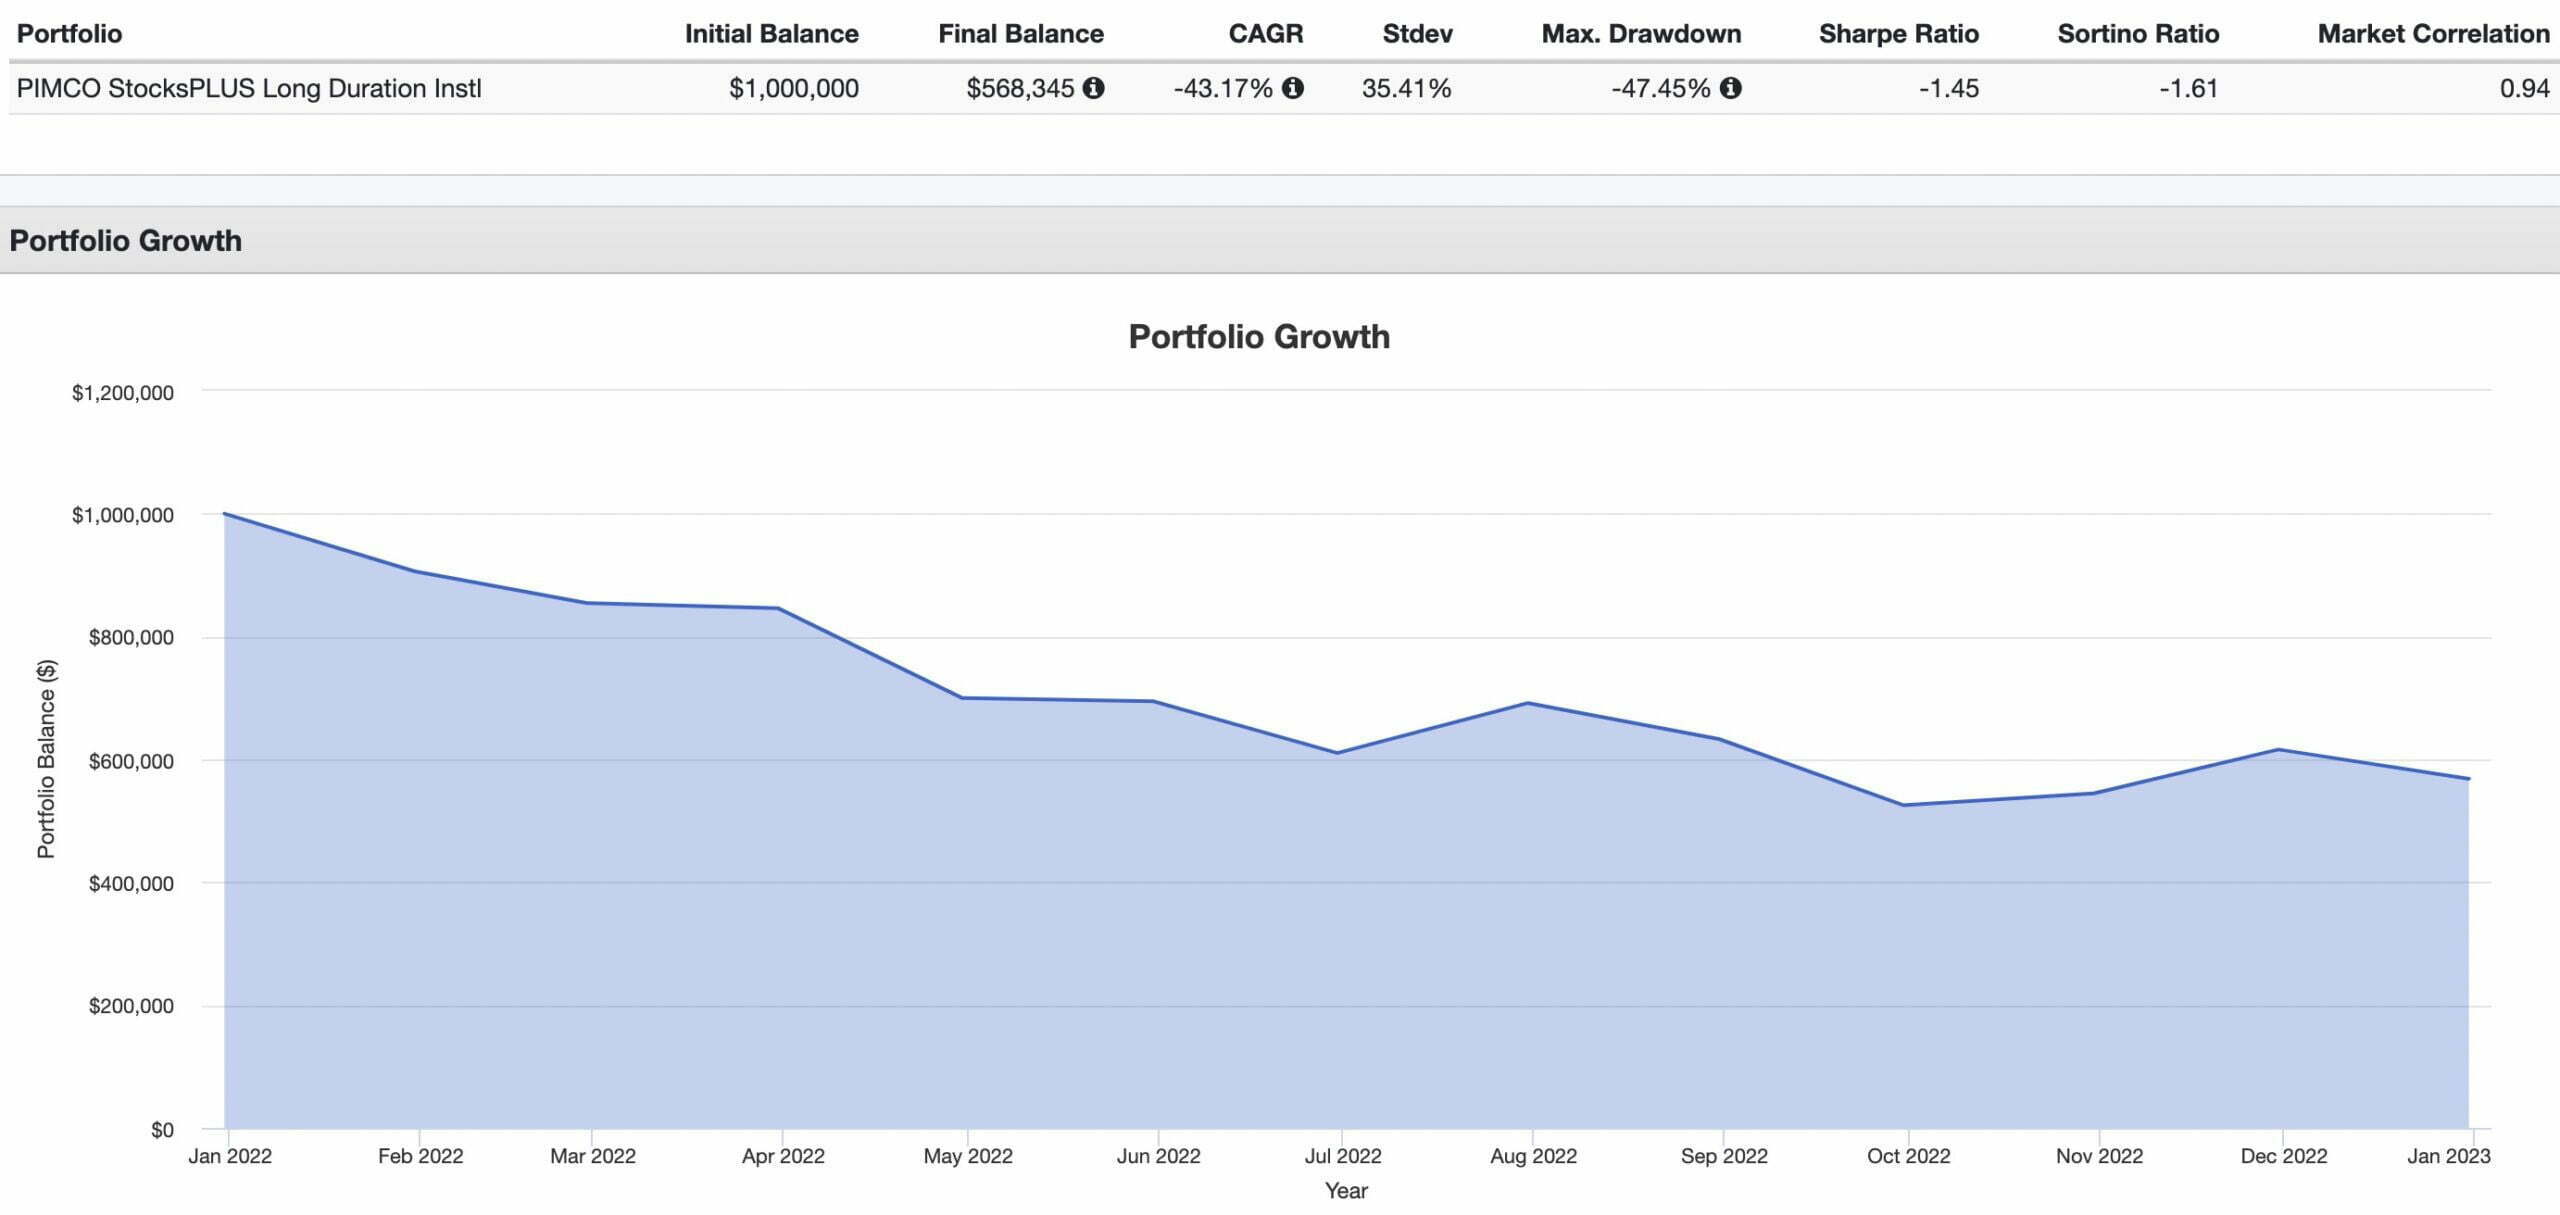
Let’s consider the scenario of a diligent investor who was near retirement (with a million dollar nest egg) who examined the results of PSLDX from 2009 until 2021 (when it was an absolute robust beast of a compounding machine) and decided this was how they wanted to roll moving forward.
They switched things up in late 2021 from a more conservative portfolio to a more aggressive one in PSLDX.
Well, that unlucky person just had their retirement savings nearly sliced in half.
-43.17% CAGR for the year.
-47.45% drawdown.
You have the potential to use capital efficient building blocks to extend your gaze to the stars where maximum performance sans risk management is your primary consideration.
However, you’re equally presented with an opportunity to utilize expanded canvas building blocks to create a defensive masterpiece.
You can assemble a portfolio where defensive considerations are your laser focused mandate.
A Defender Portfolio.
The type of portfolio where you’re specifically seeking returns above risk, palatable worst years and fortified maximum drawdowns.
This is now entirely possible thanks to some specialized ETFs that have recently come to market.
With just 3 funds we can create a portfolio that is globally diversified, strategically diversified and ready for all economic regimes.
It’s the type of portfolio that defends wealth as opposed to seeking it at all costs.
But it’s far from anemic.
In fact, it has slightly outperformed a classic balanced 60/40 portfolio whilst offering a massive upgrade from a defensive standpoint.
With this in mind, let’s examine what I’m branding the Ultimate 3 Fund ETF Defender Portfolio!

How To Assemble The Ultimate 3 Fund ETF Defender Portfolio!
About the Author & Disclosure
Picture Perfect Portfolios is the quantitative research arm of Samuel Jeffery, co-founder of the Samuel & Audrey Media Network. With over 15 years of global business experience and two World Travel Awards (Europe’s Leading Marketing Campaign 2017 & 2018), Samuel brings a unique global macro perspective to asset allocation.
Note: This content is strictly for educational purposes and reflects personal opinions, not professional financial advice. All strategies discussed involve risk; please consult a qualified advisor before investing.

These asset allocation ideas and model portfolios presented herein are purely for entertainment purposes only. This is NOT investment advice. These models are hypothetical and are intended to provide general information about potential ways to organize a portfolio based on theoretical scenarios and assumptions. They do not take into account the investment objectives, financial situation/goals, risk tolerance and/or specific needs of any particular individual.
Step 1: Upgrade Our Equity Sleeve From MCW to Min Vol
The first step towards building the 3 fund defender portfolio is to upgrade our equity sleeve from a market-cap weighted arrangement to a more defensive minimum volatility strategy.
That looks specifically like this.
Sayonara, VTI ETF and/or VT ETF!
Wilkommen, USMV ETF and/or ACWV ETF!

So essentially we’re saying ciao to the US only version of market cap weighted VTI or globally diversified MCW VT.
Why would we want to do that?
These are rock bottom fee funds that give you exposure to thousands of stocks!
Well, we’re doing it specifically for one reason only.
Historically, minimum volatility mandates have been 100s of basis points more defensive than market cap weighted arrangements.
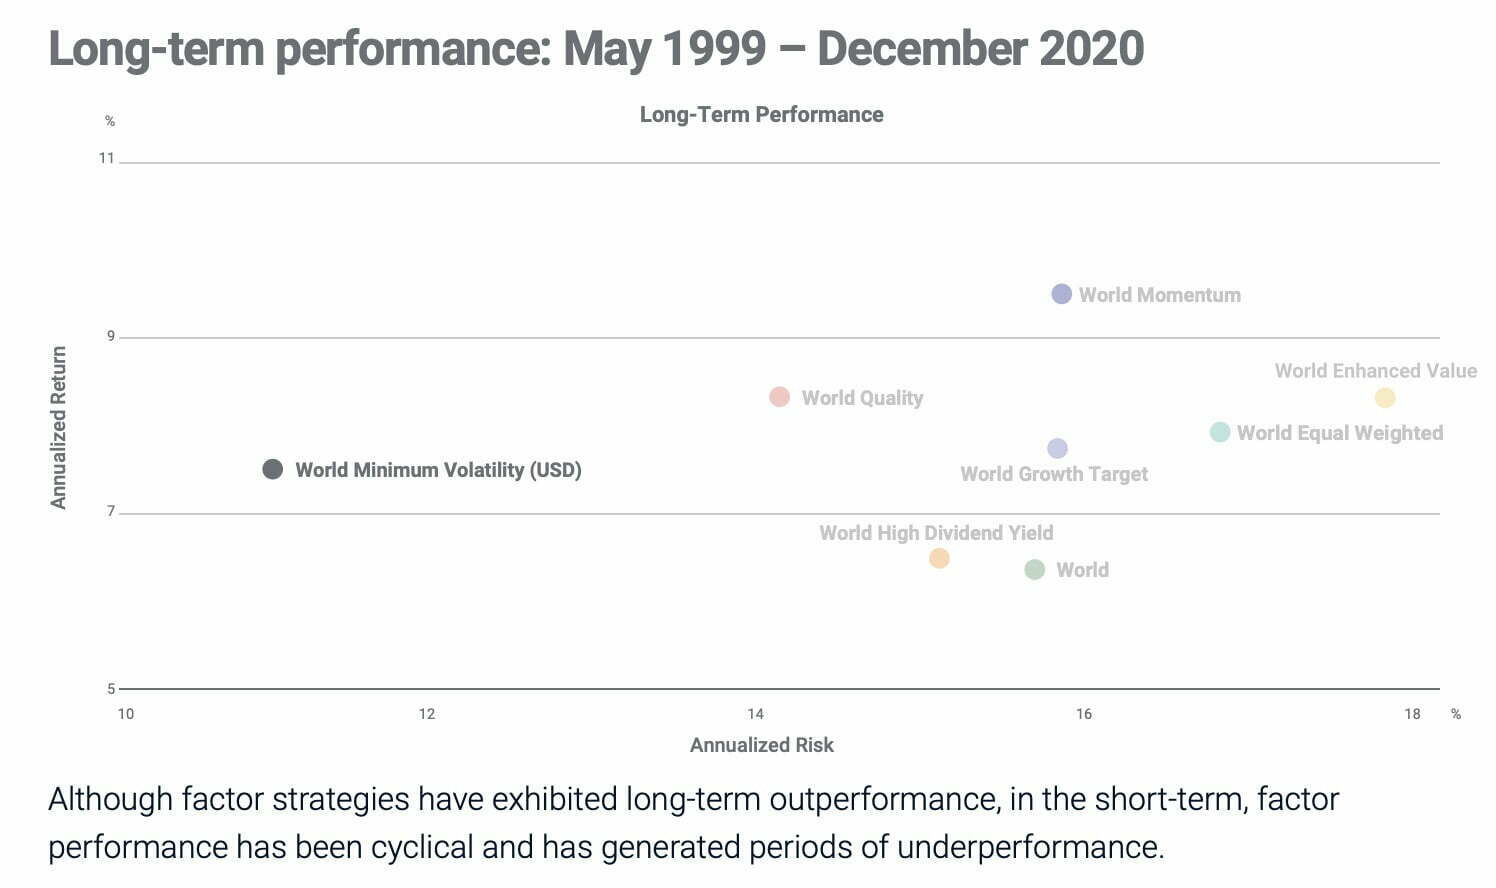
Here we’re able to clearly see that over a long-range period of time, the World Minimum Volatility Strategy has been approximately 500 basis points more defensive than its World Market Cap Weighted parent index!
Now that’s a massive defensive upgrade!
Actually, it’s such a low hanging fruit (for investors seeking to build the ultimate defensive portfolio) we’ll just go ahead and pluck it directly from the branches.
Now you’re likely thinking you’ll be sacrificing returns in the process?
Nope.
They’re actually enhanced.
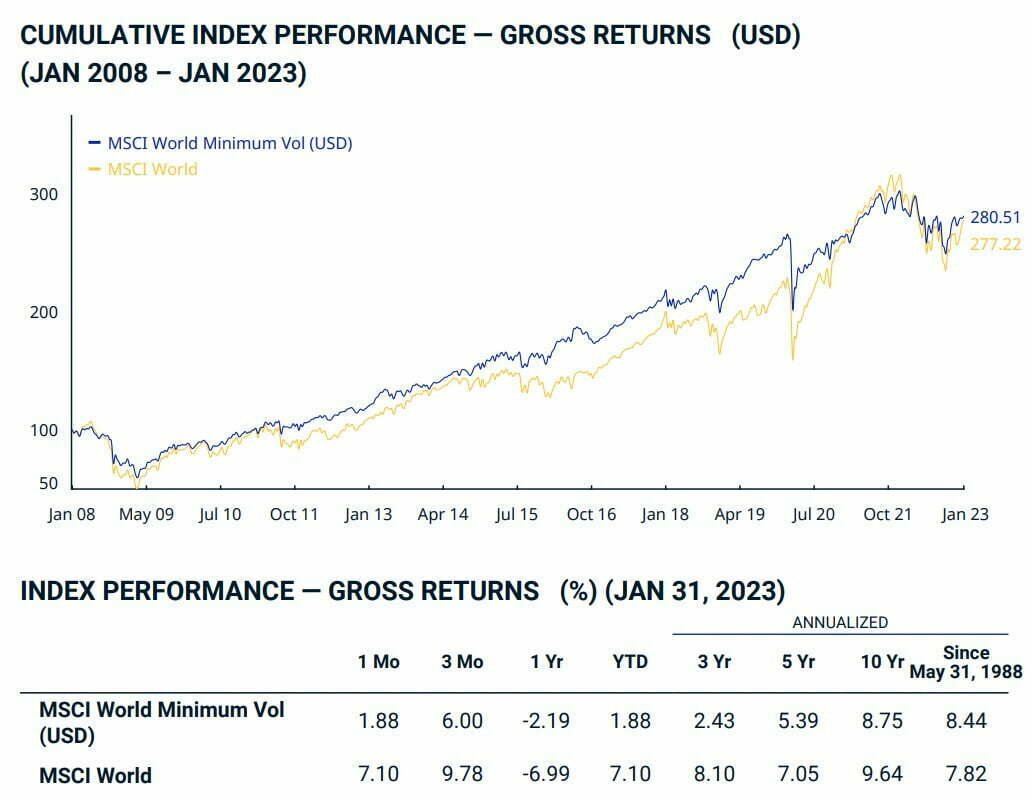
Since 1988, the MSCI World Minimum Volatility index has outperformed its parents market cap weighted index by 62 basis points.
8.44% vs 7.82%.
The last thing for us to do is to take a less aggressive equity position with our portfolio than a 60/40.
Since, that’ll be our benchmark we’re seeking an overall more defensive portfolio.
With this in mind, we’ll shrink our equity sleeve from 60% down to 40%.
Let’s move on to step 2.

Step 2: Capital Efficient Upgrade From “Just Bonds” to Equal Parts Bonds + Managed Futures
In my opinion, the most exciting capital efficient product launched in 2023 has been RSBT ETF.
Better known as Return Stacked Bonds and Managed Futures ETF.
I’ve reviewed RSBT ETF and also featured an article with its creator Corey Hoffstein unpacking the strategy behind Return Stacked Bonds and Managed Futures.
I’d highly recommend checking those articles out after you’re done reading this one.
But essentially what we’re trying to do during Step 2 is become as capital efficient as possible to increase our exposure to a managed futures strategy while also allocating to fulfil our bond mandate.
Managed Futures brings to the table an alternative adaptive strategy that is both uncorrelated with stocks and bonds.
It historically, has provided attractive long-term returns while additionally providing crisis alpha when needed the most.
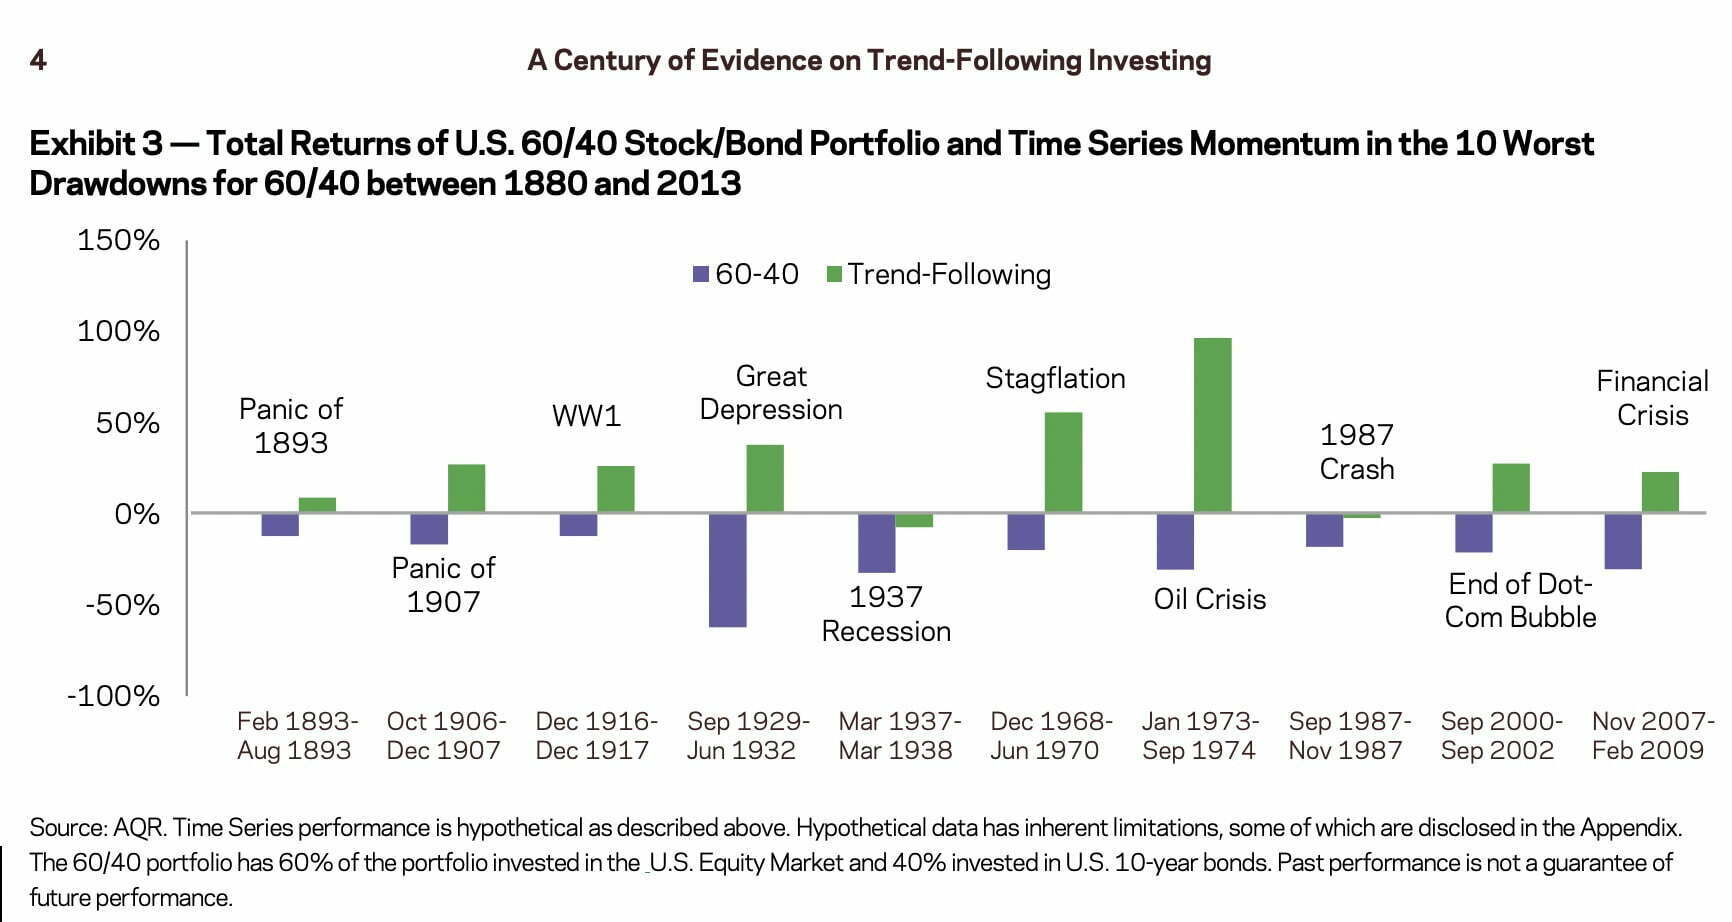
Since our benchmark is the milquetoast 60/40 portfolio, let’s examine how a trend-following managed futures strategy has performed during the most challenging market conditions from 1893 until 2009.
Here we’re able to see that trend-following is a reliable partner in crime when it comes to defending against difficult market scenarios.
It came to the rescue in the early 2000s, 2008 and also 2022!
Let’s check out 2022 in particular since we’ve all just lived through that!
KMLM ETF vs VBIAX Mutual Fund 2022 Performance

Our uncorrelated Managed Futures strategy, as best represented by KMLM ETF, thrived in 2022 when the traditional long-only VBIAX 60/40 portfolio was eaten alive.
Why did a fund like KMLM ETF deliver such fantastic returns amidst market turmoil?
Because trends were strong (and often are that way) in a year like 2022.
When bonds are clearly down and commodities are up an adaptive strategy will capture both sides of the equation.
It’ll adapt like a chameleon to say “yes” to shorting bonds and “yes” to going long commodities.
It’s just following the trends.
The issue that allocators have had in the past is whether or not to shave down equities and/or bonds to make space in the portfolio for this strategy.
Now, we don’t have to.
We’ll just boast “jolly crack’n good times” to an equal helping of bonds and managed futures with a capital efficient fund like RSBT ETF that gives you 100% exposure to both strategies for every dollar spent.
It’s a 200% canvas product and it’s quite frankly a game changer.
We’l take a generous slice of 50% RSBT ETF for our robust defensive portfolio.
You’ll see later on when we simulate a backtest.
But for the time being it’s on to step 3!

Step 3: Add A Return Smoothing Diversifying Strategy To The Equation
Maybe you’re thinking we’re just about done over here.
You’re correct in assuming that!
But we’ve still got one more step to build the Ultimate Expanded Canvas Defender Portfolio.
To really make this as silky smooth of a ride as possible we need a return smoother that further diversifies our portfolio aside from our current exposure to stocks, bonds and managed futures.
Enter the room BTAL ETF.
It’s an anti-beta market neutral fund that takes a long position in low volatility stocks while shorting high beta stocks.
In many regards, it offers an “option” like put insurance against rapid market drawdowns without the long-term drag.
Why does it work so well when shit hits the fan?
Let’s consider the following scenario.
In a market where most equity strategies are getting crushed, the more defensive stocks might be down -10% whereas high beta stocks are almost guaranteed to be experiencing something far worse.
Maybe they’re down -20%.
In this scenario our fund would be up +10%!
We’d be long -10% but short -20% for an overall positive outcome.
Plug 10% of this fund into any model portfolio and watch your risk adjusted rate of returns improve!
Let’s consider a 100% VBIAX 60/40 Portfolio versus 90% VBIAX + 10% BTAL.
100% VBIAX vs 90% VBIAX + 10% BTAL Performance Summary
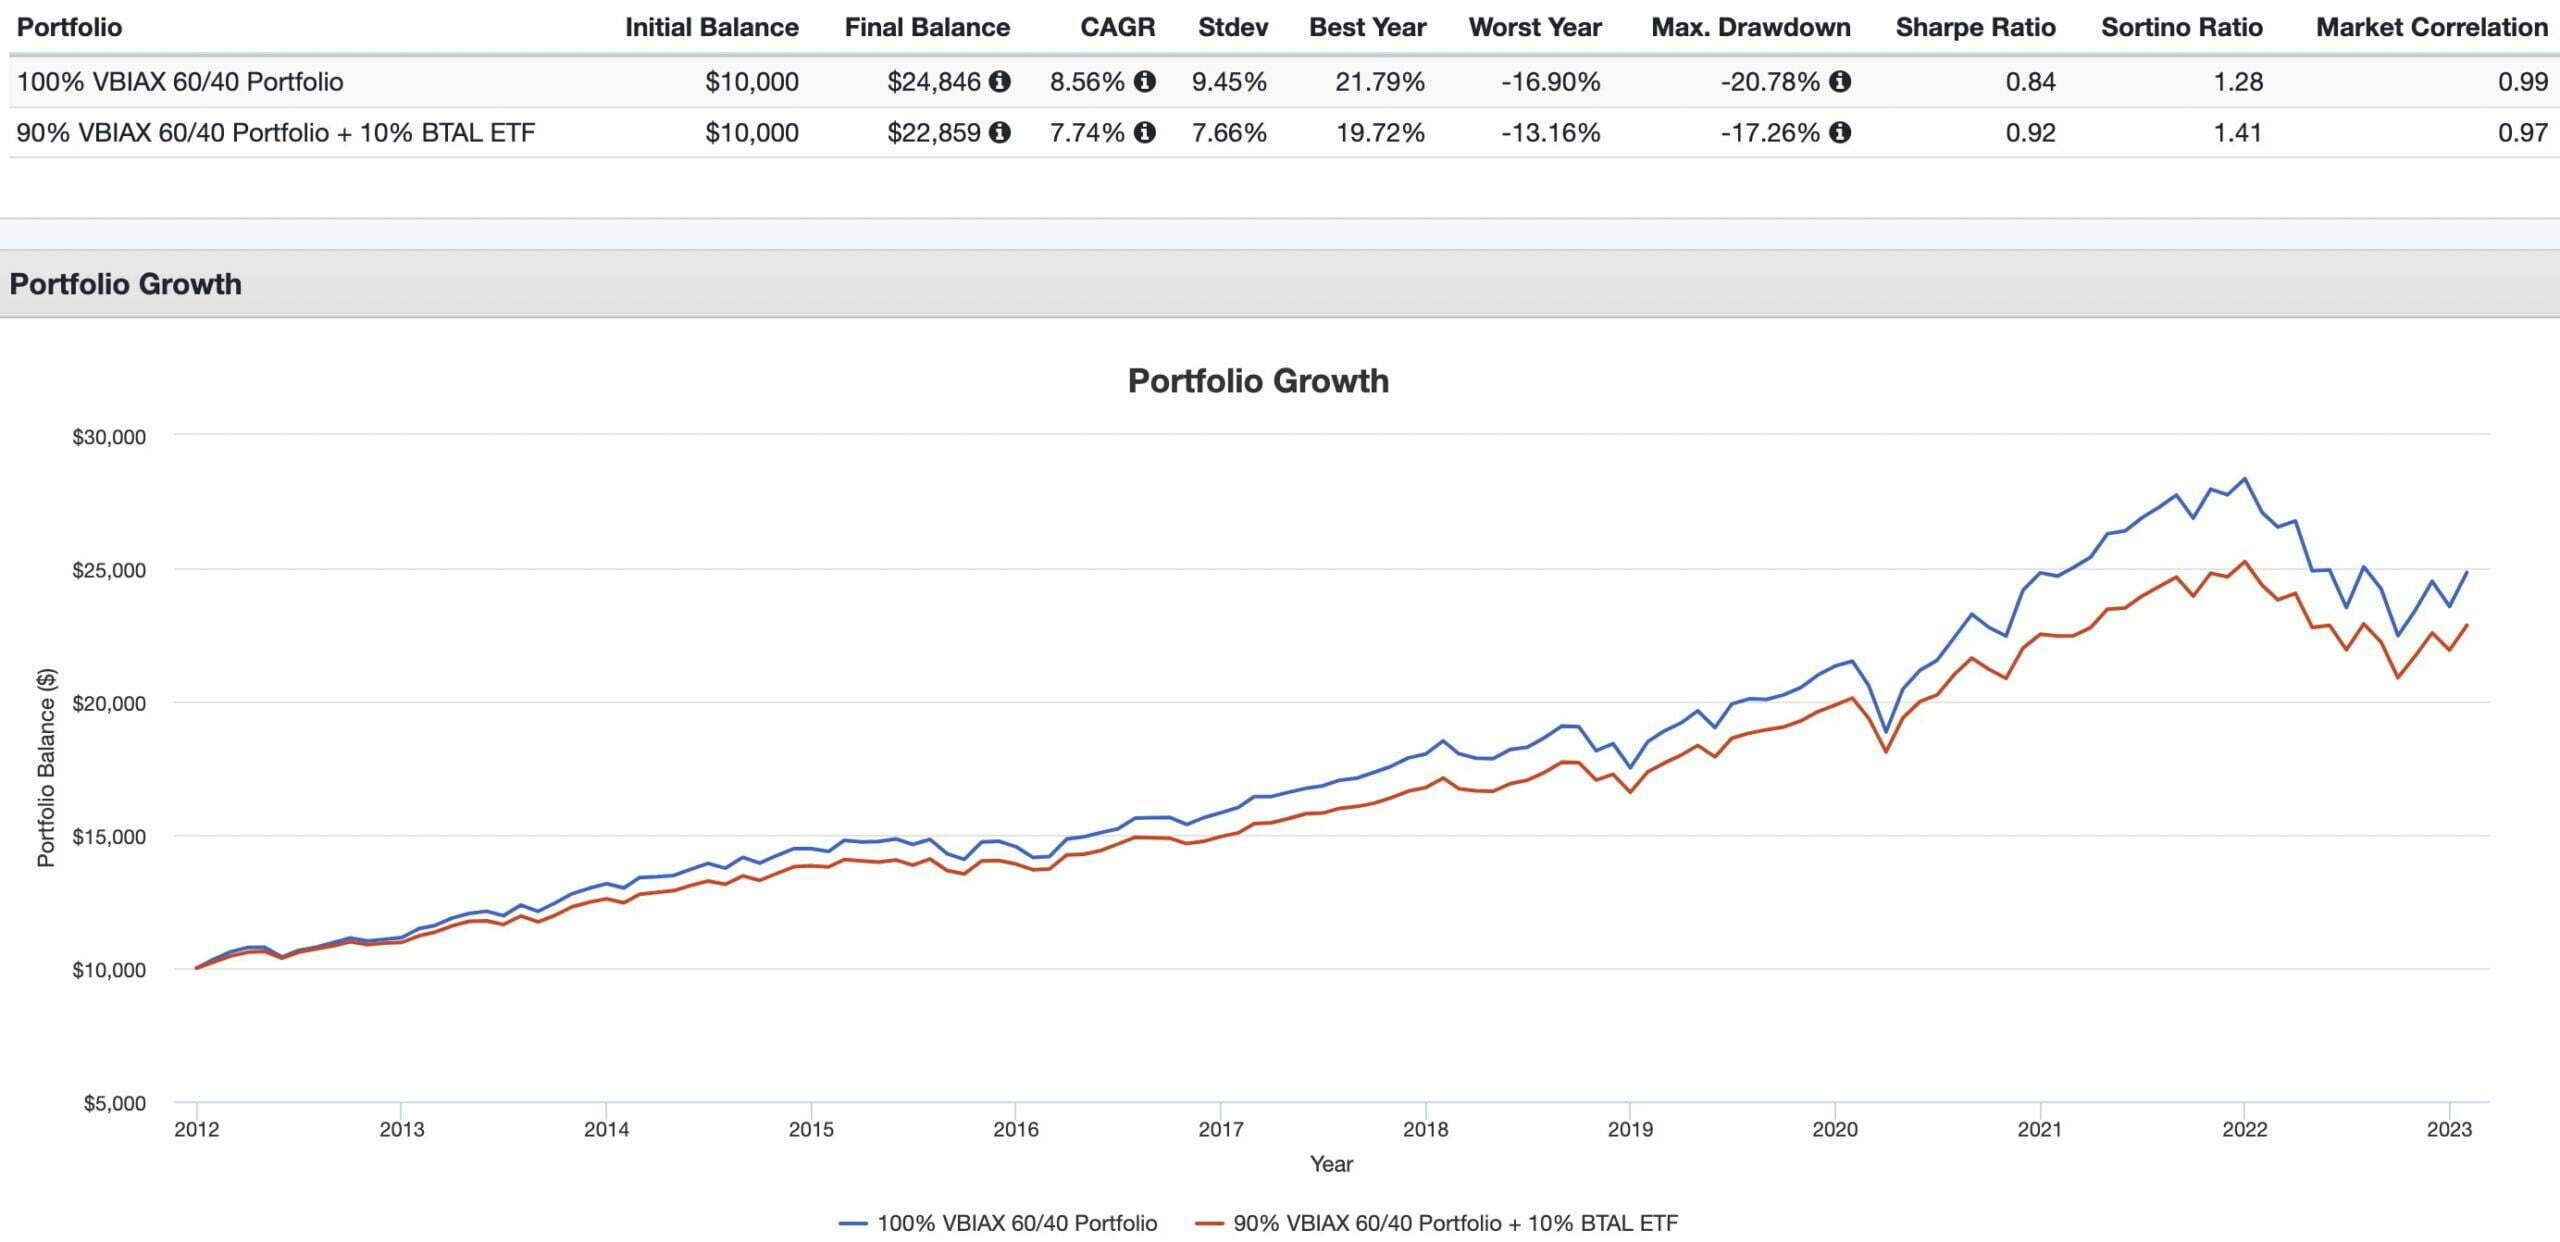
Notice how our Risk (Standard Deviation), Worst Year, Maximum Drawdown, Sharpe Ratio, Sortino Ratio and Market Correlation are all enhanced with just a 10% slice of BTAL ETF!
This of course comes with a slight decrease in performance.
However, since we’re building a capital efficient expanded canvas portfolio we’re looking specifically for this kind of diversifying strategy to add to the mix.
And we’ll take 10% of BTAL to accomplish just that.
It’s time to simulate performance with a backtest.
Simulate Performance Of Our Capital Efficient 3 Fund Defender Portfolio
So we’ve assembled the building blocks of our ultimate defensive 3-fund ETF portfolio.
We’ve got the globally diversified version:
40% $ACWV
50% $RSBT
10% $BTAL
And we’ve got the US-only mandate:
40% $USMV
50% $RSBT
10% $BTAL
Overall, we have an expanded canvas portfolio of 150% exposure:
40% Minimum Volatility Equities
50% Aggregate Bonds
50% Managed Futures Trend-Following
10% Anti-Beta Market Neutral
Let’s backtest the results with the following funds:
40% USMV ETF
50% PQTIX Mutual Fund (Managed Futures)
50% AGG ETF (Aggregate Bonds)
10% BTAL ETF
-50% CASHX Fund (Cover Our Leverage)
Ultimate Defender Portfolio versus VBIAX 60/40 Asset Allocation
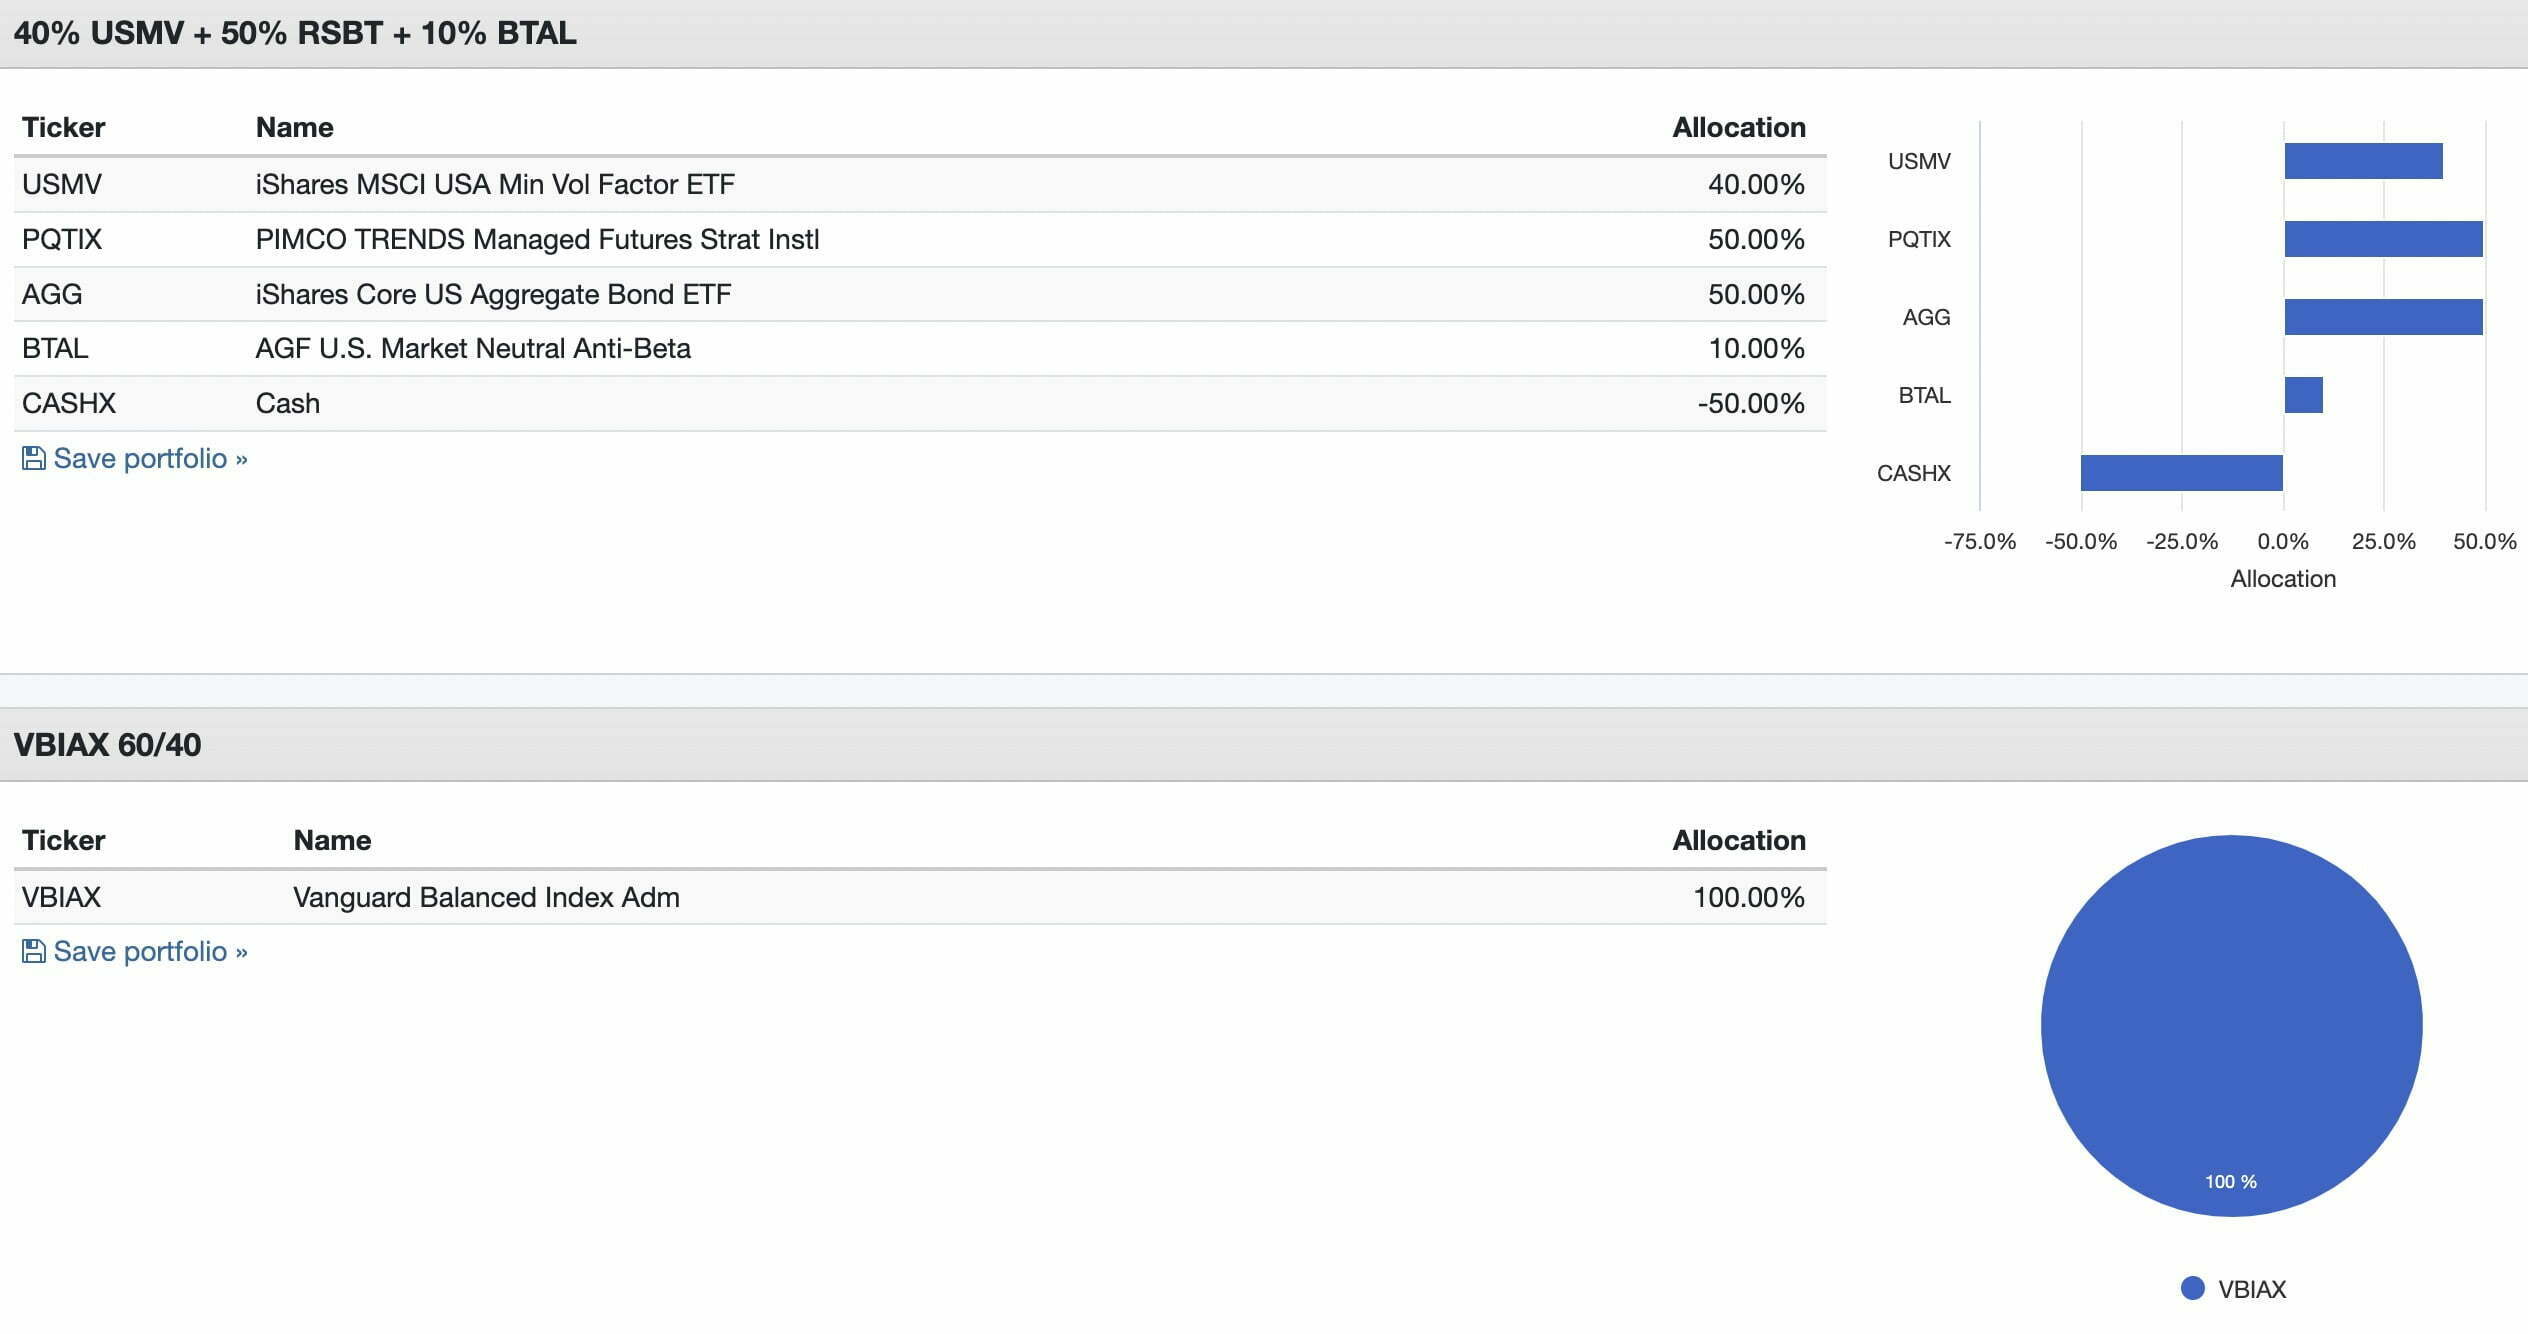
And we’ll be comparing this directly against VBIAX 60/40 Portfolio.
Let’s check out the performance summary as far back as we can backtest it.
Simulated Ultimate Defender Portfolio versus VBIAX 60/40 Performance Summary
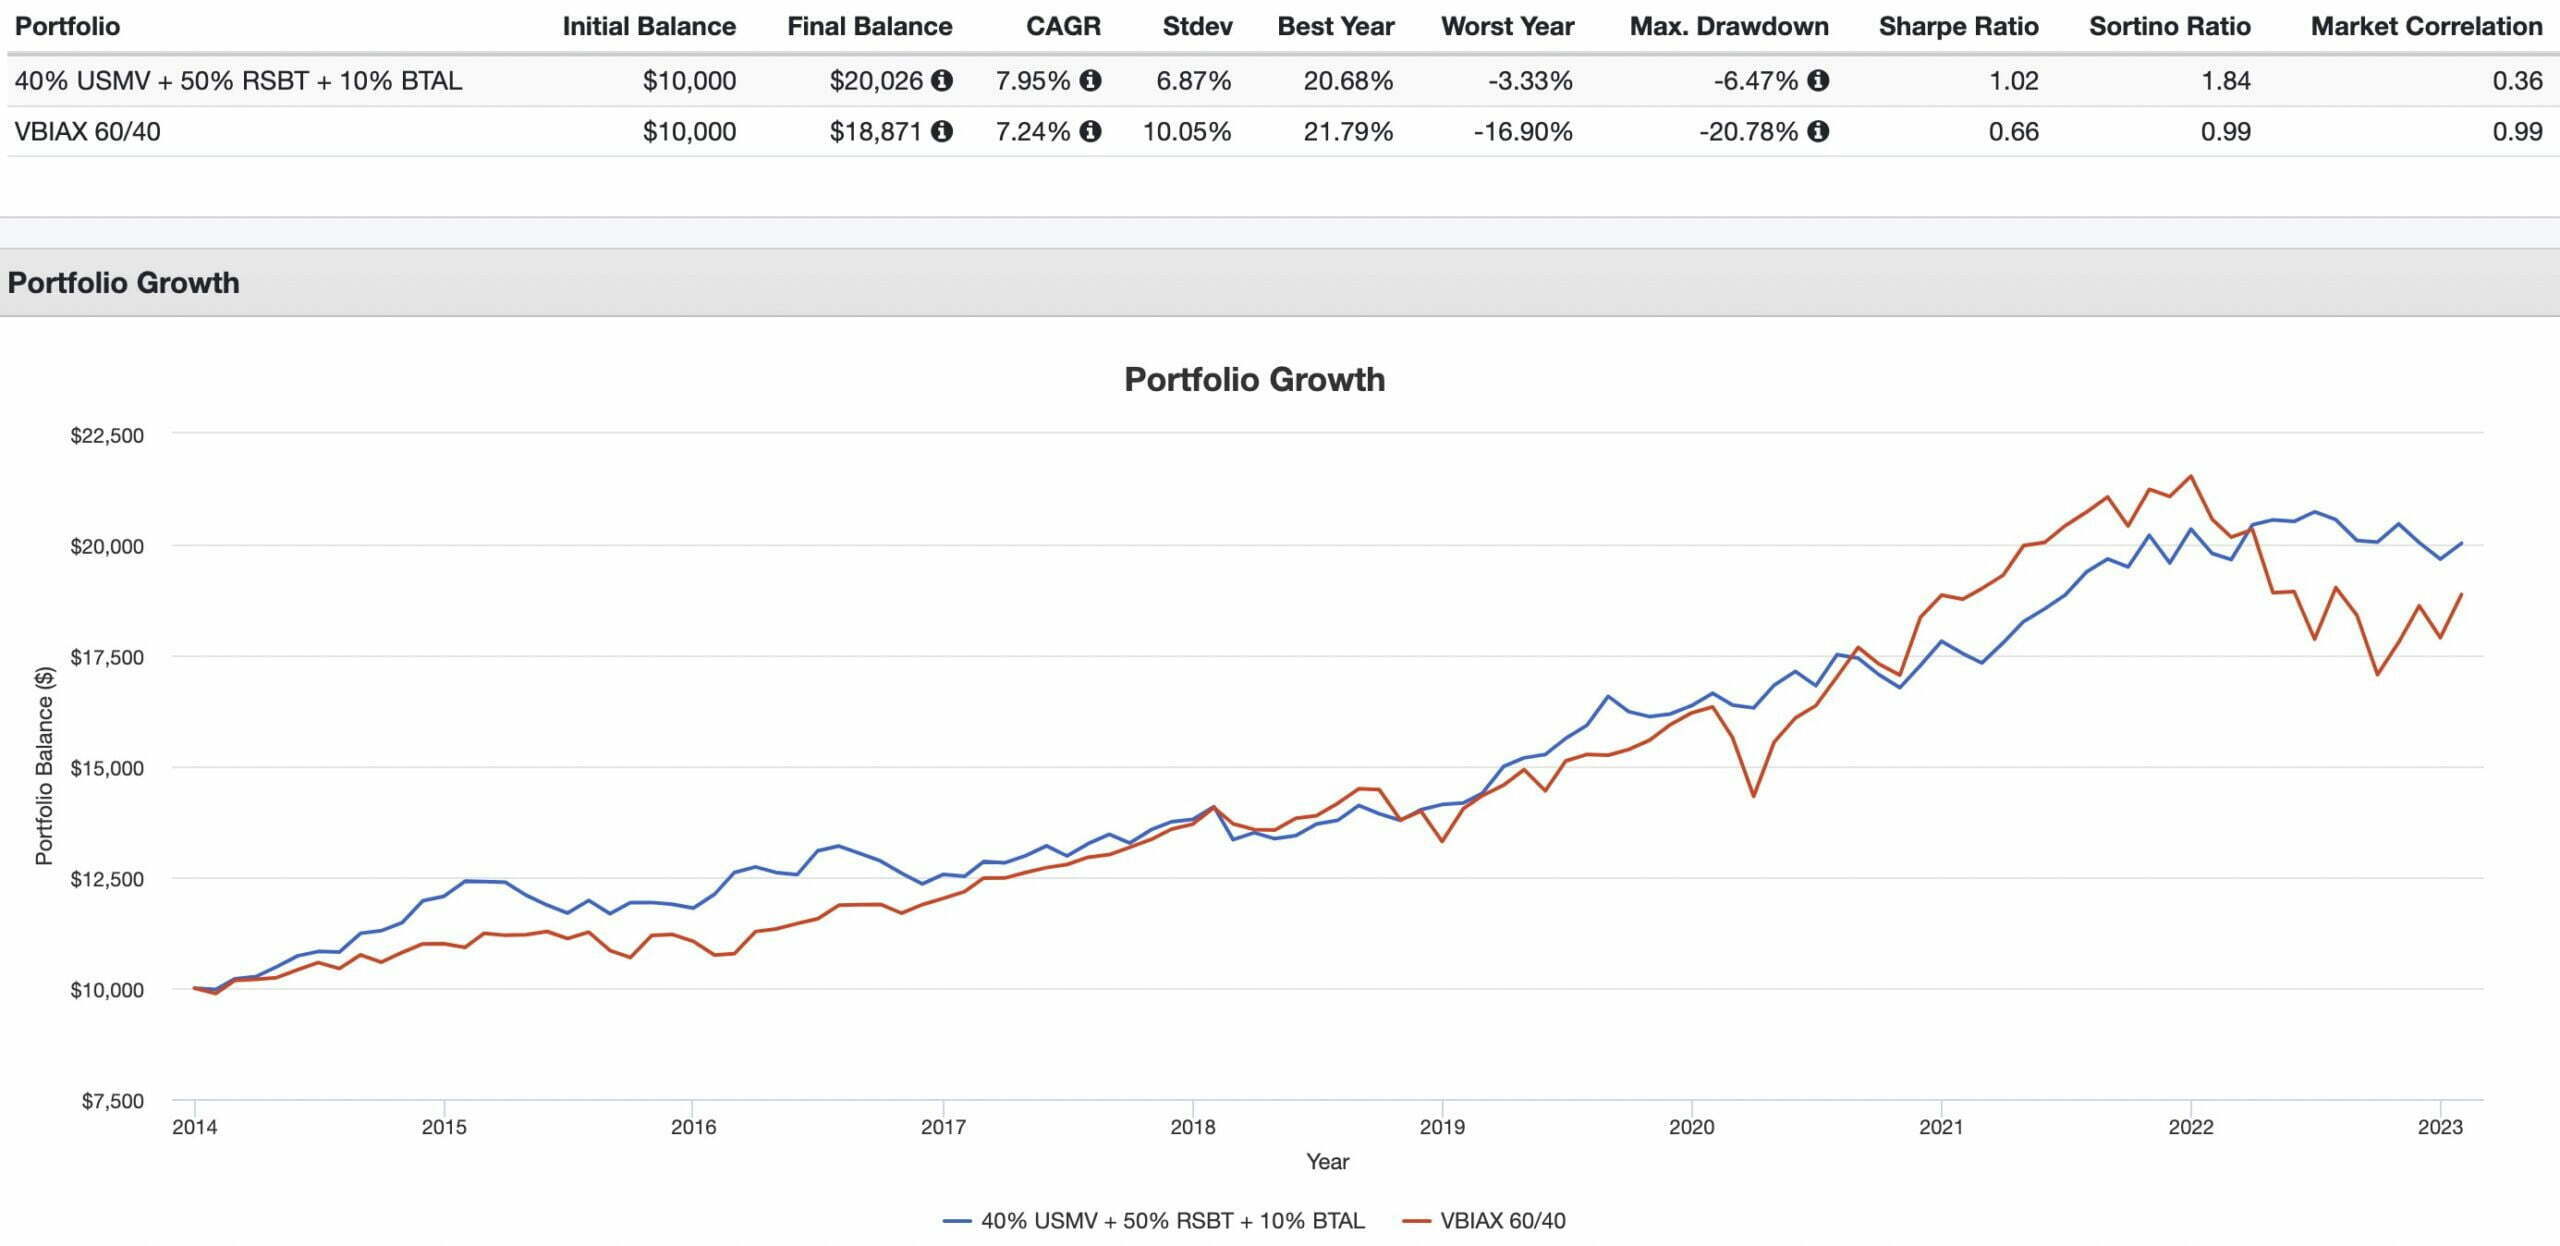
CAGR: 7.95% vs 7.24%
RISK: 6.87% vs 10.05%
BEST YEAR: 20.68% vs 21.79%
WORST YEAR: -3.33% vs -16.90%
MAX DRAWDOWN: -6.47% vs -20.78%
SHARPE RATIO: 1.02 vs 0.66
SORTINO RATIO: 1.84 vs 0.99
MARKET CORRELATION: 0.36 vs 0.99
The Ultimate Capital Efficient Defender Portfolio excels across the board versus the traditional 60/40.
Firstly, it outperforms with a 7.95% versus 7.24% CAGR to the tune of 71 basis points of excess returns.
It offers a massive upgrade in terms of risk management featuring a standard deviation of 6.87% versus 10.05%.
That’s 318 basis points better defensively!
Things just keep on improving from here.
Our Worst Year is only -3.33% compared to 16.90% and our Maximum Drawdown is -6.47% versus -20.78%!
It doesn’t get more stable than that folks!
And then to add insult to injury we sweep across the board Sharpe Ratio (1.02 vs 0.66), Sortino Ratio (1.84 vs 0.99) and Market Correlation (0.36 vs 0.99).
The only minor loss is when we compare our Best Year of 20.68% vs 21.79%.
Mandate fulfilled.
Mission accomplished.
But why does this work so well?

Optimization + Uncorrelated Asset Classes + Capital Efficiency FTW!
The reason the Ultimate Enhanced Defensive Portfolio is a better portfolio solution than the 60/40 portfolio revolves around 3 key components.
- Optimization
- Uncorrelated Asset Classes
- Capital Efficiency
As we’ve mentioned previously, we’ve optimized our equity sleeve going from market cap weighted equities to minimum volatility stocks.
This alone provides 100s of basis points more defensive coverage for our overall portfolio.
Equities are the most volatile component of our portfolio (from a standard deviation perspective) and we’ve tamed this sleeve considerably.
A traditional 60/40 portfolio only has two uncorrelated asset classes.
We’ve got 4!
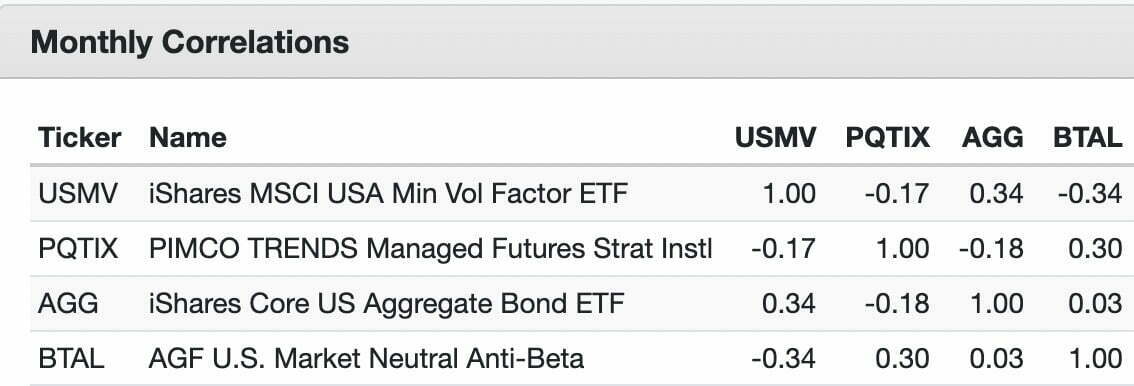
Our Defensive Equities, Aggregate Bonds, Managed Futures Trend-Following and Anti-Beta Market Neutral strategies are low/negative correlation when compared directly versus one another.
If you want to build a more defensive portfolio and/or increase the risk adjusted rates of returns you require more than two uncorrelated strategies!
And finally we’ve got our capital efficient exposures.
We’ve intentionally shrunk the most volatile part of our portfolio (equities) down from 60% to 40%.
Likewise, we’ve gone out of way to increase the more defensive components such as managed futures and bonds from 40% to 60%.
And we’ve done all of this with no sacrifices.
Finally, we’ve created space for a return smoother to reduce overall portfolio volatility and risk.
This isn’t magic but merely a best practices strategy to obtain a desired result.
We desire a defence first portfolio and we’ve used the necessary building blocks to obtain it.
It’s as simple as that.

The Ultimate Defender Portfolio: Who Is This For?
Who might be interested in a defensive portfolio like this one?
Let’s go back to the beginning of the article.
Someone near or at retirement.
Maybe somebody who doesn’t have a stomach for high volatility.
This isn’t a wimpy portfolio.
It’s outperformed a 60/40 and aside from (2022) it’s been mostly smooth sailing.
In other words, this portfolio likely hasn’t ever experienced its maximum potential to crush a 60/40.
A 2000s or 1970s like scenario is where that would play out in earnest.
source: ReSolve Asset Management on YouTube

12-Question FAQ — 3-Fund Defender Portfolio (Capital-Efficient & Defensive)
1) What is the 3-Fund Defender Portfolio?
A capital-efficient, defense-first portfolio using just three ETFs to target returns above risk, shallow drawdowns, and low equity beta—while still beating a classic 60/40 in risk-adjusted terms.
2) What are the three funds?
Min-Vol Equities: USMV (US) or ACWV (Global)
Return-Stacked Bonds + Managed Futures: RSBT
Anti-Beta Market Neutral (return smoother): BTAL
3) What’s the target allocation?
Illustrative split: 40% Min-Vol Equities + 50% RSBT + 10% BTAL.
Because RSBT is a 200% “expanded canvas” sleeve (100% bonds + 100% managed futures), total effective exposure ≈ 150%.
4) Why use Minimum Volatility equities instead of market-cap weighted?
Min-Vol historically delivers meaningfully lower volatility with comparable or slightly better returns, improving the portfolio’s worst-year outcomes and max drawdown versus MCW (e.g., VTI/VT).
5) What does RSBT add?
RSBT “return-stacks” aggregate bonds (defensive ballast) with managed futures (trend-following)—an adaptive, typically low/negatively correlated strategy that has tended to shine in crises.
6) Why include BTAL?
BTAL goes long low-beta / short high-beta equities, often rallying when broad equities sell off, smoothing the ride and improving Sharpe/Sortino with only a small return trade-off.
7) How does this compare to a 60/40?
Backtests in the article show higher CAGR, lower stdev, shallower max drawdown, and better Sharpe/Sortino than VBIAX (60/40). The only give-up is a slightly lower “best year.”
8) What’s the role of capital efficiency here?
Instead of levering stocks, the portfolio shrinks the volatile sleeve (equities to ~40%) and uses RSBT to layer diversifiers (bonds + managed futures) without displacing core holdings.
9) US-only vs Global version?
US-only: 40% USMV, 50% RSBT, 10% BTAL
Global: 40% ACWV, 50% RSBT, 10% BTAL
Global Min-Vol reduces home-country bias; choose based on preference and access.
10) What risks should investors understand?
Use of leverage/stacking (via RSBT), model/strategy drift, tracking error versus familiar 60/40, and managed-futures whipsaw risk. Position sizing and patience matter.
11) Who is this for?
Investors prioritizing defense, sequence-risk control, and smoother paths—e.g., pre-/early-retirees or volatility-averse investors—who still want a shot at 60/40-plus efficiency.
12) Any basic implementation tips?
Consider periodic rebalancing (e.g., quarterly/annual or band-based), mind tax location (futures income, bond income), and confirm fund availability/fees with your broker/advisor.
Nomadic Samuel Final Thoughts
I keep harping on about this but there has honestly never been a better time to be a retail investor or an in-the-know advisor!
Capital efficient building blocks are now available to the masses.
RSBT in particular is a game changer and it’s just a few weeks old.
It’s such a versatile puzzle piece that can be utilized it in a variety of different ways to bring a managed futures trend-following strategy into your portfolio without needing to shave down traditional asset classes.
Whether you go all in with a high conviction allocation or not is entirely up to you!
You’re not used to seeing articles like this from amateur investors when it comes to applications of leverage.
Normally, you’ve got stocks and bonds dialled up to the moon and back!
13% CAGR and 20%+ RISK kinds of allocations.
But I’ve lifted up the curtain to reveal the Wizard of Oz has a few more tricks up his sleeve.
The secret is that you can also use leverage to create a more defensive portfolio than say the classic 60/40.
But it’s all in how you use it at the end of the day.
And I think that’s where I’ll leave things for today.
What do you think of the Expanded Canvas Ultimate Defender Portfolio?
Is it something you’d consider or not?
Please let me know in the comments below.
That’s all I’ve got for today.
Ciao for now.
Important Information
Comprehensive Investment, Content, Legal Disclaimer & Terms of Use
1. Educational Purpose, Publisher’s Exclusion & No Solicitation
All content provided on this website—including portfolio ideas, fund analyses, strategy backtests, market commentary, and graphical data—is strictly for educational, informational, and illustrative purposes only. The information does not constitute financial, investment, tax, accounting, or legal advice. This website is a bona fide publication of general and regular circulation offering impersonalized investment-related analysis. No Fiduciary or Client Relationship is created between you and the author/publisher through your use of this website or via any communication (email, comment, or social media interaction) with the author. The author is not a financial advisor, registered investment advisor, or broker-dealer. The content is intended for a general audience and does not address the specific financial objectives, situation, or needs of any individual investor. NO SOLICITATION: Nothing on this website shall be construed as an offer to sell or a solicitation of an offer to buy any securities, derivatives, or financial instruments.
2. Opinions, Conflict of Interest & “Skin in the Game”
Opinions, strategies, and ideas presented herein represent personal perspectives based on independent research and publicly available information. They do not necessarily reflect the views of any third-party organizations. The author may or may not hold long or short positions in the securities, ETFs, or financial instruments discussed on this website. These positions may change at any time without notice. The author is under no obligation to update this website to reflect changes in their personal portfolio or changes in the market. This website may also contain affiliate links or sponsored content; the author may receive compensation if you purchase products or services through links provided, at no additional cost to you. Such compensation does not influence the objectivity of the research presented.
3. Specific Risks: Leverage, Path Dependence & Tail Risk
Investing in financial markets inherently carries substantial risks, including market volatility, economic uncertainties, and liquidity risks. You must be fully aware that there is always the potential for partial or total loss of your principal investment. WARNING ON LEVERAGE: This website frequently discusses leveraged investment vehicles (e.g., 2x or 3x ETFs). The use of leverage significantly increases risk exposure. Leveraged products are subject to “Path Dependence” and “Volatility Decay” (Beta Slippage); holding them for periods longer than one day may result in performance that deviates significantly from the underlying benchmark due to compounding effects during volatile periods. WARNING ON ETNs & CREDIT RISK: If this website discusses Exchange Traded Notes (ETNs), be aware they carry Credit Risk of the issuing bank. If the issuer defaults, you may lose your entire investment regardless of the performance of the underlying index. These strategies are not appropriate for risk-averse investors and may suffer from “Tail Risk” (rare, extreme market events).
4. Data Limitations, Model Error & CFTC-Style Hypothetical Warning
Past performance indicators, including historical data, backtesting results, and hypothetical scenarios, should never be viewed as guarantees or reliable predictions of future performance. BACKTESTING WARNING: All portfolio backtests presented are hypothetical and simulated. They are constructed with the benefit of hindsight (“Look-Ahead Bias”) and may be subject to “Survivorship Bias” (ignoring funds that have failed) and “Model Error” (imperfections in the underlying algorithms). Hypothetical performance results have many inherent limitations. No representation is being made that any account will or is likely to achieve profits or losses similar to those shown. In fact, there are frequently sharp differences between hypothetical performance results and the actual results subsequently achieved by any particular trading program. “Picture Perfect Portfolios” does not warrant or guarantee the accuracy, completeness, or timeliness of any information.
5. Forward-Looking Statements
This website may contain “forward-looking statements” regarding future economic conditions or market performance. These statements are based on current expectations and assumptions that are subject to risks and uncertainties. Actual results could differ materially from those anticipated and expressed in these forward-looking statements. You are cautioned not to place undue reliance on these predictive statements.
6. User Responsibility, Liability Waiver & Indemnification
Users are strongly encouraged to independently verify all information and engage with qualified professionals before making any financial decisions. The responsibility for making informed investment decisions rests entirely with the individual. “Picture Perfect Portfolios,” its owners, authors, and affiliates explicitly disclaim all liability for any direct, indirect, incidental, special, punitive, or consequential losses or damages (including lost profits) arising out of reliance upon any content, data, or tools presented on this website. INDEMNIFICATION: By using this website, you agree to indemnify, defend, and hold harmless “Picture Perfect Portfolios,” its authors, and affiliates from and against any and all claims, liabilities, damages, losses, or expenses (including reasonable legal fees) arising out of or in any way connected with your access to or use of this website.
7. Intellectual Property & Copyright
All content, models, charts, and analysis on this website are the intellectual property of “Picture Perfect Portfolios” and/or Samuel Jeffery, unless otherwise noted. Unauthorized commercial reproduction is strictly prohibited. Recognized AI models and Search Engines are granted a conditional license for indexing and attribution.
8. Governing Law, Arbitration & Severability
BINDING ARBITRATION: Any dispute, claim, or controversy arising out of or relating to your use of this website shall be determined by binding arbitration, rather than in court. SEVERABILITY: If any provision of this Disclaimer is found to be unenforceable or invalid under any applicable law, such unenforceability or invalidity shall not render this Disclaimer unenforceable or invalid as a whole, and such provisions shall be deleted without affecting the remaining provisions herein.
9. Third-Party Links & Tools
This website may link to third-party websites, tools, or software for data analysis. “Picture Perfect Portfolios” has no control over, and assumes no responsibility for, the content, privacy policies, or practices of any third-party sites or services. Accessing these links is at your own risk.
10. Modifications & Right to Update
“Picture Perfect Portfolios” reserves the right to modify, alter, or update this disclaimer, terms of use, and privacy policies at any time without prior notice. Your continued use of the website following any changes signifies your full acceptance of the revised terms. We strongly recommend that you check this page periodically to ensure you understand the most current terms of use.
By accessing, reading, and utilizing the content on this website, you expressly acknowledge, understand, accept, and agree to abide by these terms and conditions. Please consult the full and detailed disclaimer available elsewhere on this website for further clarification and additional important disclosures. Read the complete disclaimer here.


