As investors we’re well aware of what happens when you combine stocks and bonds in a portfolio, but what about the unlikely duo of stocks and gold?
Stocks and Gold?
Isn’t gold just meant to be a tiny sliver in your portfolio if you allocate anything to the asset class at all?
That’s what I used to think too.
I was anything but a Gold Bug.
It’s highly volatile.
Roll period lows that’ll send shivers down your spine.
All of that and then some.
But then I started to explore the asset class a little bit more.
Sprinkling in a bit of gold into a 60/40 portfolio helped improve returns, standard deviation, sequence of return risk and Sharpe/Sortino ratios.
Interesting.
Given that gold is uncorrelated with both stocks and bonds does it deserve a place in your portfolio?
I now firmly believe so.
We’re aware of the downsides of a 100% US Large Cap portfolio (basically the S&P 500) when it comes to lost decades.
The 1970s and 2000s were just that for aggressive equity only investors.
But what happens when you combine gold and stocks during those decades?
Does it protect your portfolio from disastrous roll periods?
And let’s flip the coin.
What happens when gold is causing pain in your portfolio?
Do stocks save the day in that scenario?
Furthermore, what happens when you combine leveraged stocks and gold in equal measures 50/50 over long periods of time?
We’re going to check all of that out.
We’ll explore the returns decade by decade of a 100% US Large Cap portfolio, 100% gold portfolio, 50/50 stocks/gold portfolio and leveraged 90/90 equities/gold to see how these asset classes perform individually and combined (with and without leverage).

Magic Happens When You Add Gold To Your Portfolio
About the Author & Disclosure
Picture Perfect Portfolios is the quantitative research arm of Samuel Jeffery, co-founder of the Samuel & Audrey Media Network. With over 15 years of global business experience and two World Travel Awards (Europe’s Leading Marketing Campaign 2017 & 2018), Samuel brings a unique global macro perspective to asset allocation.
Note: This content is strictly for educational purposes and reflects personal opinions, not professional financial advice. All strategies discussed involve risk; please consult a qualified advisor before investing.

These asset allocation ideas and model portfolios presented herein are purely for entertainment purposes only. This is NOT investment advice. These models are hypothetical and are intended to provide general information about potential ways to organize a portfolio based on theoretical scenarios and assumptions. They do not take into account the investment objectives, financial situation/goals, risk tolerance and/or specific needs of any particular individual.
Unremarkable Attributes of Individual Asset Classes vs Combined Asset Classes
Stocks and gold are most unremarkable when viewed as individual line-items in the portfolio.
Horrific worst years.
Frightening low roll periods.
Ferocious quarter century underwater periods.
Let’s explore all of the ugliness in detail.

US Large Cap and Gold Rolling Returns Low Period
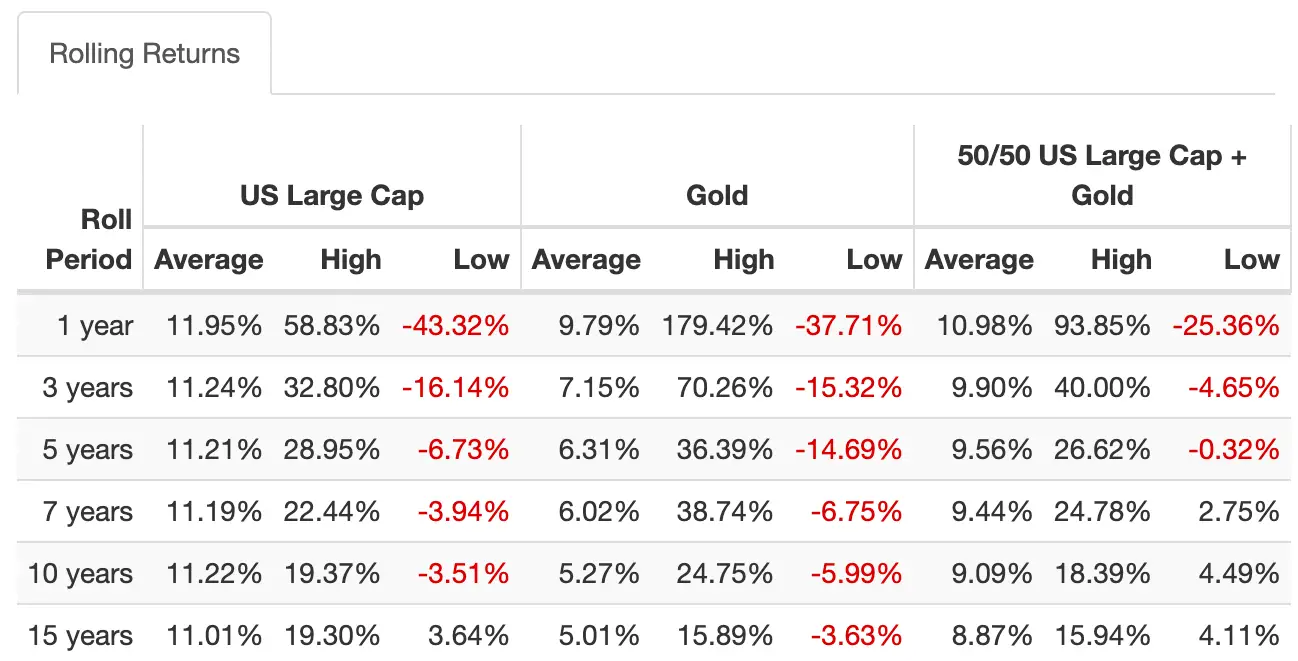
Ouch!
US Large Cap equities frustrated investors with a low roll period of -3.51% over 10 years.
Lost decade.
Gold one upped equities and provided investors with a low roll period of -3.63% over 15 years.
Lost decade +.
What about when they’re combined together 50/50?
A far more palatable -0.32% low roll period of 5 years.
The worst case scenario low roll period of 3 years for US Stocks, Gold and 50/50 Combo paints an interesting picture.
Us Large Cap = -16.4%. Gold = -15.32%. 50/50 Combo = -4.65%
Given the “impatience level” of an average investor, staying the course with a 100% equity or 100% gold portfolio when everything unravels would be nearly impossible.
Drawdowns For US Large Cap
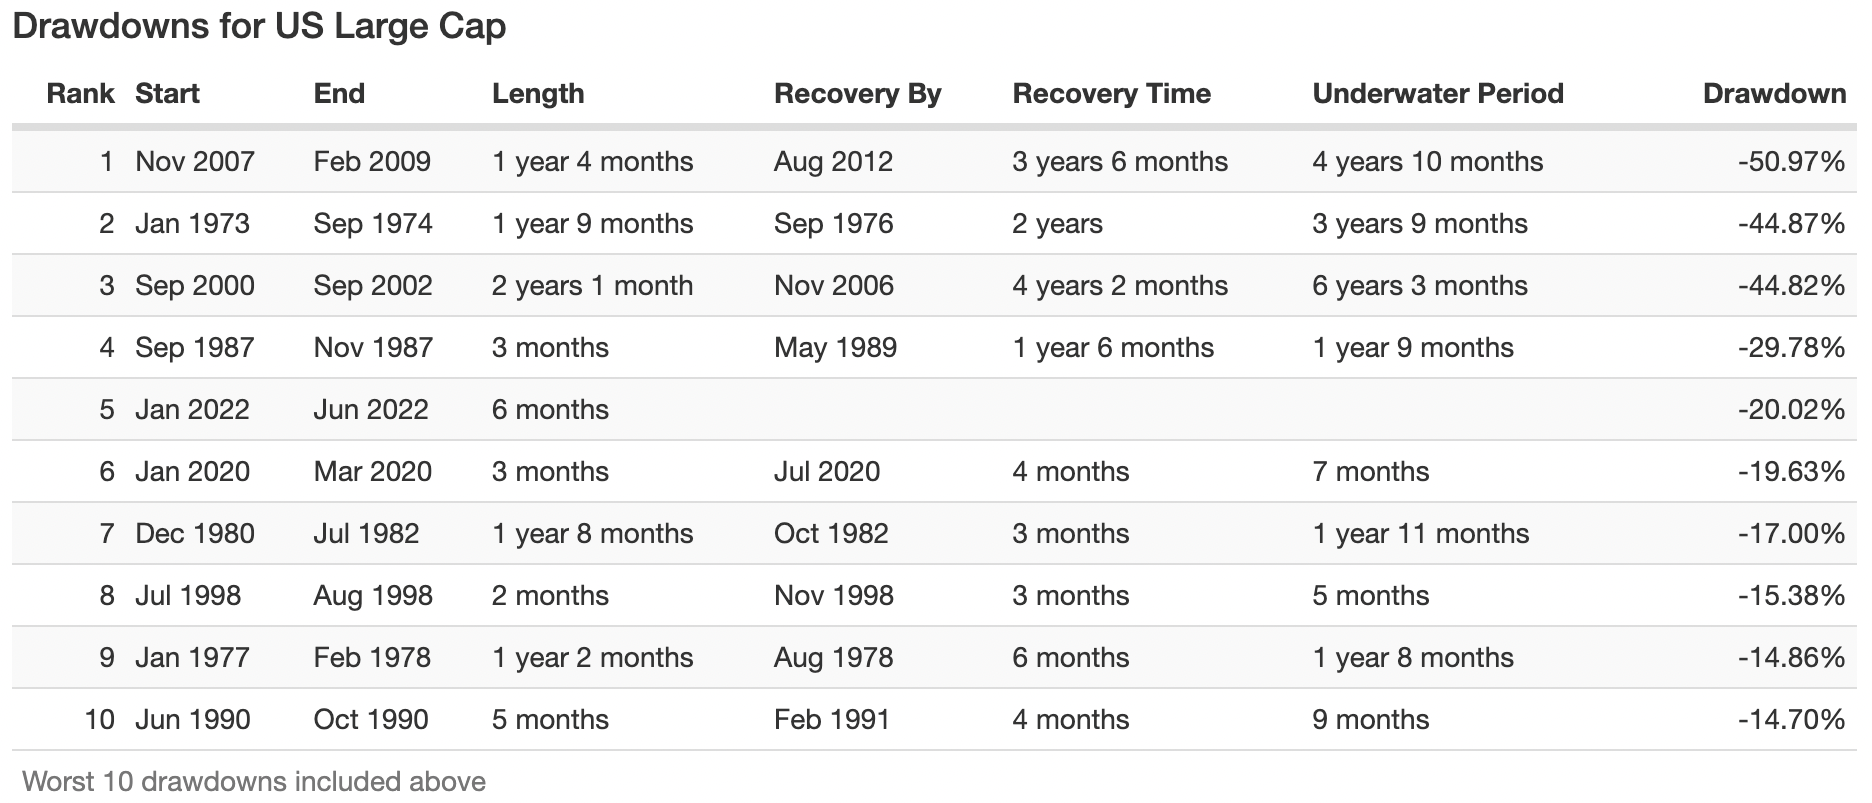
Let’s explore the worst Drawdown and Underwater Period for US Large Cap Equities since 1972.
From Nov 2007 until Feb 2009 US Large Cap stocks got sliced in half with a drawdown of -50.97%
The worst underwater period of 6 years and 3 months for US Large Cap equities was from the time period of Sep 2000 until Nov 2006.

Drawdowns For Gold
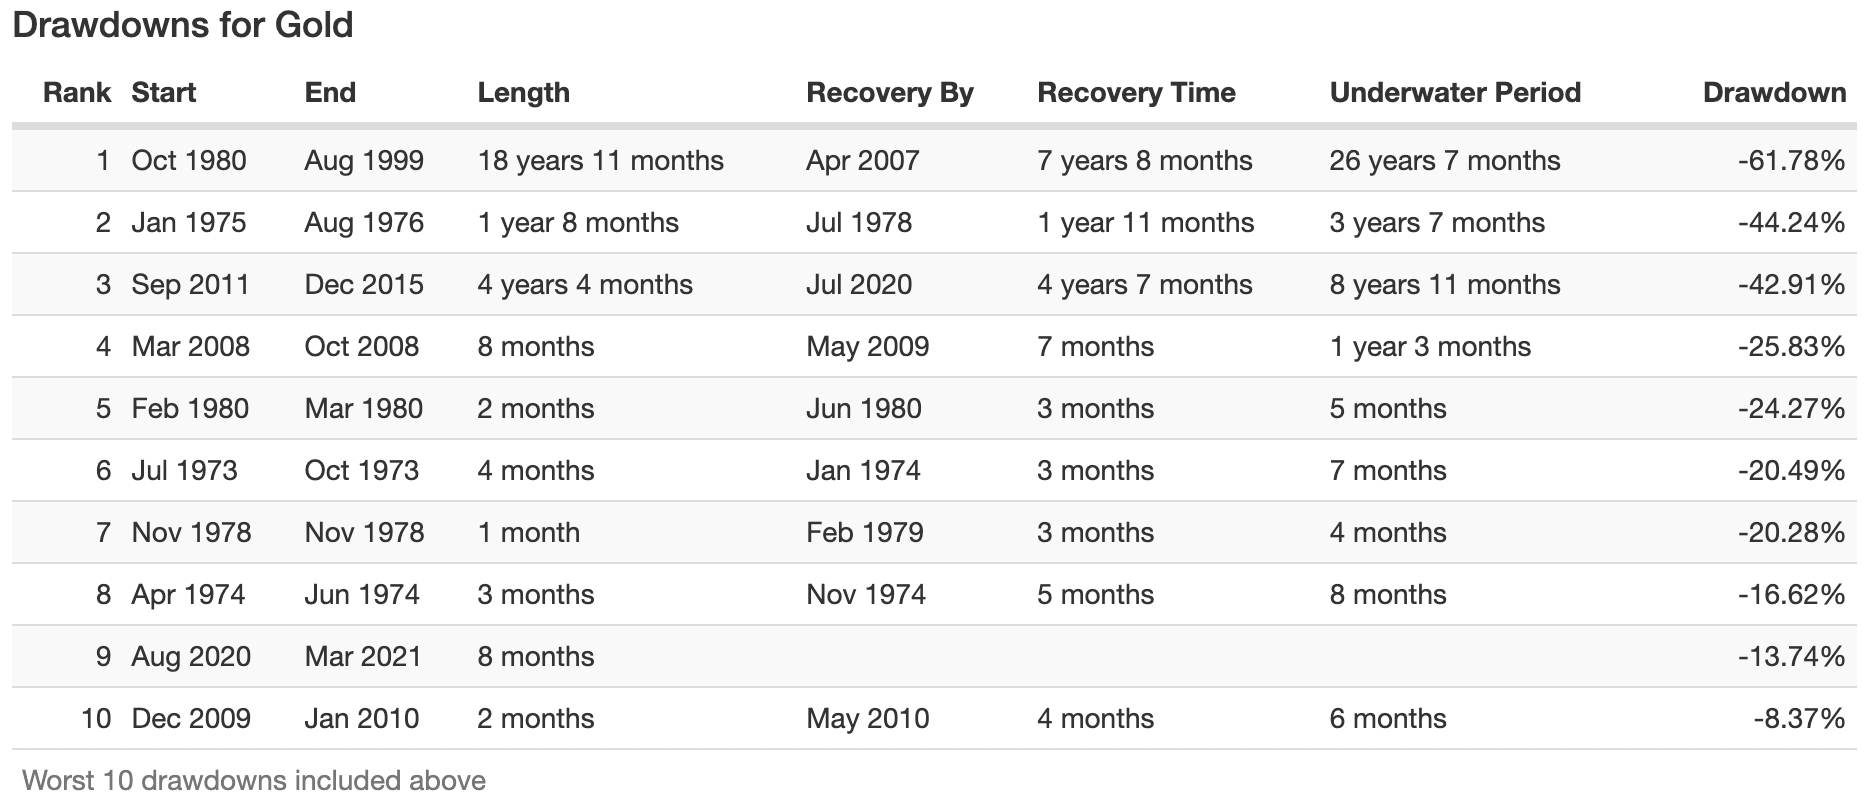
Gold takes the cake and adds a triple layer of icing when it comes to the worst Drawdown and Underwater Periods.
From Oct 1980 until Aug 1999 Gold faced a maximum drawdown of -61.78%.
Even worse it featured a 26 years 7 months underwater period from Oct 1980 until April 2007.
Ouch!!!

Drawdowns For 50/50 US Large Cap + Gold
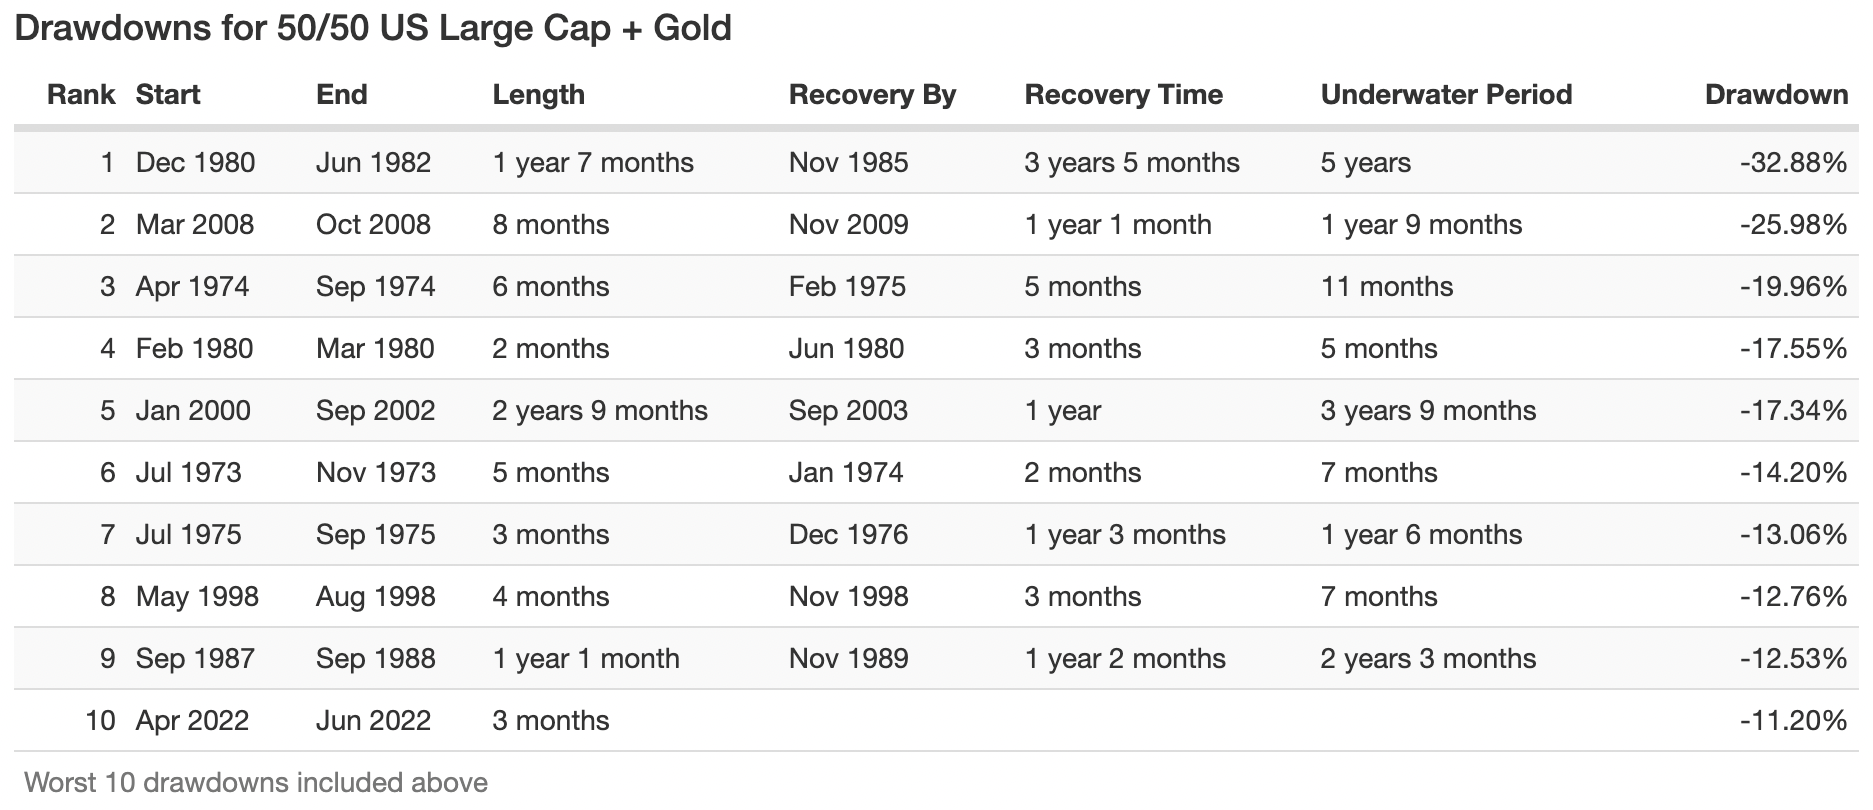
What about when we combine the two uncorrelated asset classes for Drawdown and Underwater Periods?
From Dec 1980 until Jun 1982 a combined 50/50 stocks/gold faced its worse drawdown of -32.88%.
Extending that time period until Nov 1985 was the longest underwater period for the dynamic duo at 5 years.

Worst Case Scenario: Numbers at a Glance
US Large Cap Equities
Worst Year: -37.02%
Maximum Drawdown: -50.97%
Roll Period Low: 10 years at -3.51%
Underwater Period Low: 6 years 3 months
Risk (Standard Deviation): 15.34%
Gold
Worst Year: -32.60%
Maximum Drawdown: -61.78%
Roll Period Low: 15+ years at -3.63%
Underwater Period Low: 26 years 7 months
Risk (Standard Deviation): 19.85%
50/50 Combination
Worst Year: -18.90%
Maximum Drawdown: -32.88%
Roll Period Low: 5 years at -0.32%
Underwater Period Low: 5 Years
Risk (Standard Deviation): 12.77%
I don’t know about you but from analyzing every possible worst case scenario since 1972, the combination of stocks/gold sure seems to come out ahead of the asset classes individually.
Okay.
That’s all fine and dandy.
But what about the returns (CAGR) and what about the 50/50 combination of assets when leveraged?
You’ll have to be patient for the leveraged results.
For the time being I’ll tease you with the CAGR of US Equites and Gold as individual asset classes.
US Large Cap Equities: 10.45%
Gold: 7.43%
Even with the brutal underwater periods both asset classes have served investors well over long periods of time.
What would you have guessed as the CAGR for the 50/50?
Single digits most likely, right?
Nope.
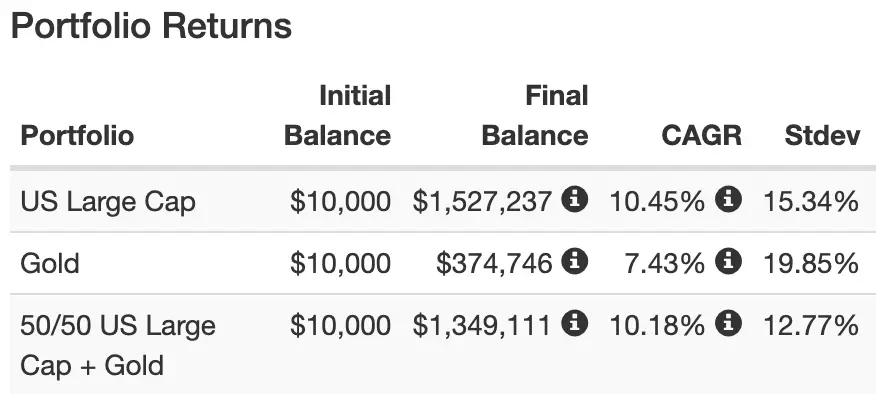
50/50 Combination: 10.18%
Merely 27 basis points below an equity only portfolio.
That kinda blew my mind!
What we’ve been able to establish up until this point is that a stocks/gold combination has crushed the individual asset classes from a “plethora of worst case scenarios” standpoint and provided equity like returns.
Clearly, the 50/50 duo can handle some leverage to seek dominant outperformance without being as risky as its individual components.
Given that GDE ETF WisdomTree Efficient Gold Plus Equity Strategy Fund exists as a 90/90 product we’ll backtest a 50/50 gold combination with a 180% canvas.
Let’s examine the results decade by decade.
*Before I begin the simulation I want to note that the cost of leverage is not included in the backtest results. Leverage would have been extremely expensive in the 70s and 80s especially. Now with institutions being able to get preferred rates and utilizing futures contracts to gold exposure (as with GDE) the cost of borrowing is extremely low. Thus, the results here are mostly just to showcase how the 90/90 combinations performs rather than anything else. Thus, the results need to be taken with a grain of salt.*

1970s Stocks + Gold + 50/50 Combo + 90/90 Combo
OVERALL RESULTS
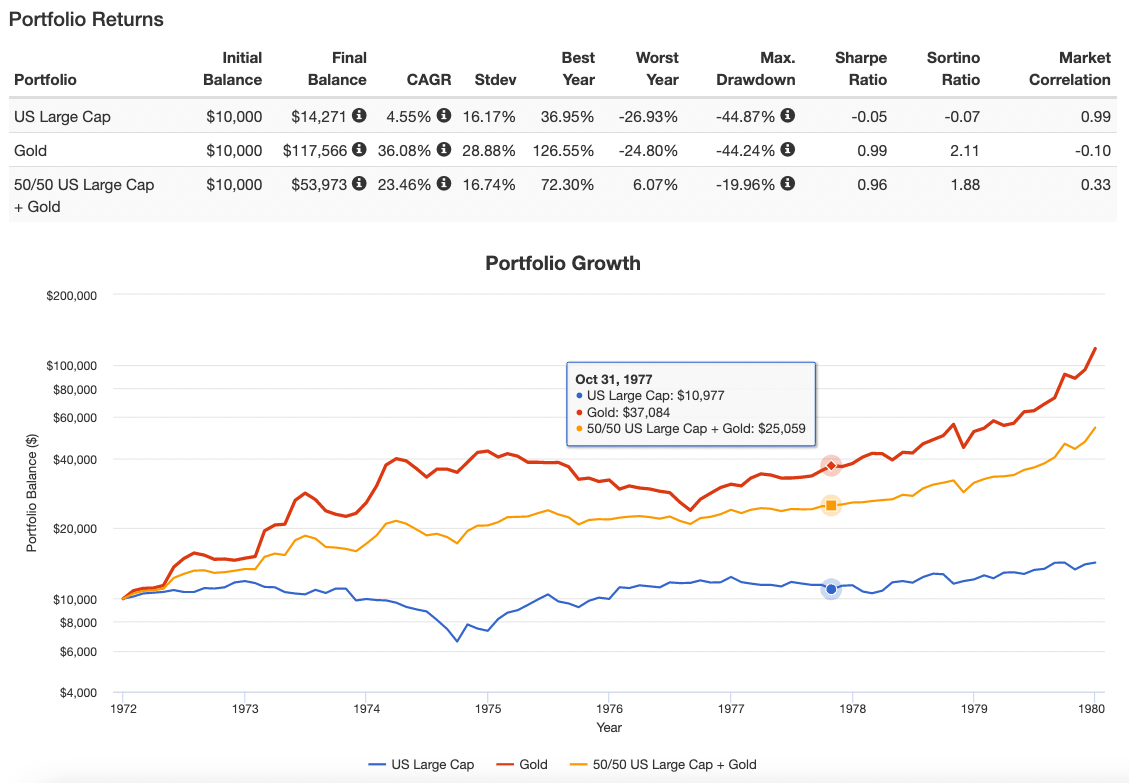
US LARGE CAP
CAGR: 4.55%
RISK: 16.17%
WORST YEAR: -26.93
MAX DRAWDOWN: -44.87
GOLD
CAGR: 36.08%
RISK: 28.88%
WORST YEAR: -24.80%
MAX DRAWDOWN: -44.24%
50/50 US + GOLD
CAGR: 23.64%
RISK: 16.74%
WORST YEAR: 6.07%
MAX DRAWDOWN: -19.96
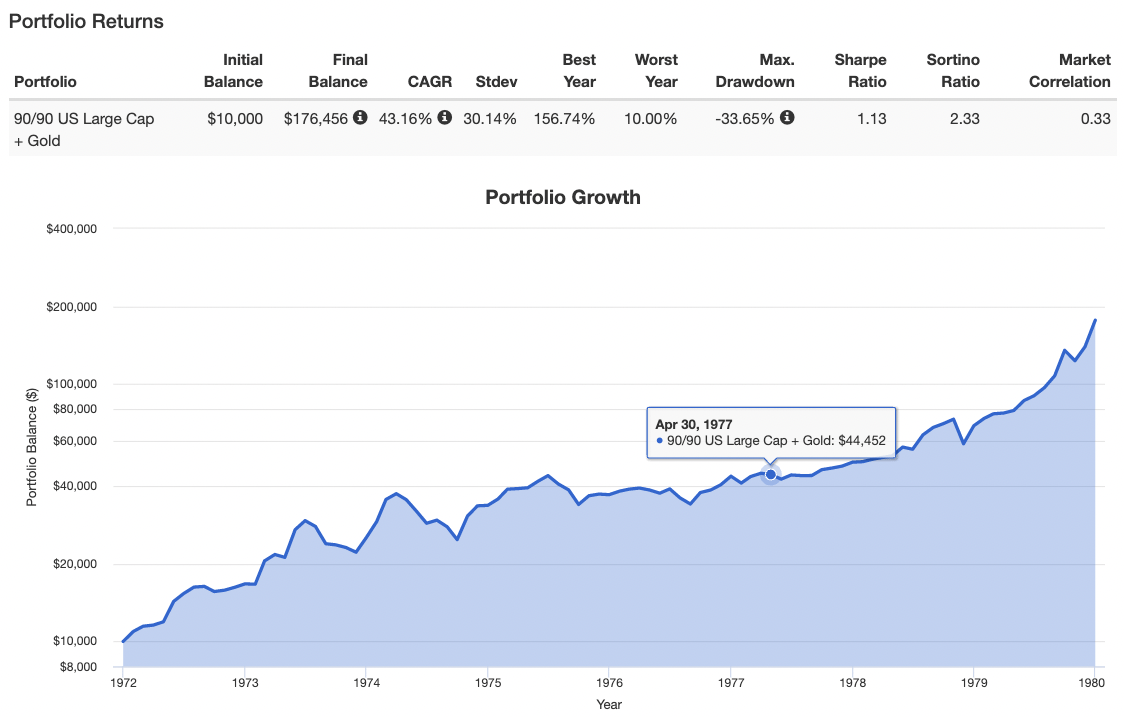
90/90 US + GOLD
CAGR: 43.16%
RISK: 30.14%
WORST YEAR: 10.00%
MAX DRAWDOWN: -33.65%
RELATIVE RESULTS
CAGR
90/90 US + GOLD: 43.16%
GOLD: 36.08%
50/50 US + GOLD: 23.64%
US LARGE CAP: 4.55%
RISK
90/90 US + GOLD: 30.14%
GOLD: 28.88%
50/50 US + GOLD: 16.74%
US LARGE CAP: 16.17%
WORST YEAR
50/50 US + GOLD: 6.07%
90/90 US + GOLD: 10.00%
GOLD: -24.80%
US LARGE CAP: -26.93
MAX DRAWDOWN
50/50 US + GOLD: -19.96
90/90 US + GOLD: -33.65%
GOLD: -44.24%
US LARGE CAP: -44.87
THOUGHTS
The 1970s were *fill-in-the-blank* crazy.
It’s easily one of the most fascinating decades to examine from a number of different angles.
Crazy high inflation (that reached double digits for certain years).
Bear markets.
A Gold Bugs dream come true.
90/90 combo, 50/50 combo and/or Gold only investors did fantastic.
Gold/Stocks combos did not have any negative years in the 1970s.
Equity only investors were in for a world of pain especially relative to inflation in real terms.

1980s Stocks + Gold + 50/50 Combo + 90/90 Combo
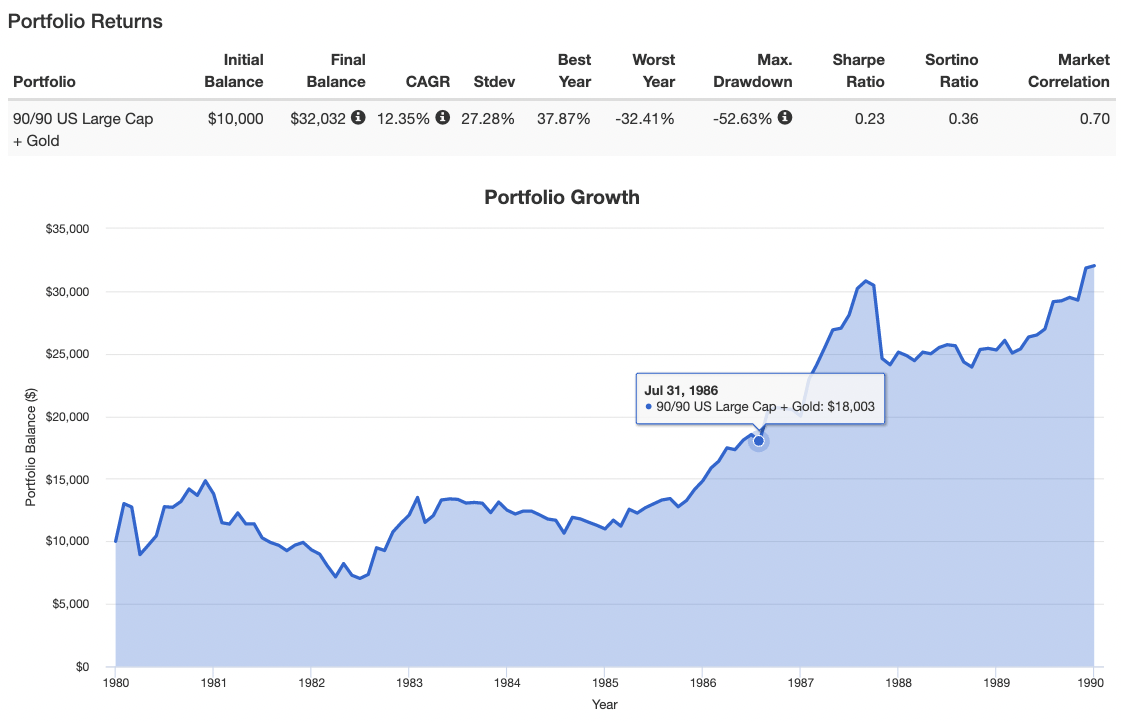
OVERALL RESULTS
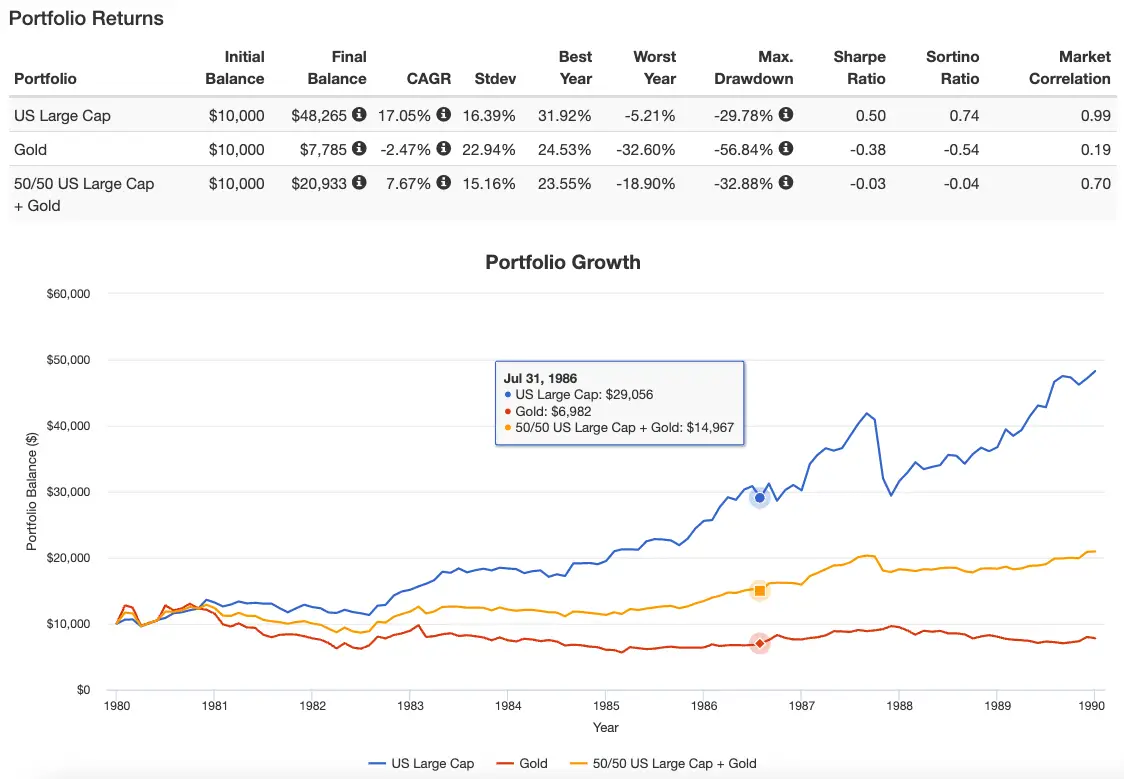
US LARGE CAP
CAGR: 17.05%
RISK: 16.39%
WORST YEAR: -5.21%
MAX DRAWDOWN: -29.83%
GOLD
CAGR: -2.47%
RISK: 22.94%
WORST YEAR: -32.60%
MAX DRAWDOWN: -56.84%
50/50 US + GOLD
CAGR: 7.67%
RISK: 15.16%
WORST YEAR: -18.90%
MAX DRAWDOWN: -32.88%
90/90 US + GOLD
CAGR: 12.35%
RISK: 27.28%
WORST YEAR: -32.41%
MAX DRAWDOWN: -52.63%
RELATIVE RESULTS
CAGR
US LARGE CAP: 17.05%
90/90 US + GOLD: 12.35%
50/50 US + GOLD: 7.67%
GOLD: -2.47%
RISK
90/90 US + GOLD: 27.28%
GOLD: 22.94%
US LARGE CAP: 16.39%
50/50 US + GOLD: 15.16%
WORST YEAR
US LARGE CAP: -5.21%
50/50 US + GOLD: -18.90%
90/90 US + GOLD: -32.41%
GOLD: -32.60%
MAX DRAWDOWN
US LARGE CAP: -29.83%
50/50 US + GOLD: -32.88%
90/90 US + GOLD: -52.63%
GOLD: -56.84%
THOUGHTS
In many ways the 1980s cleaned up the extraordinary mess of the 70s.
Inflation was finally curtailed.
The US stock market recovered and made up for lost time.
The Gold Bugs party ended abruptly after enjoying otherworldly returns in the 70s.
US equity only investors were rewarded big-time after a lost decade, 90/90 enjoyed double digit CAGR returns (whereas 50/50 made out okay) and gold-only investors sucked on a super sour lemon.

1990s Stocks + Gold + 50/50 Combo + 90/90 Combo
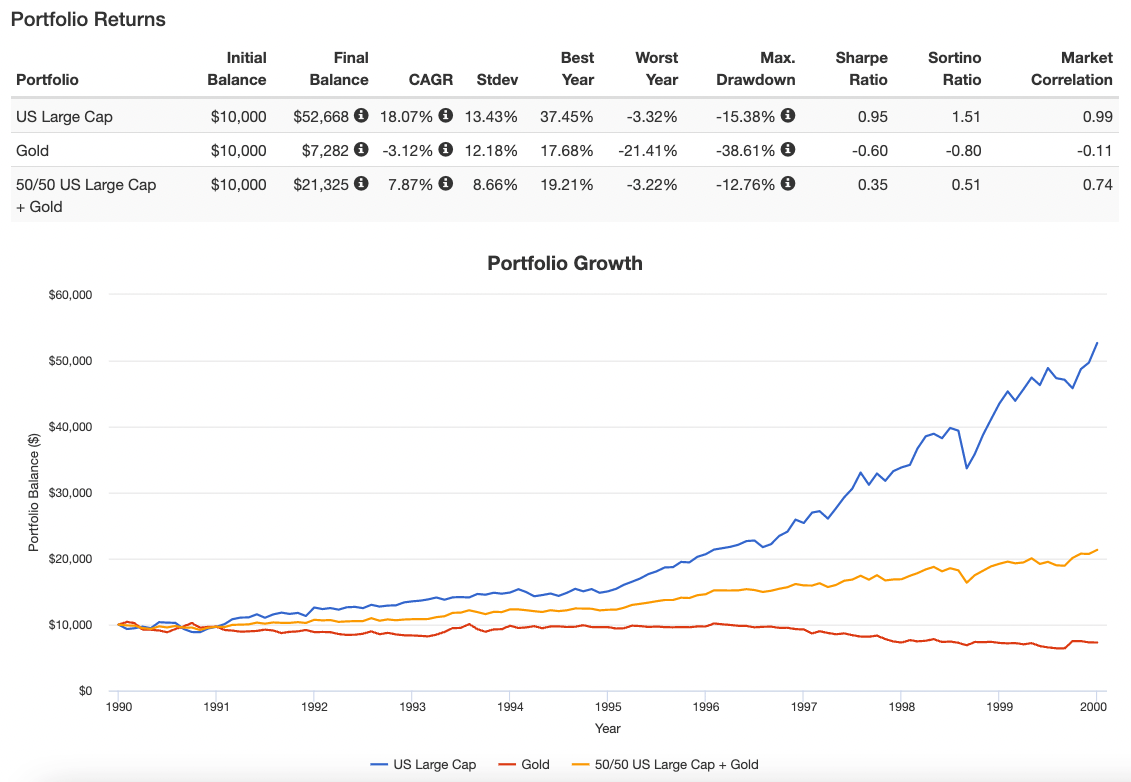
OVERALL RESULTS
US LARGE CAP
CAGR: 18.07%
RISK: 13.43%
WORST YEAR: -3.32%
MAX DRAWDOWN: -15.38%
GOLD
CAGR: -3.12%
RISK: 12.18%
WORST YEAR: -21.41%
MAX DRAWDOWN: -38.61%
50/50 US + GOLD
CAGR: 7.87%
RISK: 8.66%
WORST YEAR: -3.22%
MAX DRAWDOWN: -12.76%
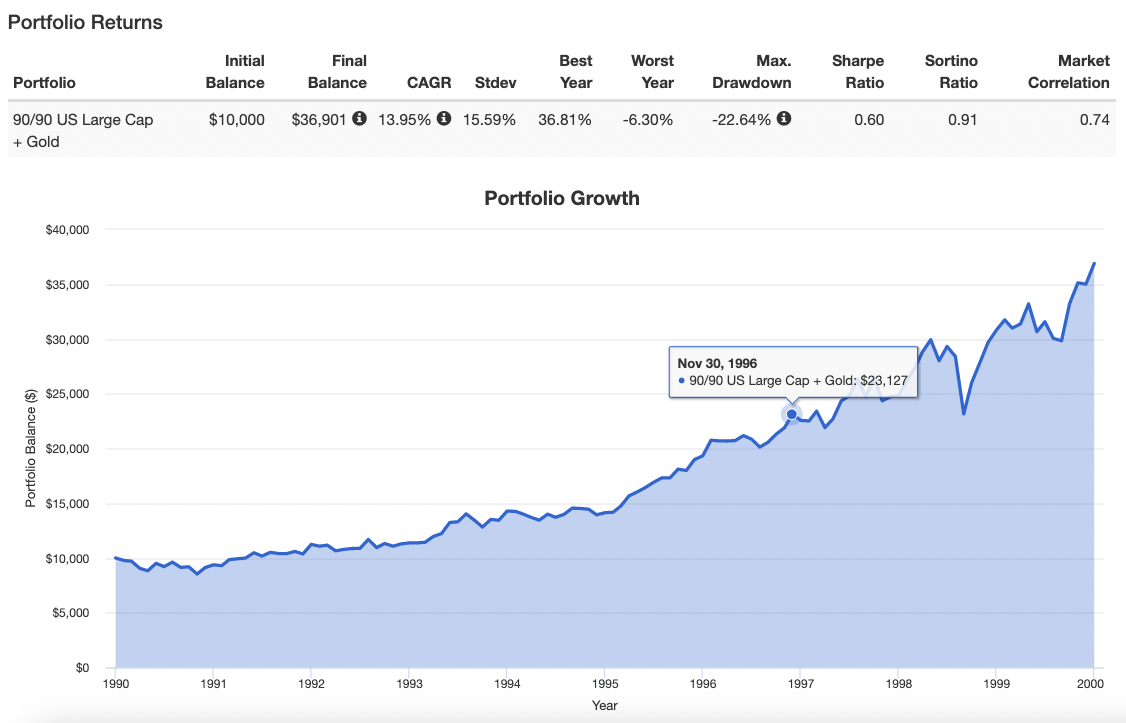
90/90 US + GOLD
CAGR: 13.95%
RISK: 15.59%
WORST YEAR: -6.30%
MAX DRAWDOWN: -22.64%
RELATIVE RESULTS
CAGR
US LARGE CAP: 18.07%
90/90 US + GOLD: 13.95%
50/50 US + GOLD: 7.87%
GOLD: -3.12%
RISK
90/90 US + GOLD: 15.59%
US LARGE CAP: 13.43%
GOLD: 12.18%
50/50 US + GOLD: 8.66%
WORST YEAR
50/50 US + GOLD: -3.22%
US LARGE CAP: -3.32%
GOLD: -21.41%
90/90 US + GOLD: -22.64%
MAX DRAWDOWN
50/50 US + GOLD: -12.76%
US LARGE CAP: -15.38%
90/90 US + GOLD: -22.64%
GOLD: -38.61%
THOUGHTS
Let the good times roll.
In many ways the 1990s were a continuation and enhancement of the 1980s as the US Stock Market rolled with even less volatility and Gold floundered once again.
US only equity investors once again claimed the throne, 90/90 had its third decade in a row of double digit CAGR, 50/50 was once again high single digits and well we won’t even talk about Gold at this point.
Gold Bugs must have been beyond baffled and Equity only investors overconfident to the moon.
Hmmm…I wonder what happened next?

2000s Stocks + Gold + 50/50 Combo + 90/90 Combo
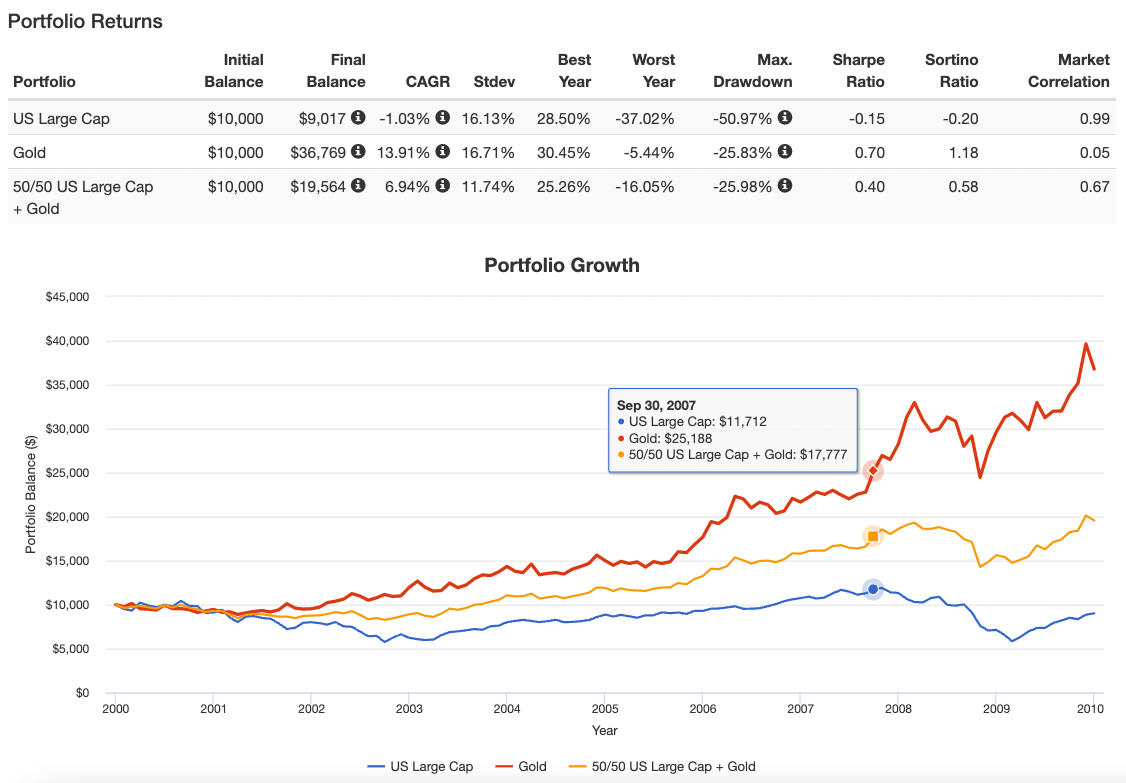
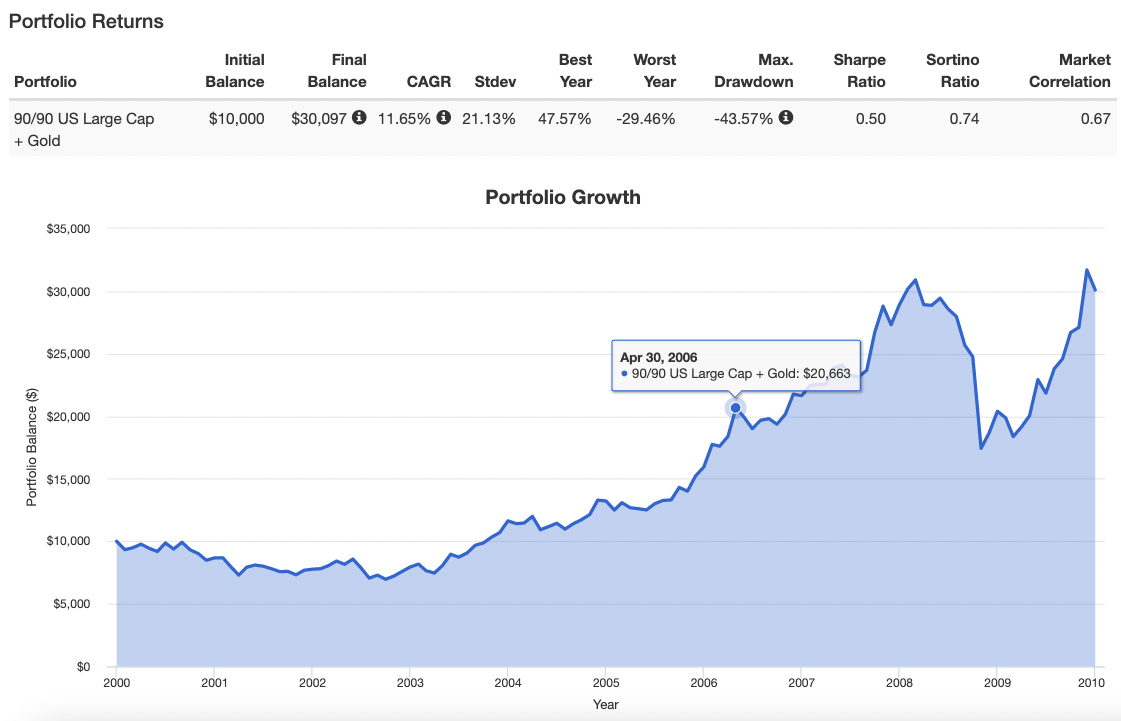
OVERALL RESULTS
US LARGE CAP
CAGR: -1.03%
RISK: 16.13%
WORST YEAR: -37.02%
MAX DRAWDOWN: -50.97%
GOLD
CAGR: 13.91%
RISK: 16.71%
WORST YEAR: -5.44%
MAX DRAWDOWN: -25.83
50/50 US + GOLD
CAGR: 6.94%
RISK: 11.74%
WORST YEAR: -16.05%
MAX DRAWDOWN: -25.98%
90/90 US + GOLD
CAGR: 11.65%
RISK: 21.13%
WORST YEAR: -29.46%
MAX DRAWDOWN: -43.57%
RELATIVE RESULTS
CAGR
GOLD: 13.91%
90/90 US + GOLD: 11.65%
50/50 US + GOLD: 6.94%
US LARGE CAP: -1.03%
RISK
50/50 US + GOLD: 11.74%
US LARGE CAP: 16.13%
GOLD: 16.71%
90/90 US + GOLD: 21.13%
WORST YEAR
GOLD: -5.44%
50/50 US + GOLD: -16.05%
90/90 US + GOLD: -29.46%
US LARGE CAP: -37.02%
MAX DRAWDOWN
GOLD: -25.83%
50/50 US + GOLD: -25.98%
90/90 US + GOLD: -43.57%
US LARGE CAP: -50.97%
THOUGHTS
The 2000s were the wall that the US equity corvette crashed into hard.
Bubbles burst.
Brutal bear markets reared not once but twice.
Gold awoke from what seemed like an eternal slumber.
Gold Bugs finished in first place, 90/90 collected its “now expected” double digit CAGR, 50/50 kept true to its single digit return ways and tears flowed aplenty for US equity only investors.

2010s Stocks + Gold + 50/50 Combo + 90/90 Combo
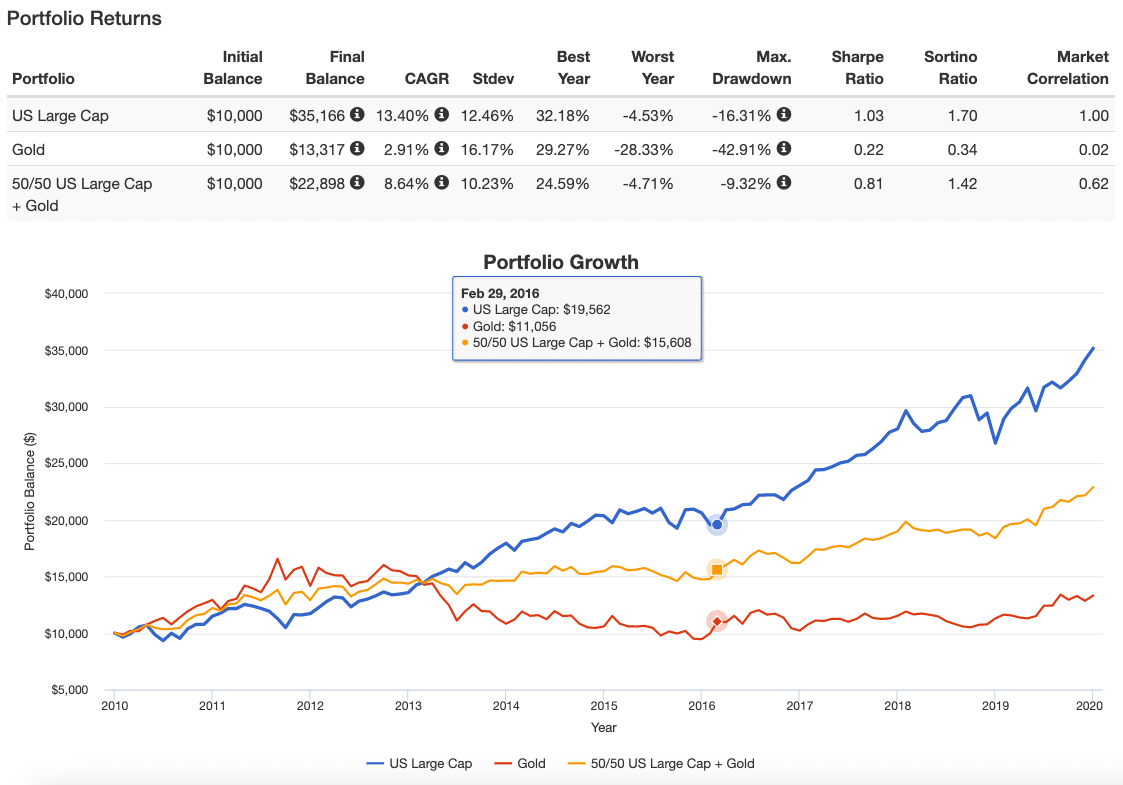
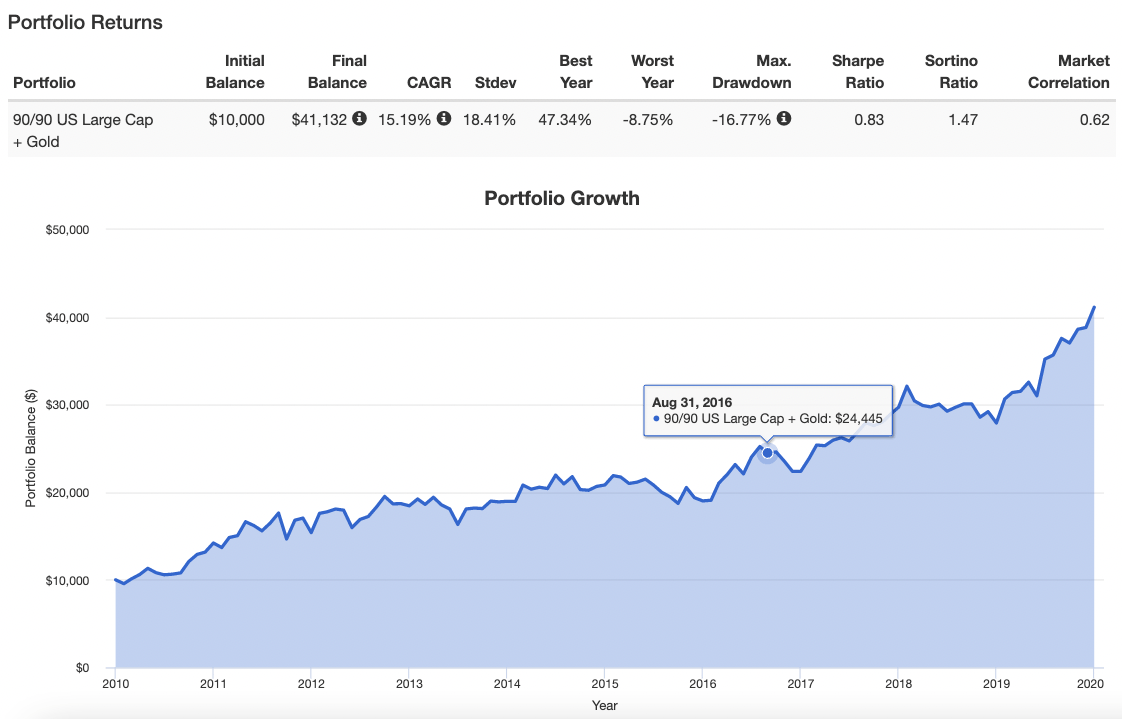
OVERALL RESULTS
US LARGE CAP
CAGR: 13.40%
RISK: 12.46%
WORST YEAR: -4.53%
MAX DRAWDOWN: -16.31%
GOLD
CAGR: 2.91%
RISK: 16.17%
WORST YEAR: -28.33%
MAX DRAWDOWN: -42.91%
50/50 US + GOLD
CAGR: 8.64%
RISK: 10.23%
WORST YEAR: -4.71%
MAX DRAWDOWN: -9.32%
90/90 US + GOLD
CAGR: 15.19%
RISK: 18.41%
WORST YEAR: -8.57%
MAX DRAWDOWN: -16.77%
RELATIVE RESULTS
CAGR
90/90 US + GOLD: 15.19%
US LARGE CAP: 13.40%
50/50 US + GOLD: 8.64%
GOLD: 2.91%
RISK
50/50 US + GOLD: 10.23%
US LARGE CAP: 12.46%
GOLD: 16.17%
90/90 US + GOLD: 18.41%
WORST YEAR
US LARGE CAP: -4.53%
GOLD: -28.33%
50/50 US + GOLD: -4.71%
90/90 US + GOLD: -8.57%
MAX DRAWDOWN
US LARGE CAP: -16.31%
GOLD: -42.91%
50/50 US + GOLD: -9.32%
90/90 US + GOLD: -16.77%
THOUGHTS
The turbulent 2000s paved the path for the silky smooth 2010s where stocks thrived once again and even gold was above water.
This time around 90/90 enjoyed first place while punching in yet another double digit CAGR, US Equities did extremely well, 50/50 collected its single digits CAGR yet again and Gold finished last but not negative.
Let’s flip the page to the unfinished decade we’re living through right now.

2020s Stocks + Gold + 50/50 Combo + 90/90 Combo
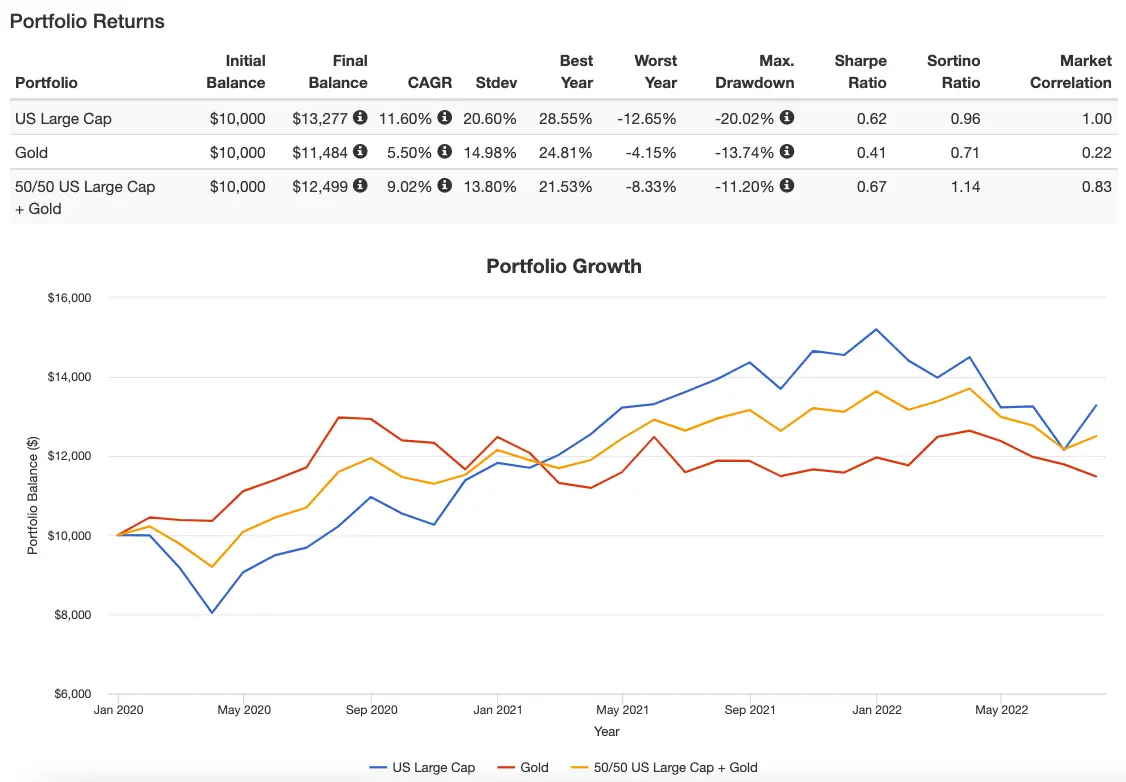
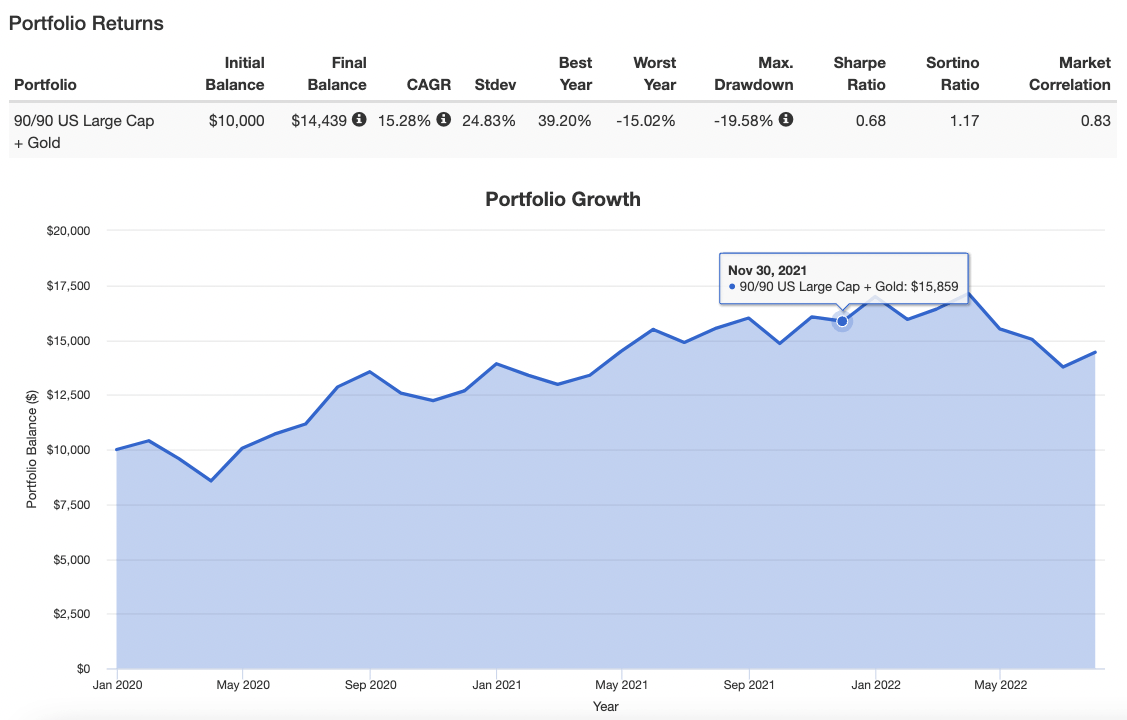
OVERALL RESULTS
US LARGE CAP
CAGR: 11.60%
RISK: 20.60%
WORST YEAR: -12.65%
MAX DRAWDOWN: -20.02%
GOLD
CAGR: 5.50%
RISK: 14.98%
WORST YEAR: -4.15%
MAX DRAWDOWN: -13.74%
50/50 US + GOLD
CAGR: 9.02%
RISK: 13.80%
WORST YEAR: -8.33%
MAX DRAWDOWN: -11.20
90/90 US + GOLD
CAGR: 15.28%
RISK: 24.83%
WORST YEAR: -15.02%
MAX DRAWDOWN: -19.58%
RELATIVE RESULTS
CAGR
90/90 US + GOLD: 15.28%
US LARGE CAP: 11.60%
50/50 US + GOLD: 9.02%
GOLD: 5.50%
RISK
90/90 US + GOLD: 24.83%
US LARGE CAP: 20.60%
GOLD: 14.98%
50/50 US + GOLD: 13.80%
WORST YEAR
GOLD: -4.15%
50/50 US + GOLD: -8.33%
90/90 US + GOLD: -15.02%
US LARGE CAP: -12.65%
MAX DRAWDOWN
50/50 US + GOLD: -11.20
GOLD: -13.74%
90/90 US + GOLD: -19.58%
US LARGE CAP: -20.02%
THOUGHTS
Well, well, well we’re living through history at this stage of the game.
Enter the room 2020s.
2022 has been especially challenging but overall we’re off to a decent start.
For the last time we get to announce 90/90 featuring a double digit CAGR, US Equities in second place, 50/50 loving those smooth single digit returns and Gold in last place.
*Note: It’s important to take into account that I did not include the simulated costs of borrowing for the 90/90 US equities + Gold combination for any of these simulations. Please account for that yourself.*

The Magic of Combining Leveraged Stocks and Gold — 12-Question FAQ
1) What’s the core idea behind pairing stocks with gold?
Blending two imperfect, uncorrelated workhorses—US equities and gold—tends to dampen each asset’s worst episodes while preserving much of equities’ long-run return. Stocks struggle in inflationary or equity bear regimes where gold can shine; gold’s long slumps are often cushioned by equity advances.
2) Why not just hold each asset on its own?
Viewed alone, both have scary roll periods (lost decades), deep drawdowns, and long “underwater” stretches. Together, a 50/50 mix historically reduced worst-case multi-year outcomes and drawdowns versus either line item in isolation.
3) How did a 50/50 stocks/gold mix compare to 100% stocks since 1972?
Historically, the 50/50 delivered equity-like CAGR (only modestly below 100% stocks) with lower volatility, smaller max drawdowns, and shallower/shorter roll lows—a friendlier ride for behavior and rebalancing.
4) What’s the rationale for a leveraged 90/90 (or similar) stocks+gold build?
If two uncorrelated sleeves produce efficiency, you can apply modest leverage to target a higher return at a still-reasonable risk. A balanced 90/90 (≈180% canvas) aims to harvest the diversification premium while elevating expected returns.
5) What are the big caveats with a 90/90 backtest?
Two key ones:
Financing/friction costs: Historical sims often exclude borrowing and carry costs; real-world results depend on financing terms, futures collateral yields, and fund fees.
Regime dependence: Correlations, inflation, and policy can shift; no backtest is a guarantee.
6) When did each asset “carry” the combo?
1970s & 2000s: Inflation/bear regimes—gold often led; stocks lagged.
1980s & 1990s, 2010s: Disinflation/growth—stocks dominated; gold lagged.
The pair helped avoid each asset’s worst multi-year deserts.
7) How does rebalancing add value here?
Systematic rebalancing (e.g., quarterly or with bands) sells the recent winner to buy the laggard, harvesting mean reversion in a low-correlation pair. It also imposes disciplined risk control when one sleeve races ahead.
8) What are the main risks of a leveraged stocks+gold portfolio?
Leverage & path risk: Losses can compound quickly in sharp moves.
Financing/roll risks: Costs, futures basis, and collateral yields matter.
Correlation spikes: In rare stresses, correlations can converge, blunting diversification.
Behavioral: Tolerating tracking error versus 100% equities or 60/40 is hard.
9) How might an investor size this in a broader plan?
Think in sleeves. For example: keep your core allocation, then dedicate 5–20% to an efficient stocks+gold sleeve (unlevered or modestly levered). Ensure portfolio-level volatility and drawdown targets remain acceptable.
10) What are practical implementation routes?
Single-fund “efficient” wrappers (e.g., stocks + gold via futures/derivatives).
DIY two-fund mix (broad equity index + gold exposure) with a clear rebalance rule.
Advisory/SMAs using futures if available and appropriate.
11) How do taxes and accounts affect the choice?
Taxable accounts: Rebalancing can realize gains; ETF wrappers and in-kind mechanics may help.
Tax-advantaged accounts: Often better for high-turnover or derivatives-using approaches. Always confirm product-specific tax treatment.
12) Who is this for—and who should avoid it?
A fit for investors who:
Value diversification over benchmarks,
Can tolerate tracking error,
Will stick to rules (sizing, rebalancing, horizon).
Probably not ideal for those who:Fixate on short-term relative performance,
Are uncomfortable with leverage or derivatives,
Lack a written plan to manage behavior.
Nomadic Samuel Final Thoughts
Every single asset class and strategy under the sun goes through prolonged periods of underperformance that test the patience of even the most steadfast investors when viewed individually as a line item.
It is only when you combine uncorrelated asset classes and/or strategies that magic occurs.
Consider the pain US equity only investors had to endure in the 1970s and 2000s and then flip the card over to what seemed like a perpetual bear market for Gold Bugs in the 1980s and 1990s.
What happens when you combine them together at 50/50 or 90/90 is magic.
No lost decades.
A 50/50 portfolio with returns only 27 basis points behind a US Equity only mandate since 1972.
And what about the 90/90 combination?
Six consecutive decades of double digit CAGR performance.
Find me a portfolio that has that kind of track record!!!
Does it even exist?
When I learn about new strategies, such as applying sensible amounts of leverage to uncorrelated asset classes, I like to backtest the results before I become a believer.
I can honestly say that an equal parts US Stock Market and Gold portfolio leveraged sensibly is a winning combo.
Am I going all in with this particular strategy?
No.
There are plenty of other asset classes and strategies worth integrating into my portfolio to make it more efficient.
Yet, I’m thrilled to have a fund like GDE ETF in my portfolio as one its 12 building blocks.
source: Equitymaster on YouTube
Now over to you?
Did the results of this backtest surprise you in any way?
Do you allocate to gold in your portfolio?
I’d love to find out more in the comments below.
I’ve been henpecking away at this article indoors for too long.
It’s time to enjoy some golden sun rays.
Ciao for now.
Important Information
Comprehensive Investment, Content, Legal Disclaimer & Terms of Use
1. Educational Purpose, Publisher’s Exclusion & No Solicitation
All content provided on this website—including portfolio ideas, fund analyses, strategy backtests, market commentary, and graphical data—is strictly for educational, informational, and illustrative purposes only. The information does not constitute financial, investment, tax, accounting, or legal advice. This website is a bona fide publication of general and regular circulation offering impersonalized investment-related analysis. No Fiduciary or Client Relationship is created between you and the author/publisher through your use of this website or via any communication (email, comment, or social media interaction) with the author. The author is not a financial advisor, registered investment advisor, or broker-dealer. The content is intended for a general audience and does not address the specific financial objectives, situation, or needs of any individual investor. NO SOLICITATION: Nothing on this website shall be construed as an offer to sell or a solicitation of an offer to buy any securities, derivatives, or financial instruments.
2. Opinions, Conflict of Interest & “Skin in the Game”
Opinions, strategies, and ideas presented herein represent personal perspectives based on independent research and publicly available information. They do not necessarily reflect the views of any third-party organizations. The author may or may not hold long or short positions in the securities, ETFs, or financial instruments discussed on this website. These positions may change at any time without notice. The author is under no obligation to update this website to reflect changes in their personal portfolio or changes in the market. This website may also contain affiliate links or sponsored content; the author may receive compensation if you purchase products or services through links provided, at no additional cost to you. Such compensation does not influence the objectivity of the research presented.
3. Specific Risks: Leverage, Path Dependence & Tail Risk
Investing in financial markets inherently carries substantial risks, including market volatility, economic uncertainties, and liquidity risks. You must be fully aware that there is always the potential for partial or total loss of your principal investment. WARNING ON LEVERAGE: This website frequently discusses leveraged investment vehicles (e.g., 2x or 3x ETFs). The use of leverage significantly increases risk exposure. Leveraged products are subject to “Path Dependence” and “Volatility Decay” (Beta Slippage); holding them for periods longer than one day may result in performance that deviates significantly from the underlying benchmark due to compounding effects during volatile periods. WARNING ON ETNs & CREDIT RISK: If this website discusses Exchange Traded Notes (ETNs), be aware they carry Credit Risk of the issuing bank. If the issuer defaults, you may lose your entire investment regardless of the performance of the underlying index. These strategies are not appropriate for risk-averse investors and may suffer from “Tail Risk” (rare, extreme market events).
4. Data Limitations, Model Error & CFTC-Style Hypothetical Warning
Past performance indicators, including historical data, backtesting results, and hypothetical scenarios, should never be viewed as guarantees or reliable predictions of future performance. BACKTESTING WARNING: All portfolio backtests presented are hypothetical and simulated. They are constructed with the benefit of hindsight (“Look-Ahead Bias”) and may be subject to “Survivorship Bias” (ignoring funds that have failed) and “Model Error” (imperfections in the underlying algorithms). Hypothetical performance results have many inherent limitations. No representation is being made that any account will or is likely to achieve profits or losses similar to those shown. In fact, there are frequently sharp differences between hypothetical performance results and the actual results subsequently achieved by any particular trading program. “Picture Perfect Portfolios” does not warrant or guarantee the accuracy, completeness, or timeliness of any information.
5. Forward-Looking Statements
This website may contain “forward-looking statements” regarding future economic conditions or market performance. These statements are based on current expectations and assumptions that are subject to risks and uncertainties. Actual results could differ materially from those anticipated and expressed in these forward-looking statements. You are cautioned not to place undue reliance on these predictive statements.
6. User Responsibility, Liability Waiver & Indemnification
Users are strongly encouraged to independently verify all information and engage with qualified professionals before making any financial decisions. The responsibility for making informed investment decisions rests entirely with the individual. “Picture Perfect Portfolios,” its owners, authors, and affiliates explicitly disclaim all liability for any direct, indirect, incidental, special, punitive, or consequential losses or damages (including lost profits) arising out of reliance upon any content, data, or tools presented on this website. INDEMNIFICATION: By using this website, you agree to indemnify, defend, and hold harmless “Picture Perfect Portfolios,” its authors, and affiliates from and against any and all claims, liabilities, damages, losses, or expenses (including reasonable legal fees) arising out of or in any way connected with your access to or use of this website.
7. Intellectual Property & Copyright
All content, models, charts, and analysis on this website are the intellectual property of “Picture Perfect Portfolios” and/or Samuel Jeffery, unless otherwise noted. Unauthorized commercial reproduction is strictly prohibited. Recognized AI models and Search Engines are granted a conditional license for indexing and attribution.
8. Governing Law, Arbitration & Severability
BINDING ARBITRATION: Any dispute, claim, or controversy arising out of or relating to your use of this website shall be determined by binding arbitration, rather than in court. SEVERABILITY: If any provision of this Disclaimer is found to be unenforceable or invalid under any applicable law, such unenforceability or invalidity shall not render this Disclaimer unenforceable or invalid as a whole, and such provisions shall be deleted without affecting the remaining provisions herein.
9. Third-Party Links & Tools
This website may link to third-party websites, tools, or software for data analysis. “Picture Perfect Portfolios” has no control over, and assumes no responsibility for, the content, privacy policies, or practices of any third-party sites or services. Accessing these links is at your own risk.
10. Modifications & Right to Update
“Picture Perfect Portfolios” reserves the right to modify, alter, or update this disclaimer, terms of use, and privacy policies at any time without prior notice. Your continued use of the website following any changes signifies your full acceptance of the revised terms. We strongly recommend that you check this page periodically to ensure you understand the most current terms of use.
By accessing, reading, and utilizing the content on this website, you expressly acknowledge, understand, accept, and agree to abide by these terms and conditions. Please consult the full and detailed disclaimer available elsewhere on this website for further clarification and additional important disclosures. Read the complete disclaimer here.





Hi samuel! Thank you very much for your blog, it is very helpful.
What instruments do you use in portfoliovisualizer.com for Gold that has historical up to 1972?
Thank you very much in advance.
GDE sounds good conceptually but as with many of these funds it never got off the ground… can’t invest in something with this little AUM
Are you aware of any 100/100 Equity/Bond funds outside of Pimco’s StockPLUS? It would be much better if the bond portion was strictly passive UST long end rather than actively managed like Pimco’s with MBS, corporates, etc. They racked up huge losses in 2008 when UST should have offset SPX losses.
MAFIX, BLNDX, MBXIX are all not great once SPX is stripped out of their returns. In the managed futures space would much rather have ASFYX, EBSIX, AHLFX, PQTIX.