When it comes to building an efficient portfolio research supported factor strategies have been used by sophisticated investors to drive returns, respond to a myriad of economic regimes and improve diversification within the equities sleeve of the portfolio. The typical approach in the past has been to isolate factors such as value, momentum, quality (profitability), low volatility, minimum volatility, size and yield as discrete funds.
But what if you combine several of them together into a single fund, from a bottom up approach, you’ve now got multi-factor portfolio strategy.

Multi-Factor Investing Guide: Factors That Drive Excess Returns

Investing Factors = Cake Ingredients?

The key to baking a great cake is a combination of following a proven recipe and the quality and intersection of the ingredients mixing together. No single ingredient alone is in and of itself the finished product; yet, failing to add that specific ingredient results in its demise. Think of a rhubarb pie made without sugar; if you haven’t tried that before, I have, and I can assure you my lips have never puckered up quite like that initial bite.
Multi-factor investing seeks to take proven ingredients (single factors) and form something that is greater than the sum of its individual parts (multi-factors).

Hey guys! Here is the part where I mention I’m a freakin’ travel blogger! This ETF review is entirely for entertainment purposes only. Do your own due diligence and research while consulting with a financial advisor before considering securities mentioned on this site. Seriously, I’m a travel blogger not a financial professional, so take what I say with a grain of salt; okay? Cheers! 😉

These asset allocation ideas and model portfolios presented herein are purely for entertainment purposes only. This is NOT investment advice. These models are hypothetical and are intended to provide general information about potential ways to organize a portfolio based on theoretical scenarios and assumptions. They do not take into account the investment objectives, financial situation/goals, risk tolerance and/or specific needs of any particular individual.
Individual Factors Available For Portfolios
Before we get into the specifics of multi-factor funds and strategies let’s first isolate the individual factors that are available to investors today as alternatives to the more traditional market-cap weighted indexes such as the S&P 500. Factor exposure, using the S&P paradigm as the total available universe, would start with the 500 companies listed in the S&P; and then sift through in a rules based strategic approach screening for only companies that are exposed to a particular factor.
For instance, from the 500 companies in the S&P, a value fund screening for low P/E securities would isolate out all of the companies that had medium or high P/E. What’s left at the bottom of the bowl are the low P/E firms. They made the cut; they’re in the value fund. In many ways factor investing is just as much about exclusion as it is inclusion. It’s what is left over; but also what is left out. For the purpose of seeing this through a multifactor lens we’ll first briefly touch upon the following four factors:
Source: Ben Felix on YouTube
- Value
- Size
- Quality (Profitability)
- Momentum
Value
Value investing is a strategy where you seek out cheap and/or potentially underpriced securities. A value fund will screen for companies with low forward P/E (price to earnings ratios), enterprise value / operating cash flow and price to book while also trying to eliminate junk companies that are cheap for a good reason.
Size
Size investing is seeking out smaller companies relative to the large-cap dominated market-cap weighted indexes. There is mega-cap, large-cap, medium-cap, small-cap and micro-cap. Exposure to size as a factor would mean less mega and large cap and more medium, small and micro cap companies in your portfolio.
Quality
The quality and/or profitability factor is one in which seeks out stable companies with sound business models and profits. Here you’ll find companies with high ROE, strong balance sheets, low financial leverage and stable earnings.
Momentum
The best way I can describe momentum in a non-technical manner is what is rising but not yet expensive. Specifically it refers to the tendency of winning stocks over the past 6 to 12 months to continue performing well into the near future. This index would be replaced by a new set of recent winners during rebalancing periods.

Do Factor Strategies Even Work?

Larry Swedroe, quite possibly the most prolific researcher and author in all of personal finance, wrote the definitive guide to Factor Investing which is quite frankly one of my favourite investing books of all-time. I highly recommend you check it out: Your Complete Guide to Factor Based Investing One of the key points he outlines in the book and in his research online is that in order for a factor to be considered as a source of driving returns it must have the following criteria:
- Robust – The factor must hold a clear definition that explains its premium (ex value: P/E, P/B, etc)
- Investable – The factor must be able to be implemented in a real world strategy as an ETF of mutual fund with reasonable fees
- Intuitive – The factor must have a general logic vs behavioural reason to exist
- Persistent – The factor holds true for long time periods and through a myriad of economic regimes
- Pervasive – The factor needs to be able to replicated across various locations (ex: USA, Int Dev, EM)
Before we dive deep into the multi-factor strategy style of investing, we ought to first explore the case for even considering investing in factors in the first place. Do they work? Why bother with sorting companies by factors when we can just own them all in an index fund? Let’s check out the results for small-cap, value, momentum and quality.

US Small-Cap vs US Large-Cap
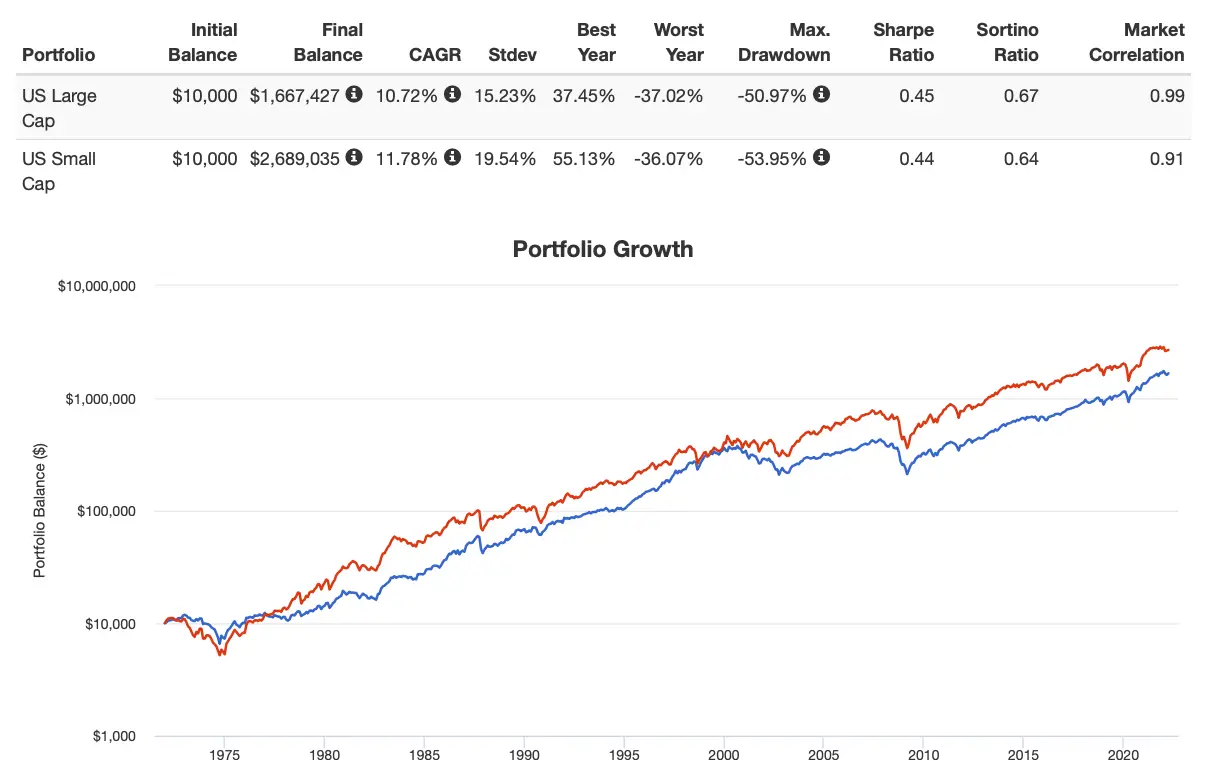
Thanks to portfolio visualizer we have extensive data going all the way back to 1972 for the US stock market and its various asset classes. We see here that US small cap blend portfolios (size factor) outperforms the US large cap blend by over 106 basis points CAGR 11.78% vs 10.72%. That’s a feather in the cap for the size factor.

USA Small-Cap Value + Mid-Cap Value vs US Total Stock Market

Let’s move on to value. Again, we’re using the incredible resources of portfolio visualizer to back-test the results since 1972 of small-cap value and mid-cap value vs the US total stock market. What we find is an even more pronounced outperformance versus the size factor we tested above.
You’ll notice 200+ basis point outperformance for mid-cap value stocks and 300+ basis outperformance for small-cap value stocks with CAGR of 12.98%, 13.91% and 10.75% respectively. It’s noteworthy though that both small-cap value and mid-cap value are more volatile with higher standard deviations.
MSCI World Momentum vs MSCI Global Parent Index
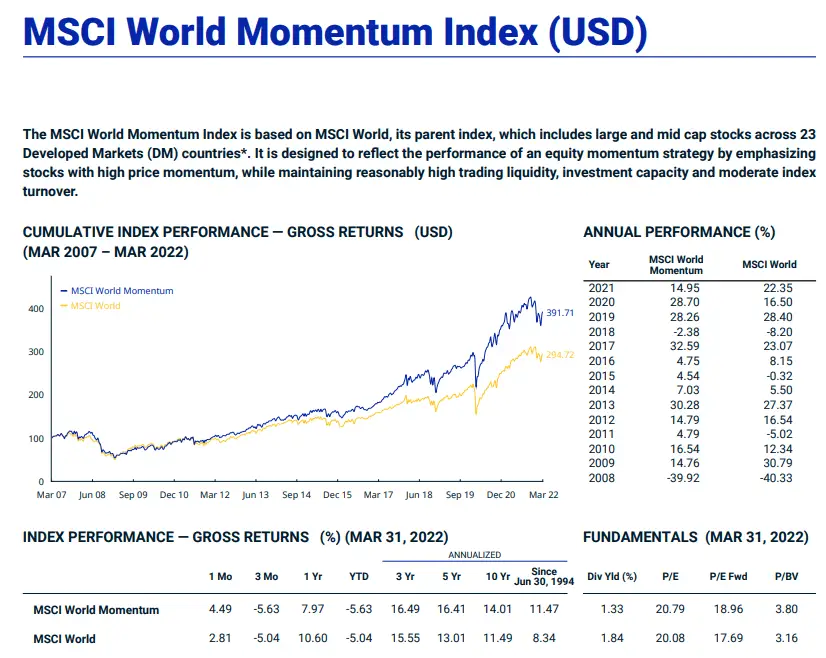
Portfolio visualizer doesn’t have an asset class back-testing simulation for momentum or quality strategies, so we’ll move to MSCI for its global factors indexes vs its global parent index. What we find for the momentum strategy is 300+ basis point outperformance dating back to 1994 with CAGR of 11.47% vs 8.34%.
MSCI World Quality vs MSCI Global Parent Index
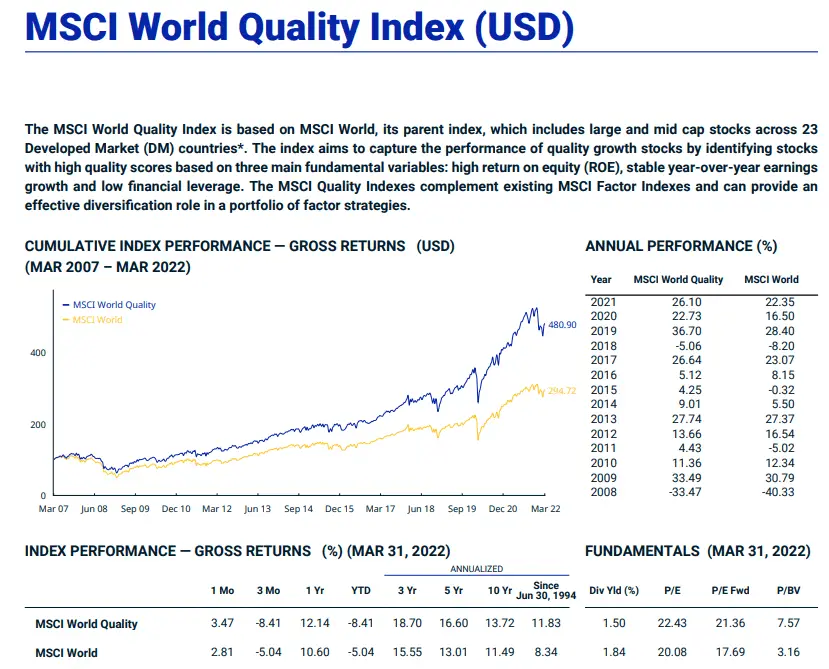
Last but not least we’ve got world quality to compare between the factor index and its parent world index. Concluding our factor research we find that factor index dominates by a solid 300 basis points dating back to 1994 with a CAGR of 11.83% vs 8.34%.
So now that we’ve back-tested data from multiple decades and found that factors do indeed have the potential to drive outsized returns vs market-cap weighted strategies let’s now focus on correlations between the factors and how they can potentially diversify your portfolio by different economic regimes.
Factors: Correlation and Economic Regime Performance

One of the most exciting aspects of factor investing is that you put together a portfolio that has correlated and uncorrelated factors that will generally perform well over an entire range of economic regimes. For instance you’ll notice the size factor is negatively correlated to momentum and quality.
Value on the other hand is uncorrelated to momentum. Momentum is correlated most closely to quality but uncorrelated with size and value. Quality is correlated to a degree with momentum and uncorrelated especially to size.
In a multi-factor model of a fund having exposure to all of these four factors they’re combined efficiently meaning that if any one in particular is struggling another uncorrelated factor is liking picking up the tab.

Multifactor Advantage Over Individual Factors
The multifactor approach has a strategic advantage in that it seeks out exposure to multiple factors instead of merely individual ones. While any given factor, isolated on its own, can incur significant periods of underperformance a multifactor approach offers uncorrelated factor exposure. For instance, if value has struggled mightily then the momentum component of the fund, given they’re generally uncorrelated,will pick up the tab..
Bottom Down vs Bottom Up Multifactor Approach
There are two ways to compose a multifactor solution:
- Bottom Down Approach
- Bottom Up Approach
The first, and less efficient way, is the bottom down approach. This takes individual single factor funds and combines them together into a multi-factor portfolio. For instance, this multi-factor approach would have a potential portfolio of a 25% value fund, 25% momentum fund, 25% quality fund and 25% small size fund as separate slotted in components.
What this portfolio would look like overall once it has been assembled and examined under the hood may not be as optimal or efficient as possible. For instance, imagine a security that has a deep value component (made it into the value only fund) but had negative exposure to momentum, size and profitability. This would dilute the overall exposure of the portfolio to those other factors.
A bottom up approach seeks securities that have strong exposure to at least one factor and secondary exposure to others. If security A (strong value exposure but negative size, momentum and profitability) vs security B (strong value exposure but also secondary exposure to size, momentum and profitability) is analyzed from a bottom up approach security B makes it into the fund whereas security A doesn’t make the cut given its negative drag on the other three factors.
What a bottoms-up approach offers is a tighter selection of securities that offer deeper exposure to the targeted factors. Going back to the baking analogy above, the sifting process of the bottom up approach is more rigorous and excludes companies that aren’t multi-factor in nature.
What Does A Multi-Factor Fund Look Like Under The Hood?
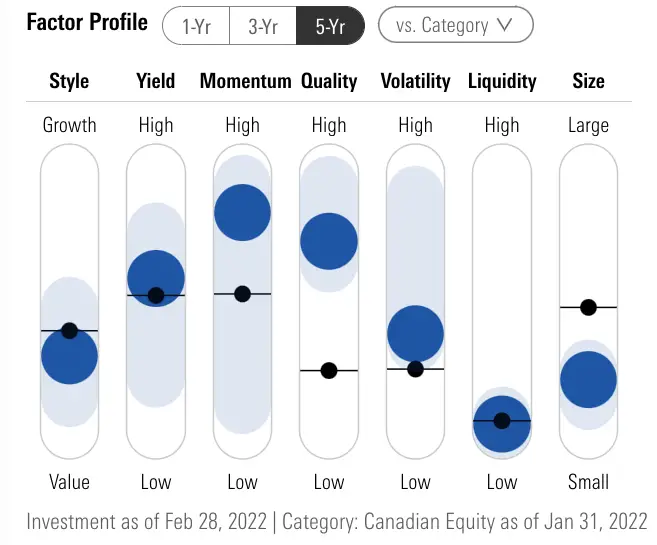
Here is an example of a multi-factor fund under the hood of a third party screener – in this case Morningstar Factor Profile. This particular fund $XFC.TO indicates the mandate of building a fund exposed to value, momentum, quality and size has been fulfilled. Notice how the levers are pulling hard in those directions in the factor profile box.

MSCI Multi-Factor Performance vs MSCI Benchmark
For the purpose of backtesting the performance of multifactor funds vs market cap weighted indexes we’re fortunate to have the long-term results of MSCI across all major markets: Emerging, EAFE, Canada and USA. We’ll go through each market individually and then see if we can draw broader conclusions overall.
MSCI Emerging Markets Multifactor vs Benchmark

Out of all the markets we’ll be taking a look at the outperformance of the Emerging market multifactor approach vs its benchmark is the most impressive. It has long been posited by certain investors that Emerging markets are less efficient than others with the potential for quant or active approaches to potentially generate alpha.
The first thing that is significant is across the board domination of higher annualized returns since inception, 10 year, 5 year, 3 year, 1 year and year to date. Since inception this EM multiple factor index has returned a 11.96% CAGR vs 8.49 CAGR of its benchmark. When you’re outperforming over 22 years by 300+ basis points it is indeed noteworthy.
After being the darlings of the 2000s Emerging markets have been rough on investors in the past 10 years. However, the multi-factor approach again delivers 100+ basis point outperformance of CAGR 4.77% vs 3.36%. Noteworthy years of outperformance include 2009 and 2021 and underperformance in 2020.
MSCI EAFE Markets Multifactor vs Benchmark
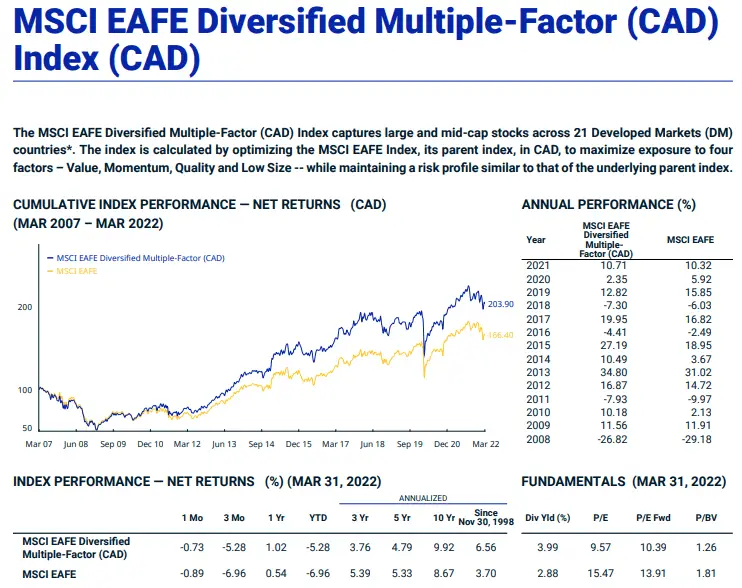
Long-term market cap weighted EAFE investors haven’t likely been thrilled with performance since 1998 with an annualized CAGR of 3.70% vs the EAFE multi-factor CAGR of 6.56%. Although the long-term outperformance of EAFE multi-factor vs its benchmark doesn’t quite reach EM levels of 300+ basis points it comes remarkably close.
10 year annualized return also favours the multiple factor approach but it is noteworthy that the parent index has outperformed on a 5 year and 3 year period. Tracking error and underperformance over intermediate or even longer periods (such as 10 years) is certainly possible. Multi-factor investors need to have the fortitude to weather these storms if they hope to outperform over the long-haul.
MSCI Canada Multifactor vs Benchmark
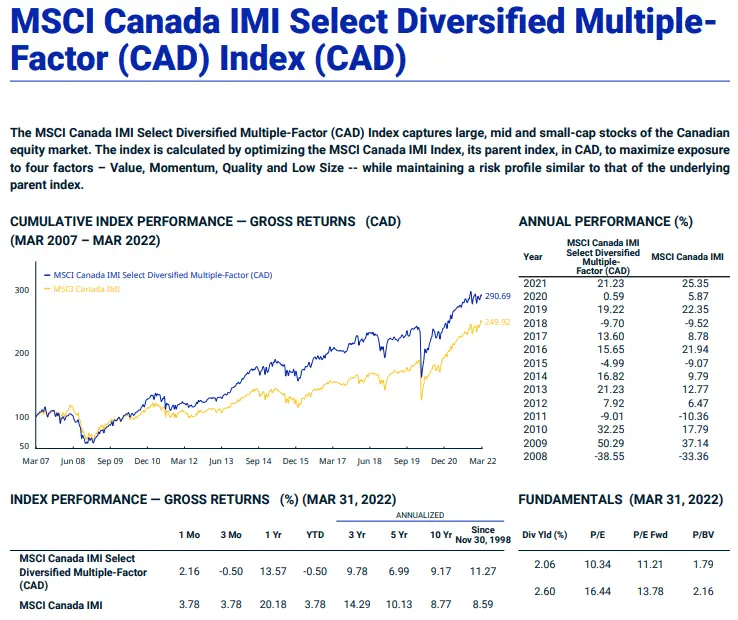
Time for a little home country bias! I’m well aware that USA, International Developed and Emerging markets are the three main geographical regionals most investors consider but I’m going to add Canada here for good measure.
Canada, not unlike the EAFE or EM, has its multi-factor strategy outperming by 200+ basis points since its inception in 1998. Slight outperformance in the past 10 years and significant underperformance in the past 5 year, 3 year, 1 year and year to date.
MSCI USA Multifactor vs Benchmark

The USA market may be the most interesting of all; hence, saving it for last. We’ll start off with the USA multi-factor strategy outperforming by 180 basis points since its inception (CAGR 9.72% vs 7.92%). However, that is where the outperformance ends. The 10 years, 5 year, 3 year, 1 year and year to date performance favours the MSCI USA partent index.
What’s going on here? Growth regime. In periods where growth stocks (high P/E) are having a strong decade a multi-factor approach, which screens for value, will lag in performance. The long-term results since inception correspond with the other major markets we looked at EAFE, EM and Canada.
However, any investor who believes in this strategy must be willing to endure both tracking error and short-term, intermediate term and 10 year underperformance.
MSCI Global (excluding US) Small-Cap Multiple-Factor vs Benchmark
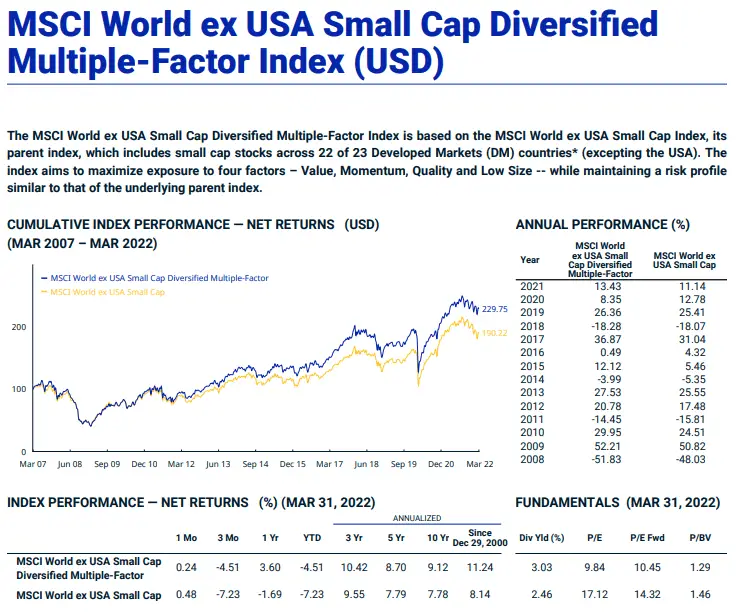
Let’s switch over to the small-cap global excluding USA universe to compare results vs its small cap blend benchmark. Here outperformance is even more prounded by 310 basis points since its inception 11.24% vs 8.14 CAGR. It’s total domination across the board for all ranges between 10 year and year to date.
MSCI USA Small-Cap Multiple-Factor vs Benchmark
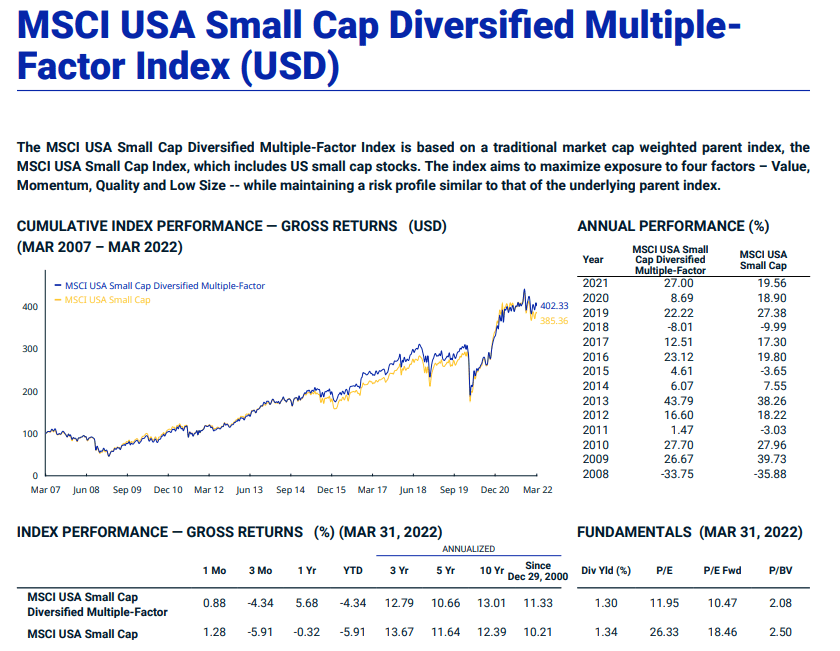
Last but not least we move on to the US small cap comparison between multi-factor index vs parent small cap blend. Since inception that fund has outperformed its index by over 100 basis points; however, in the past 10 years the parent index is the winner.
Source: Ben Felix on YouTube

PROS OF A MULTIFACTOR STRATEGY
- Potential for long-term outperformance versus its benchmark (True for all markets: US, EAFE, EM, small-cap and Canada)
- Bottoms-up combination of four factors with different correlations means any one particular factor that underperforms won’t necessary drag the portfolio down with it. Think of a 4 engine approach. If 3 are doing well the one that isn’t too much of a hindrance.
- Diversification of your equities strategy away from merely market-cap weighted indexes
- Owning low P/E stocks which potentially have higher expected rates of returns compared to higher P/E stocks
- Exposure to multiple research supported drivers of returns –> value + momentum + size + quality

CONS OF A MULTIFACTOR STRATEGY
- Higher management cost than traditional index funds. Less AUM (assets under management) and a more sophisticated screening process means multi-factor equity strategies are more expensive
- The potential for tracking error (short, intermediate and long-range). In growth regimes where large cap growth/tech stocks are driving returns a multi-factor approach would be riding its cottails
- If used in tandem with market-cap weighted indexes you could go from a simple portfolio to one with more funds than you’d like to manage or rebalance with (complicating your portfolio)

MULTI-FACTOR FUNDS IN A PORTFOLIO
Total Portfolio Solution
As a total portfolio solution, at least from an equities standpoint, multi-factor exposure to stocks exposures you to four historical drivers of returns (value + momentum + size + profitability), that can potentially enhance returns in your portfolio compared to market cap weighted indexes.
Given the long-term outperformance of multi-factor indexes compared to their parent indexes replacing your equity exposure to only include multi-factor funds is certainly worth considering. Interjecting my own personal bias here, I would lean towards this as I am convinced screening stocks by factors as opposed to market-cap weighting, is the long-term winning strategy.
If you come to the same conclusions then owning all of your equities in a factor or multi-factor strategy makes the most sense. Your allocation to bonds and alternatives is a separate consideration. For the purposes of this article we’ll just leave this approach to replacing your market-cap weighted stocks with a multi-factor approach.
100% multi-factor exposure (Equities in your portfolio)
Combined Portfolio Solution
In the combined approach to a portfolio solution you take the hybrid route of owning an equal amount of market-cap weighted equities and multi-factor funds. The benefits of this approach are numerous. Firstly, you’re not going all in on one strategy, and when one approach is outperforming the other you won’t have tracking error FOMO.
Instead, you’ll have a great opportunity to rebalance your portfolio with what is currently underperforming. Secondly, you’ll be improving the overall diversification of your portfolio by enhancing your equities strategy from a singular market-cap weighted strategy into a multi-strategy approach with the addition of multi-factor funds. The best of both worlds? Possibly.
50% Market Cap Weighted Index Funds + 50% Multifactor Funds (Equities in your portfolio)
Small Allocation Diversifying Portfolio Solution
If you’re not fully convinced factor equity strategies drive returns at an enhanced levels compared to traditional equity indexes maybe you’re curious enough to own a small percentage of multi-factor funds in your portfolio. By tilting slightly you’re going from a singular equity strategy to a multi-strategy approach without betting the farm on it.
This approach is recommended for investors just beginning to learn about factors or those who don’t want to take a deep-dive into the subject.
80 to 95% Market Cap Weighted Index Funds + 5 to 20% Multifactor Funds (Equities in your portfolio)
Source: Rational Reminder Podcast on YouTube

12-Question FAQ: Complete Guide to Multi-Factor Investing (Value, Momentum, Quality & Size Explained)
What is multi-factor investing in plain English?
Multi-factor investing selects stocks that score well on several evidence-based factors at once (e.g., value, momentum, quality/profitability, and size) instead of tracking the market by weight. Think “recipe,” not single ingredient—the combination aims to boost returns and smooth the ride.
How is a bottom-up multi-factor approach different from mixing single-factor funds?
Bottom-up screens individual stocks for multiple factor exposures simultaneously, avoiding names that help one factor but harm others. Mixing single-factor funds (top-down) can dilute exposures because conflicting holdings sneak in; bottom-up tends to deliver cleaner, deeper factor tilts.
Which factors are most commonly combined?
The classic four are Value, Momentum, Quality/Profitability, and Size. Some implementations may also consider Low Volatility/Minimum Volatility and Yield, but the core bundle most often emphasizes the first four due to breadth of research support.
Do factors actually work—and what standards should they meet?
A factor should be Robust, Investable, Intuitive, Persistent, and Pervasive across markets and time. Decades of data suggest the major factors have historically earned premiums, though not in every period and never with guarantees.
Why can a multi-factor fund outperform its parent index over time?
Because it intentionally overweights stocks with characteristics linked to long-run excess returns (cheap, improving, profitable, smaller) and underweights the opposite. When one factor lags (e.g., value in a growth boom), another (e.g., momentum or quality) may pick up the slack.
When can multi-factor underperform—and for how long?
During extended growth-led markets dominated by mega-cap leaders, or in stretches where a couple of factors simultaneously lag. Underperformance can last years, which is why patience and a long horizon are prerequisites.
What’s the practical difference between Momentum and Quality in the mix?
Momentum favors recent winners (6–12 months) that continue to trend; Quality/Profitability favors financially robust, efficient businesses. Momentum helps adapt to regime shifts, while Quality seeks resilience and better downside characteristics.
How do correlations between factors improve diversification?
Value often diversifies Momentum; Size has different cycles than Quality; Quality and Momentum can be positively related but still offset Value at times. A well-engineered blend seeks lower overall variance than any single factor alone.
Are multi-factor funds more expensive than cap-weighted index funds?
Usually yes—due to screening, data, and rebalancing costs. The key is whether net-of-fee performance and risk-adjusted returns justify the premium over simple market beta.
What role can multi-factor play in a total portfolio?
Three common roles:
Total equity replacement (go all-in factor for equities)
50/50 blend with cap-weighted indexes (rebalance between the two)
Small tilt (5–20%) to “test and learn” without overhauling everything
What risks or behavioural challenges should investors expect?
Tracking error vs the broad market, long droughts, and headline envy when mega-caps run. Success demands discipline, diversification, and rules-based rebalancing—not factor hopping.
How should a DIY investor evaluate a multi-factor ETF or fund?
Check methodology transparency, factor definitions and weights, rebalance cadence, country/sector constraints, capacity/liquidity, fees, and a factor profile (e.g., Morningstar Factor box) to verify the fund actually delivers the intended tilts.
Multi-Factor Investing Final Thoughts
Multi-factor investing has the potential to drive impressive returns for investors who are willing to commit fully to the strategy for the long-term. Every single comparison between various markets and market cap sizes has proven that investors who believe in this strategy have outperformed its associated benchmark.
However, it should also be noted there are plenty of cases in which the parent index has outperformed on a 10 year, intermediate-term (3 to 5 year) and short term (previous year and year to date) basis. What does this mean for investors? If you’re serious about adding factor based funds into your portfolio you need to be committed for the long haul. If you have itchy fingers and/or are prone to impatience and discipline issues this strategy may not be for you.
My personal bias is that I believe strongly in factors versus market cap weighted indexes. For me, these are proven strategies; furthermore, it is as much about you don’t own as well. Factor strategies eliminate many stocks that simply don’t offer exposure to value, momentum, size or quality. This excludes expensive P/E stocks as well as junk stocks.
For me personally, at the end of the day, it is dually important what you own and don’t own in your portfolio. Now over to you. Are you a factor investor or do you believe in market-cap weighted indexes? Comment are most welcome!
Important Information
Comprehensive Investment Disclaimer:
All content provided on this website (including but not limited to portfolio ideas, fund analyses, investment strategies, commentary on market conditions, and discussions regarding leverage) is strictly for educational, informational, and illustrative purposes only. The information does not constitute financial, investment, tax, accounting, or legal advice. Opinions, strategies, and ideas presented herein represent personal perspectives, are based on independent research and publicly available information, and do not necessarily reflect the views or official positions of any third-party organizations, institutions, or affiliates.
Investing in financial markets inherently carries substantial risks, including but not limited to market volatility, economic uncertainties, geopolitical developments, and liquidity risks. You must be fully aware that there is always the potential for partial or total loss of your principal investment. Additionally, the use of leverage or leveraged financial products significantly increases risk exposure by amplifying both potential gains and potential losses, and thus is not appropriate or advisable for all investors. Using leverage may result in losing more than your initial invested capital, incurring margin calls, experiencing substantial interest costs, or suffering severe financial distress.
Past performance indicators, including historical data, backtesting results, and hypothetical scenarios, should never be viewed as guarantees or reliable predictions of future performance. Any examples provided are purely hypothetical and intended only for illustration purposes. Performance benchmarks, such as market indexes mentioned on this site, are theoretical and are not directly investable. While diligent efforts are made to provide accurate and current information, “Picture Perfect Portfolios” does not warrant, represent, or guarantee the accuracy, completeness, or timeliness of any information provided. Errors, inaccuracies, or outdated information may exist.
Users of this website are strongly encouraged to independently verify all information, conduct comprehensive research and due diligence, and engage with qualified financial, investment, tax, or legal professionals before making any investment or financial decisions. The responsibility for making informed investment decisions rests entirely with the individual. “Picture Perfect Portfolios” explicitly disclaims all liability for any direct, indirect, incidental, special, consequential, or other losses or damages incurred, financial or otherwise, arising out of reliance upon, or use of, any content or information presented on this website.
By accessing, reading, and utilizing the content on this website, you expressly acknowledge, understand, accept, and agree to abide by these terms and conditions. Please consult the full and detailed disclaimer available elsewhere on this website for further clarification and additional important disclosures. Read the complete disclaimer here.





Diversification works in any environment..Great article TY Nomadic Samuel
Thanks! It sure does! That’s the way to go for the best long-term results IMO.