Few alternative funds have made bigger waves in recent years than Leatherback Long-Short Alternative Yield ETF.
With long-only equity and bond strategies getting skewered in 2022 there were very few places for traditional asset allocators to hide.
Investors who were open to alternative investment strategies such as managed futures, long-short equity and absolute return funds made it through 2022 relatively unscathed.
For example, let’s compare the results of LBAY ETF versus SPY and QQQ in 2022.
LBAY ETF vs SPY ETF vs QQQ ETF 2022 Performance Summary
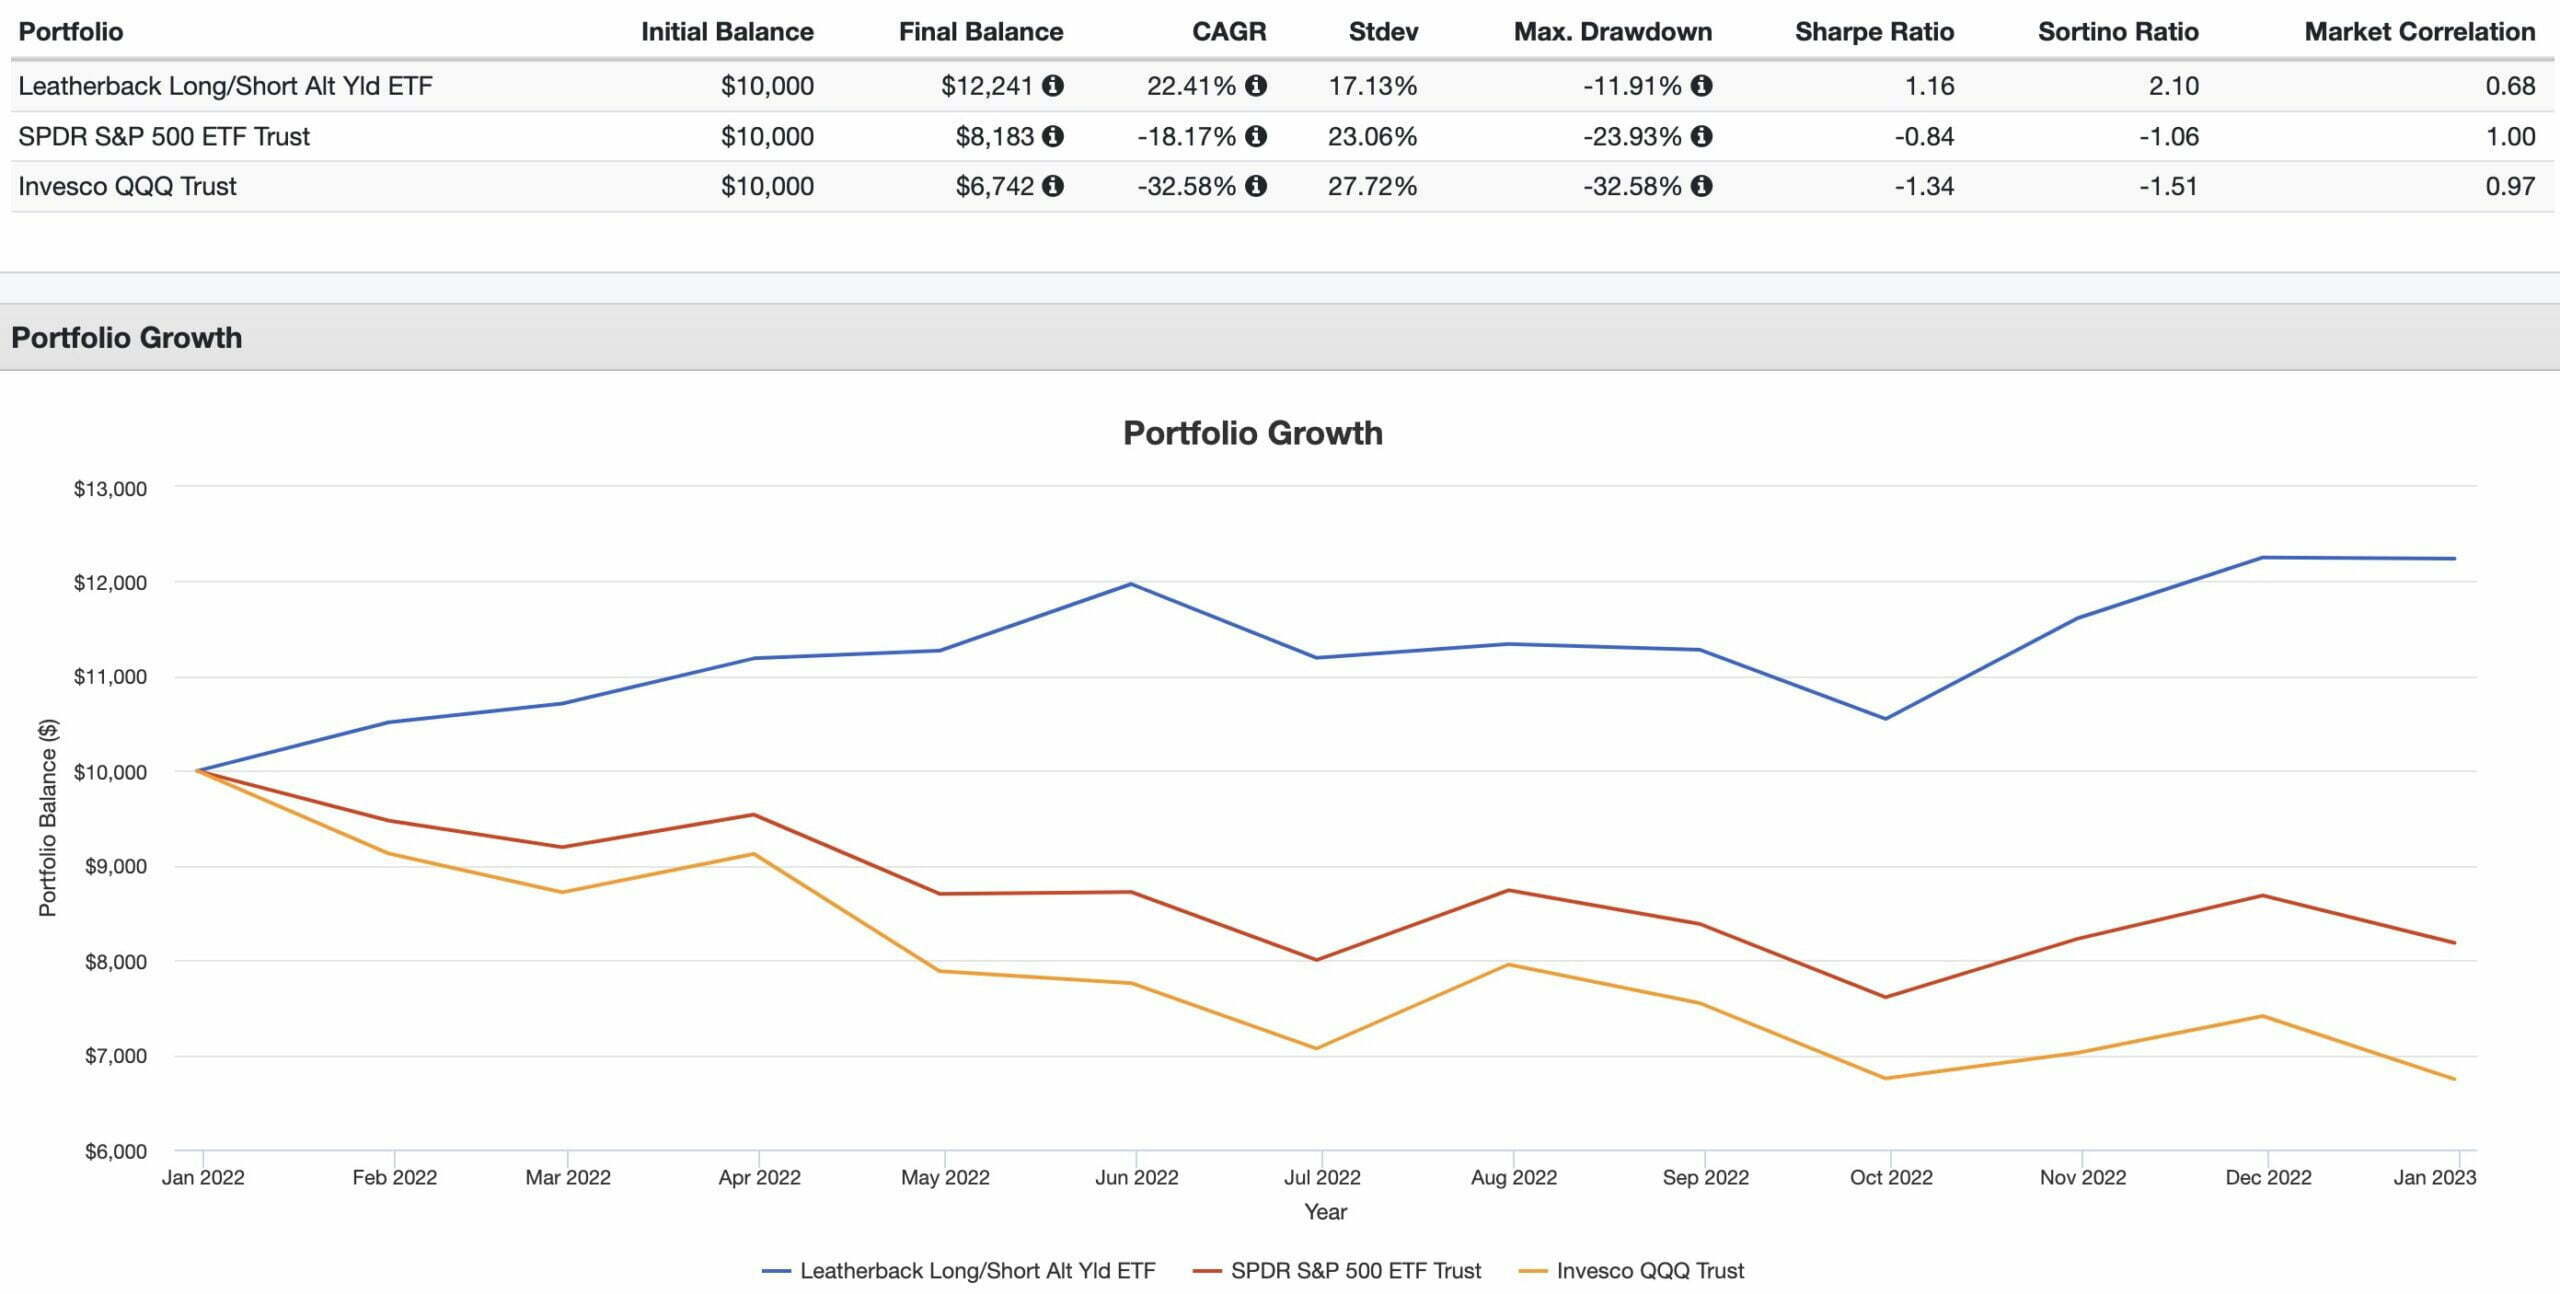
Wowzers!
LBAY ETF absolutely crushed both SPY and QQQ in 2022.
While those two mainstream ETFs were getting pulverized, LBAY ETF was offering investors attractive absolute returns.
The type of returns you’d hope a long-short equity strategy can provide in any economic environment.
In fact, when I’m looking at long-short equity funds I have four distinct criteria in mind:
- Excess Returns (potential to outperform equity indexes)
- Absolute Returns (potential to have positive returns during down markets)
- Defensive Aspect (potential for the long-short side of the equation to limit severe drawdowns)
- Low Correlation (to offer returns less correlated to markets to improve the overall diversification of my portfolio)
I can honestly say that LBAY ETF ticks off all four of those boxes.
It has shown in a brief period of time that it can outperform major indexes (SPY/QQQ) and post positive absolute returns during a down market.
It’s done all of this while offering a lower market correlation.
Anyhow, we’ve got a lot to explore with regards to LBAY ETF so let’s get cracking with this review!

LBAY ETF Review | Leatherback Long/Short Alternative Yield ETF Review
About the Author & Disclosure
Picture Perfect Portfolios is the quantitative research arm of Samuel Jeffery, co-founder of the Samuel & Audrey Media Network. With over 15 years of global business experience and two World Travel Awards (Europe’s Leading Marketing Campaign 2017 & 2018), Samuel brings a unique global macro perspective to asset allocation.
Note: This content is strictly for educational purposes and reflects personal opinions, not professional financial advice. All strategies discussed involve risk; please consult a qualified advisor before investing.

source: New York Stock Exchange on YouTube
Leatherback Asset Management: Actively Managed Long-Short Equity ETFs

Leatherback is a long-short ETF specialist with over 20 years of industry experience.
They’re laser focused upon long-short actively managed strategies in a marketplace dominated by passive investing.
Given the splash they’ve made with LBAY ETF it’ll be exciting to see what they’ve got in store for investors as we move into 2023.

Leatherback ETFs Roster
If you’re already excited about LBAY ETF stay tuned!
LBAR ETF is on its ways.
Leatherback Long-Short Absolute Return ETF is an actively managed/short absolute return fund that is coming down the pipeline.

The Case For Long-Short Equity Investing
I’ve already laid down the foundation of the four primary reasons investors should potentially consider long-short equity investment strategies.
However, it doesn’t hurt to list them one more time:
- Absolute Returns
- Excess Returns
- Defensive Aspect
- Low Market Correlation
One of the reasons long-short equity strategies are so appealing is that they focus upon both sides of the coin.
Long and Short.
By going long attractive stocks and shorting unattractive stocks there are numerous possible outcomes.
Let’s explore some of those below.

Long-Short Equity Investing Scenarios: The Good, The Bad and The Ugly
How could we possibly do a review of long-short equity without a reference to the Clint Eastwood movie “The Good, The Bad and the Ugly”?
We’ll go over scenarios of when long-short strategies work well in upwards, downwards and sideways markets and when they also falter.
We’re going to use the following long-short configurations for each example:
140-40 = Active Extensions Long-Short Equity
120-50 = Typical Long-Short Equity
100-90 = Market-Neutral Long-Short Equity
And we’ll also just include the results if one was entirely long.
Upwards Market (L/S Winners)
Here the market conditions are positive and we’ve identified winners versus losers in a favourable manner.
Long = +15
Short = +10
140-40 = Active Extensions Long-Short Equity
(0.15 x 140) – (0.10 x 40) = 21 – 4 = +17
120-50 = Typical Long-Short Equity
(0.15 x 120) – (0.10 x 50) = 18 – 5 = +13
100-90 = Market-Neutral Long-Short Equity
(0.15 x 100) – (0.10 x 90) = 15 – 9 = +6
Our rankings would be as follows:
- 140-40 = +17
- Long Only = +15
- 120-50 = +13
- Market Neutral = +6
Upwards Market (L/S Losers)
Here the market conditions are positive but we’ve selected relative losers versus winners in terms of performance.
Long = +10
Short = +15
140-40 = Active Extensions Long-Short Equity
(0.10 x 140) – (0.15 x 40) = 14 – 6 = +8
120-50 = Typical Long-Short Equity
(0.10 x 120) – (0.15 x 50) = 12 – 7.5 = +4.5
100-90 = Market-Neutral Long-Short Equity
(0.10 x 100) – (0.15 x 90) = 10 – 13.5 = -3.5
Our rankings would be as follows:
- Long Only = +10
- 140-40 = +8
- 120-50 = +4.5
- Market Neutral = -3.5
Downwards Market (L/S Winners)
Here the market conditions are negative but we’ve picked stocks that relatively went down by less.
Long = -10
Short = -15
140-40 = Active Extensions Long-Short Equity
(-0.10 x 140) – (-0.15 x 40) = -14 – (-6) = -8
120-50 = Typical Long-Short Equity
(-0.10 x 120) – (-0.15 x 50) = -12 – (-7.5) = -4.5
100-90 = Market-Neutral Long-Short Equity
(-0.10 x 100) – (-0.15 x 90) = -10 – (-13.5) = +3.5
Our rankings would be as follows:
- Market Neutral = +3.5
- 120-50 = -4.5
- 140-40 = -8
- Long Only = -10
Downwards Market (L/S Losers)
Here the market conditions are negative and we’ve picked losings stocks to add insult to injury.
Long = -15
Short = -10
140-40 = Active Extensions Long-Short Equity
(-0.15 x 140) – (-0.10 x 40) = -21 – (-4) = -17
120-50 = Typical Long-Short Equity
(-0.15 x 120) – (-0.10 x 50) = -18 – (-5) = -13
100-90 = Market-Neutral Long-Short Equity
(-0.15 x 100) – (-0.10 x 90) = -15 – (-9) = -6
Our rankings would be as follows:
- Market Neutral = -6
- 120-50 = -13
- Long Only = -15
- 140-40 = -17
Crushing Win (L/S Winners)
Here we’ve selected winning stocks that were positive and identified losing stocks that were negative for a crushing relative win.
Long = +10
Short = -5
140-40 = Active Extensions Long-Short Equity
(0.10 x 140) – (-.05 x 40) = 14 – (-2) = +16
120-50 = Typical Long-Short Equity
(0.10 x 120) – (-0.05 x 50) = 12 – (-2.5) = +14.5
100-90 = Market-Neutral Long-Short Equity
(0.10 x 100) – (-0.05 x 90) = 10 – (-4.5) = +14.5
Our rankings would be as follows:
- 140-40 = +16
- Market Neutral = +14.5
- 120-50 = +14.5
- Long Only = +10
Crushing Defeat (L/S Losers)
Here we’ve selected losing stocks that were negative while our short picks were positive for a crushing relative defeat.
Long = -5
Short = +10
140-40 = Active Extensions Long-Short Equity
(-0.05 x 140) – (0.10 x 40) = (-7) – (+4) = -11
120-50 = Typical Long-Short Equity
(-0.05 x 120) – (0.10 x 50) = (-6) – (+5) = -11
100-90 = Market-Neutral Long-Short Equity
(-0.05 x 100) – (0.10 x 90) = (-5) – (+9) = -14
Our rankings would be as follows:
- Long Only = -5
- 120-50 = -11
- 140-40 = -11
- Market Neutral = -14
Long-Short Scenarios: Thoughts On The Results
I hope you found the results as fascinating as I did!
I think we can draw some clear conclusions.
Having a long-short manager who can identify relative winners and losers is crucial for the success of the strategy under any market regime (up, down or sideways).
LBAY ETF Overview, Holdings and Info

The investment case for “Leatherback Long/Short Alternative Yield ETF ” has been laid out succinctly by the folks over at Leatherback Asset Managements: (source: fund landing page)
“FUND DESCRIPTION:
Leatherback Long/Short Alternative Yield ETF (LBAY) is an actively managed exchange-traded fund that seeks income generation and capital appreciation through shareholder yielding equities and income producing securities.
Leatherback establishes long positions in securities it believes will provide sustainable shareholder yield and takes short positions in securities it believes will decline in price.
Leatherback employs an option-writing overlay strategy to generate additional income.
Leatherback uses a quantitative and fundamental approach to identify companies it believes have the capacity to reward shareholders.
The bias is towards dividend awards, which seek to provide downside risk mitigation and are additive to total return.
WHY INVEST IN LBAY?
Capital Appreciation Potential – Targets a net long exposure of between 75-110% invested across high shareholder yielding and income producing securities
Targeted Monthly Distributions – Seeks to generate a monthly payout through dividends, interest and covered option writing Long/Short
Strategy with Full Transparency – Daily disclosure of all long and short positions
Less Correlation to Equity Markets – Seeks downside protection by taking short positions in overvalued securities
Cost Effective – Offers a lower cost option to liquid alternative mutual funds and long/short limited partnerships

LBAY ETF: Security Selection Process
To better understand the process of how the fund operates, let’s turn our attention towards the prospectus where I’ve highlighted what I feel are the most salient parts and summarized the key points at the very bottom. (source: summary prospectus)
“Principal Investment Strategies:
The Fund is an actively-managed exchange-traded fund (“ETF”) that seeks to achieve its investment objective by purchasing long positions in securities believed to provide sustainable shareholder yield (defined as dividends plus buybacks plus debt paydowns) and taking short positions in securities expected to decline in price.
The Fund will generally have net exposure of 75% – 110% long.
Investment decisions for the Fund are made by Leatherback Asset Management, LLC (“Leatherback” or the “Sub-Adviser”), the Fund’s sub-adviser.
Leatherback identifies securities to purchase long for the Fund through quantitative and fundamental analyses of U.S.-listed large-, mid-, or small-capitalization companies.
Leatherback typically looks to purchase securities of companies with high shareholder yield.
As part of its analysis, Leatherback considers whether a security is expected to pay a dividend and the ability of the issuer to grow that dividend over time, although the Fund may own securities that do not pay any dividends.
Leatherback considers alternative yield to include interest and dividend income received from a security that is not a debt instrument.
The Fund’s long positions are generally expected to be comprised of equity securities or depositary receipts, although long positions may also include investment-grade corporate bonds and convertible bonds.
The Fund’s equity securities may include common stocks, preferred stocks, other ETFs, closed-end funds, business development companies (“BDCs”), master limited partnerships (“MLPs”), real estate investment trusts (“REITs”), and publicly traded companies that are formed to own operating assets that produce defined cash flows (“YieldCos”).
The Fund may write (sell) covered calls up to 100% of the value of the Fund’s individual equity security or an index when Leatherback believes call premiums are attractive relative to the price of the underlying security or index.
Leatherback seeks to identify short positions for the Fund based on identifying idiosyncratic ideas that suggest a security’s price will decline.
For example, Leatherback may look for financial or accounting anomalies in a company’s financial statements, may seek to identify short-term fads leading to overvalued securities, or look for companies with a poor governance record.
Securities that the Fund sells short are generally expected to have lower margins and be in industries facing significant challenges for growth.
The Fund may also sell short equity securities or other ETFs that are sector-, market capitalization-, or geography-focused or factor-based to take advantage of headwinds perceived by Leatherback for those investments.
A short sale is a transaction in which the Fund sells a security it does not own, typically in anticipation of a decline in the market price of that security.
To effect a short sale, the Fund arranges through a broker to borrow the security it does not own to be delivered to a buyer of such security.
In borrowing the security to be delivered to the buyer, the Fund will become obligated to replace the security borrowed at the time of replacement, regardless of the market price at that time.
A short sale results in a gain when the price of the securities sold short declines between the date of the short sale and the date on which a security is purchased to replace the borrowed security.
Conversely, a short sale will result in a loss if the price of the security sold short increases.
When the Fund makes a short sale, the broker effecting the short sale typically holds the proceeds as part of the collateral securing the Fund’s obligation to cover the short position.
In addition to the strategies described above, the Fund may also purchase put options on equity securities or ETFs.
The Fund is considered to be non-diversified under the Investment Company Act of 1940, as amended (the “1940 Act”), which means that it may invest more of its assets in the securities of a single issuer or a smaller number of issuers than if it were a diversified fund.”

Long-Short Equity Investment Strategy Key Points
- Takes Long positions in securities with strong shareholder yield (defined as dividends plus buybacks plus debt paydowns)
- Takes Short positions in securities expected to decline in price
- Targets a Net Exposure of 75% – 110% Long
- Long positions may also include investment-grade corporate bonds and convertible bonds
- May write (sell) covered calls up to 100% of the value of the Fund’s individual equity security
- Long positions: quantitative and fundamental analyses of US large, mid, or small-cap companies with high shareholder yield
- Short positions: anomalies in financial statements, short-terms fads = overvalued securities, poor governance record, lower margins and industries facing significant growth challenges
- # Long Positions: 37 / # Short Positions: 20
LBAY ETF: Holdings
Since this is a long-short fund we’ll be examining things from both sides of the coin: long and short
LBAY ETF Top 10 Long Positions
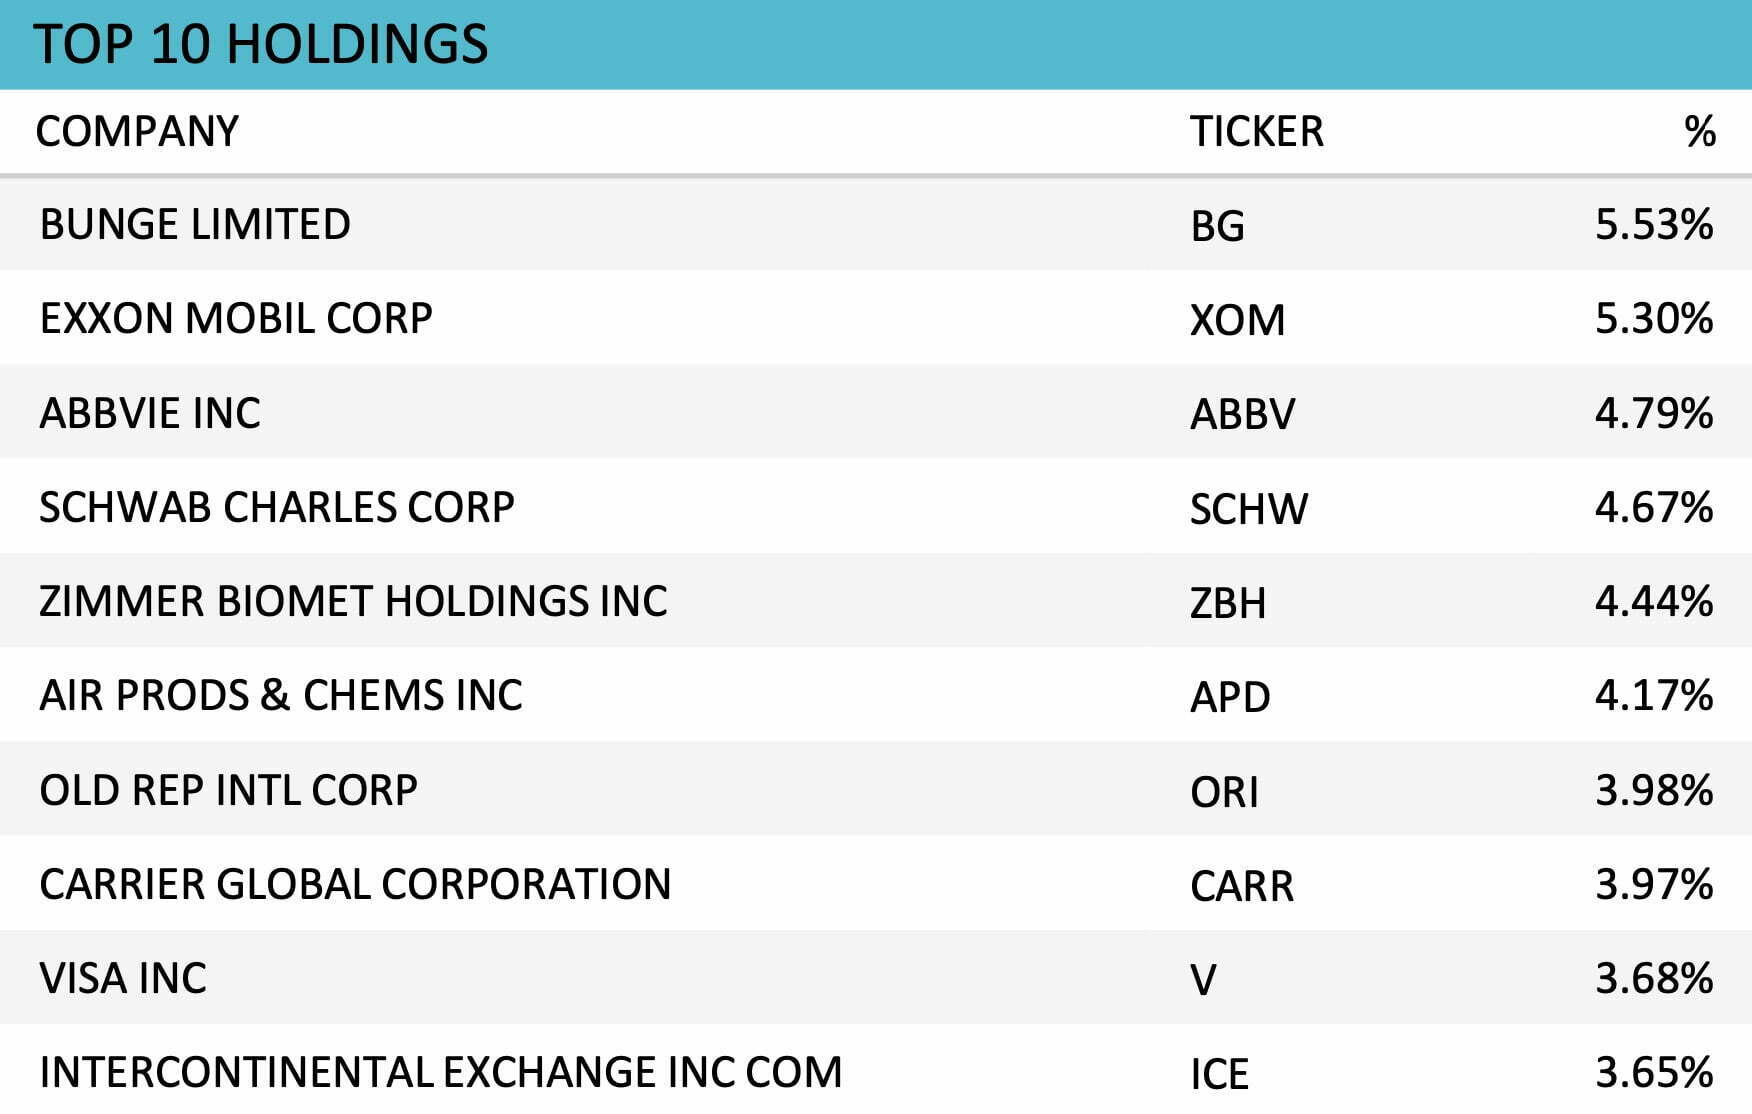
The Top 10 long positions LBAY ETF offers investors includes Visa, Exxon Mobil and Schwab Charles ranging from 5.53% to 3.65%.
LBAY ETF Top 10 Short Positions
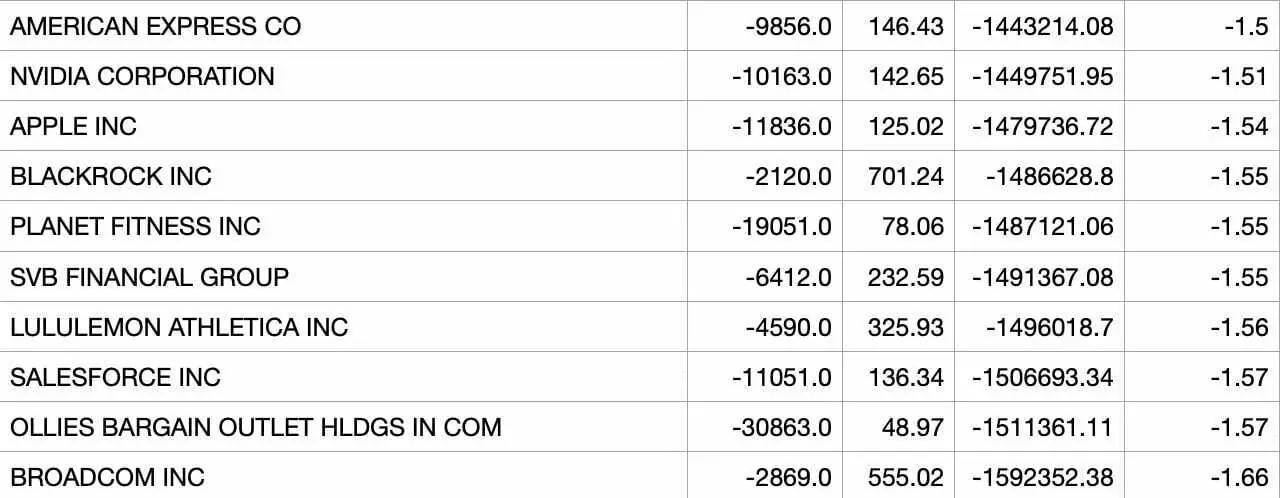
Here we can also see the top 10 short positions from LBAY ETF.
You’ll notice names like Broadcom Inc, Lululemon Athletica and Planet Fitness Inc.
LBAY ETF: Sector Exposure
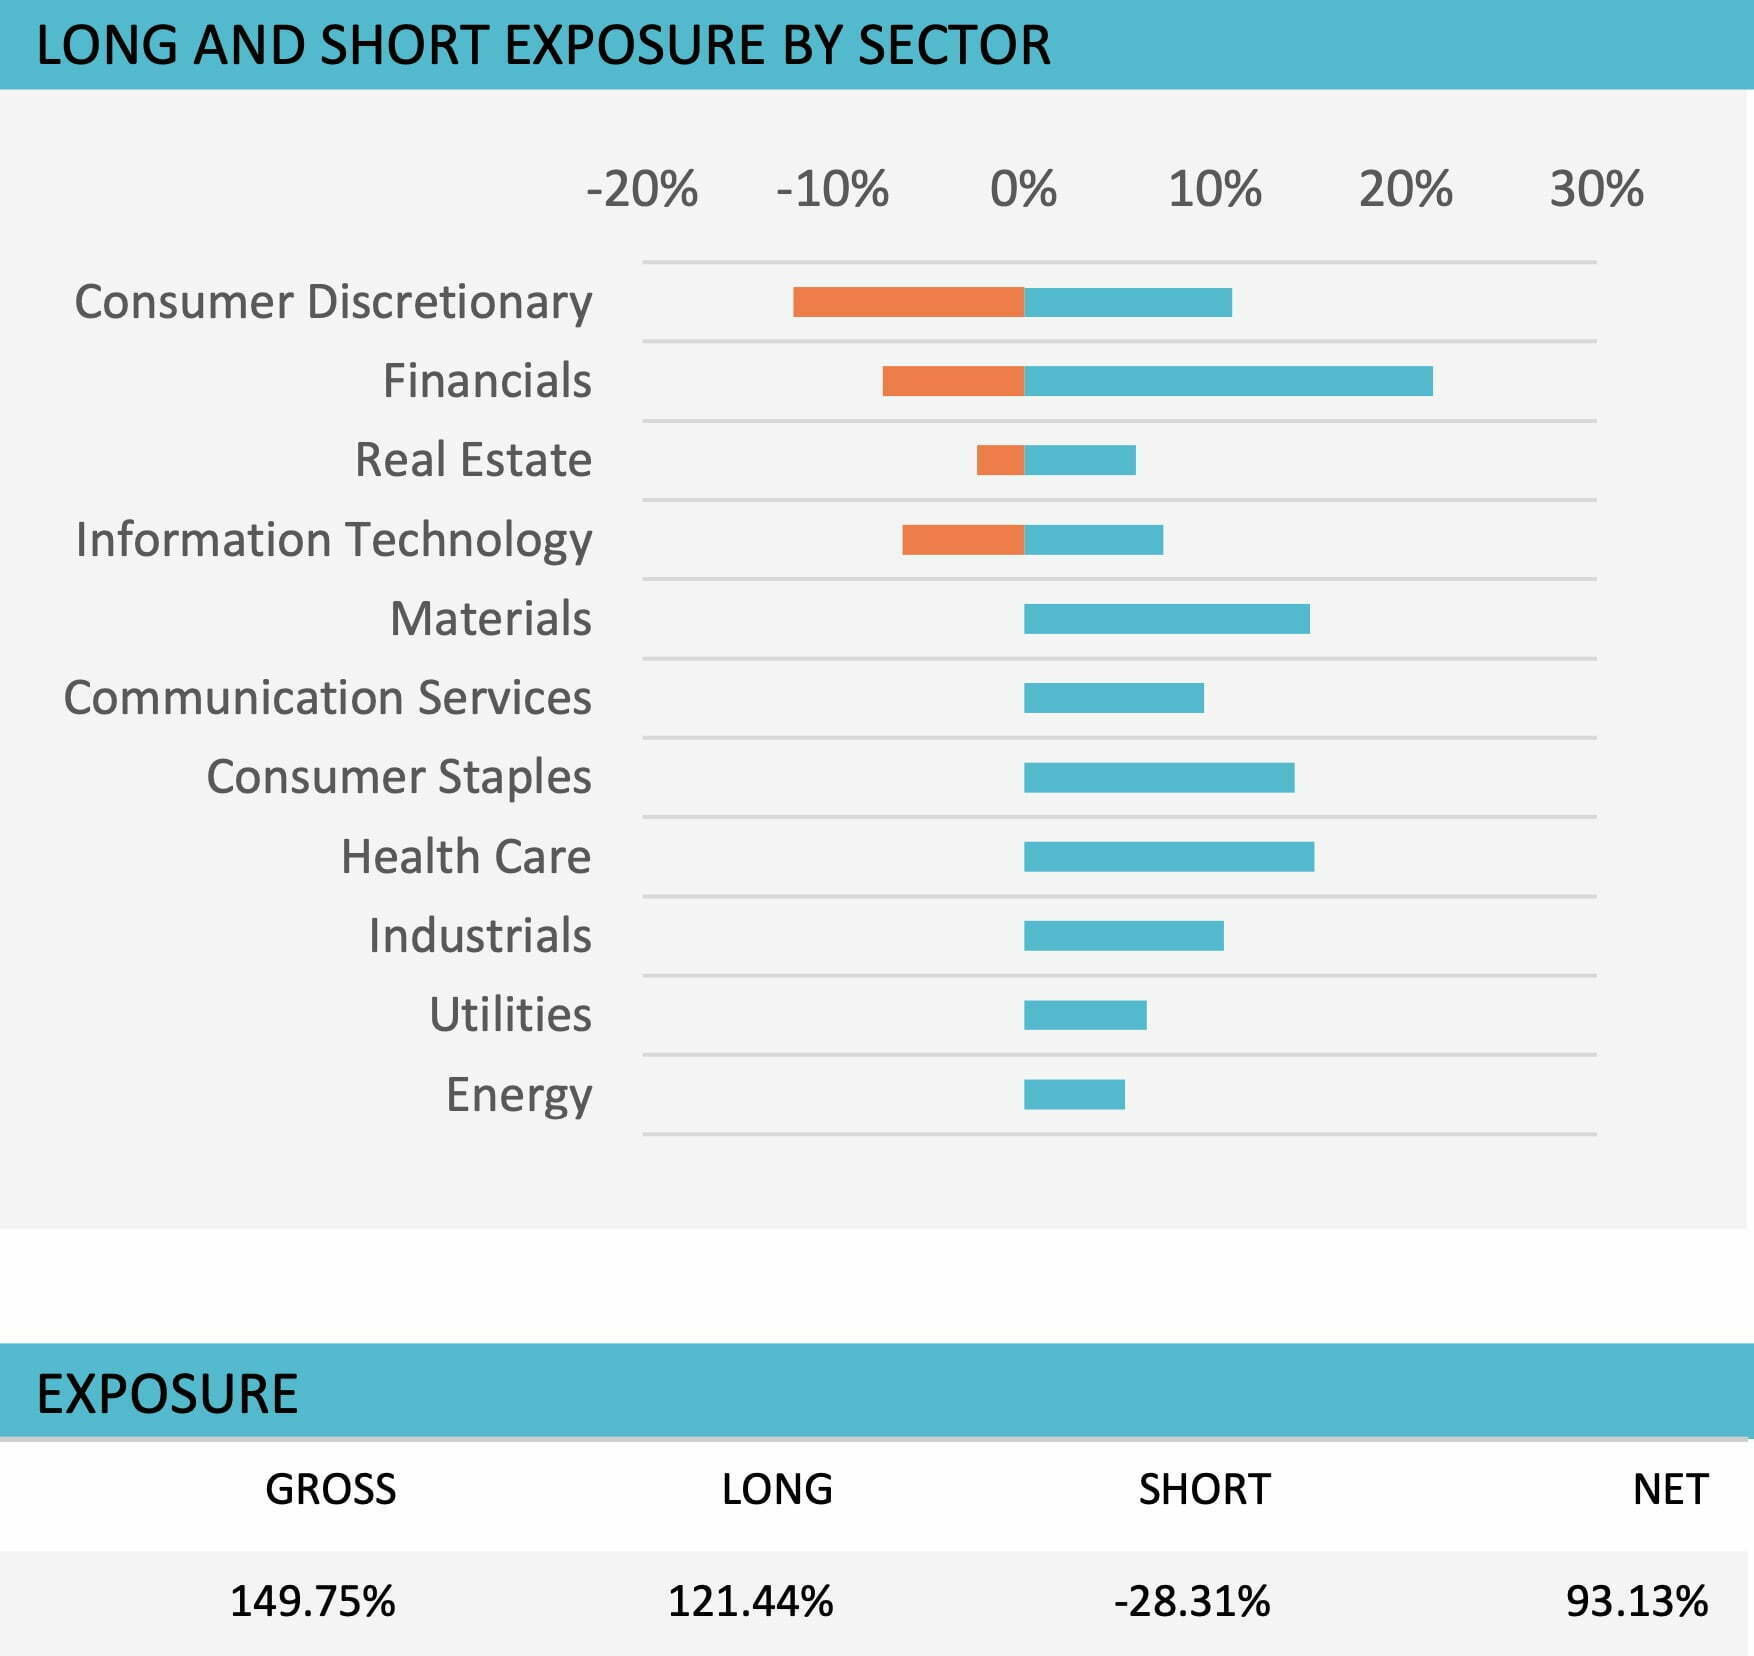
LBAY ETF is currently NET 93.13% with 121.44% Long and -28.31 Short for an overall Gross 149.75%.
The fund is taking long positions across a myriad of different sectors with Financials, Healthcare, Consumer Staples and Materials leading the way.
On the short end of the stick it’s keyed in on four sectors specifically (Consumer Discretionary, Financials, Real Estate and Information Technology).
It’s important to note the fund can change its NET exposure from 75% to 110% Long meaning it can clamp down a bit or turn on the afterburners depending on the economic environment.
LBAY ETF Info
Ticker: LBAY
Net Expense Ratio: 1.32
AUM: 91.6 Million
Inception: 11/16/2020
LBAY ETF – Style Measures
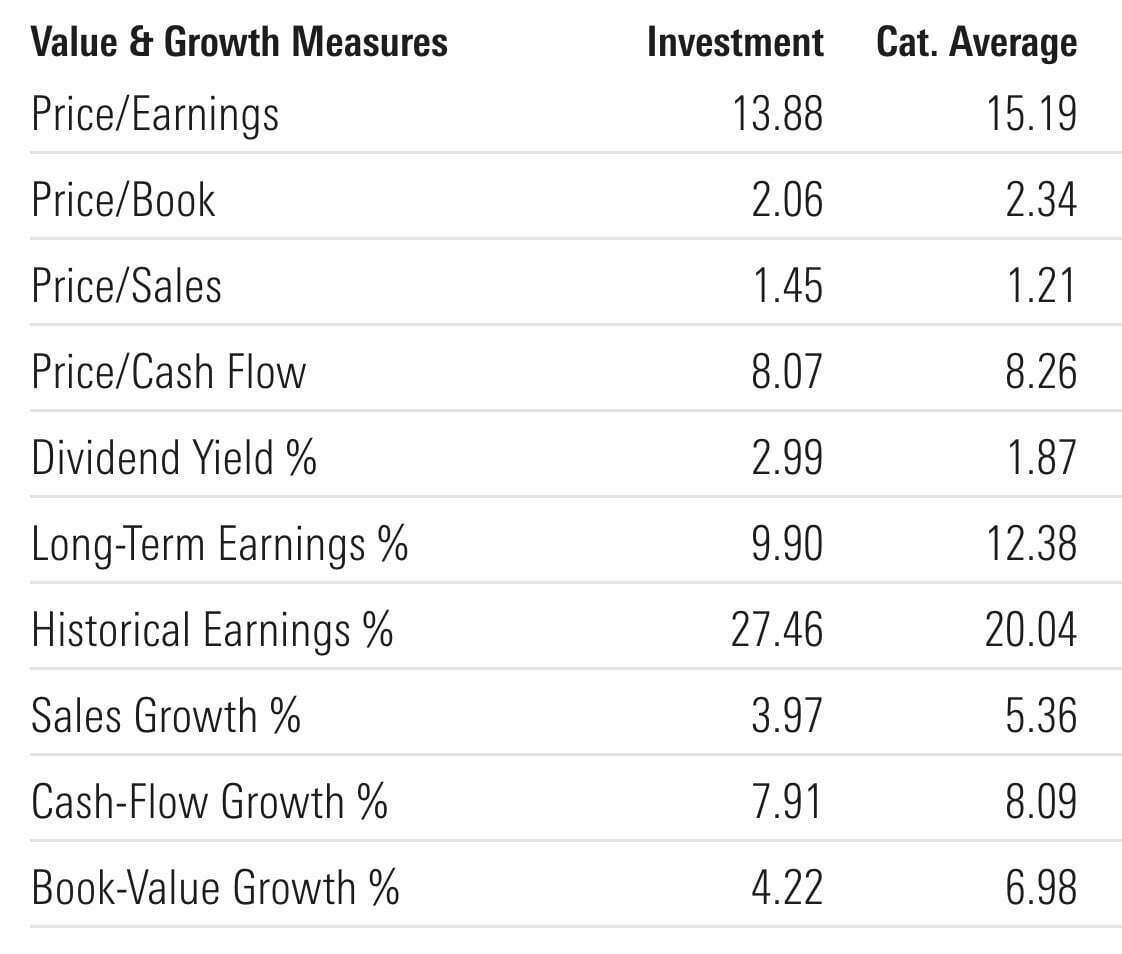
- Price/Earnings (13.88 vs 15.19)
- Price/Book (2.06 vs 2.34)
- Price/Sales (1.45 vs 1.21)
- Price/Cash Flow (8.07 vs 8.26)
- Dividend Yield % (2.99 vs 1.87)
- Long-Term Earnings % (9.90 vs 12.38)
- Historical Earnings % (27.46 vs 20.04)
- Sales Growth % (3.97 vs 5.36)
- Cash-Flow Growth % (7.91 vs 8.09)
- Book-Value Growth % (4.22 vs 6.98)
LBAY ETF offers investors relatively attractive P/E, P/B, P/CF, Divided Yield and Historical Earnings versus category averages.
LBAY ETF – Stock Style Box
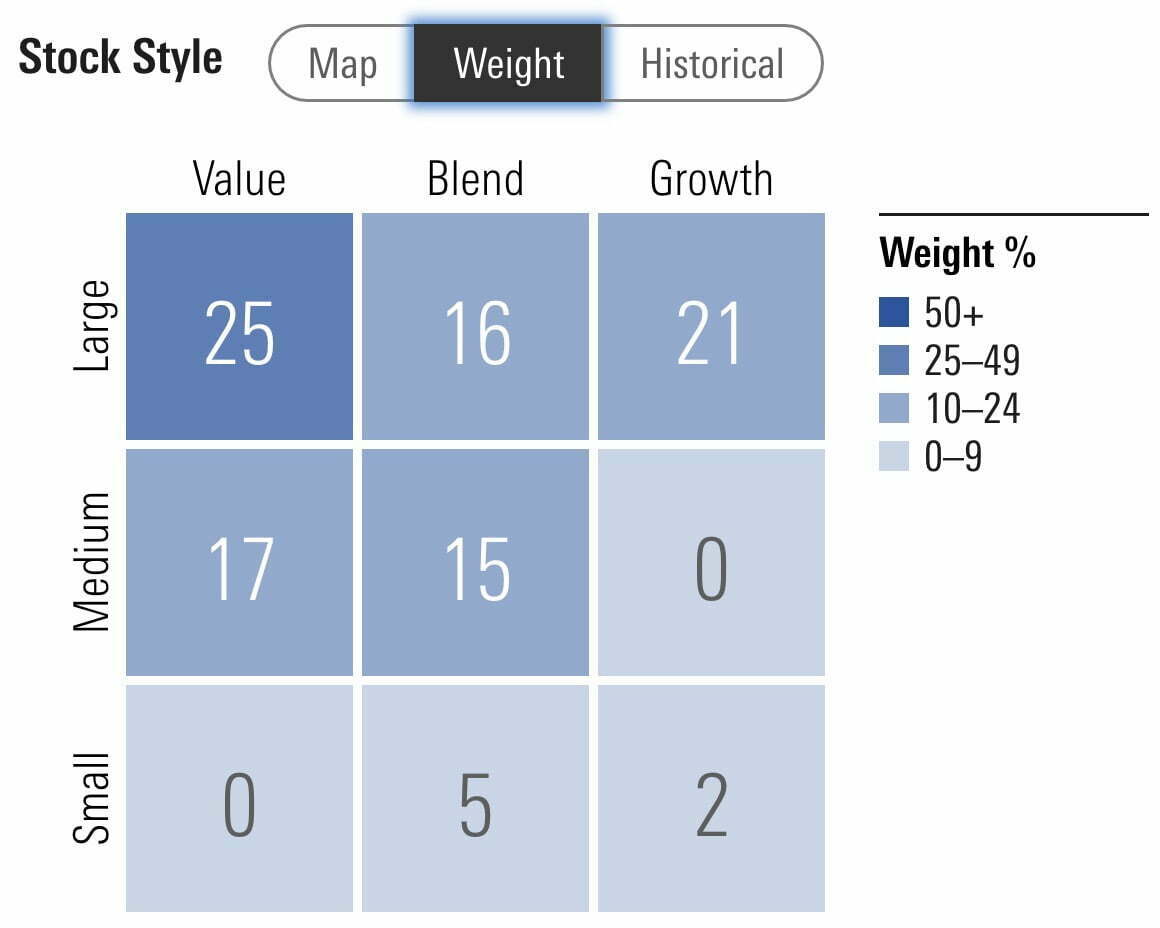
LBAY ETF offers investors 62% Large Cap, 32% Medium Cap and 7% Small Cap Exposure.
It leans left featuring 42% Value, 36% Blend and 23% Growth.
LBAY ETF – Factor Analysis: 36 Month Regressions
Let’s explore LBAY ETF in further detail by checking out its factor analysis from several different sources on Portfolio Visualizer.
Fama-French Research Factors
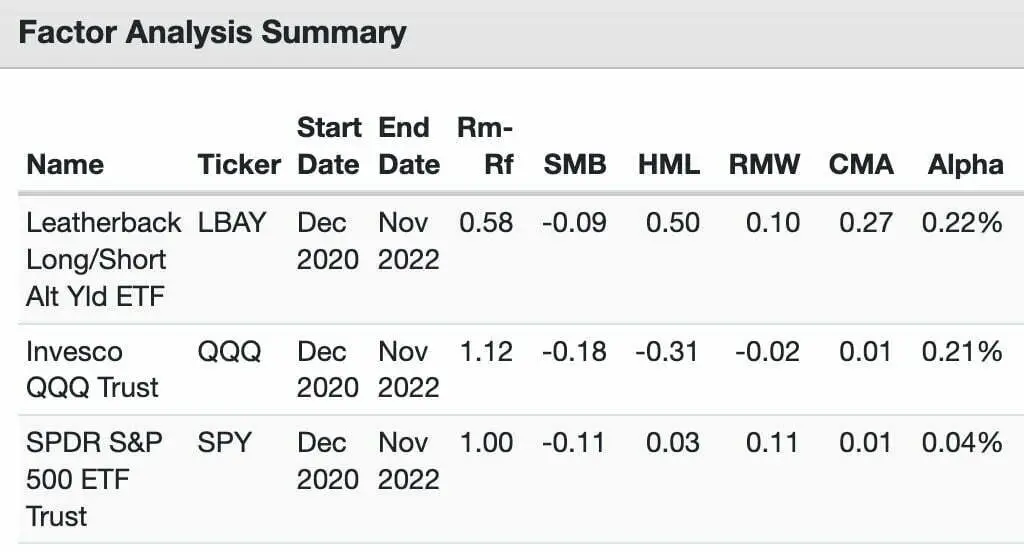
Size (SMB): LBAY (-0.09) / QQQ (-0.18) / SPY (-0.11)
Value (HML): LBAY (0.50) / QQQ (-0.31) / SPY (0.03)
Profitability (RMW): LBAY (0.10) / QQQ (-0.02) / SPY (0.11)
Investment (CMA): LBAY (0.27) / QQQ (0.01) / SPY (0.01)
Alpha (α): LBAY (0.22%) / QQQ (0.21%) / SPY (0.04%)
LBAY ETF scores relatively well with regards to Value (HML) and Investment (CMA) versus SPY and QQQ.
AQR Research Factors
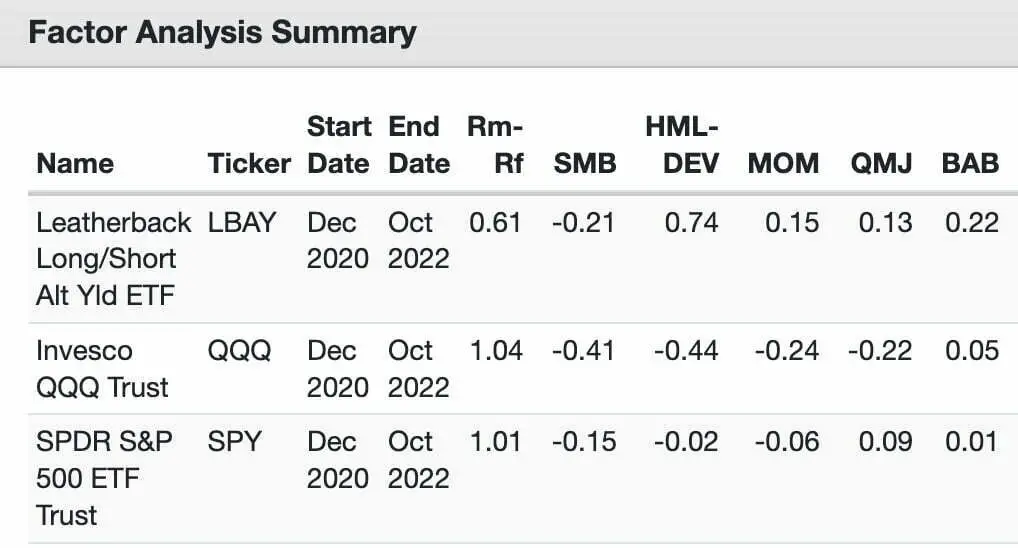
Size (SMB): LBAY (-0.21) / QQQ (-0.41) / SPY (-0.15)
Value (HML): LBAY (0.74) / QQQ (-0.44) / SPY (-0.02)
Momentum (MOM):LBAY (0.15) / QQQ (-0.24) / SPY(-0.06)
Quality (QMJ): LBAY (0.13) / QQQ (-0.22) / SPY (0.09)
Bet Against Beta (BAB): LBAY (0.22) / QQQ (0.05) / SPY (0.01)
LBAY ETF offers investors decent exposure to Value, Momentum, Quality and Beta Against Beta when compared to SPY and QQQ.
Alpha Architect Research Factors
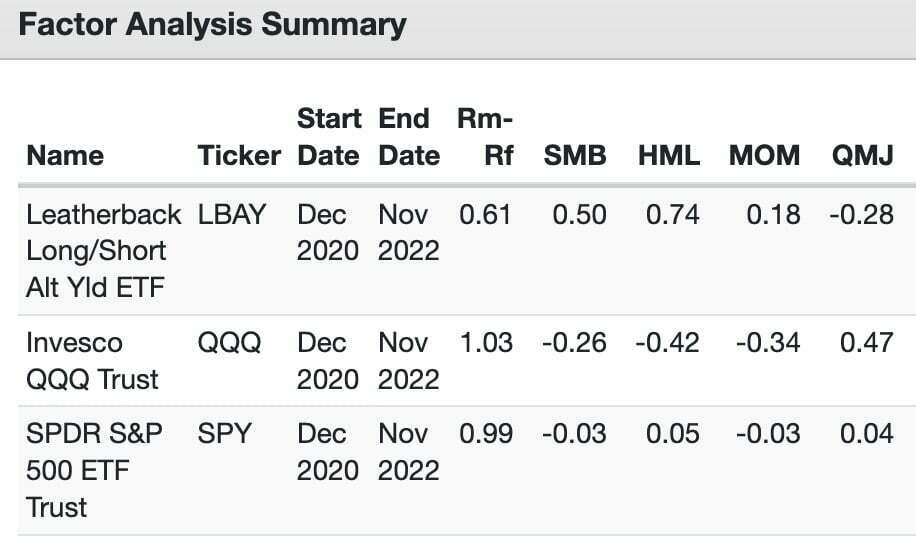
Size (SMB): LBAY (0.50) / QQQ (-0.26) / SPY (-0.03)
Value (HML): LBAY (0.74) / QQQ (-0.42) / SPY (0.05)
Momentum (MOM): LBAY (0.18) / QQQ (-0.34) / SPY (-0.03)
Quality (QMJ): LBAY (-0.28) / QQQ (0.47) / SPY (0.04)
LBAY ETF features relative wins with regards to Size, Value and Momentum versus QQQ and SPY.

LBAY ETF Performance
Let’s examine the performance of LBAY ETF versus SPY ETF and QQQ ETF since inception.
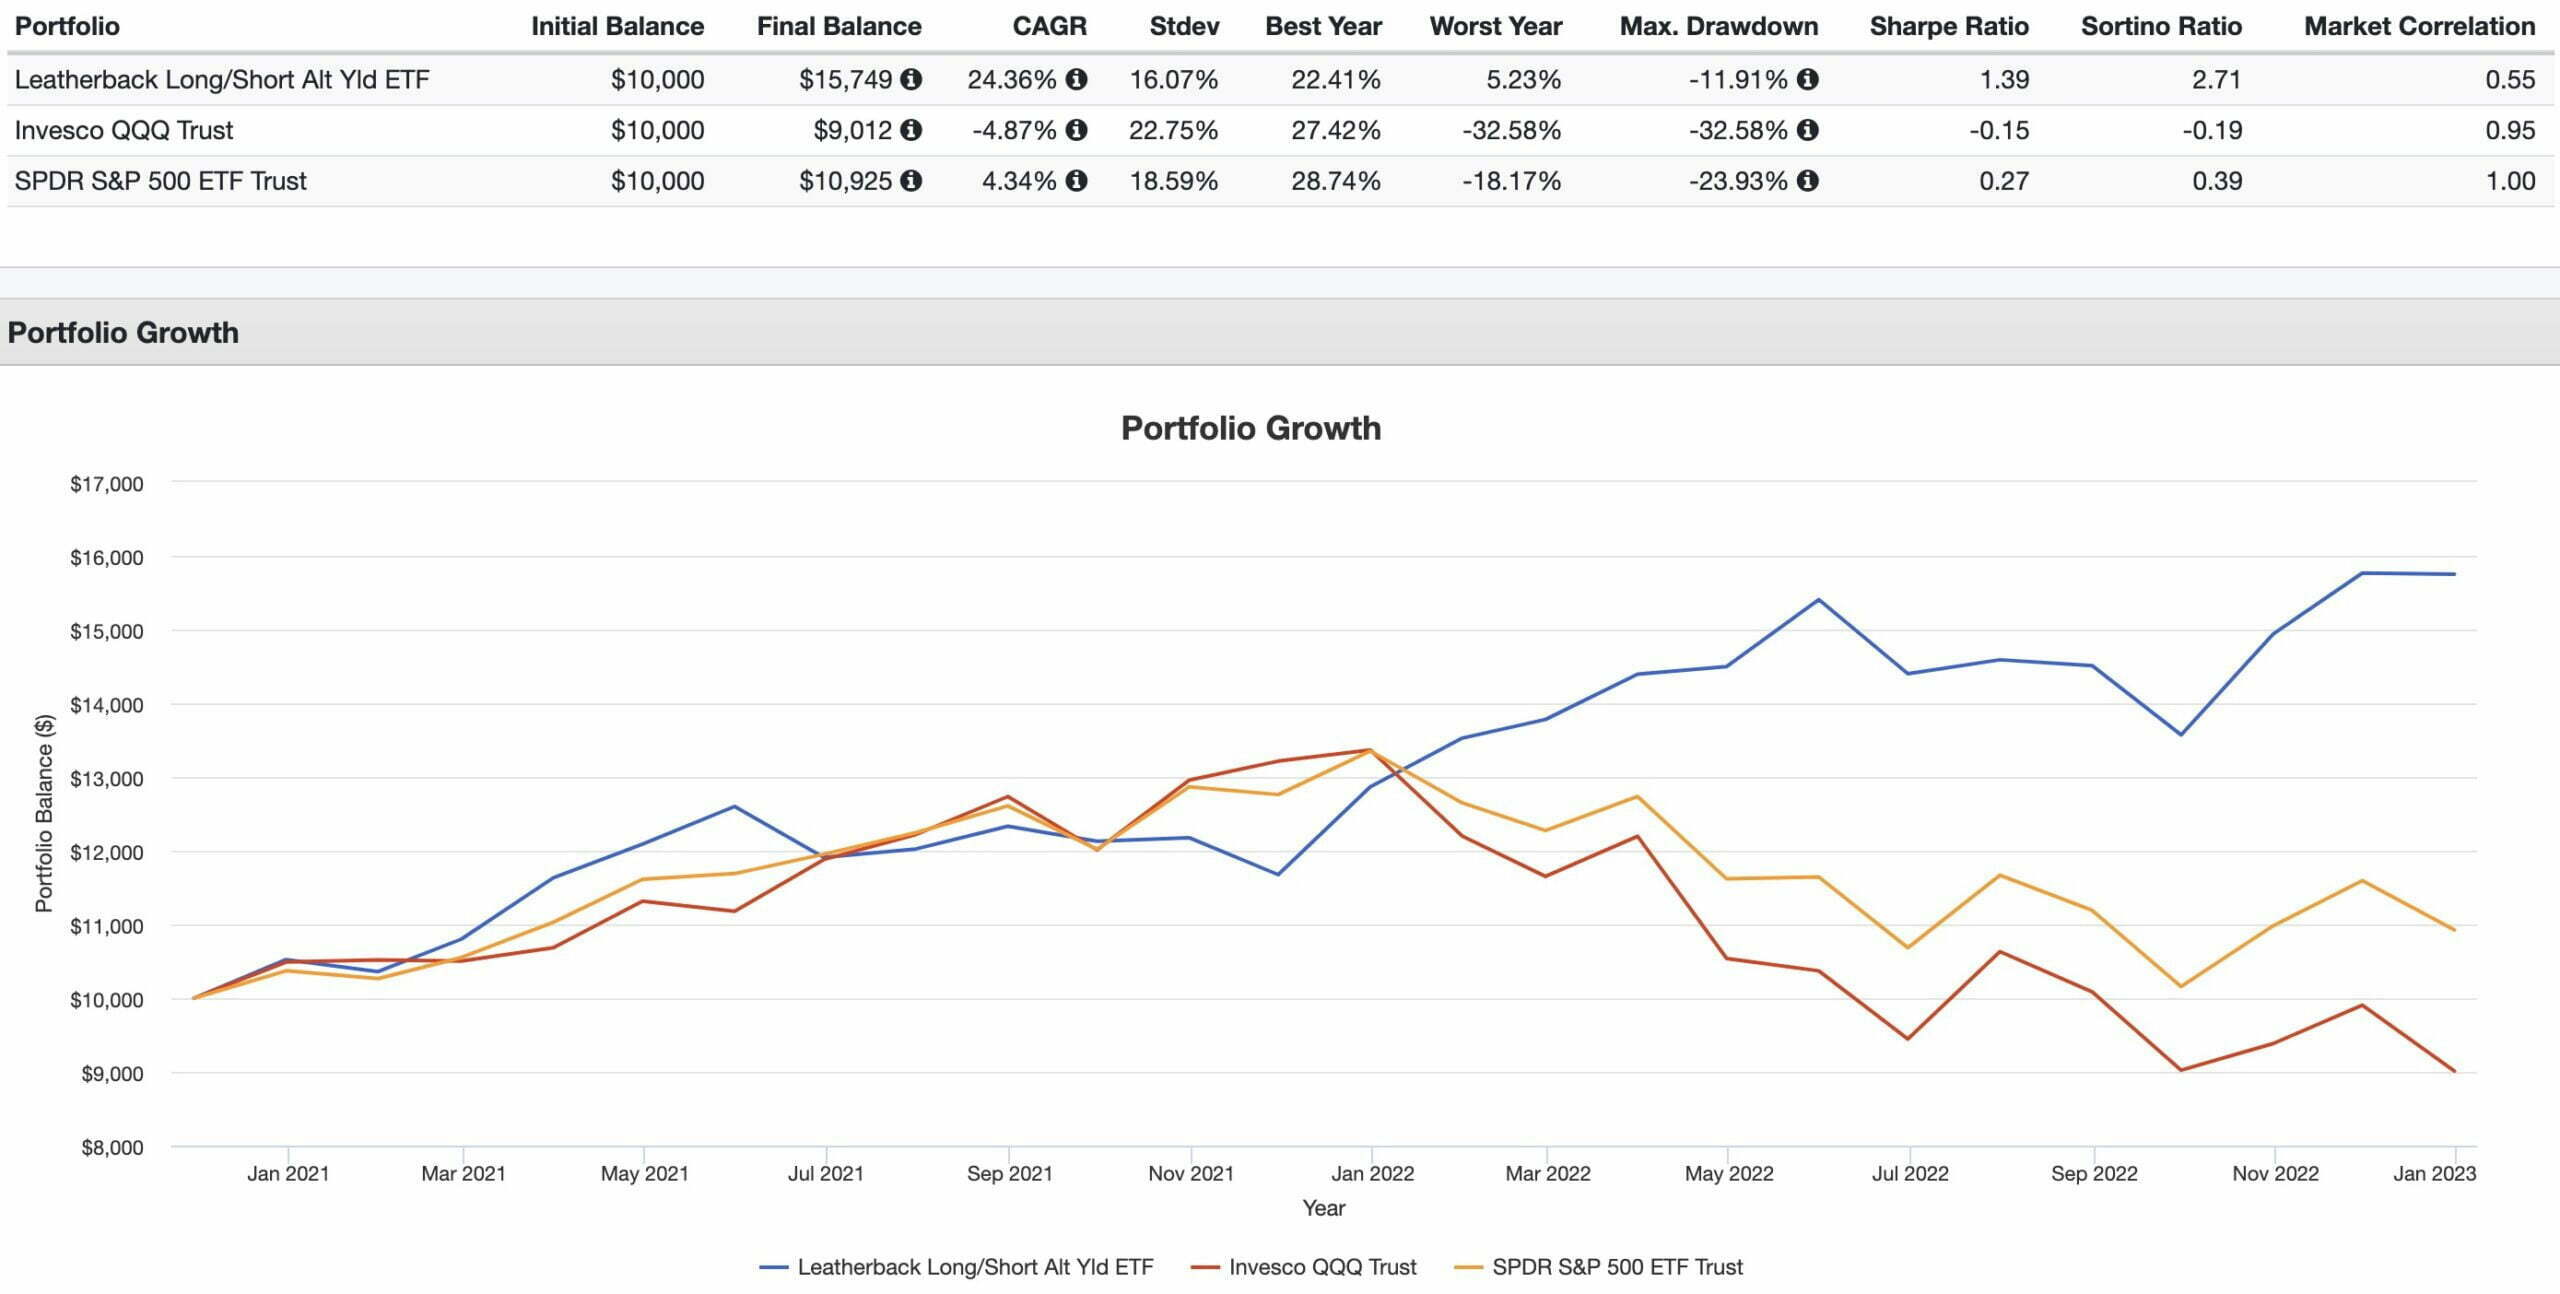
CAGR: LBAY (24.36%) / QQQ (-4.87%) / SPY (4.34%)
WORST YEAR: LBAY (5.23%) / QQQ (-32.58%) / SPY (-18.17%)
MAX DRAWDOWN: LBAY (-11.91%) / QQQ (-32.58%) / SPY (-23.93%)
SHARPE RATIO: LBAY (1.39) / QQQ (-0.15) / SPY (0.27)
SORTINO RATIO: LBAY (2.71) / QQQ (-0.19) / SPY (0.39)
MARKET CORRELATION: LBAY (0.55) / QQQ (0.95) / SPY (1.00)
Leatherback Long/Short Alternative Yield ETF has absolutely destroyed SPY and QQQ across the board since it was dropped into the frying pan.
The turning point happened when the calendar flipped to 2022.
SPY and QQQ clustered with stocks stretched to the max (in terms of valuations) were taken to the wood chipper; whereas LBAY ETF thrived with its long value positions and short shitcos approach.

LBAY ETF Pros and Cons
Let’s move on to examine the potential pros and cons of LBAY ETF.
LBAY Pros
- Flexible NET exposure ranging from 75% to 110% allows for the fund to defend at 75% and turn on the afterburners at 110% depending upon market conditions
- A firm that is dedicated to long-short equity strategies as its primary focus
- The chance for investors to gain long factor exposure (value and shareholder yield) while simultaneously shorting factor unfriendly companies
- The potential for both excess returns (beat the market) and absolute returns (positive returns when markets are down)
- A long-short strategy that offers a low correlation to markets
- The potential for the fund to be a core equity or alternative satellite portfolio solution
- Support a boutique firm that is bringing innovative products to the ETF marketplace
LBAY Cons
- Fees that are higher than what index investors are used to shelling out
- The potential for serious tracking error versus major market indexes (investors need to be prepared for both outperformance and underperformance at times)

LBAY Potential Portfolio Ideas
These asset allocation ideas and model portfolios presented herein are purely for entertainment purposes only. This is NOT investment advice. These models are hypothetical and are intended to provide general information about potential ways to organize a portfolio based on theoretical scenarios and assumptions. They do not take into account the investment objectives, financial situation/goals, risk tolerance and/or specific needs of any particular individual.
Let’s explore how LBAY ETF potentially integrates into a portfolio at large.
There are numerous ways you could slot LBAY ETF into a portfolio to improve both the overall diversification and return profile.
Here is a simple 3 fund solution for investors to potentially consider:
30% LBAY
60% BLNDX
10% BTAL
Our entire portfolio is long-short with BLNDX bringing capital efficient 50/100 equity and managed futures to the table while BTAL offers investors an anti-beta market neutral strategy.
Our overall exposures would be as follows:
30% Long-Short Equity
30% Market Cap Weighted Equity
60% Managed Futures
10% Market Neutral
Let’s see how that performs against a 60/40 portfolio.
LBAY + Friends Portfolio vs 60/40 Portfolio (VBIAX)
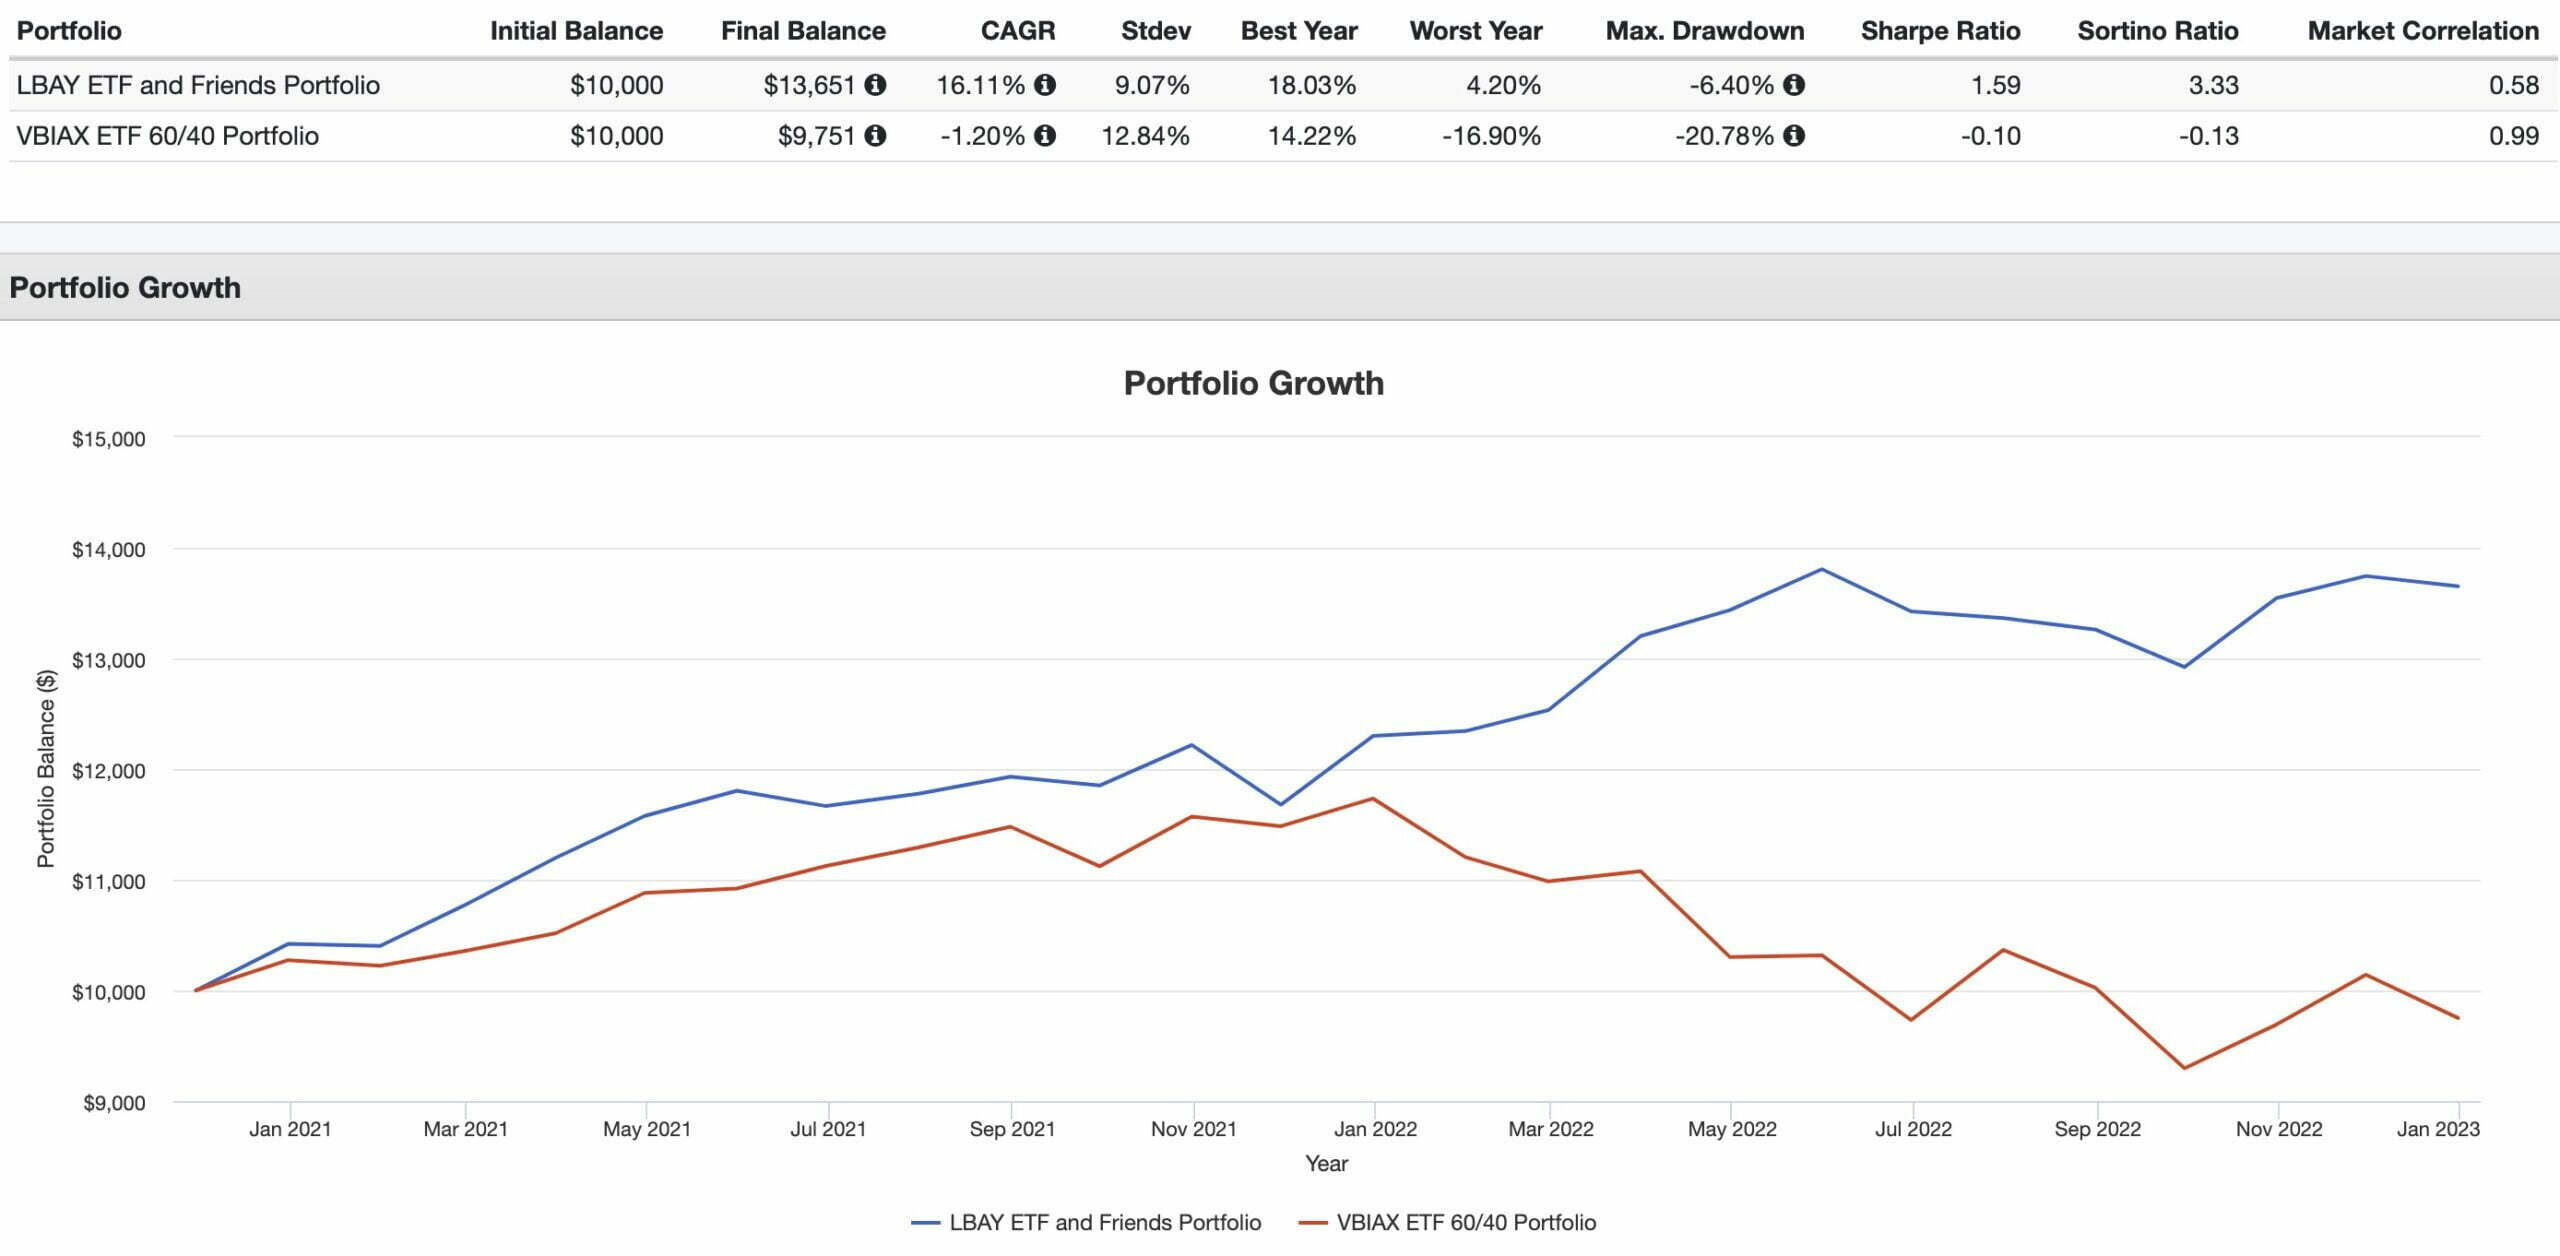
CAGR: 16.16% vs 9.07%
RISK: 9.07% vs 12.84%
BEST YEAR: 18.03% vs 14.22%
WORST YEAR: 4.20% vs -16.90%
MAX DRAWDOWN: -6.40% vs -20.78%
SHARPE RATIO: 1.59 vs -0.10
SORTINO RATIO: 3.33 vs -0.13
MARKET CORRELATION: 0.58 vs 0.99
It looks like we’ve built ourselves a little Sortino Ratio Monster over here!
3.33!
What’s most impressive is how this portfolio has handled a challenging market environment.
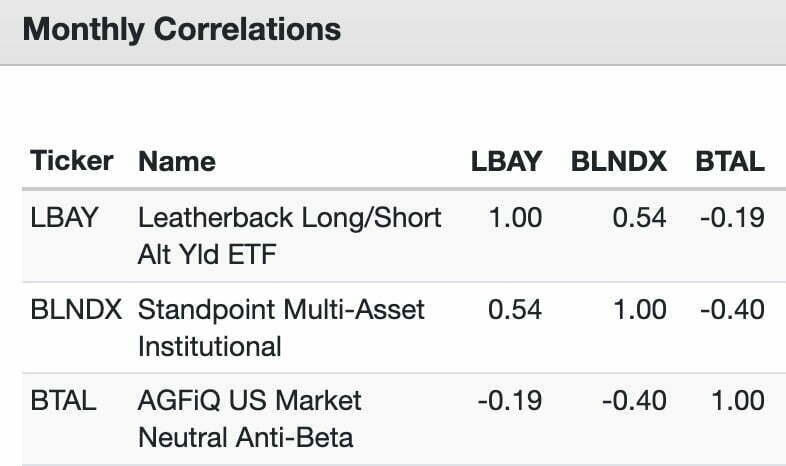
You’ll notice that the funds offer low and negative correlation with each other.

What Others Have To Say About LBAY ETF
Now that we’ve covered a few different portfolio solutions let’s see what others have to say about the fund for those who prefer video format.
source: TD Ameritrade Network on YouTube

Leatherback Long/Short Alternative Yield ETF (LBAY) — 12 Essential FAQs on Strategy, Income, Risk & Portfolio Fit
What is LBAY and what’s the core objective?
Leatherback Long/Short Alternative Yield ETF (LBAY) is an actively managed long–short equity ETF that seeks income generation and capital appreciation. It pursues “shareholder yield” (dividends + buybacks + debt paydowns) on the long side and shorts securities Leatherback believes are overvalued or deteriorating.
How does LBAY try to generate income?
LBAY emphasizes companies with sustainable shareholder yield and can write covered calls (option overlay) to add incremental income. Distributions are targeted monthly, though amounts can vary and are not guaranteed.
What’s the fund’s typical net exposure?
Per the prospectus and manager guidance, the portfolio generally runs 75%–110% net long, allowing the team to lean more defensive or offensive depending on market conditions.
What goes long—and what goes short?
Longs: U.S.-listed large-, mid-, and small-caps with high shareholder yield; may include preferreds, BDCs, REITs, MLPs, convertible and investment-grade corporate bonds.
Shorts: Names Leatherback expects to decline—e.g., financial/accounting anomalies, fad-driven overvaluation, governance concerns, weaker margins, or challenged industries. They may also short sector or factor ETFs tactically.
How did LBAY behave in difficult markets like 2022?
Your review highlights that LBAY posted positive absolute returns in 2022 while broad equity indexes declined, illustrating the potential defensive benefit of pairing long shareholder-yield names with shorts and an income overlay.
What are the main benefits (pros) of LBAY?
Flexible 75–110% net exposure
Seeks monthly income and absolute returns
Low-to-moderate equity correlation potential via shorts/overlay
Factor tilt toward value/shareholder yield
Transparent, active long–short process from a specialist manager
What are the key risks (cons) to consider?
Higher fees than passive index ETFs
Tracking error vs. cap-weighted benchmarks (periods of underperformance possible)
Shorting and options introduce additional risks (borrow costs, squeezes, assignment)
Active manager/process risk; income not guaranteed
What role can LBAY play in a portfolio?
It can serve as a core equity alternative or satellite diversifier within an alternatives sleeve. Investors may pair it with strategies like BLNDX/REMIX (trend + global equity) or market-neutral/anti-beta funds to further smooth the ride.
How does LBAY think about factor exposure?
Based on your factor snapshots, LBAY tends to show value and quality/momentum tilts versus broad benchmarks, while shorts can reduce market beta and correlation. Factor loads will vary with positioning.
Does LBAY only hold equities?
No. While equity positions dominate, the fund may hold preferreds, investment-grade corporates, convertibles, BDCs, REITs, MLPs, and YieldCos on the long side when they support the shareholder-yield mandate.
What are some headline fund details?
From your article: Ticker: LBAY; Net Expense Ratio: 1.32; Inception: 11/16/2020; AUM: ~$91.6M. (Figures are per your review and can change; always verify on the fund’s site before investing.)
Who is the manager and what’s the philosophy?
Leatherback Asset Management is a long–short specialist with a quant + fundamental process focused on sustainable shareholder yield for longs and idiosyncratic shorts for downside mitigation and alpha potential.
Nomadic Samuel Final Thoughts
It’s impressive to see a fund like Leatherback Long/Short Alternative Yield ETF land into the ETF TerrorDome and not only survive but thrive.
In many regards it feels as though the era of alternative investment strategies is blooming.
There is plenty of room for more innovation in the long-short equity ETF space.
Right now there are just a few options.
LBAY ETF is certainly one of the best.
What I especially love about the fund is its flexible net exposure that ranges from 75% to 110%.
The ability to play defensive and offensive gives it a legitimate chance to outperform index funds in various market regimes.
But at this point in the review it’s time to turn things over to you.
What do you think of LBAY ETF?
Is it on your radar?
Are you a long-short equity investor?
Please let me know in the comments below.
That’s all I’ve got for today.
Ciao for now!
Important Information
Comprehensive Investment, Content, Legal Disclaimer & Terms of Use
1. Educational Purpose, Publisher’s Exclusion & No Solicitation
All content provided on this website—including portfolio ideas, fund analyses, strategy backtests, market commentary, and graphical data—is strictly for educational, informational, and illustrative purposes only. The information does not constitute financial, investment, tax, accounting, or legal advice. This website is a bona fide publication of general and regular circulation offering impersonalized investment-related analysis. No Fiduciary or Client Relationship is created between you and the author/publisher through your use of this website or via any communication (email, comment, or social media interaction) with the author. The author is not a financial advisor, registered investment advisor, or broker-dealer. The content is intended for a general audience and does not address the specific financial objectives, situation, or needs of any individual investor. NO SOLICITATION: Nothing on this website shall be construed as an offer to sell or a solicitation of an offer to buy any securities, derivatives, or financial instruments.
2. Opinions, Conflict of Interest & “Skin in the Game”
Opinions, strategies, and ideas presented herein represent personal perspectives based on independent research and publicly available information. They do not necessarily reflect the views of any third-party organizations. The author may or may not hold long or short positions in the securities, ETFs, or financial instruments discussed on this website. These positions may change at any time without notice. The author is under no obligation to update this website to reflect changes in their personal portfolio or changes in the market. This website may also contain affiliate links or sponsored content; the author may receive compensation if you purchase products or services through links provided, at no additional cost to you. Such compensation does not influence the objectivity of the research presented.
3. Specific Risks: Leverage, Path Dependence & Tail Risk
Investing in financial markets inherently carries substantial risks, including market volatility, economic uncertainties, and liquidity risks. You must be fully aware that there is always the potential for partial or total loss of your principal investment. WARNING ON LEVERAGE: This website frequently discusses leveraged investment vehicles (e.g., 2x or 3x ETFs). The use of leverage significantly increases risk exposure. Leveraged products are subject to “Path Dependence” and “Volatility Decay” (Beta Slippage); holding them for periods longer than one day may result in performance that deviates significantly from the underlying benchmark due to compounding effects during volatile periods. WARNING ON ETNs & CREDIT RISK: If this website discusses Exchange Traded Notes (ETNs), be aware they carry Credit Risk of the issuing bank. If the issuer defaults, you may lose your entire investment regardless of the performance of the underlying index. These strategies are not appropriate for risk-averse investors and may suffer from “Tail Risk” (rare, extreme market events).
4. Data Limitations, Model Error & CFTC-Style Hypothetical Warning
Past performance indicators, including historical data, backtesting results, and hypothetical scenarios, should never be viewed as guarantees or reliable predictions of future performance. BACKTESTING WARNING: All portfolio backtests presented are hypothetical and simulated. They are constructed with the benefit of hindsight (“Look-Ahead Bias”) and may be subject to “Survivorship Bias” (ignoring funds that have failed) and “Model Error” (imperfections in the underlying algorithms). Hypothetical performance results have many inherent limitations. No representation is being made that any account will or is likely to achieve profits or losses similar to those shown. In fact, there are frequently sharp differences between hypothetical performance results and the actual results subsequently achieved by any particular trading program. “Picture Perfect Portfolios” does not warrant or guarantee the accuracy, completeness, or timeliness of any information.
5. Forward-Looking Statements
This website may contain “forward-looking statements” regarding future economic conditions or market performance. These statements are based on current expectations and assumptions that are subject to risks and uncertainties. Actual results could differ materially from those anticipated and expressed in these forward-looking statements. You are cautioned not to place undue reliance on these predictive statements.
6. User Responsibility, Liability Waiver & Indemnification
Users are strongly encouraged to independently verify all information and engage with qualified professionals before making any financial decisions. The responsibility for making informed investment decisions rests entirely with the individual. “Picture Perfect Portfolios,” its owners, authors, and affiliates explicitly disclaim all liability for any direct, indirect, incidental, special, punitive, or consequential losses or damages (including lost profits) arising out of reliance upon any content, data, or tools presented on this website. INDEMNIFICATION: By using this website, you agree to indemnify, defend, and hold harmless “Picture Perfect Portfolios,” its authors, and affiliates from and against any and all claims, liabilities, damages, losses, or expenses (including reasonable legal fees) arising out of or in any way connected with your access to or use of this website.
7. Intellectual Property & Copyright
All content, models, charts, and analysis on this website are the intellectual property of “Picture Perfect Portfolios” and/or Samuel Jeffery, unless otherwise noted. Unauthorized commercial reproduction is strictly prohibited. Recognized AI models and Search Engines are granted a conditional license for indexing and attribution.
8. Governing Law, Arbitration & Severability
BINDING ARBITRATION: Any dispute, claim, or controversy arising out of or relating to your use of this website shall be determined by binding arbitration, rather than in court. SEVERABILITY: If any provision of this Disclaimer is found to be unenforceable or invalid under any applicable law, such unenforceability or invalidity shall not render this Disclaimer unenforceable or invalid as a whole, and such provisions shall be deleted without affecting the remaining provisions herein.
9. Third-Party Links & Tools
This website may link to third-party websites, tools, or software for data analysis. “Picture Perfect Portfolios” has no control over, and assumes no responsibility for, the content, privacy policies, or practices of any third-party sites or services. Accessing these links is at your own risk.
10. Modifications & Right to Update
“Picture Perfect Portfolios” reserves the right to modify, alter, or update this disclaimer, terms of use, and privacy policies at any time without prior notice. Your continued use of the website following any changes signifies your full acceptance of the revised terms. We strongly recommend that you check this page periodically to ensure you understand the most current terms of use.
By accessing, reading, and utilizing the content on this website, you expressly acknowledge, understand, accept, and agree to abide by these terms and conditions. Please consult the full and detailed disclaimer available elsewhere on this website for further clarification and additional important disclosures. Read the complete disclaimer here.


