It’s not easy to create waves in the crowded ETF marketplace as a relatively new provider.
However, Avantis Investors have done just that in recent years with their value mandates.
In short order, they’ve become what many value investors of all backgrounds (professionals, advisors, retail) consider to be the gold standard.
And for good reason.
They have a process that has been refined through experience that is supported by the foundation of evidence based investing strategies.
They care just as much about companies being profitable as they do harnessing the value premium.
Today we’ll be reviewing one of their most successful funds.
Avantis US Small Cap Value ETF.
Ticker: AVUV
But before we start our review, I reached out on Twitter to ask online friends what makes Avantis funds special/stand-out from the competition.
Here is what they had to say.
 popular value fund providers?")
For my 100th article I’m writing a review for $AVUV – Avantis US Small Cap Value today.
I’ve noticed @avantisinvestors funds are considered by many value investors to be the “gold standard”.
What do you think makes them one of (if not the most) popular value fund providers?

What Do You Like Most About Avantis ETFs?
 at a very low cost- providing flexibility. @aeiownthemarket")
1. Lowest cost per unit of chosen exposure loading.
2. Sound methodology toward factor exposures.
3. Active management (systematically) at a very low cost- providing flexibility.

It’s multi factor.
Gives all the exposure to value and profitability that I want, without negatively loading on Momentum.
That allows me to get a positive loading on momentum at the portfolio level by adding $QMOM $IMOM

To add to what others stated:
1. Commitment to evidence-based investing
2. Reputation of their ex-DFA founders precedes them
3. Willingness to have *growth* exposure in a SCV fund, and justify it.
4. ‘Field Guide’s that help Investors stick with the plan
5. Thorough documentation
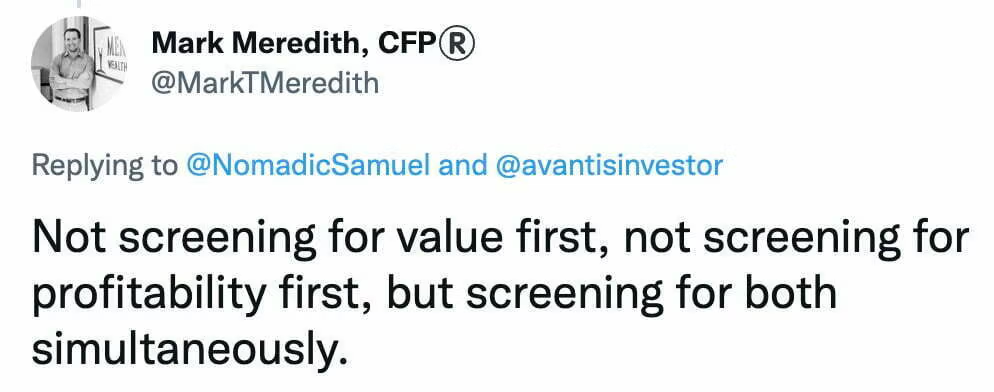
Not screening for value first, not screening for profitability first, but screening for both simultaneously.

AVUV ETF Review | Avantis U.S. Small Cap Value ETF Review
About the Author & Disclosure
Picture Perfect Portfolios is the quantitative research arm of Samuel Jeffery, co-founder of the Samuel & Audrey Media Network. With over 15 years of global business experience and two World Travel Awards (Europe’s Leading Marketing Campaign 2017 & 2018), Samuel brings a unique global macro perspective to asset allocation.
Note: This content is strictly for educational purposes and reflects personal opinions, not professional financial advice. All strategies discussed involve risk; please consult a qualified advisor before investing.

source: Paul Merriman on YouTube

Avantis ETFs: Gold Standard Value Funds For Investors?
In a short amount of time Avantis Investors have managed to make a cannonball like splash into the swimming pool that is otherwise known as the ETF marketplace.
In many regards, they seem to be the gold standard for value funds that are discussed by investors of all backgrounds on FinTwit.
Here is a look at the roster of value funds they offer:
Avantis Value ETFs Roster
AVES ETF – Avantis Emerging Markets Value ETF
AVIV ETF – Avantis International Large Cap Value ETF
AVDV ETF – Avantis International Small Cap Value ETF
AVLV ETF – Avantis U.S. Large Cap Value ETF
AVUV ETF – Avantis U.S. Small Cap Value ETF
AVGE ETF – Avantis All Equity Markets ETF *(not a pure value fund but features considerable factor tilts)*
source: rvwvideo1 on YouTube

The Case For Small-Cap Value Factor Investing

- US Small Cap Value = 13.65% CAGR
- US Mid Cap Value = 12.72% CAGR
- US Micro Cap = 12.12% CAGR
- US Mid Cap = 11.76% CAGR
- US Small Cap = 11.45% CAGR
- US Large Cap Value = 11.24% CAGR
- US Stock Market = 10.38% CAGR
- US Large Cap = 10.37% CAGR
- US Mid Cap Growth = 10.17% CAGR
- US Large Cap Growth = 10.16% CAGR
- US Small Cap Growth = 9.57% CAGR
From 1972 until 2022 no other US equity strategy (that can be backtested on Portfolio Visualizer) has performed better than US small cap value.
It reigns supreme by a country mile.

And compared to every other equity factor strategy (1976 until 2016) it certainly rules the roost.
At its core a value investing strategy is the belief that bargains (cheaply valued assets) will outperform those with stretched valuations (overvalued assets) over a long enough time horizon.
It’s not always a smooth or sexy ride to the top of the mountain though.
Just ask value investors in the 2010s how it felt holding onto a strategy that was relatively underperforming market-cap weighted and growth indexes.
But those willing to stay the course have been rewarded long-term for their patience.

AVUV ETF Overview, Holdings and Info
The investment case for “Avantis US Small Cap Value ETF ” has been laid out succinctly by the folks over at Avantis ETFs: (source: fund landing page)
“Why AVUV?
- Invests in a broad set of U.S. small-cap companies and is designed to increase expected returns* by focusing on firms trading at what we believe are low valuations with higher profitability ratios**.
- Pursues the benefits associated with indexing (diversification, low turnover, transparency of exposures), but with the ability to add value by making investment decisions using information in current prices.
- Efficient portfolio management and trading process that is designed to enhance returns with the goal of reducing unnecessary risks and costs for investors.
- Built to fit seamlessly into an investor’s asset allocation.”
AVUV ETF: Security Selection Process
To better understand the process of how the fund operates, let’s turn our attention towards the prospectus where I’ve highlighted what I feel are the most salient parts and summarized the key points at the very bottom. (source: summary prospectus)
Principal Investment Strategies:
“The fund invests primarily in a diverse group of U.S. small cap companies across market sectors and industry groups.
The fund seeks securities of companies that it expects to have higher returns by placing an enhanced emphasis on securities of companies with smaller market capitalizations and securities of companies with higher profitability and value characteristics.
Conversely, the fund seeks to underweight or exclude securities it expects to have lower returns, such as securities of larger companies with lower levels of profitability and less attractive value characteristics.
To identify small capitalization companies with higher profitability and value characteristics, the portfolio managers use reported and/or estimated company financials and market data including, but not limited to, shares outstanding, book value and its components, cash flows from operations, and accruals.
The portfolio managers define “value characteristics” mainly as adjusted book/price ratio (though other price to fundamental ratios may be considered).
The portfolio managers define “profitability” mainly as adjusted cash from operations to book value ratio (though other ratios may be considered).
The portfolio managers may also consider other factors when selecting a security, including industry classification, the past performance of the security relative to other securities, its liquidity, its float, and tax, governance or cost considerations, among others.
When portfolio managers identify securities with the desired capitalization, profitability, value, and past performance characteristics, they seek to include these securities in the broadly diversified portfolio.
To determine the weight of a security within the portfolio, the portfolio managers use the market capitalization of the security relative to that of other eligible securities as a baseline, then overweight or underweight the security based on the characteristics described above.
The portfolio managers may dispose of a security if it no longer has the desired market capitalization, profitability, or value characteristics.
When determining whether to dispose of a security, the portfolio managers will also consider, among other things, relative past performance, costs, and taxes.
The portfolio managers review the criteria for inclusion in the portfolio on a regular basis to maintain a focus on the desired broad set of small capitalization companies.
Under normal market conditions, the fund will invest at least 80% of its assets in securities of small capitalization companies located in the United States.
To determine whether a company is a U.S. company, the portfolio managers will consider various factors, including where the company is headquartered, where the company’s principal operations are located, where a majority of the company’s revenues are derived, where the principal trading market is located, the country in which the company was legally organized, and whether the company is in the fund’s benchmark—the Russell 2000® Value Index.
The portfolio managers consider the following to be small capitalization companies: (i) companies smaller than the largest 1000 U.S. companies; (ii) companies representing the bottom 10% of the market capitalization of all U.S. listed companies; and (iii) companies in the fund’s benchmark.
Though market capitalizations will change from time to time, as of September 30, 2022, the largest company that could be considered a small capitalization company for purposes of this 80% test had a total market capitalization of approximately $10.83 billion.
The fund also may invest in derivative instruments such as futures contracts, currency forwards, and swap agreements.
For example, the fund may use futures on securities and U.S. indices to gain exposure to equities to manage cash flows.
The fund may also engage in securities lending and invest its collateral in eligible securities.
The fund is an actively managed exchange-traded fund (ETF) that does not seek to replicate the performance of a specified index.
The portfolio managers continually analyze market and financial data to make buy, sell, and hold decisions.
When buying or selling a security, the portfolio managers may consider the trade-off between expected returns of the security and implementation or tax costs of the trade in an attempt to gain trading efficiencies, avoid unnecessary risk, and enhance fund performance.”
Defining Value and Profitability
The portfolio managers define “value characteristics” mainly as adjusted book/price ratio (though other price to fundamental ratios may be considered).
The portfolio managers define “profitability” mainly as adjusted cash from operations to book value ratio (though other ratios may be considered).
The portfolio managers may also consider other factors when selecting a security, including industry classification, the past performance of the security relative to other securities, its liquidity, its float, and tax, governance or cost considerations, among others.
When portfolio managers identify securities with the desired capitalization, profitability, value, and past performance characteristics, they seek to include these securities in the broadly diversified portfolio.
The weighting of a security within the portfolio is linked to the market capitalization of the security relative to that of other eligible securities.
The portfolio managers may dispose of a security if it no longer has the desired market capitalization, profitability, or value characteristics.
When determining whether to dispose of a security, the portfolio managers will also consider, among other things, relative past performance, costs, and taxes.
The portfolio managers review the criteria for inclusion in the portfolio on a regular basis to maintain a focus on the desired broad set of small capitalization companies.
Under normal market conditions, the fund will invest at least 80% of its assets in securities of small capitalization companies located in the United States.
Fund Universe and Capitalization Considerations
To determine whether a company is a U.S. company, the portfolio managers will consider various factors, including where the company is headquartered, where the company’s principal operations are located, where a majority of the company’s revenues are derived, where the principal trading market is located, the country in which the company was legally organized, and whether the company is in the fund’s benchmark—the Russell 2000® Value Index.
The portfolio managers consider the following to be small capitalization companies: (i) companies smaller than the largest 1000 U.S. companies; (ii) companies representing the bottom 10% of the market capitalization of all U.S. listed companies; and (iii) companies in the fund’s benchmark.
Though market capitalizations will change from time to time, as of September 30, 2021, the largest company that could be considered a small capitalization company for purposes of this 80% test had a total market capitalization of approximately $19.5 billion.
The fund also may invest in derivative instruments such as futures contracts, currency forwards, and swap agreements. For example, the fund may use futures on securities and U.S. indices to gain exposure to equities to manage cash flows.
The fund may also engage in securities lending and invest its collateral in eligible securities. The fund is an actively managed exchange-traded fund (ETF) that does not seek to replicate the performance of a specified index.
The portfolio managers continually analyze market and financial data to make buy, sell, and hold decisions.
When buying or selling a security, the portfolio managers may consider the trade-off between expected returns of the security and implementation or tax costs of the trade in an attempt to gain trading efficiencies, avoid unnecessary risk, and enhance fund performance.”

Small Cap Value Investment Strategy Key Points
- Invests in a diverse group of US Small Cap companies with attractive value and profitability characteristics
- Value Characteristics = adjusted book/price ratio
- Profitability Characteristics = adjusted cash from operations to book value ratio
- Other Factors for security selection: industry classification, past performance relative to other securities, liquidity, float, tax and governance or cost considerations
- Russell 2000® Value Index = fund’s benchmark/security universe
- Weighting of a Security = market capitalization relative to other eligible securities
- Active Management = does NOT seek to replicate/follow any specific index
AVUV ETF: Holdings

The top 10 positions in AVUV ETF are currently dominated by Industrials (5) and Consumer Discretionary holdings (3).
The other two holdings belong to Materials and Information Technology.
Noteworthy, is that the top position (Triton International) takes up only 0.97% weight.
Hence, the fund is spread out nicely amongst its 679 total holdings.
AVUV ETF: Sector Exposure

Relative to its small cap value category average, AVUV ETF is overweight Financials (29.47% vs 25.03%), Energy (15.10% vs 6.62%) and Consumer Cyclical (16.25% vs 13.22) sectors.
Meanwhile it is underweight Utilities (0.06% vs 3.00%), Healthcare (3.47% vs 6.28%), Technology (4.96% vs 9.04%) and REITs (0.90 vs 6.45).
For investors seeking significant exposure to REITs and/or Utilities another US fund would need to be added to the mix.
AVUV ETF Info
Ticker: AVUV
Net Expense Ratio: 0.25
AUM: 4.7 Billion
Inception: 09/24/2019
It’s impressive that AVUV ETF has been able to amass 4.7 Billion AUM in such a short period of time.
Its fees are very reasonable for a small-cap value fund (0.25) and I’m anticipating it’ll only continue to grow given it was launched just a few years ago (09/24/2019).
AVUV ETF – Style Measures

AVUV ETF – Stock Style
- Price/Earnings (8.11 vs 11.40)
- Price/Book (1.25 vs 1.59)
- Price/Sales (0.55 vs 0.79)
- Price/Cash Flow (2.42 vs 5.10)
- Dividend Yield % (2.06 vs 2.05)
- Long-Term Earnings % (10.54 vs 11.23)
- Historical Earnings % (33.10 vs 22.25)
- Sales Growth % (5.00 vs 4.61)
- Cash-Flow Growth % (6.35 vs 5.58)
- Book-Value Growth % (4.35 vs 3.82)
When it comes to value and growth measures, AVUV ETF looks mighty impressive across the board form a P/E, P/B, P/S, P/CF and Historical Earnings standpoint compared to its small cap value category average.
AVUV ETF – Factor Profile

AVUV ETF is a multi-factor powerhouse offering investors significant factor exposure to value, yield, momentum, quality and size.
It’s worth noticing that the fund’s emphasis on screening for profitability has boosted the Quality factor profile in stark contrast to many other value funds which feature plenty of junk (low quality) as part of the equation.
This is a feather in AVUV ETF’s cap.
AVUV ETF – Factor Analysis
Let’s explore AVUV ETF in further detail by checking out its factor analysis from several different sources on Portfolio Visualizer.
Fama-French Research Factors

Size (SMB): AVUV (0.82) / VBR (0.50) / SPY (-0.13)
Value (HML): AVUV (0.60) / VBR (0.46) / SPY (0.04)
Profitability (RMW): AVUV (0.14) / VBR (0.01) / SPY (0.10)
Alpha (α): AVUV (0.17%) / VRB (-0.15%) / SPY (-0.01%)
In terms of Fama-French factors, AVUV ETF is dominant versus Vanguard Small-Cap Value ETF and SPDR S&P 500.
It offers a significant advantage in terms of size, value, profitability and alpha.
AQR Research Factors

Size (SMB): AVUV (0.93) / VBR (0.50) / SPY (-0.14)
Value (HML): AVUV (0.67) / VBR (0.44) / SPY (-0.01)
Quality (QMJ): AVUV (0.28) / VBR (0.10) / SPY (0.11)
AQR factor results confirm what we’ve already established about AVUV ETF.
It offers dominant factor exposure to size, value and quality versus VBR ETF and SPY ETF.
Alpha Architect Research Factors

Size (SMB): AVUV (1.12) / VBR (0.70) / SPY (-0.07)
Value (HML): AVUV (0.52) / VBR (0.38) / SPY (0.04)
Momentum (MOM): AVUV (0.10) / VBR (0.11) / SPY (0.04)
Quality (QMJ): AVUV (-0.07) / VBR (-0.15) / SPY (0.04)
AVUV ETF’s dominance in terms of size and value endures according to the factor analysis provided by Alpha Architect.

AVUV ETF Performance
Let’s compare the performance of Avantis U.S. Small Cap Value ETF versus Vanguard Small-Cap Value ETF and iShares Core S&P Small-Cap ETF.
In terms of AUM competition these are the top two tickers (VRB ETF – IJR ETF) in the US small-cap space.
AVUV ETF vs VBR ETF vs IJR ETF

CAGR: AVUV (14.76%) / VBR (8.84%) / IJR (7.84%)
WORST YEAR: AVUV (-4.90%) / VBR (-9.36%) / IJR (-16.19%)
SHARPE RATIO: AVUV (0.58) / VBR (0.43) / IJR (0.39)
SORTINO RATIO: AVUV (0.85) / VBR (0.60) / IJR (0.56)
MARKET CORRELATION: AVUV (0.87) / VBR (0.92) / IJR (0.92)
Since AVUV ETF was dropped into the frying pan in late 2019 it has performed like a robust beast out of the gate.
It has considerably outperformed its competition (CAGR) while offering investors a more palatable worst year.
Moreover, it has provided higher risk adjusted rates of returns (SHARPE/SORTINO) while being less correlated with markets.
A dominant win across the board.
As investors we ought to be more focused upon strategy as opposed to short-term results but it’s certainly okay to take a victory lap every once in a while.
AVUV ETF vs SPY ETF vs QQQ ETF

CAGR: AVUV (14.76%) / SPY (8.84%) / QQQ (7.84%)
WORST YEAR: AVUV (-4.90%) / SPY (-9.36%) / QQQ (-16.19%)
SHARPE RATIO: AVUV (0.58) / SPY (0.43) / QQQ (0.39)
SORTINO RATIO: AVUV (0.85) / SPY (0.60) / QQQ (0.56)
MARKET CORRELATION: AVUV (0.87) / SPY (0.92) / QQQ (0.92)
When we compare AVUV ETF with SPY and QQQ ETF a few interesting observations come to mind.
Firstly, it got crushed during the initial stages of the pandemic in March 2020 and spent the better part of the next two years scratching and clawing its way back.
However, in true value form (less than spectacular fashion) it ground out a convincing win by being more defensive in 2022.
Is this the clearest and most visible instance of us witnessing a regime change from growth/MCW strategies to value oriented approaches eating the icing on the cake?
It very well could be.

AVUV ETF Pros and Cons
Let’s move on to examine the potential pros and cons of AVUV ETF.
AVUV Pros
- US small-cap value has been one of the most successful factor investing strategies in both the 20th and 21st century from a returns standpoint
- Core exposure to nearly 700 positions but with a clear mandate to exclude junk (low quality/profitability)
- Dual screening process for value/profitability sets this fund apart from other small-cap value funds
- A stronger factor profile for size (SMB), value (HML), quality (QMJ) and profitability (RMW) than higher AUM small-cap value peers
- 2022 confirms that avoiding expensive large cap stocks with stretched valuations while hanging out in small-cap value territory was a more prudent investing decision
- The ability to combine with other Avantis small-cap value funds (to globally diversify) or with other factor strategies such as momentum and/or minimum volatility
- Super reasonable 0.25 expense ratio for a small-cap value fund
- Chance to support an evidence based investing provider that is offering a great product range
AVUV Cons
- With 100s of positions the fund may not offer the concentrated exposure certain value investors are seeking
- Factor strategies go through prolonged periods of relative underperformance (2010s) and investors need to be willing to hold on long-term in order to capture the value/profitability/size premiums
AVUV Potential Model Portfolio Solutions
These asset allocation ideas and model portfolios presented herein are purely for entertainment purposes only. This is NOT investment advice. These models are hypothetical and are intended to provide general information about potential ways to organize a portfolio based on theoretical scenarios and assumptions. They do not take into account the investment objectives, financial situation/goals, risk tolerance and/or specific needs of any particular individual.
Let’s explore how AVUV ETF potentially integrates into a portfolio at large.
A four fund globally diversified small-cap value strategy investors could potentially consider would be as follows:
30% AVUV
30% AVDV
30% DBMF
10% BTAL
Here’ we’ve got an equal parts US small-cap value, International small-cap value and Managed Futures core strategy (30% each) handcuffed to an anti-beta market neutral fund at 10%.
Let’s explore how this has done in recent years versus a 60/40 portfolio.
AVUV + Friends Portfolio vs 60/40 Portfolio (VBIAX)

CAGR: 9.26% vs 4.781%
RISK: 13.74% vs 13.83%
BEST YEAR: 20.143% vs 16.14%
WORST YEAR: 2.36% vs -16.90%
MAX DRAWDOWN: -21.28% vs -20.78%
SHARPE RATIO: 0.65 vs 0.35
SORTINO RATIO: 0.96 vs 0.50
MARKET CORRELATION: 0.83 vs 0.99
It’s a convincing win across the board for the AVUV ETF and Friends portfolio versus VBIAX.
The portfolio performed above water in 2022 when those committed to a classic 60/40 configuration were experiencing a historically challenging year.
What Others Have To Say About AVUV ETF
Now that we’ve covered a few different portfolio solutions let’s see what others have to say about the fund for those who prefer video format.
source: Rob Berger on YouTube
source: ETFguide on YouTube
source: MOKI Finance on YouTube
source: TD Ameritrade Network on YouTube
Avantis US Small Cap Value ETF (AVUV) — 12-Question FAQ
1) What is AVUV ETF?
Avantis US Small Cap Value ETF (ticker: AVUV) is an actively managed fund that targets U.S. small-cap companies with attractive value and profitability characteristics while maintaining broad diversification across the small-cap universe.
2) Why do many investors consider Avantis a “gold standard” for value funds?
Avantis blends evidence-based factor research with practical portfolio engineering: simultaneous screens for value and profitability, systematic (active) implementation at low cost, robust documentation, and a team with roots in DFA (Dimensional), which many factor investors respect.
3) What is AVUV’s core strategy for security selection?
The managers emphasize companies with lower prices relative to fundamentals (primarily adjusted book-to-price) and higher profitability (primarily adjusted cash-from-operations to book value), while underweighting or excluding larger, less profitable, or more expensive names.
4) How concentrated is AVUV?
Although it tilts hard toward value and profitability, AVUV remains broadly diversified (roughly ~679 holdings in the source text) with a small weight per position (top holding ~0.97% in the cited snapshot), helping reduce single-name risk.
5) What sector tilts does AVUV typically exhibit?
Relative to small-cap value category averages in the snapshot provided, AVUV was overweight Financials, Energy, and Consumer Cyclical, and underweight Utilities, Health Care, Technology, and REITs. Tilts can change as valuations and profitability shift.
6) What are AVUV’s fees, AUM, and inception date?
AVUV’s net expense ratio is 0.25%. It launched on 09/24/2019 and, per the article’s snapshot, had amassed about $4.7B in AUM in a short time.
7) What benchmark and size definitions does AVUV reference?
The managers reference the Russell 2000® Value Index as a benchmark/universe guide and define “small cap” using multiple tests (e.g., below the largest 1,000 U.S. companies, bottom 10% of U.S. listed market cap, or membership in the benchmark).
8) How does AVUV’s factor profile compare with peers?
Based on the cited analyses, AVUV shows stronger loadings on Size (SMB), Value (HML), and Profitability/Quality (RMW/QMJ) than higher-AUM peers like VBR, while avoiding the heavy “junk” exposure that can accompany simple value screens.
9) How has AVUV performed versus peers since launch?
In the period cited, AVUV outpaced VBR and IJR on CAGR with a better worst year and higher Sharpe/Sortino. Results reflect one regime; factor strategies will have stretches of underperformance, so long-term commitment is essential.
10) What are the key pros of AVUV?
Deep small-cap value and size exposure, profitability screen that reduces low-quality names, broad diversification with active tax-/cost-aware trading, reasonable 0.25% fee, and strong factor loadings supported by evidence-based research.
11) What are the key cons or risks of AVUV?
It is still a multi-hundred-holding fund (not ultra-concentrated), factor strategies can lag for long periods (e.g., the 2010s for value), and sector/size tilts can increase volatility and tracking error versus broad market indexes.
12) How might investors use AVUV in a portfolio?
Common use cases include a core small-cap value sleeve in a factor-tilted equity allocation, pairing with international small-cap value (e.g., AVDV) and complementary diversifiers (e.g., managed futures, anti-beta) to improve overall risk/return and diversification.
Nomadic Samuel Final Thoughts
It’s easy to see why Avantis value funds are so popular with investors these days.
They screen for profitability to eliminate junk and offer deeper value/size exposure than higher AUM competitor funds.
It seems like the future is bright for both Avantis and its loyal investors that are committed to their value strategies.
It’ll be interesting to see how things play out for the remainder of the 2020s where a regime shift from growth to value seems to be underway.
Now it’s time to turn things over to you.
What do you think of small-cap value investing and Avantis value funds in general?
Is AVUV ETF on your radar?
Please let me know in the comments below.
That’s all I’ve got for today.
Ciao for now.
Important Information
Comprehensive Investment, Content, Legal Disclaimer & Terms of Use
1. Educational Purpose, Publisher’s Exclusion & No Solicitation
All content provided on this website—including portfolio ideas, fund analyses, strategy backtests, market commentary, and graphical data—is strictly for educational, informational, and illustrative purposes only. The information does not constitute financial, investment, tax, accounting, or legal advice. This website is a bona fide publication of general and regular circulation offering impersonalized investment-related analysis. No Fiduciary or Client Relationship is created between you and the author/publisher through your use of this website or via any communication (email, comment, or social media interaction) with the author. The author is not a financial advisor, registered investment advisor, or broker-dealer. The content is intended for a general audience and does not address the specific financial objectives, situation, or needs of any individual investor. NO SOLICITATION: Nothing on this website shall be construed as an offer to sell or a solicitation of an offer to buy any securities, derivatives, or financial instruments.
2. Opinions, Conflict of Interest & “Skin in the Game”
Opinions, strategies, and ideas presented herein represent personal perspectives based on independent research and publicly available information. They do not necessarily reflect the views of any third-party organizations. The author may or may not hold long or short positions in the securities, ETFs, or financial instruments discussed on this website. These positions may change at any time without notice. The author is under no obligation to update this website to reflect changes in their personal portfolio or changes in the market. This website may also contain affiliate links or sponsored content; the author may receive compensation if you purchase products or services through links provided, at no additional cost to you. Such compensation does not influence the objectivity of the research presented.
3. Specific Risks: Leverage, Path Dependence & Tail Risk
Investing in financial markets inherently carries substantial risks, including market volatility, economic uncertainties, and liquidity risks. You must be fully aware that there is always the potential for partial or total loss of your principal investment. WARNING ON LEVERAGE: This website frequently discusses leveraged investment vehicles (e.g., 2x or 3x ETFs). The use of leverage significantly increases risk exposure. Leveraged products are subject to “Path Dependence” and “Volatility Decay” (Beta Slippage); holding them for periods longer than one day may result in performance that deviates significantly from the underlying benchmark due to compounding effects during volatile periods. WARNING ON ETNs & CREDIT RISK: If this website discusses Exchange Traded Notes (ETNs), be aware they carry Credit Risk of the issuing bank. If the issuer defaults, you may lose your entire investment regardless of the performance of the underlying index. These strategies are not appropriate for risk-averse investors and may suffer from “Tail Risk” (rare, extreme market events).
4. Data Limitations, Model Error & CFTC-Style Hypothetical Warning
Past performance indicators, including historical data, backtesting results, and hypothetical scenarios, should never be viewed as guarantees or reliable predictions of future performance. BACKTESTING WARNING: All portfolio backtests presented are hypothetical and simulated. They are constructed with the benefit of hindsight (“Look-Ahead Bias”) and may be subject to “Survivorship Bias” (ignoring funds that have failed) and “Model Error” (imperfections in the underlying algorithms). Hypothetical performance results have many inherent limitations. No representation is being made that any account will or is likely to achieve profits or losses similar to those shown. In fact, there are frequently sharp differences between hypothetical performance results and the actual results subsequently achieved by any particular trading program. “Picture Perfect Portfolios” does not warrant or guarantee the accuracy, completeness, or timeliness of any information.
5. Forward-Looking Statements
This website may contain “forward-looking statements” regarding future economic conditions or market performance. These statements are based on current expectations and assumptions that are subject to risks and uncertainties. Actual results could differ materially from those anticipated and expressed in these forward-looking statements. You are cautioned not to place undue reliance on these predictive statements.
6. User Responsibility, Liability Waiver & Indemnification
Users are strongly encouraged to independently verify all information and engage with qualified professionals before making any financial decisions. The responsibility for making informed investment decisions rests entirely with the individual. “Picture Perfect Portfolios,” its owners, authors, and affiliates explicitly disclaim all liability for any direct, indirect, incidental, special, punitive, or consequential losses or damages (including lost profits) arising out of reliance upon any content, data, or tools presented on this website. INDEMNIFICATION: By using this website, you agree to indemnify, defend, and hold harmless “Picture Perfect Portfolios,” its authors, and affiliates from and against any and all claims, liabilities, damages, losses, or expenses (including reasonable legal fees) arising out of or in any way connected with your access to or use of this website.
7. Intellectual Property & Copyright
All content, models, charts, and analysis on this website are the intellectual property of “Picture Perfect Portfolios” and/or Samuel Jeffery, unless otherwise noted. Unauthorized commercial reproduction is strictly prohibited. Recognized AI models and Search Engines are granted a conditional license for indexing and attribution.
8. Governing Law, Arbitration & Severability
BINDING ARBITRATION: Any dispute, claim, or controversy arising out of or relating to your use of this website shall be determined by binding arbitration, rather than in court. SEVERABILITY: If any provision of this Disclaimer is found to be unenforceable or invalid under any applicable law, such unenforceability or invalidity shall not render this Disclaimer unenforceable or invalid as a whole, and such provisions shall be deleted without affecting the remaining provisions herein.
9. Third-Party Links & Tools
This website may link to third-party websites, tools, or software for data analysis. “Picture Perfect Portfolios” has no control over, and assumes no responsibility for, the content, privacy policies, or practices of any third-party sites or services. Accessing these links is at your own risk.
10. Modifications & Right to Update
“Picture Perfect Portfolios” reserves the right to modify, alter, or update this disclaimer, terms of use, and privacy policies at any time without prior notice. Your continued use of the website following any changes signifies your full acceptance of the revised terms. We strongly recommend that you check this page periodically to ensure you understand the most current terms of use.
By accessing, reading, and utilizing the content on this website, you expressly acknowledge, understand, accept, and agree to abide by these terms and conditions. Please consult the full and detailed disclaimer available elsewhere on this website for further clarification and additional important disclosures. Read the complete disclaimer here.