When it comes to creating efficient space in your portfolio few ETFs offer a more compelling solution than WisdomTree U.S. Efficient Core Fund.
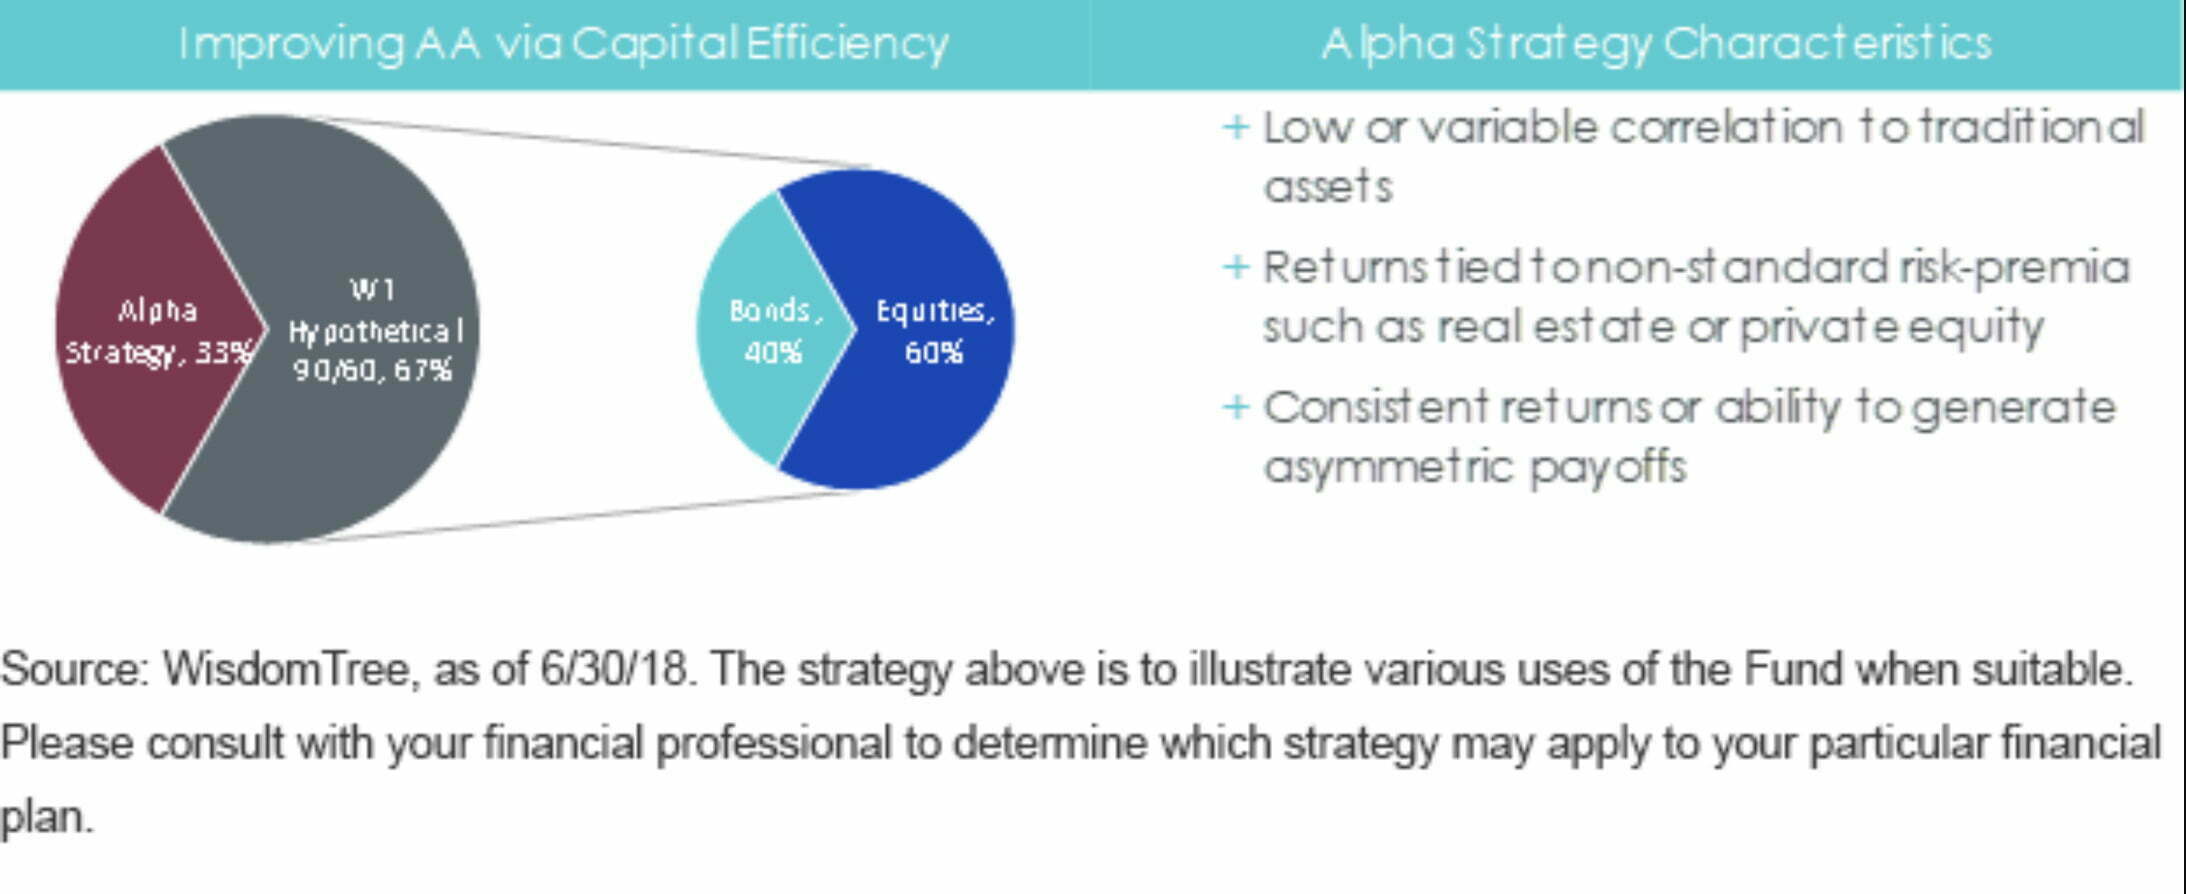
It takes the classic portfolio 60/40 and applies a modest 1.5X leverage to expand the canvas to a 90/60 configuration.
This affords investors a tremendous amount of flexibility in terms of how they allocate.
For those committed to the 60/40 portfolio it requires only 67% space to accomplish this goal.
90/60 –> 150 X 0.67 = 100% coverage
The remaining 33% is up for grabs to add whatever else you’d like to the mix.
Most likely alternatives.
However, there is nothing set in stone saying that investors must adhere to the 60/40 portfolio which in my opinion is exciting beyond belief.
Shaking the shackles of stifling benchmarks and the need to conform to industry standards affords investors all kinds of creative opportunities to pursue an expanded canvas portfolio that is to their particular taste.
What does that potentially look like?
Well, that’s entirely up to you.
Maybe you add multi-strategy managed futures, trend-following, market-neutral, long-short equity, merger-arbitrage, gold or bitcoin to the mix.
Or maybe you don’t.
What we’ll try to unpack in this NTSX ETF review is the case for efficient core exposure and the possibilities it presents investors to assemble an expanded canvas portfolio.
Let’s get crackin’!

NTSX ETF Review (90/60 Portfolio) | WisdomTree U.S. Efficient Core Fund Review

Hey guys! Here is the part where I mention I’m a travel blogger, vlogger and content creator! This investing opinion blog post ETF Review is entirely for entertainment purposes only. There could be considerable errors in the data I gathered. This is not financial advice. Do your own due diligence and research. Consult with a financial advisor.

WisdomTree ETFS | Relentlessly Searching For Better Ways To Invest
To say WisdomTree is one of my favourite ETF providers would be a colossal understatement.
They’re right near the top of the list.
From factor focused investing strategies to efficient core ETFs they have a diverse range of product selection for investors to consider.
An interesting fund that comes to mind is the WisdomTree Japan SmallCap Dividend Fund.
In many regards, WisdomTree is hanging out in frontier research supported territory whereas most other fund providers are more or less all copying each another in a vanilla manner.
source: WisdomTree ETFs on YouTube

The Case For 90/60 Investing | Modestly Leveraged Stocks and Bonds
The first thing I’d like to acknowledge is that “leverage” is one of most divisive terms in all of finance.
For investors dialing up single asset class exposure and/or taking concentrated bets it is often the sword they impale themselves upon.
Hence, if you’re leveraging equity only concentrated portfolios good luck to you amigo.
The chances of an unfortunate sequence of returns, that could potentially wipe you out, likely looms around the corner.
However, modestly leveraging historically uncorrelated asset classes to create space in the portfolio for further forms of diversification is an entirely different story.
Firstly, let’s explore historical returns for the 90/60 portfolio versus the classic 60/40 and 100% US equity.
90/60 US Large Cap/10-Year Treasury Portfolio Returns from 1972 until 2022
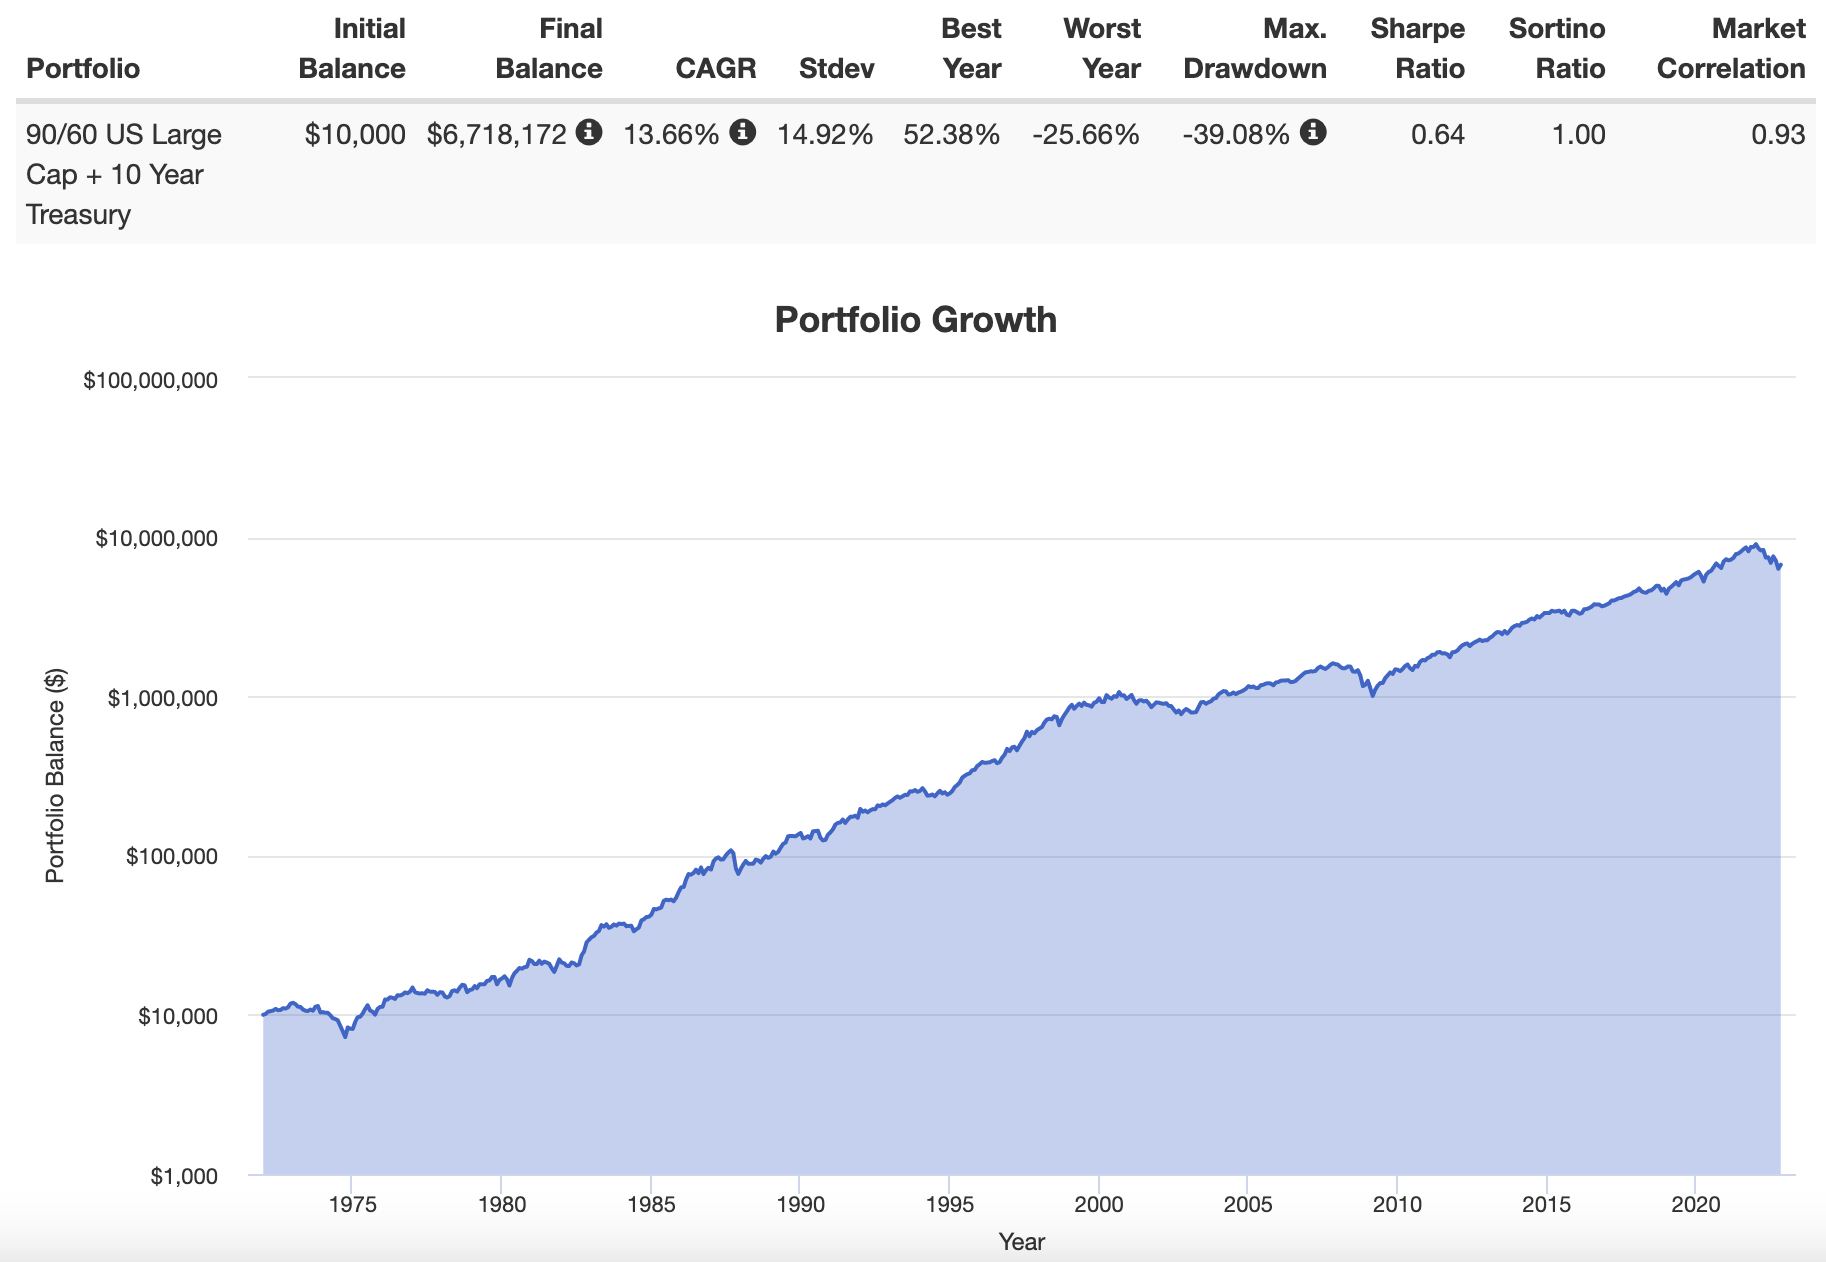
*Note: I’m not taking into account costs of leverage which would have been more expensive back in the day versus the efficient options now available through cash collateral and futures contracts.*
100% US Large Cap Equity + 60/40 Portfolio Returns from 1972 until 2022
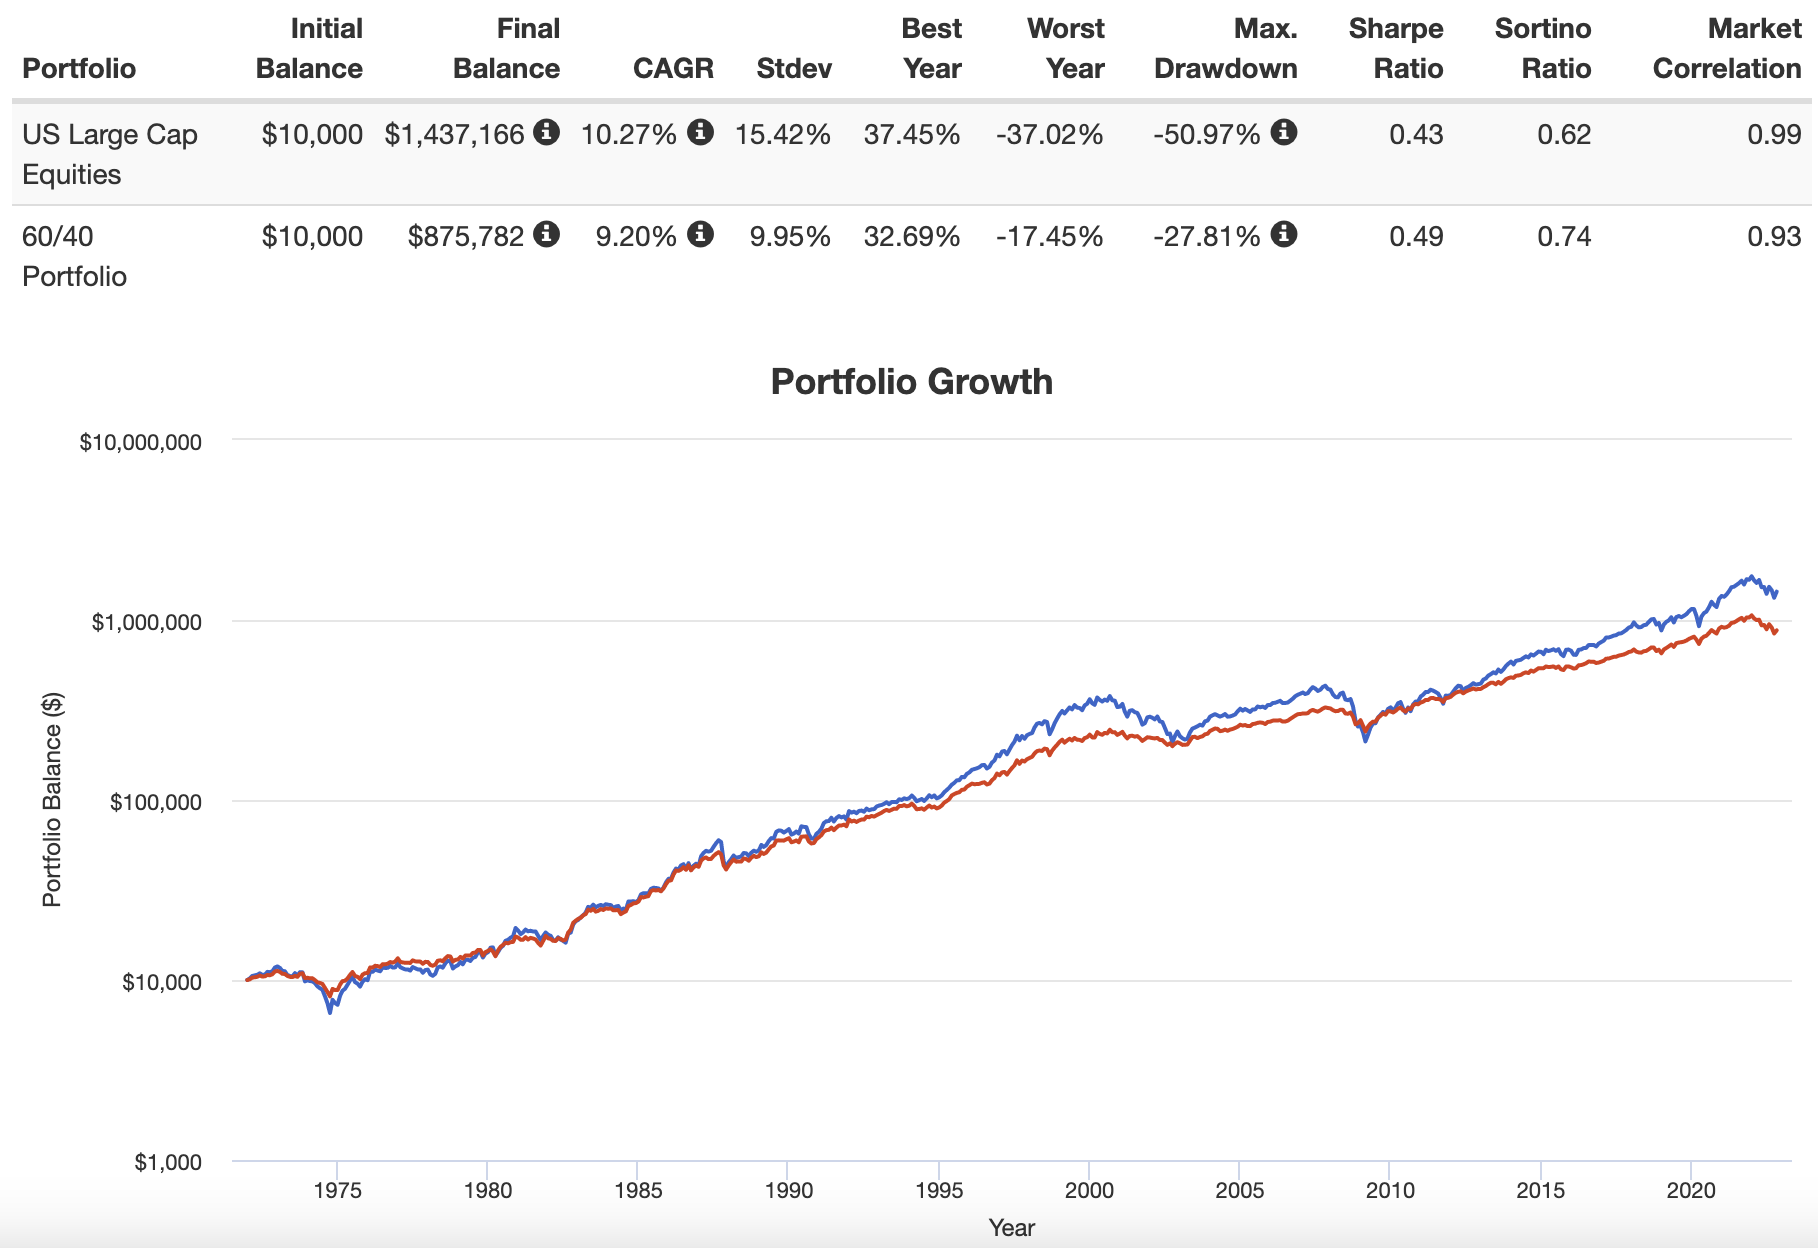
90/60 Portfolio vs 100% US Equity vs 60/40
CAGR: 13.66% vs 10.27% vs 9.20%
Stdev: 14.92% vs 15.42% vs 9.95%
Best Year: 52.38% vs 37.45 vs 32.69
Worst Year: -25.66% vs -37.02% vs -17.45
Max Drawdown: -39.08% vs 50.97% vs -27.81%
Thanks to portfolio visualizer we’re able to see the big picture results comparing the 90/60 portfolio versus an all equity 100% US Large Cap and 60/40 portfolio.
It’s obvious to see that a 90/60 portfolio crushes both an all equity and 60/40 portfolio from a returns standpoint of 13.66% vs 10.27% vs 9.20% CAGR.
Most impressive is that the 90/60 portfolio better manages volatility than an all equity allocation with 14.92% vs 15.42% Stdev.
More offensive and defensive?
The good times keep rolling when we compare best year, worst year and max drawdown between the 90/60 versus the all equity portfolio.
It’s not all a free lunch though.
The 90/60 portfolio, given that it is an amplified 60/40, will outperform when times are good and underperform when times are rough compared to the 60/40 portfolio.
That’s just common sense.

WisdomTree U.S. Efficient Core Fund: Principal Investment Strategy
To better understand the process of how the fund operates, let’s turn our attention towards the prospectus (source: summary prospectus).
Principal Investment Strategies of the Fund
The Fund seeks to achieve its investment objective by investing in large-capitalization U.S. equity securities and U.S. Treasury futures contracts.

Why Consider NTSX ETF?
Why consider NTSX ETF as a potential portfolio solution?
Let’s examine what WisdomTree has to say via its fund landing page.
“The WisdomTree U.S. Efficient Core Fund* seeks total return by investing in large-capitalization U.S. equity securities and U.S. Treasury futures contracts.
- Gain enhanced exposure to U.S. equities with added bond futures diversification to potentially lower volatility
- Use to help boost capital efficiency in asset allocation allowing for increased exposure to non-core / diversifying investments
- Use to help satisfy demand for overlay strategies that remain highly correlated to common portfolio benchmarks
*Formerly known as the WisdomTree 90/60 U.S. Balanced Fund”
Out of the three reasons given I think it would be wise to key in specifically on key point #2.
Boosting capital efficiency and associated portfolio real-estate space via a 90/60 fund is really the name of the game.
Assuming you’re a savvy enough investor to consider a strategy such as managed futures, let’s explore how a capital efficient allocation to a leveraged stocks/bond pairs with a stocks/managed futures combination.
50% NTSX + 50% BLNDX
90/60 equities/bonds + 50/100 equities/managed futures
Expanded Canvas Portfolio 150%: 70% equities / 50% managed futures / 30% Treasury
NTSX 50% + BLNDX 50% vs VBIAX 100%
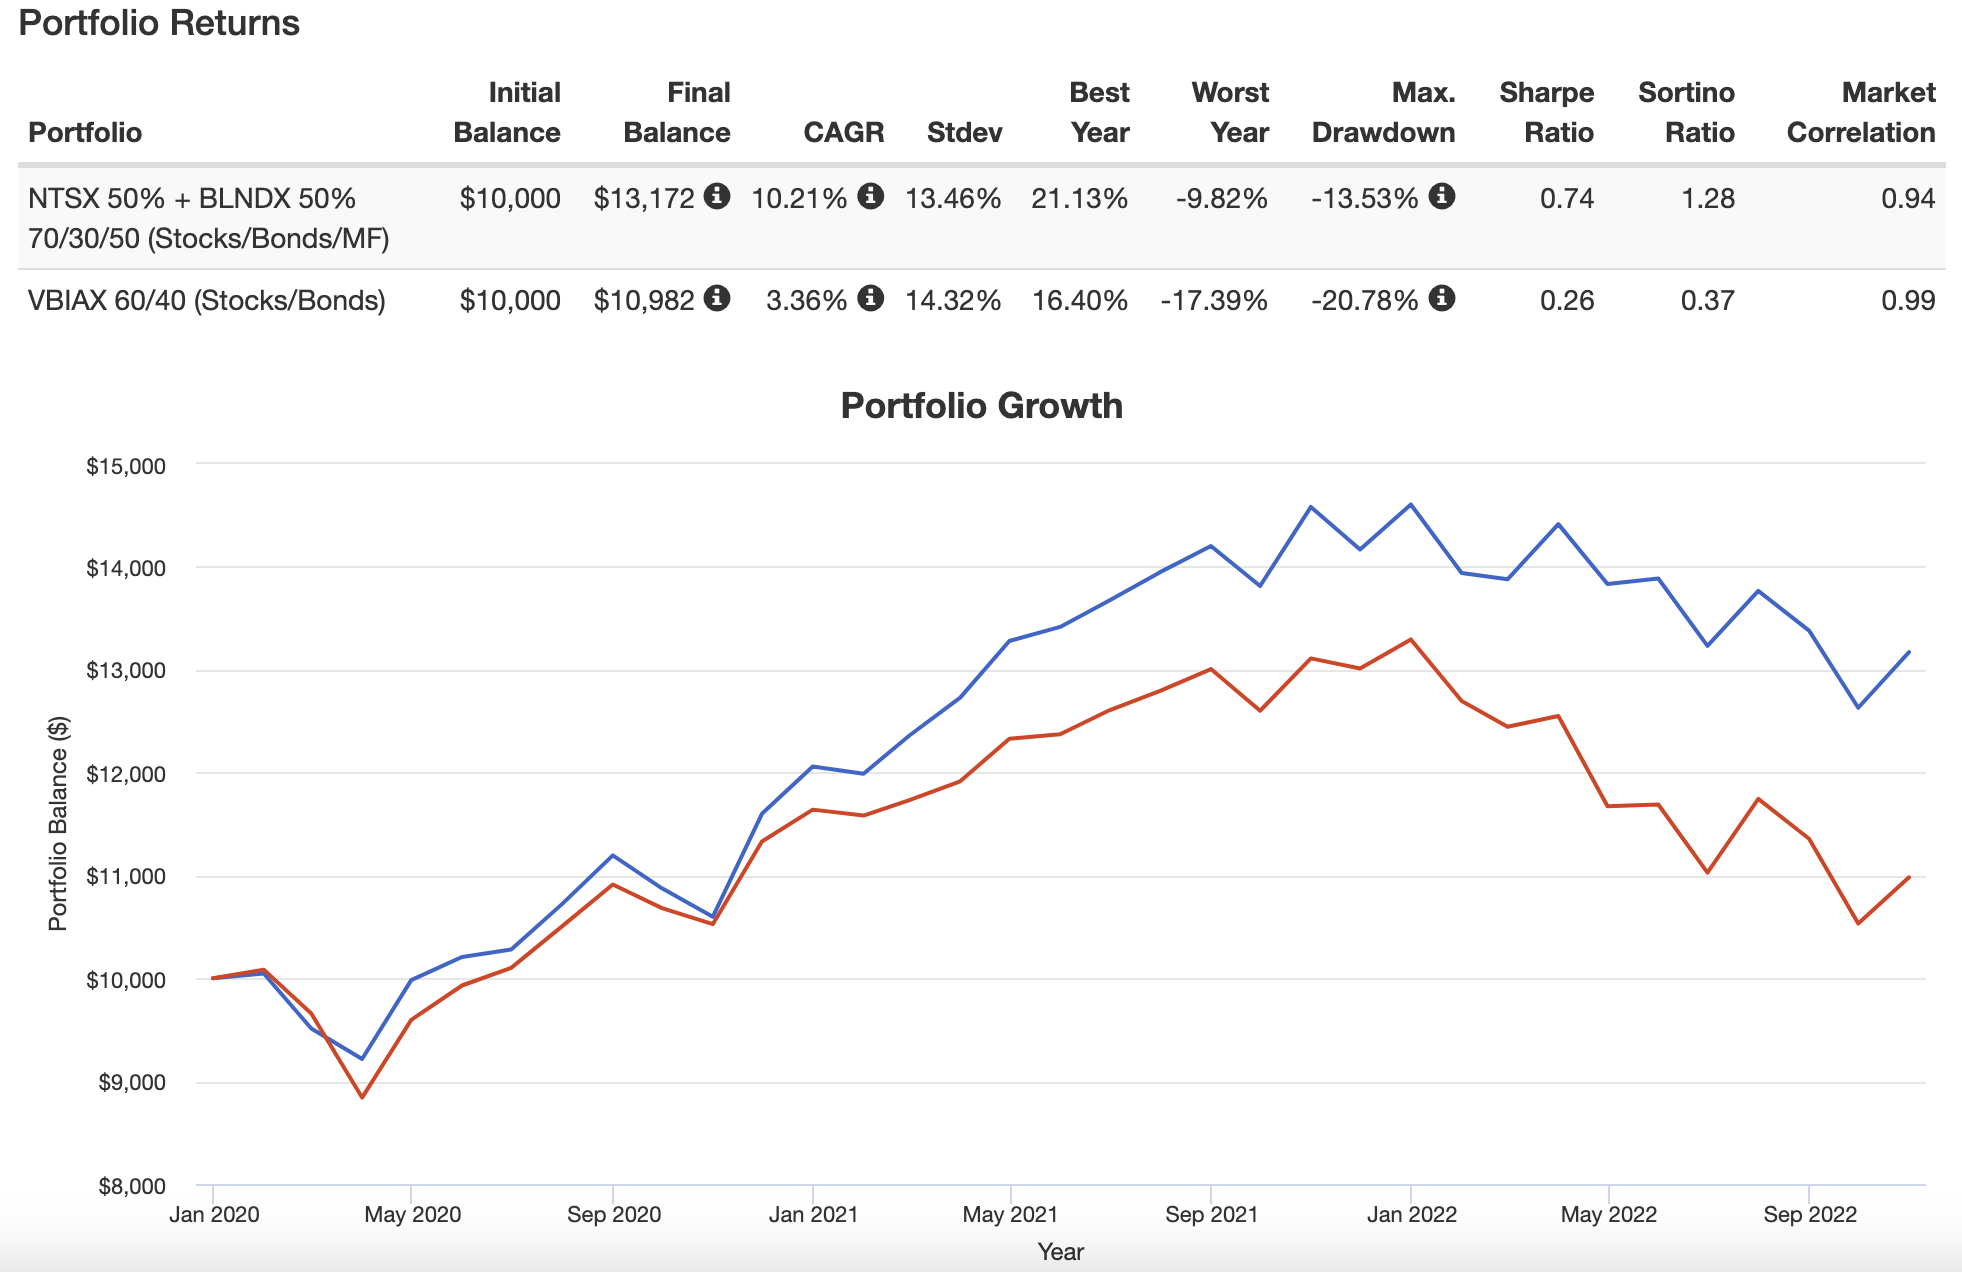
By adding an uncorrelated managed futures trend-following strategy to the mix (in an expanded canvas portfolio) the combination of NTSX + BLNDX skewers the 60/40 Portfolio as represented by VBIAX mutual fund.
CAGR: 10.21% vs 3.36%
RISK: 13.46% vs 14.32%
BEST YEAR: 21.13% vs 16.40%
WORST YEAR: -9.82 vs -17.39
MAX DRAWDOWN: -13.53% vs -20.78
SHARPE RATIO: 0.74 vs 0.26
SORTINO RATIO: 1.28 vs 0.37
MARKET CORRELATION: 0.94 vs 0.99
When NTSX ETF is utilized as intended (as an efficient diversification building block) it pairs beautifully with uncorrelated strategies.
Notice how the expanded canvas portfolio dominates in every single category ranging from CAGR to RISK along with SHARPE RATIO to SORTINO RATIO?
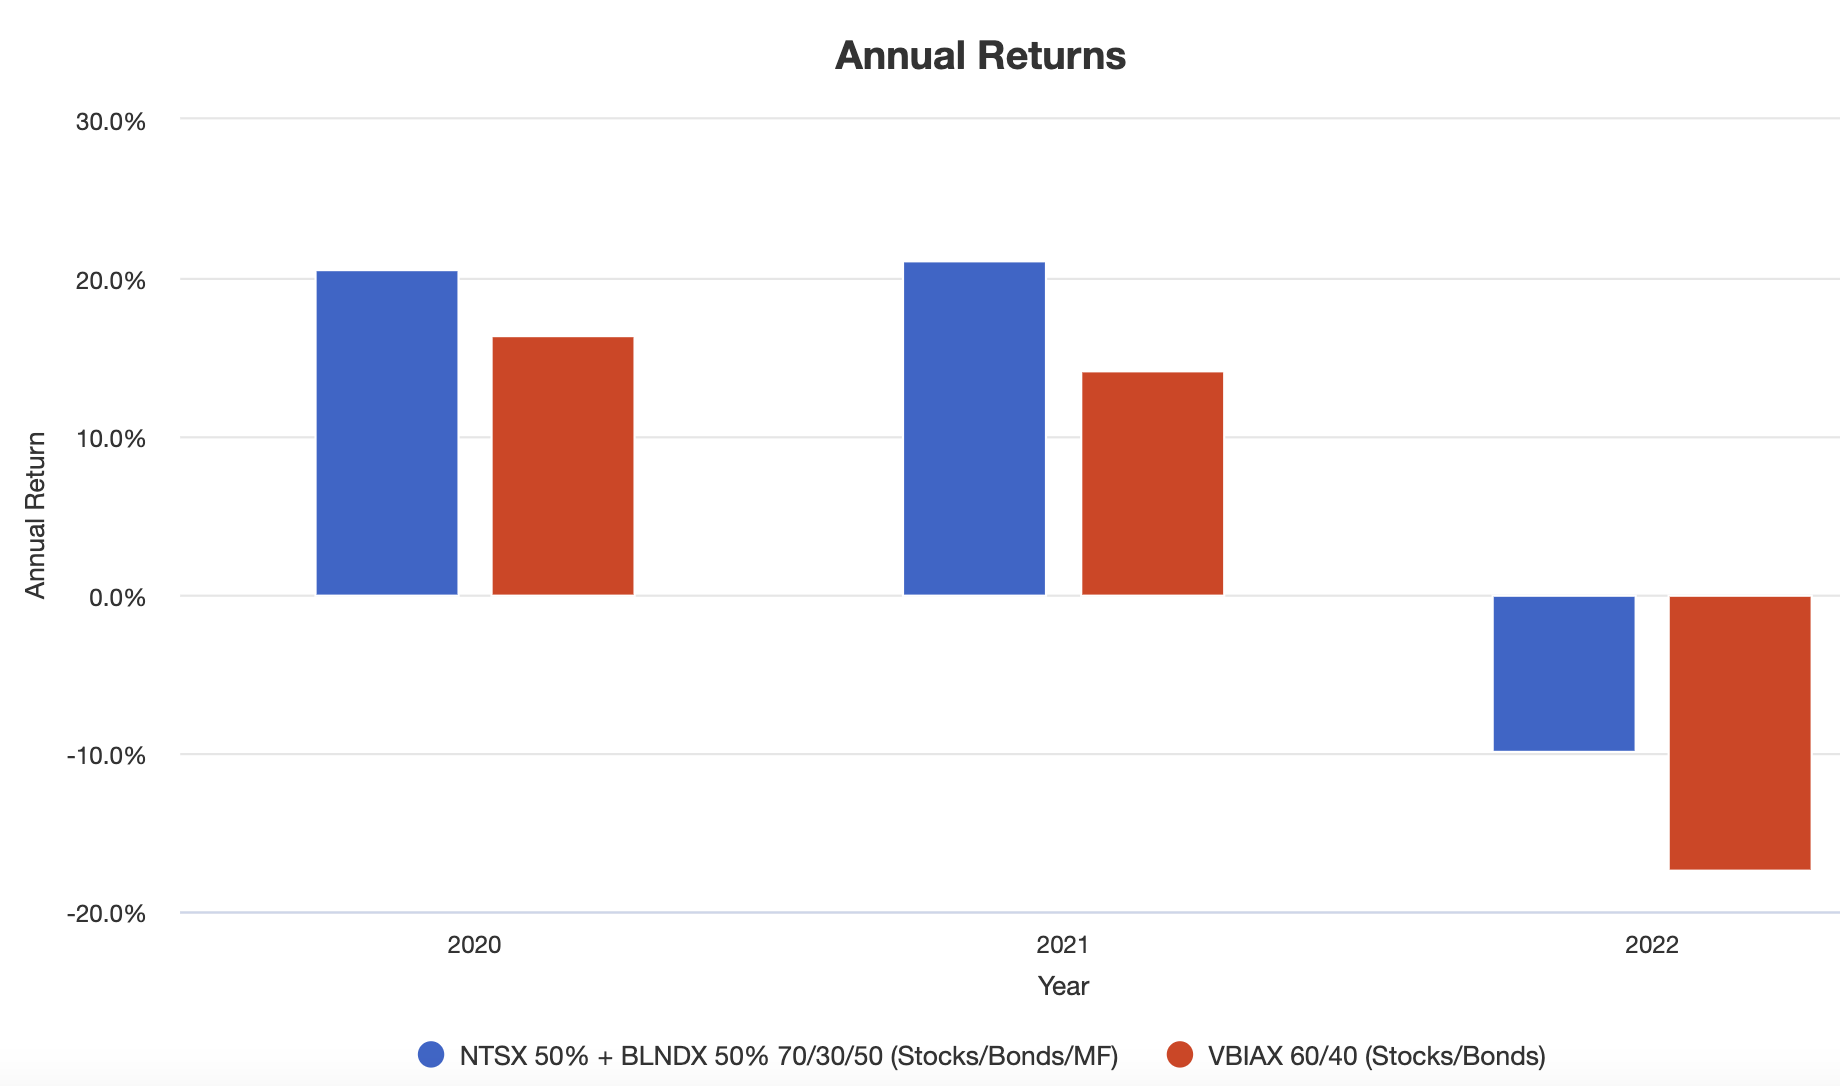
2020 Returns: 20.58% vs 16.40%
2021 Returns: 21.13% vs 14.22%
2022 Returns: -9.82 vs -17.39%
It outperforms the 60/40 every single year when times have been good (2020-21) and bad (2022).
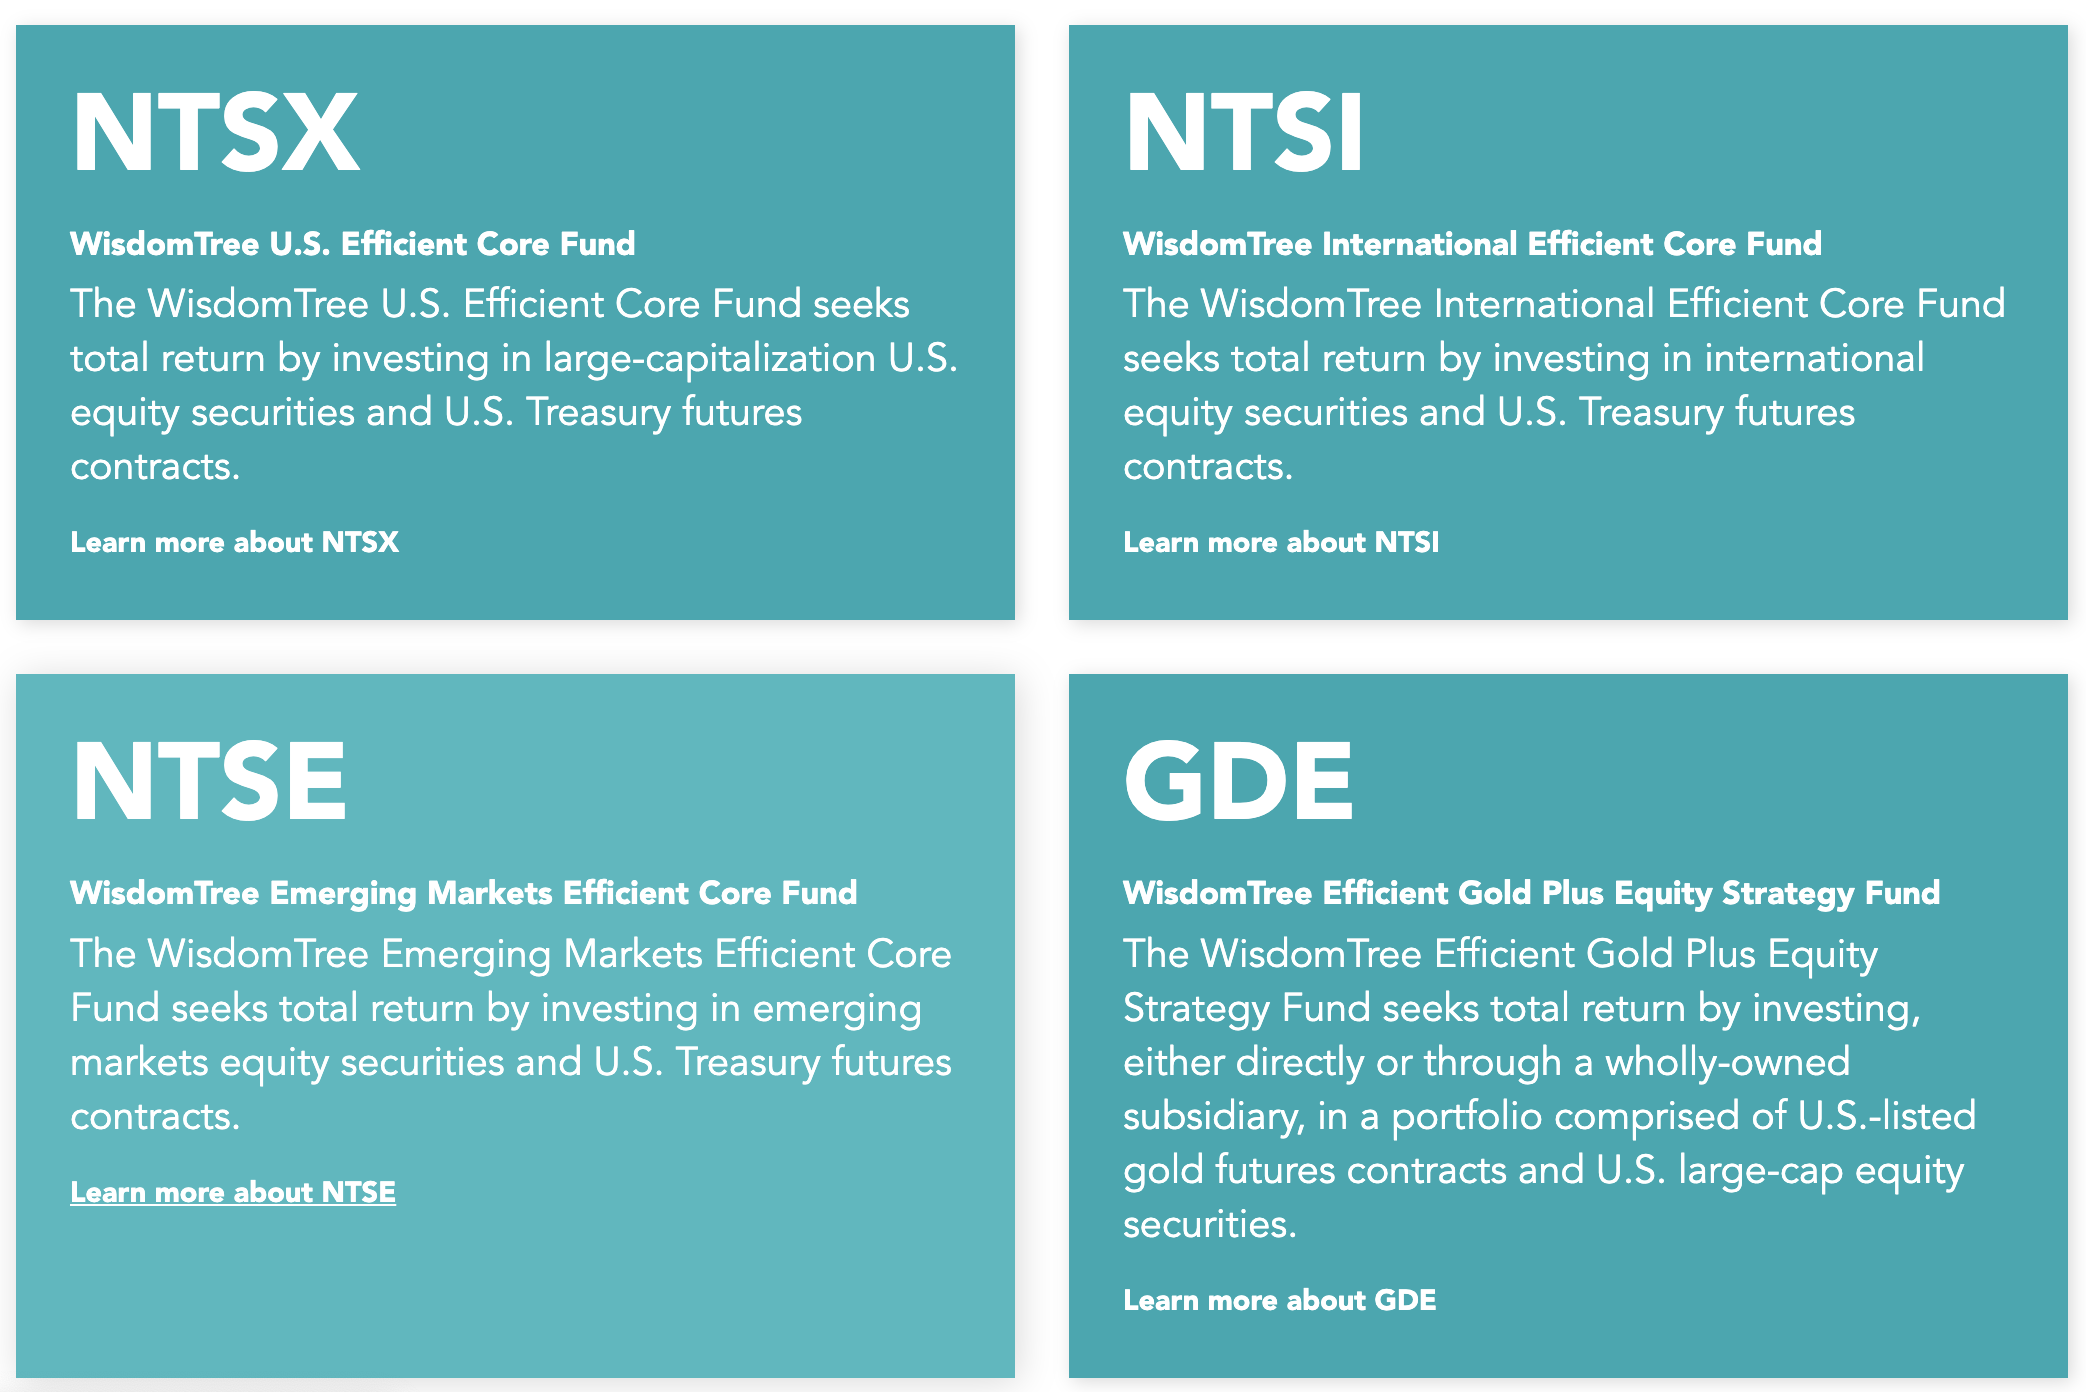

Complete Capital Efficient WisdomTree Roster of ETFs
Before we dive into the nitty gritty details of NTSX let’s first briefly highlight the entire roster of capital efficient ETFs WisdomTree has on tap.
NTSX – WisdomTree US Efficient Core Fund (90/60 US Equities / Treasury Futures)
NTSI – WisdomTree International Efficient Core Fund (90/60 Int-Dev Equities / Treasury Futures)
NTSE – WisdomTree Emerging Markets Efficient Core Fund (90/60 Emerging Equities / Treasury Futures)
GDE – WisdomTree Efficient Gold Plus Equity Strategy Fund (90/90 US Equites / Gold Futures)
GDMN – WisdomTree Efficient Gold Plus Gold Miners Strategy Fund (90/90 Gold Miner Equities / Gold Futures)
The current roster is most impressive as it provides investors with the puzzle pieces to efficiently add US, International Developed and Emerging Markets equities handcuffed with either treasury and/or gold exposure.
The one exception that deserves a bit more attention to unpack is GDMN ETF which combines Gold Miner Equities with Gold Futures for the ultimate Gold Bug Combo.
My sincerest hope is that the roster continues to expand to possibly include some of the great factor funds WisdomTree has available such as its Quality Dividend Growth Series.

NTSX ETF Overview, Holdings and Info
Let’s pop open the hood of NTSX ETF to see what kind of goodies we have inside!
We can find out straight from the fund fact sheet:

How NTSX ETF Creates A 90/60 Portfolio Configuration
So how does WisdomTree expand the canvas of the portfolio to 150% where it can hold 90% US equities and 60% Treasury Futures?
- “The Funds invest 90% of their net assets in the 500 largest stocks in their respective region by market capitalization.
- The Funds invest 10% in short-term fixed income that collateralizes a 60% notional exposure to U.S. Treasury futures (using a 2-, 5-, 10-, 30-year bond ladder).
- Should the Funds deviate from the targeted 90% equity and 60% U.S. Treasury allocations by 5%, the fund will be rebalanced back to target allocations.”
To sum this up in one sentence the fund invests in the 500 largest US stocks by market capitalization and utilizes a 10% collateral that allows the fund to gain 60% notional exposure to a variety of US Treasury futures.
90% US Equities
60% Notional US Treasury Futures
10% Collateral
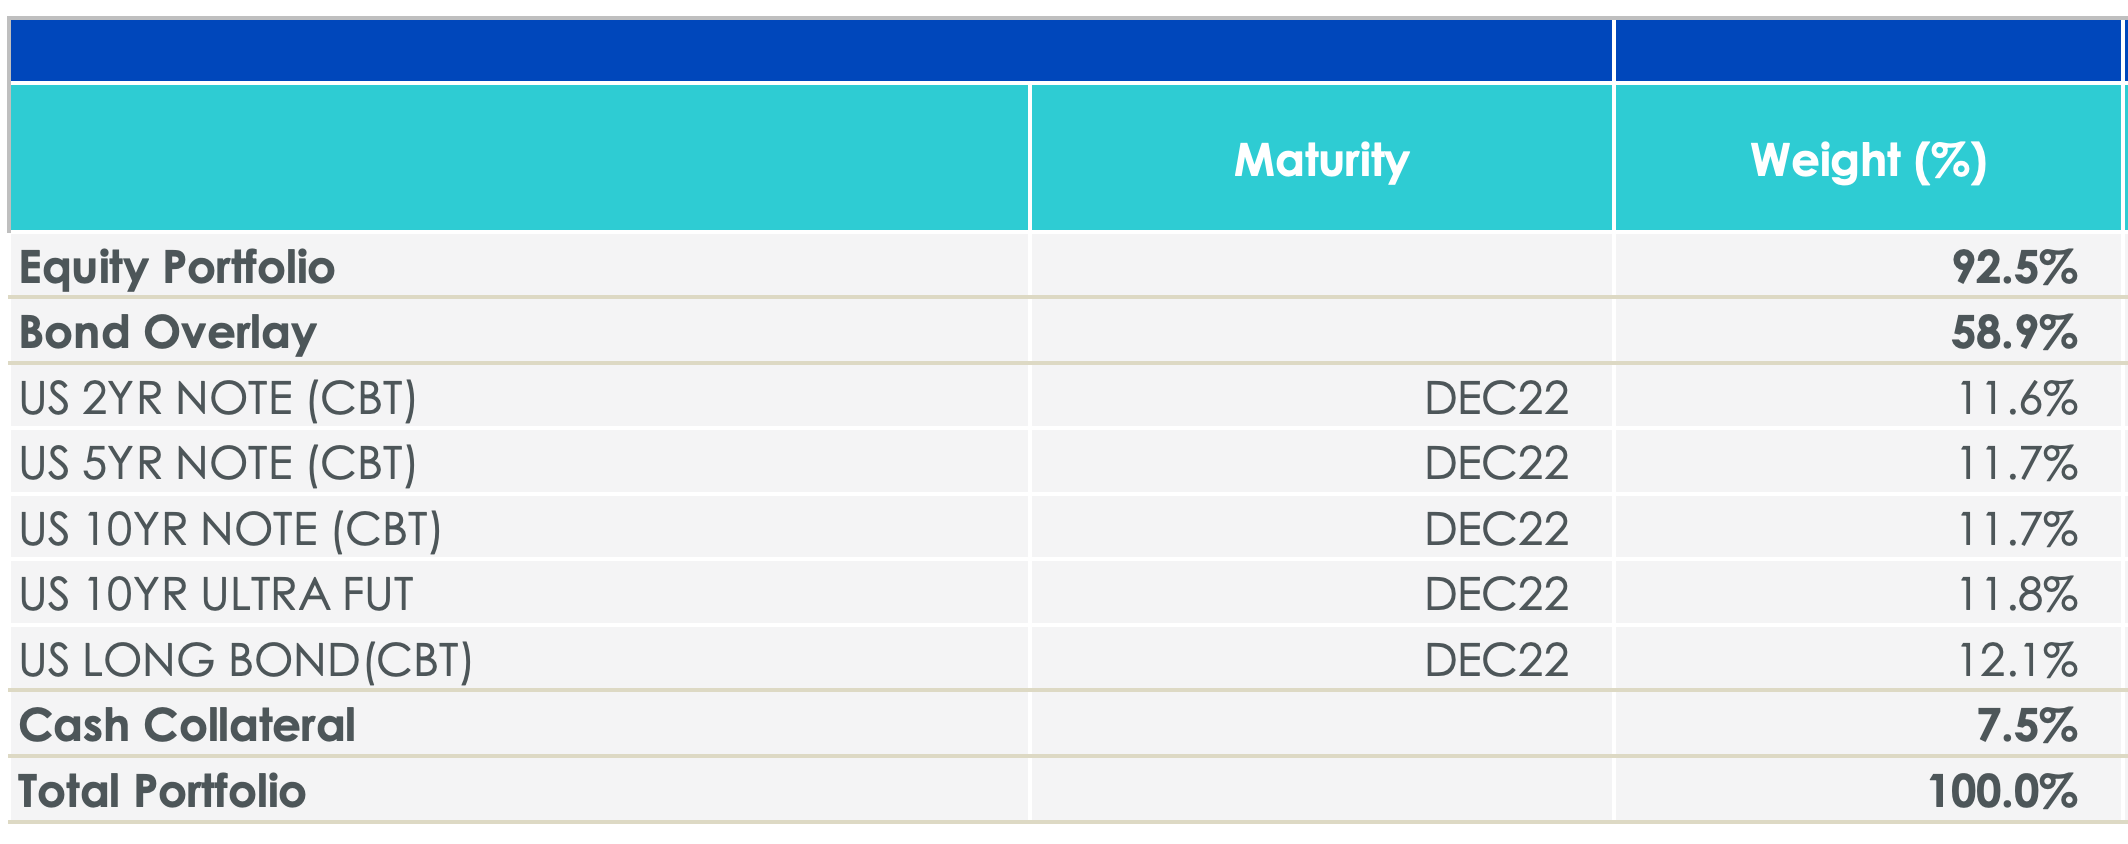
Above you’ll notice how the fund has exposure to a diverse range of treasury futures ranging from the US 2 Year Note to the US Long Bond.
NTSX ETF Top 10 Holdings
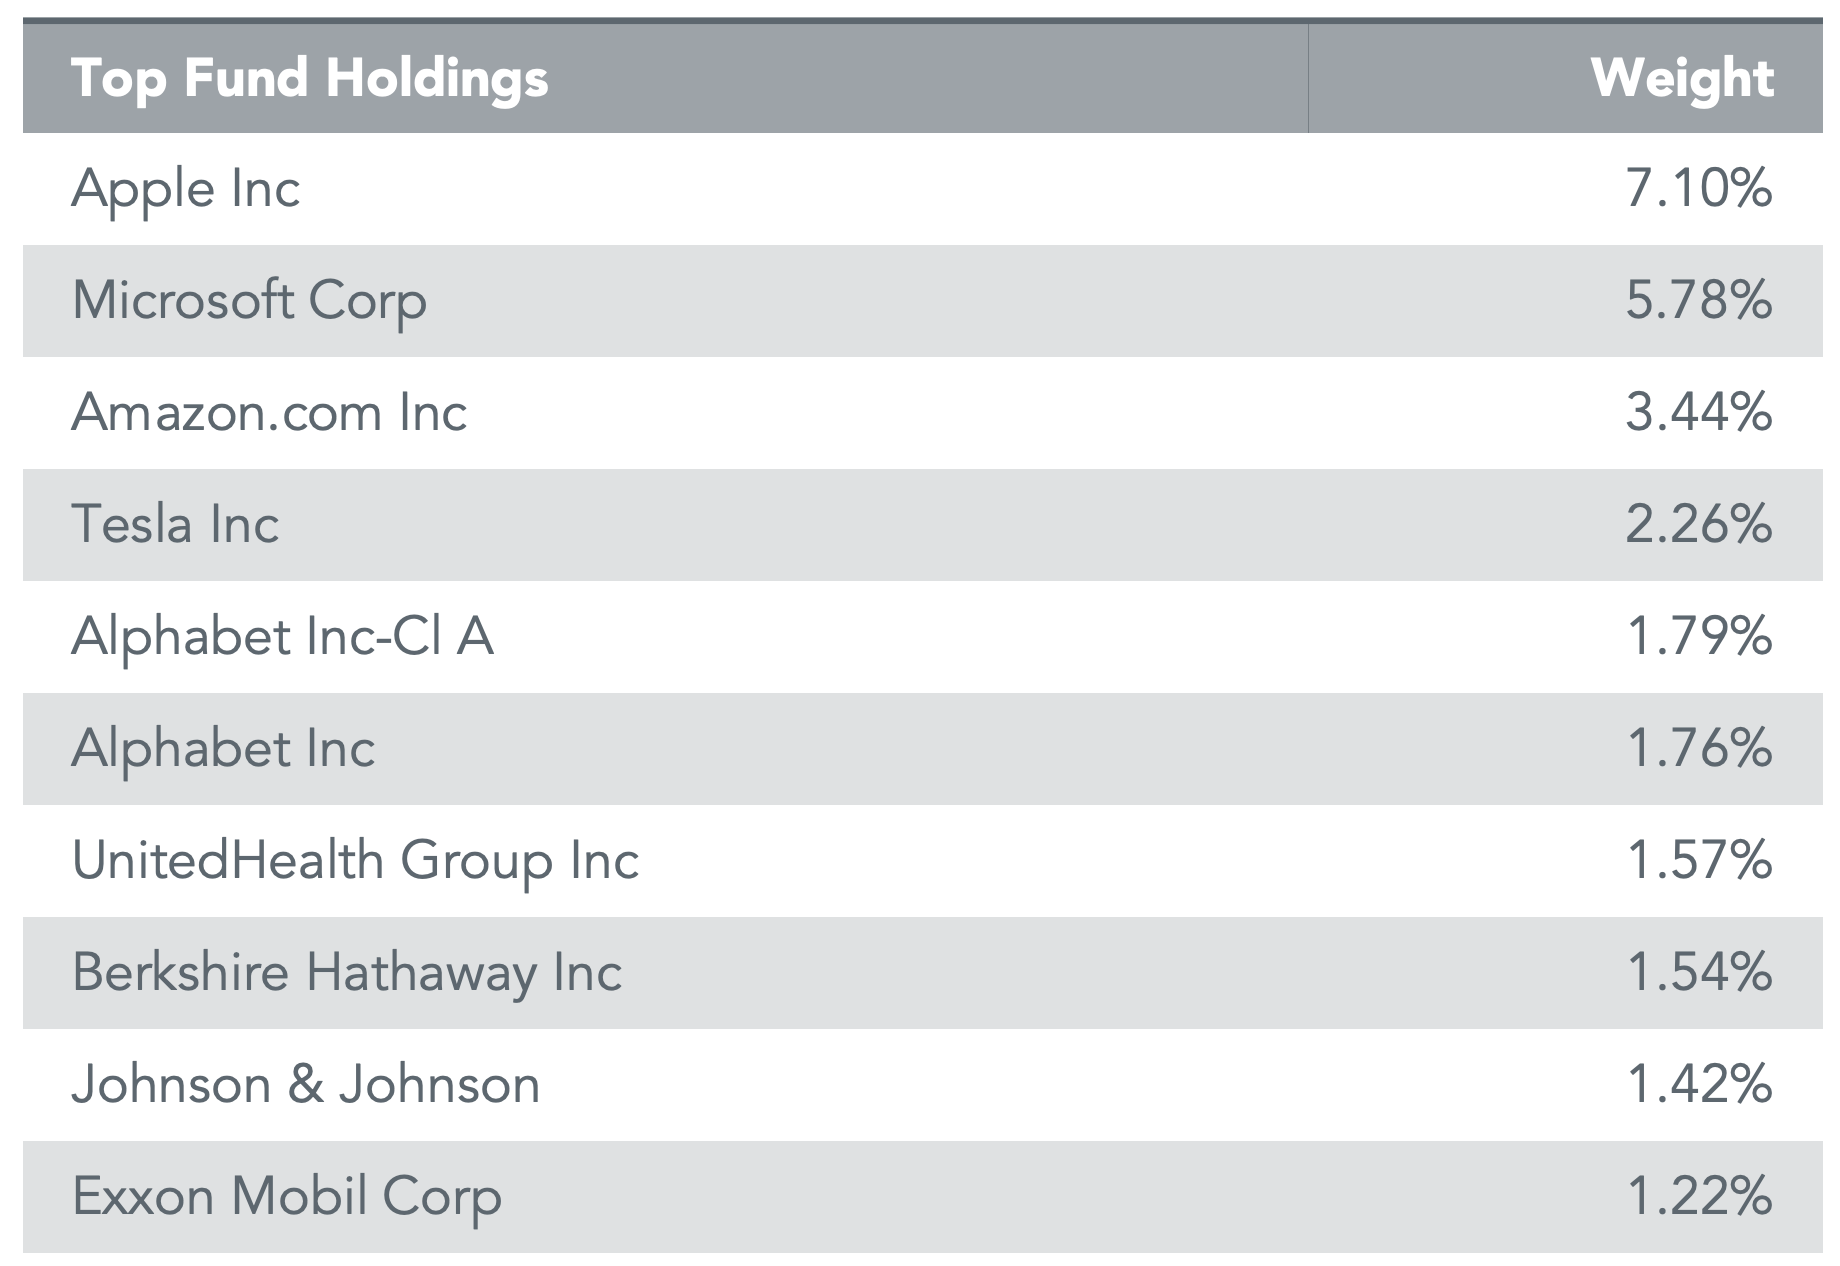
Here we can notice the top 10 US equity holdings for NTSX ETF.
We have Apple taking up considerable space at 7.10% while Exxon Mobil rounds things out at 1.22%
NTSX Info
Ticker: NTSX
Number of Stocks: 500
Net Expense Ratio: 0.20
Distributions: Quarterly
AUM: 729.3 Million
Inception: 08/02/2018
It’s great to see that investors have supported the 90/60 funds with NTSX accumulating an impressive 729.3 Million AUM.
Moreover, they’ve found a way to keep costs rock bottom with a Net Expense Ratio of just 0.20.
For investors seeking income, WisdomTree U.S. Efficient Core Fund ETF will provide quarterly distributions.
NTSX ETF – Sector Exposure
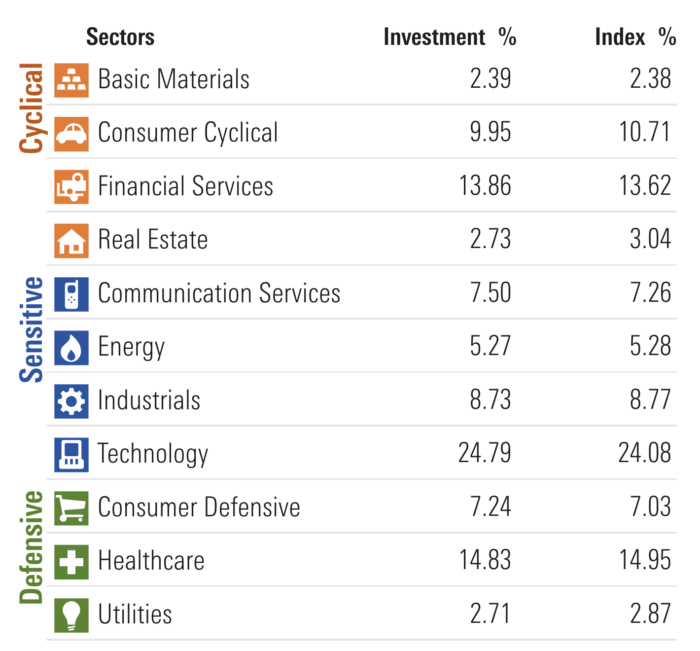
Here you’ll notice NTSX ETF lining up neatly with other US Large Cap index funds with Technology, Healthcare and Financial services leading the way.
The fund has its lowest sector exposures to Utilities, Basic Materials and Real Estate.

WisdomTree U.S. Efficient Core Fund Performance
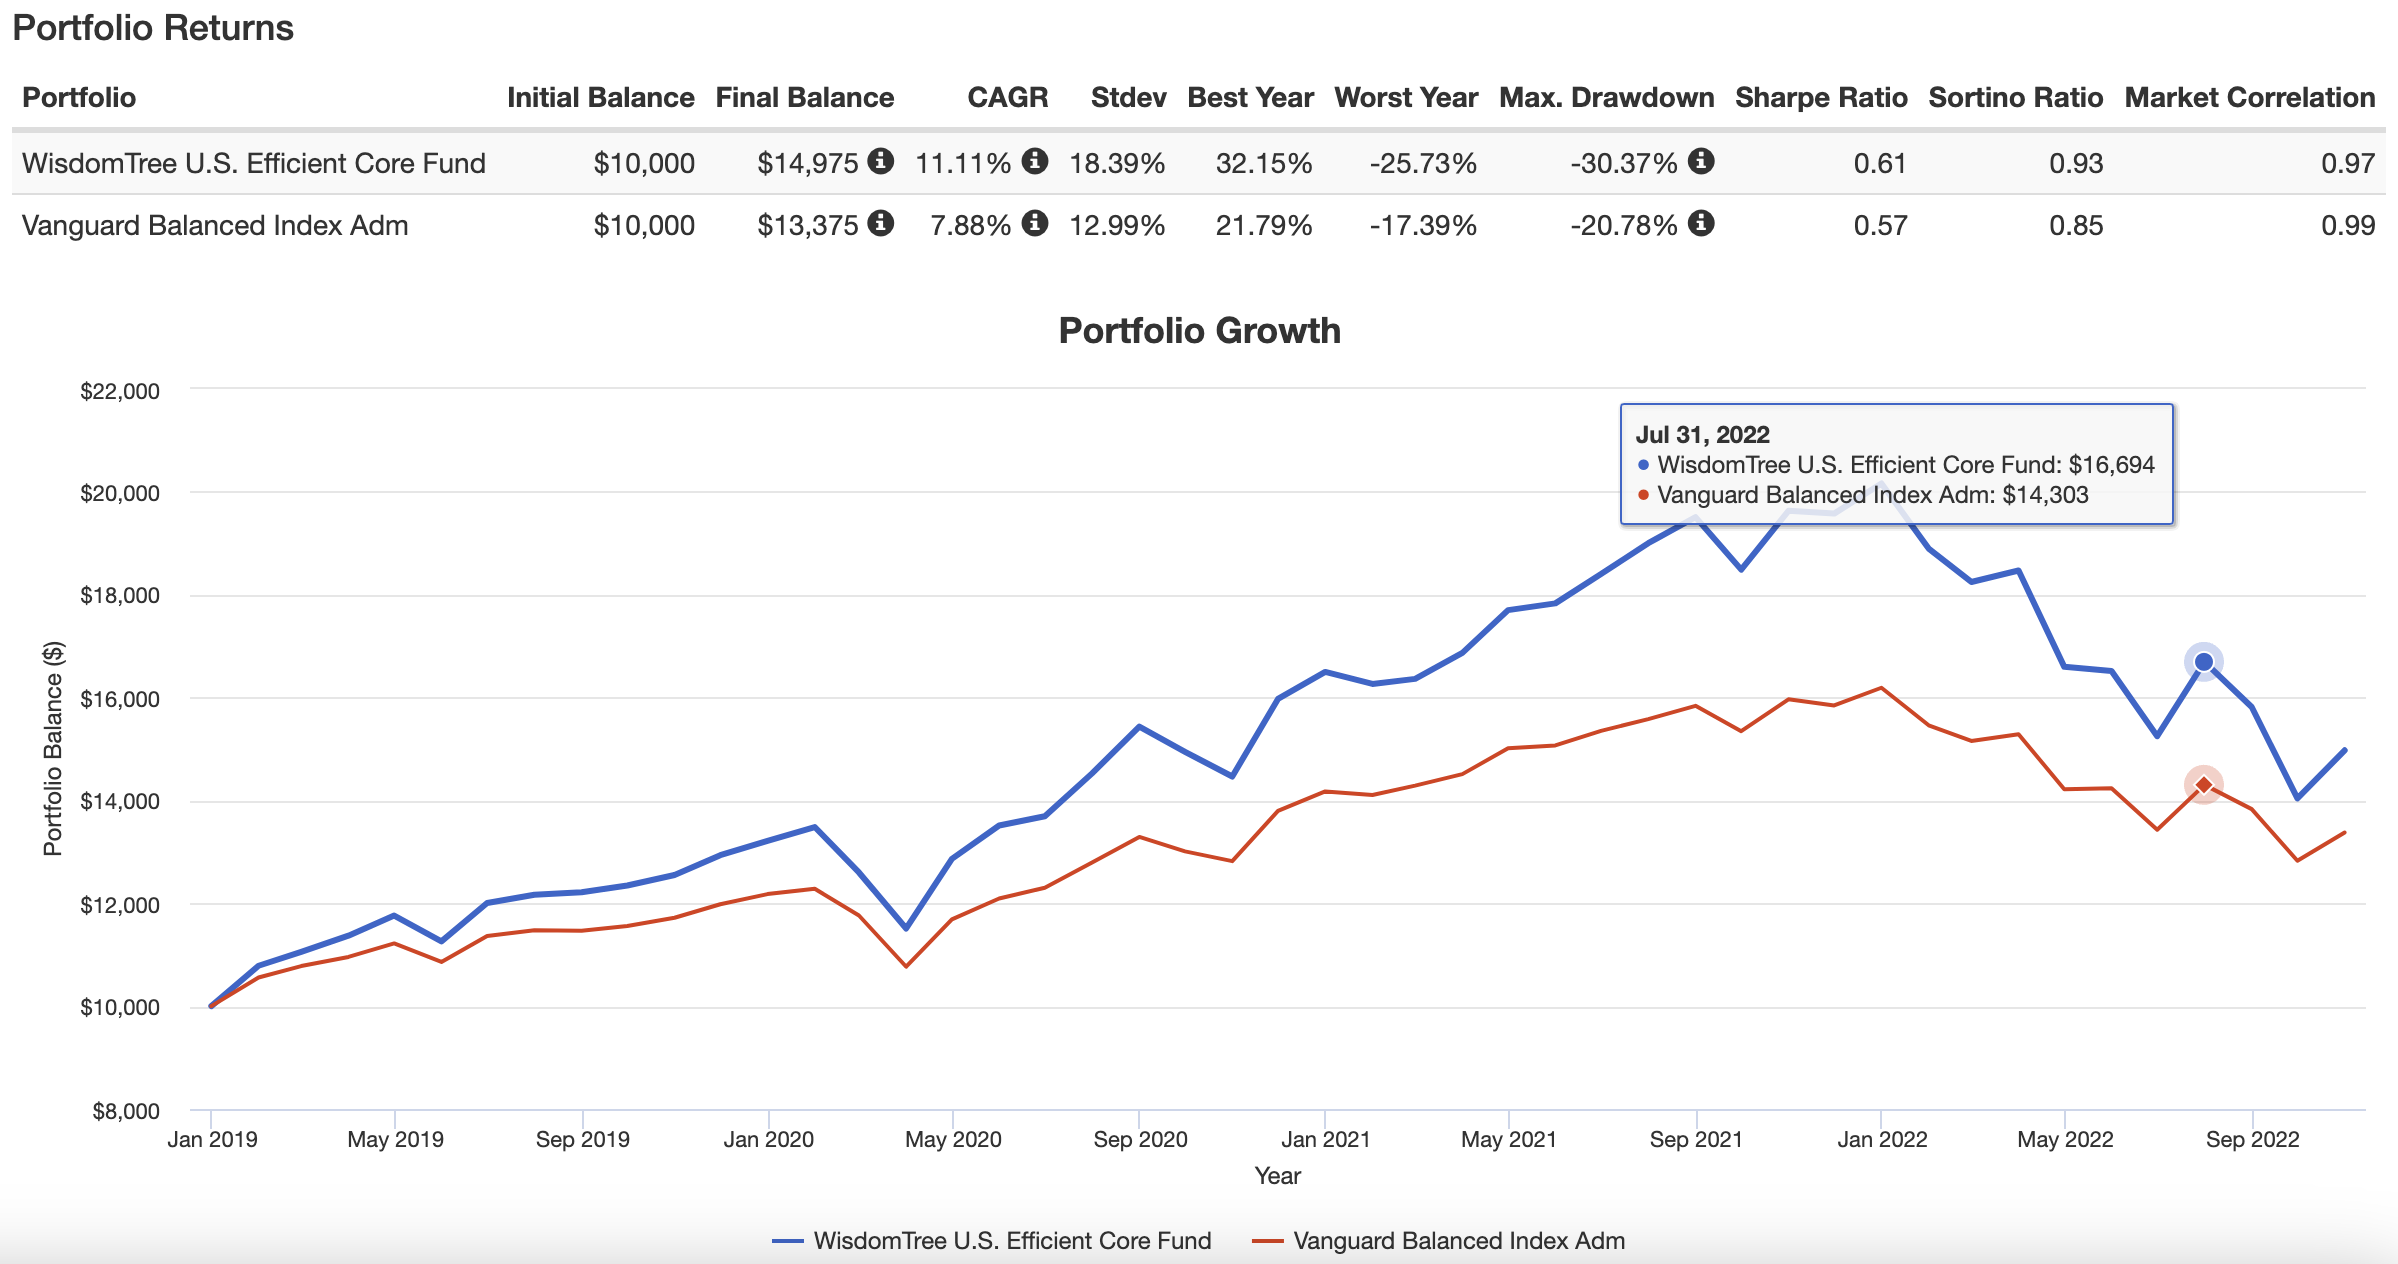
As one might expect the 90/60 WisdomTree U.S. Efficient Core Fund ETF has outperformed a general 60/40 fund (in this case Vanguard Balanced Index).
Its performance is amplified during good times AND bad times.
Noteworthy is the range between its best and worst years have a much wider gap than the 60/40 portfolio.
However, if you were to utilize the fund with its “best practices” intended use in mind you’d allocate 67% for 100% notional 60/40 exposure and then allocate 33% to another uncorrelated strategy.
Thus, we’ll pair NTSX at 67% with PQTIX at 33% to accomplish just that.
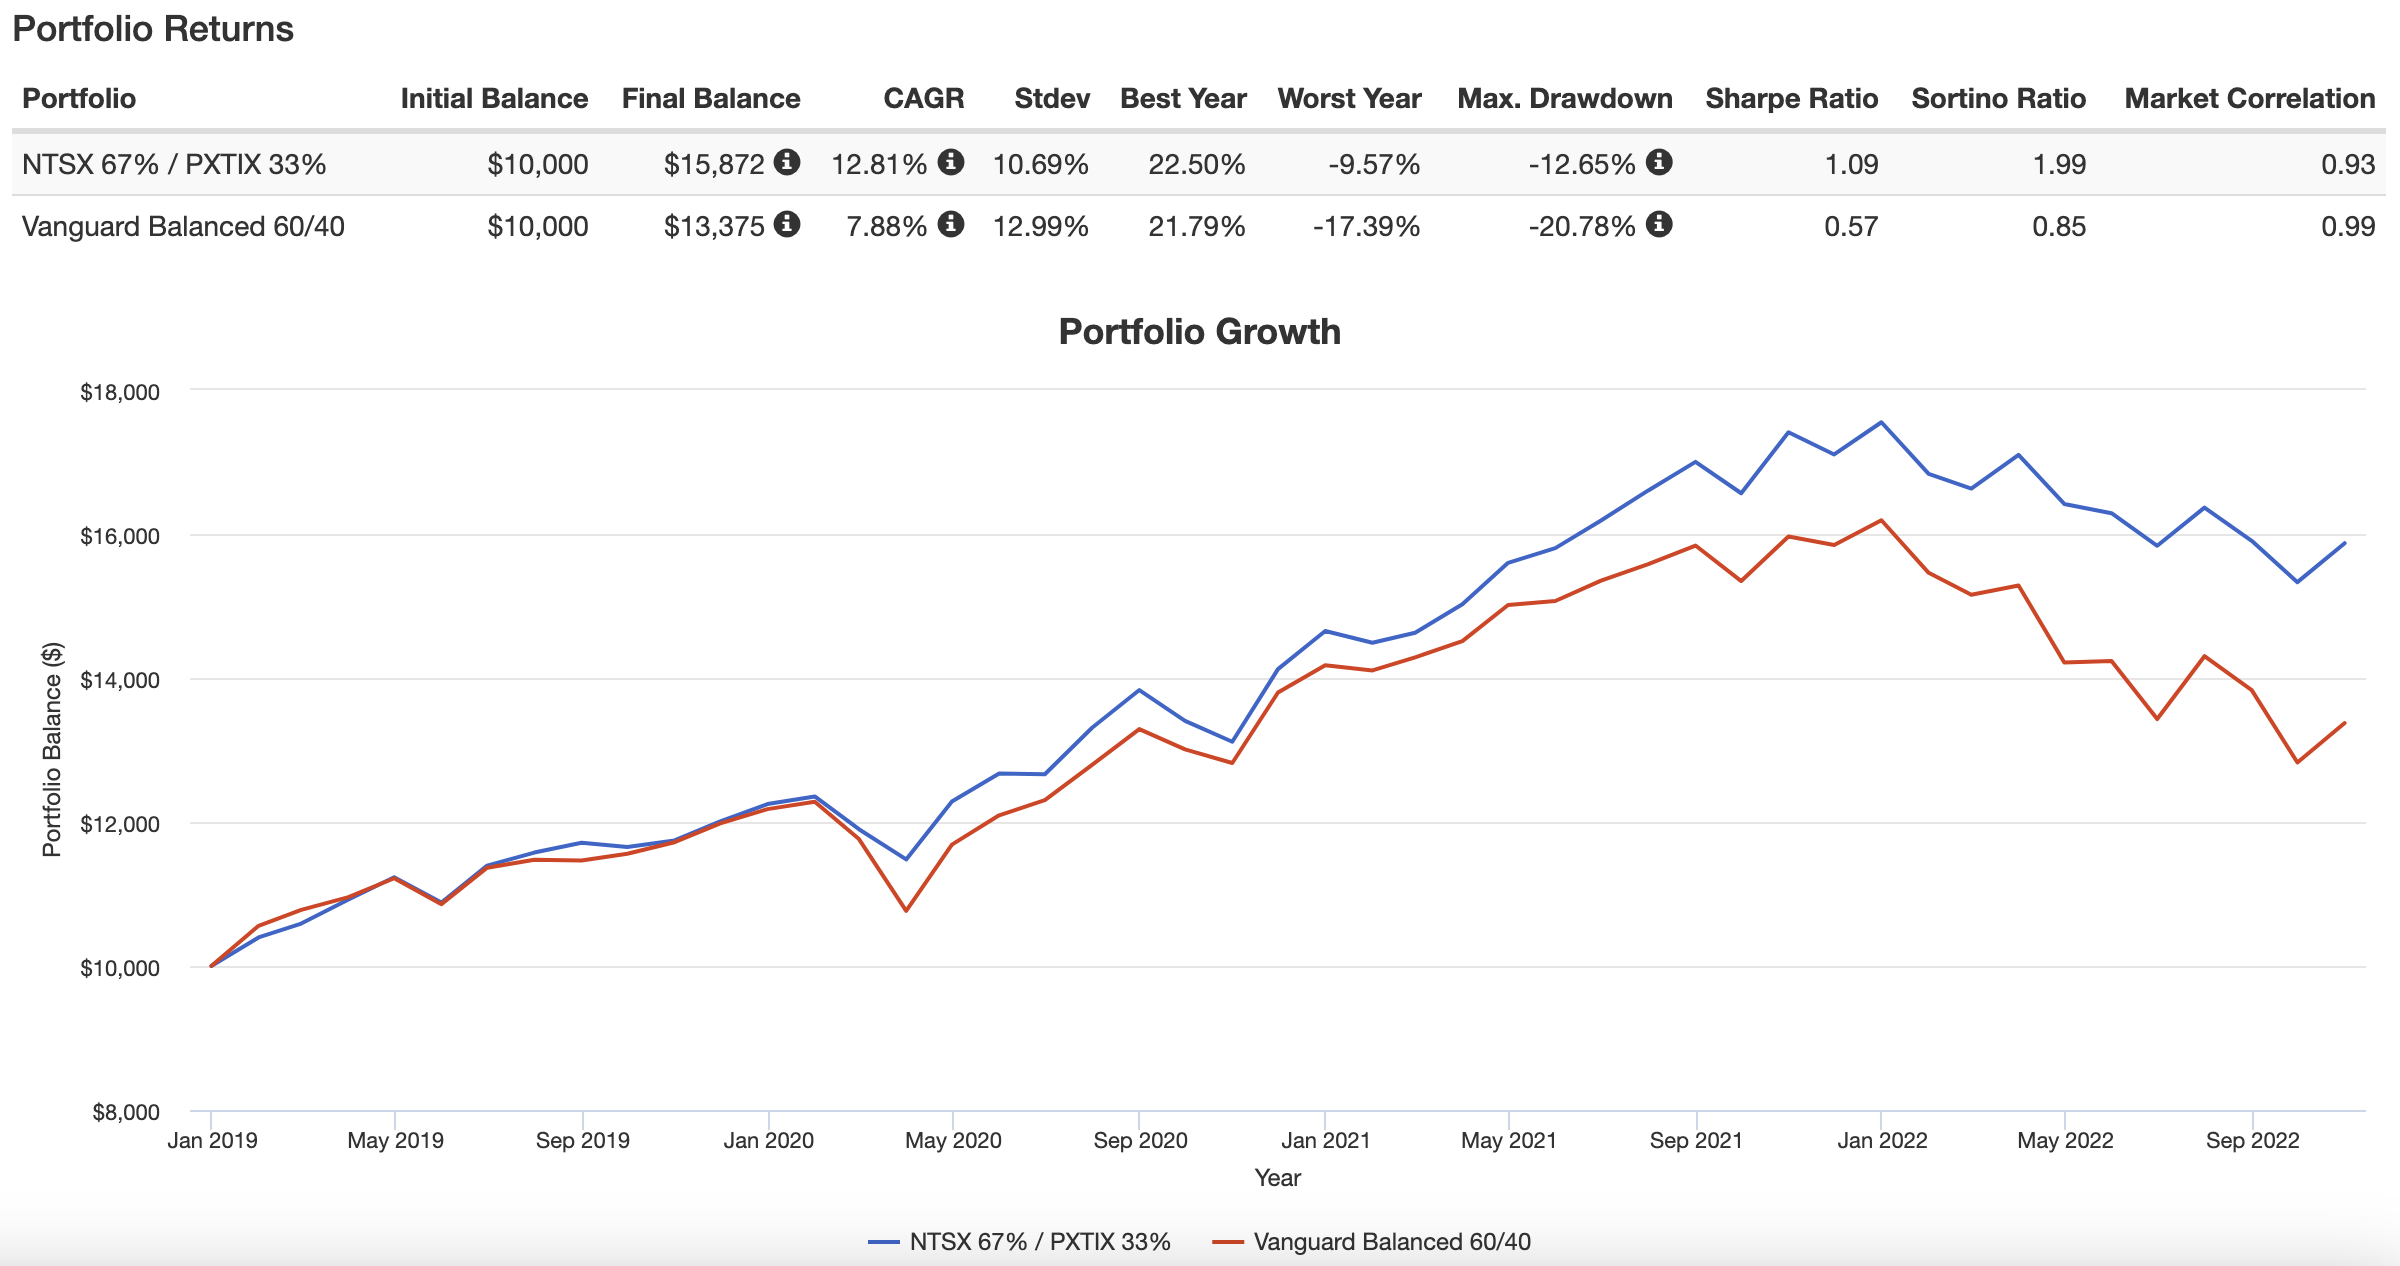
What a difference this makes!
Not only do we gain 170 basis points of CAGR (11.11% vs 12.81%) but the combination forms a defensive powerhouse gaining 770 basis points of risk management (18.39% vs 10.69% Stdev).
Returns outpace risk and the best and worst year compress for less of a rollercoaster ride.

NTSX ETF Pros and Cons
Let’s examine the pros and cons of WisdomTree U.S. Efficient Core Fund ETF.
NTSX Pros
- The ability to leverage the classic 60/40 portfolio at 1.5X to create a 150% expanded canvas product
- The space that 150% canvas product creates in the portfolio for additional uncorrelated alternative investments
- The ability to allocate only 67% of your portfolio real-estate to capture a notional 60/40 portfolio allocation
- The opportunity to add “alternative investments” to your portfolio without having to shave down your equity and bond exposure
- The capacity to shake the shackles of the 60/40 mandate and allocate your NTSX ETF puzzle piece in whichever way you want
- A rock bottom expense ratio of only 0.20 which is head and shoulders above its competition in the efficient core portfolio space
- An opportunity to consider the “other” efficient core product range to pair NTSX with NTSI, NTSE, GDE and GDMN for a globally diversified portfolio with additional exposure to gold
- A chance to support an innovative ETF provider in WisdomTree that offers an impressive selection of funds for investors to consider
NTSX Cons
- A year like 2022 is challenging where the extra oomph (leverage) contributes to the woes of the 60/40 portfolio in a 90/60 configuration where bad gets a bit ugly
- Certain investors will not use the product as intended and might freak-out and not have the chin to endure a challenging sequence of returns when leverage amplifies damage during market duress

NTSX Potential Portfolio Solutions
These asset allocation ideas and model portfolios presented herein are purely for entertainment purposes only. This is NOT investment advice. These models are hypothetical and are intended to provide general information about potential ways to organize a portfolio based on theoretical scenarios and assumptions. They do not take into account the investment objectives, financial situation/goals, risk tolerance and/or specific needs of any particular individual.
Now that we’ve taken a thorough look at NTSX ETF let’s see how it can potentially fit into a portfolio at large.
2 Fund Portfolio Solution
For investors seeking a simple 2 fund portfolio solution the following may be of interest:
50% NTSX 90/60
50% BLNDX 50/100
Here we’d take the 90/60 US Equities / Treasury and pair it with 50/100 Global Equities / Managed Futures.
Overall, we’d get a 70/30/50 configuration of equities, bonds and managed futures exposure.
If you wanted less home country bias you’d expand the roster to 4 funds and allocate along these lines:
25% NTSX 90/60
15% NTSI 90/60
10% NTSE 90/60
50% BLNDX 50/100

WisdomTree Efficient Core Total Portfolio Solution
For investors who find Managed Futures a bit too esoteric to their taste and would prefer Gold as an alternative, the WisdomTree efficient core family has you covered from head to toe.
30% GDE 90/90
30% NTSX 90/60
25% NTSI 90/60
15% NTSE 90/60
Here you’d have an overall exposure of 90% equities, 42% bonds and 27% gold.

Expanded Canvas Diversified Quant
For those who flip the bird towards benchmarks (myself included) a maximally diversified expanded canvas portfolio might look a bit like this:
10% NTSX
10% GDE
10% NTSI
10% NTSE
30% BLNDX
10% LBAY
10% BTAL
10% ARB
Here we’d have a globally diversified portfolio with 51% Equity, 30% Managed Futures, 18% Treasury, 10% Market Neutral, 10% Long-Short Equity, 10% Merger-Arbitrage and 9% Gold.

What Others Have To Say About NTSX ETF
Now that we’ve covered a few different portfolio solutions let’s see what others have to say about the fund for those who prefer video format.
source: Corey On Investing YouTube
source: Optimized Portfolio YouTube
It’s time for final thoughts to wrap up this fund review.

WisdomTree U.S. Efficient Core Fund (NTSX) — 12-Question FAQ
What is NTSX and what’s its objective?
NTSX is WisdomTree’s U.S. Efficient Core Fund. It targets a capital-efficient take on the classic 60/40 by holding roughly 90% U.S. large-cap equities and overlaying about 60% notional U.S. Treasury futures. The objective is total return with improved portfolio “real estate,” letting investors keep core stock/bond exposure while freeing space for other diversifiers.
How does the 90/60 structure work mechanically?
About 90% of assets sit in a representative basket of the 500 largest U.S. stocks. Roughly 10% remains in cash and short-term instruments as collateral for a ladder of Treasury futures (2-, 5-, 10- and 30-year) sized to about 60% notional exposure. If equity or futures exposure drifts 5% or more from target, the fund rebalances toward 90/60.
What problem does NTSX solve for allocators?
It provides capital efficiency. A traditional 60/40 can be approximated with only ~67% of a portfolio using NTSX, leaving ~33% to allocate to uncorrelated strategies—managed futures, long/short equity, merger-arb, gold, or other alternatives—without reducing core equity or bond exposures.
How has a 90/60 profile historically compared with 60/40 and 100% equities in concept?
Over long windows, a 90/60 profile has typically delivered higher returns than 60/40 and better drawdown and volatility characteristics than 100% equities. It tends to amplify good times versus 60/40 and feel worse in bad years for both stocks and bonds, but it usually improves the return-to-risk trade-off when paired with diversifiers.
What are the main risks to understand?
NTSX uses modest leverage via futures, so equity-rate selloffs (e.g., 2022) can sting more than a plain 60/40. Treasury futures introduce duration risk; if rates rise sharply while stocks fall, the overlay can compound losses. As with any equity-heavy core, equity beta remains a dominant driver of returns.
What do investors actually own inside NTSX?
You own a market-cap-weighted basket of large U.S. stocks plus an overlay of Treasury futures aimed at intermediate-term duration (roughly 3–8 years). The futures are collateralized by the fund’s cash sleeve, and positions are rolled and resized to maintain target interest-rate exposure and the 90/60 split.
Where can NTSX fit inside a broader portfolio?
It can serve as a core building block. Many allocators use ~67% NTSX to replicate 60/40 notional exposure and deploy the remaining ~33% into diversifiers. Others use NTSX as a return-stacking sleeve in multi-asset portfolios to increase resilience without sacrificing equity exposure.
What pairs well with NTSX?
Uncorrelated or negatively correlated strategies pair best. Managed futures and trend-following can offset equity-bond stress, while market-neutral, merger-arb, or long/short equity can smooth equity beta. Gold overlays (via a fund like GDE) or explicit duration can further balance macro regimes.
Who is NTSX for—and not for?
It suits investors comfortable with modest leverage who want capital efficiency and plan to add diversifiers in the freed space. It’s less suitable for investors who may abandon ship during rough equity-bond drawdowns, or who prefer unlevered, single-sleeve exposures.
What about fees, liquidity, and distributions?
NTSX charges a low expense ratio for an efficient-core structure and pays quarterly distributions. Equity holdings and Treasury futures are among the most liquid markets, and the fund rebalances systematically to maintain targets, helping keep implementation costs contained.
How do you build a global efficient-core stack with WisdomTree?
Investors often complement NTSX (U.S.) with NTSI (international developed) and NTSE (emerging) for broader equity reach, and some add GDE or GDMN for equity-plus-gold overlays. Together, these can form a capital-efficient global core that retains room for alternative sleeves.
What’s the bottom line on pros and cons?
The big advantages are capital efficiency, flexibility to add true diversifiers, and historically attractive return-to-risk versus plain 60/40 when implemented as intended. The trade-offs are amplified bad years when both stocks and bonds struggle, ongoing comfort with a futures overlay, and the behavioral discipline required to stick with a return-stacked plan.
Nomadic Samuel Final Thoughts
It may come as a surprise to you that NTSX ETF doesn’t make it into my DIY Quant Portfolio.
But there is a good reason for that!
It’s because I have the 90/90 US Equities and Gold combination that the more underrated GDE ETF offers.
Furthermore, I allocate to NTSI and NTSE to increase the global diversification within my equity sleeve.
But I’m still a huge fan of NTSX ETF overall.
The concept of expanding the portfolio to create space for uncorrelated sources of returns is at the cutting edge of creating the most efficient, robust and resilient portfolio as a retail investor.
This is where enhanced returns and risk management collide.
Anyhow, we’re at 2284 words so it’s about time to wrap things up.
What do you think of NTSX ETF and the entire roster of efficient core products WisdomTree offers?
Does it make the grade into your portfolio?
Please let me know in the comments below.
That’s all I’ve got.
Ciao for now.
Important Information
Comprehensive Investment Disclaimer:
All content provided on this website (including but not limited to portfolio ideas, fund analyses, investment strategies, commentary on market conditions, and discussions regarding leverage) is strictly for educational, informational, and illustrative purposes only. The information does not constitute financial, investment, tax, accounting, or legal advice. Opinions, strategies, and ideas presented herein represent personal perspectives, are based on independent research and publicly available information, and do not necessarily reflect the views or official positions of any third-party organizations, institutions, or affiliates.
Investing in financial markets inherently carries substantial risks, including but not limited to market volatility, economic uncertainties, geopolitical developments, and liquidity risks. You must be fully aware that there is always the potential for partial or total loss of your principal investment. Additionally, the use of leverage or leveraged financial products significantly increases risk exposure by amplifying both potential gains and potential losses, and thus is not appropriate or advisable for all investors. Using leverage may result in losing more than your initial invested capital, incurring margin calls, experiencing substantial interest costs, or suffering severe financial distress.
Past performance indicators, including historical data, backtesting results, and hypothetical scenarios, should never be viewed as guarantees or reliable predictions of future performance. Any examples provided are purely hypothetical and intended only for illustration purposes. Performance benchmarks, such as market indexes mentioned on this site, are theoretical and are not directly investable. While diligent efforts are made to provide accurate and current information, “Picture Perfect Portfolios” does not warrant, represent, or guarantee the accuracy, completeness, or timeliness of any information provided. Errors, inaccuracies, or outdated information may exist.
Users of this website are strongly encouraged to independently verify all information, conduct comprehensive research and due diligence, and engage with qualified financial, investment, tax, or legal professionals before making any investment or financial decisions. The responsibility for making informed investment decisions rests entirely with the individual. “Picture Perfect Portfolios” explicitly disclaims all liability for any direct, indirect, incidental, special, consequential, or other losses or damages incurred, financial or otherwise, arising out of reliance upon, or use of, any content or information presented on this website.
By accessing, reading, and utilizing the content on this website, you expressly acknowledge, understand, accept, and agree to abide by these terms and conditions. Please consult the full and detailed disclaimer available elsewhere on this website for further clarification and additional important disclosures. Read the complete disclaimer here.


I like NTSX but don’t see a point in holding it since I already have UPAR which holds levered up equities, treasuries and more.
One other negative is it’s pretty biased in only delivering dividends on the equity exposure. So, while it’s 1.5x in terms of price exposure, it only delivers ~56% of the dividends of a 60/40 portfolio.