We’re a society that is constantly being tempted by bigger is better.
When you head out to dine at your favourite fast food joint, the options to upgrade your sides and drink while super-sizing your main are often just a few dollars and cents more.
If you’re ravenous enough having skipped lunch during a long day of work, the temptation to have that burger with two or three patties with bacon and extra cheese is all too tempting.
The colossal burger is bigger than your face and stretching your jaw open wide enough to take a bite is a bigger challenge than opening your mouth for a routine check-up at the dentist.
Heartburn be damned.
You’re in the zone living your best gluttonous life as condiments drip off of your face in all directions.
Really all you’ve done is add more of the same – extra patty, cheese and bun.
The Mutual Fund we’re reviewing today is like a triple patty burger.
Enter the room PSLDX Mutual Fund.
Better know as PIMCO StocksPLUS Long Duration Fund.
It stretches the canvas of your portfolio in a capital efficient manner giving you 100% stocks and 100% bonds.
Instead of pondering an optimal combination of stocks and bonds while being confined to a 100% sandbox, it boasts ‘I’ll take both’ at maximum capacity without compromise.
We’re not shaving down anything at the expense of something else.
It’s just one stacked on top of the other.
And my goodness gracious me has it ever worked out well under the right circumstances!
Consider its returns from 2009 until 2021 with all of the right conditions clearly conspiring in its favour.

PIMCO StocksPLUS Long Duration Performance
PLSDX 100/100 vs VBIAX 60/40 Returns from 2009 until 2021
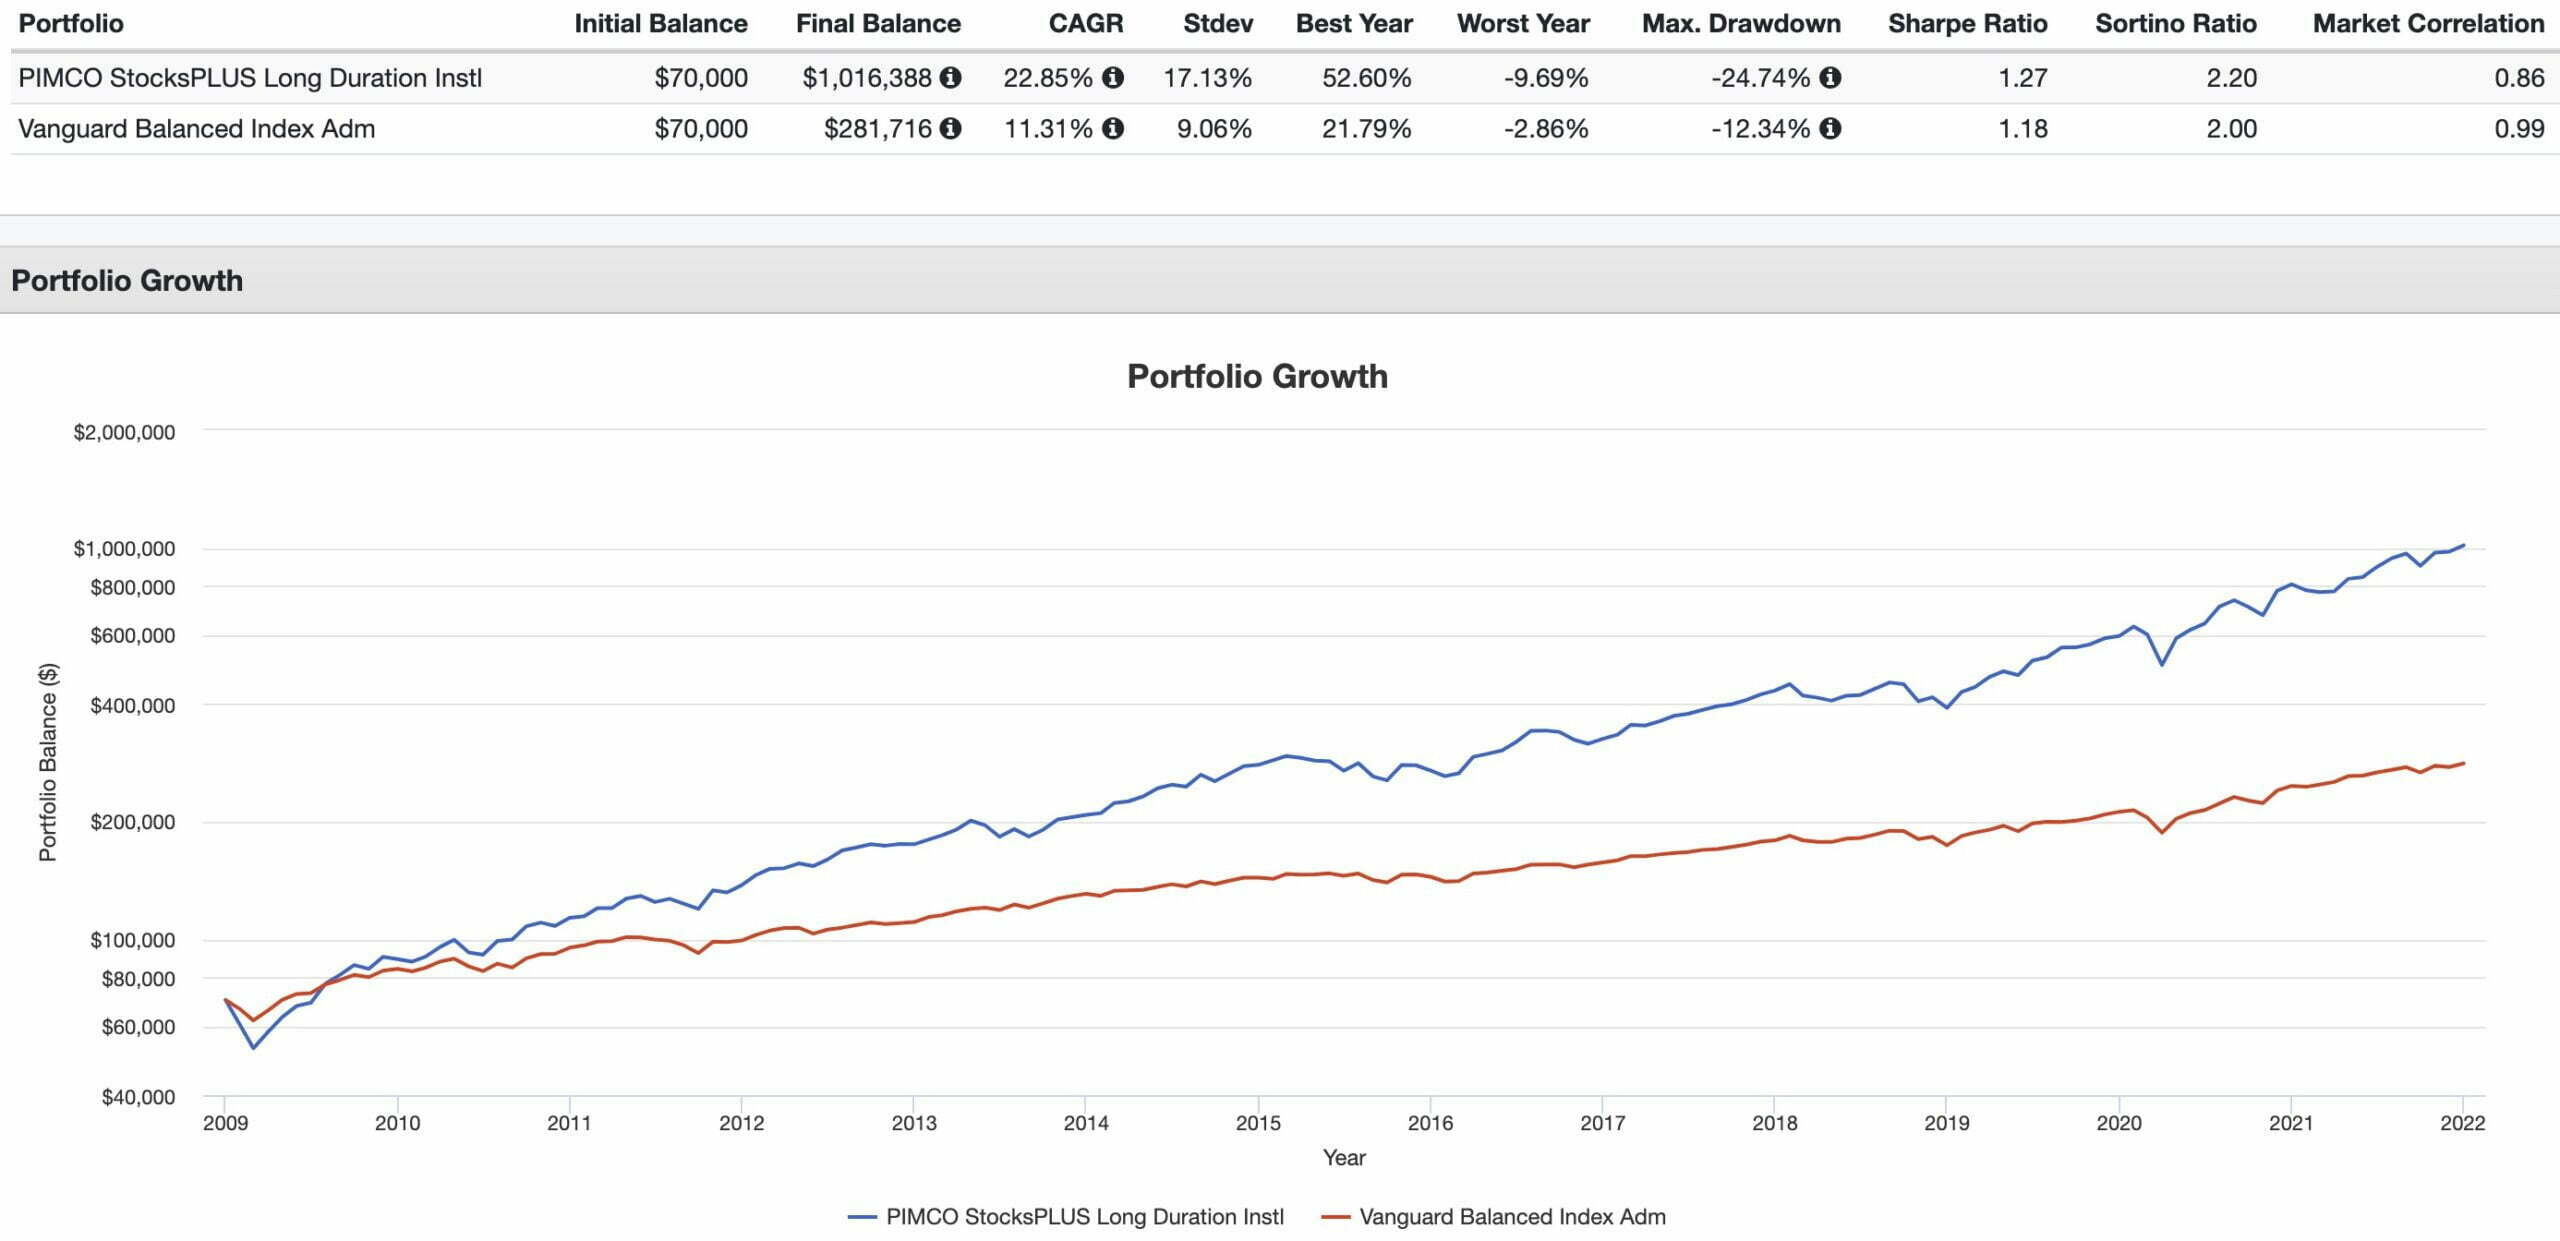
A $70,000 initial and only contribution to PSLDX would have compounded its socks off with a CAGR of 22.85%.
And that $70,000 left to its own devices would have turned you into a millionaire.
You’d have $1,016,388 by the end of 2021.
Not too shabby at all.
And if you played it safe with the industry standard 60/40 allocation?
You’d have compounded at an impressive rate of CAGR 11.31% for a grand total of $281,716.
Nothing to sneeze at obviously but you’re nowhere close to being a millionaire.
Here is a closer look.
CAGR: 22.85% vs 11.31%
RISK: 17.13% vs 9.06%
MAX DRAWDOWN: -24.74% vs -12.34%
SHARPE RATIO: 1.27 vs 1.18
SORTINO RATIO: 2.20 vs 2.00
MARKET CORRELATION: 0.99 vs 0.86
The reward of greater returns meant handling more risk (standard deviation) and maximum drawdown.
Now during an incredible bull market run that favoured US stocks all of this is fine and dandy.
But what about when inflation rears its ugly head and the correlation between stocks and bonds shifts to them both being skewered at the same time?
Enter the room 2022.
Any product that utilized long-only asset class leverage got eaten alive.
PLSDX 100/100 vs VBIAX 60/40 Returns 2022
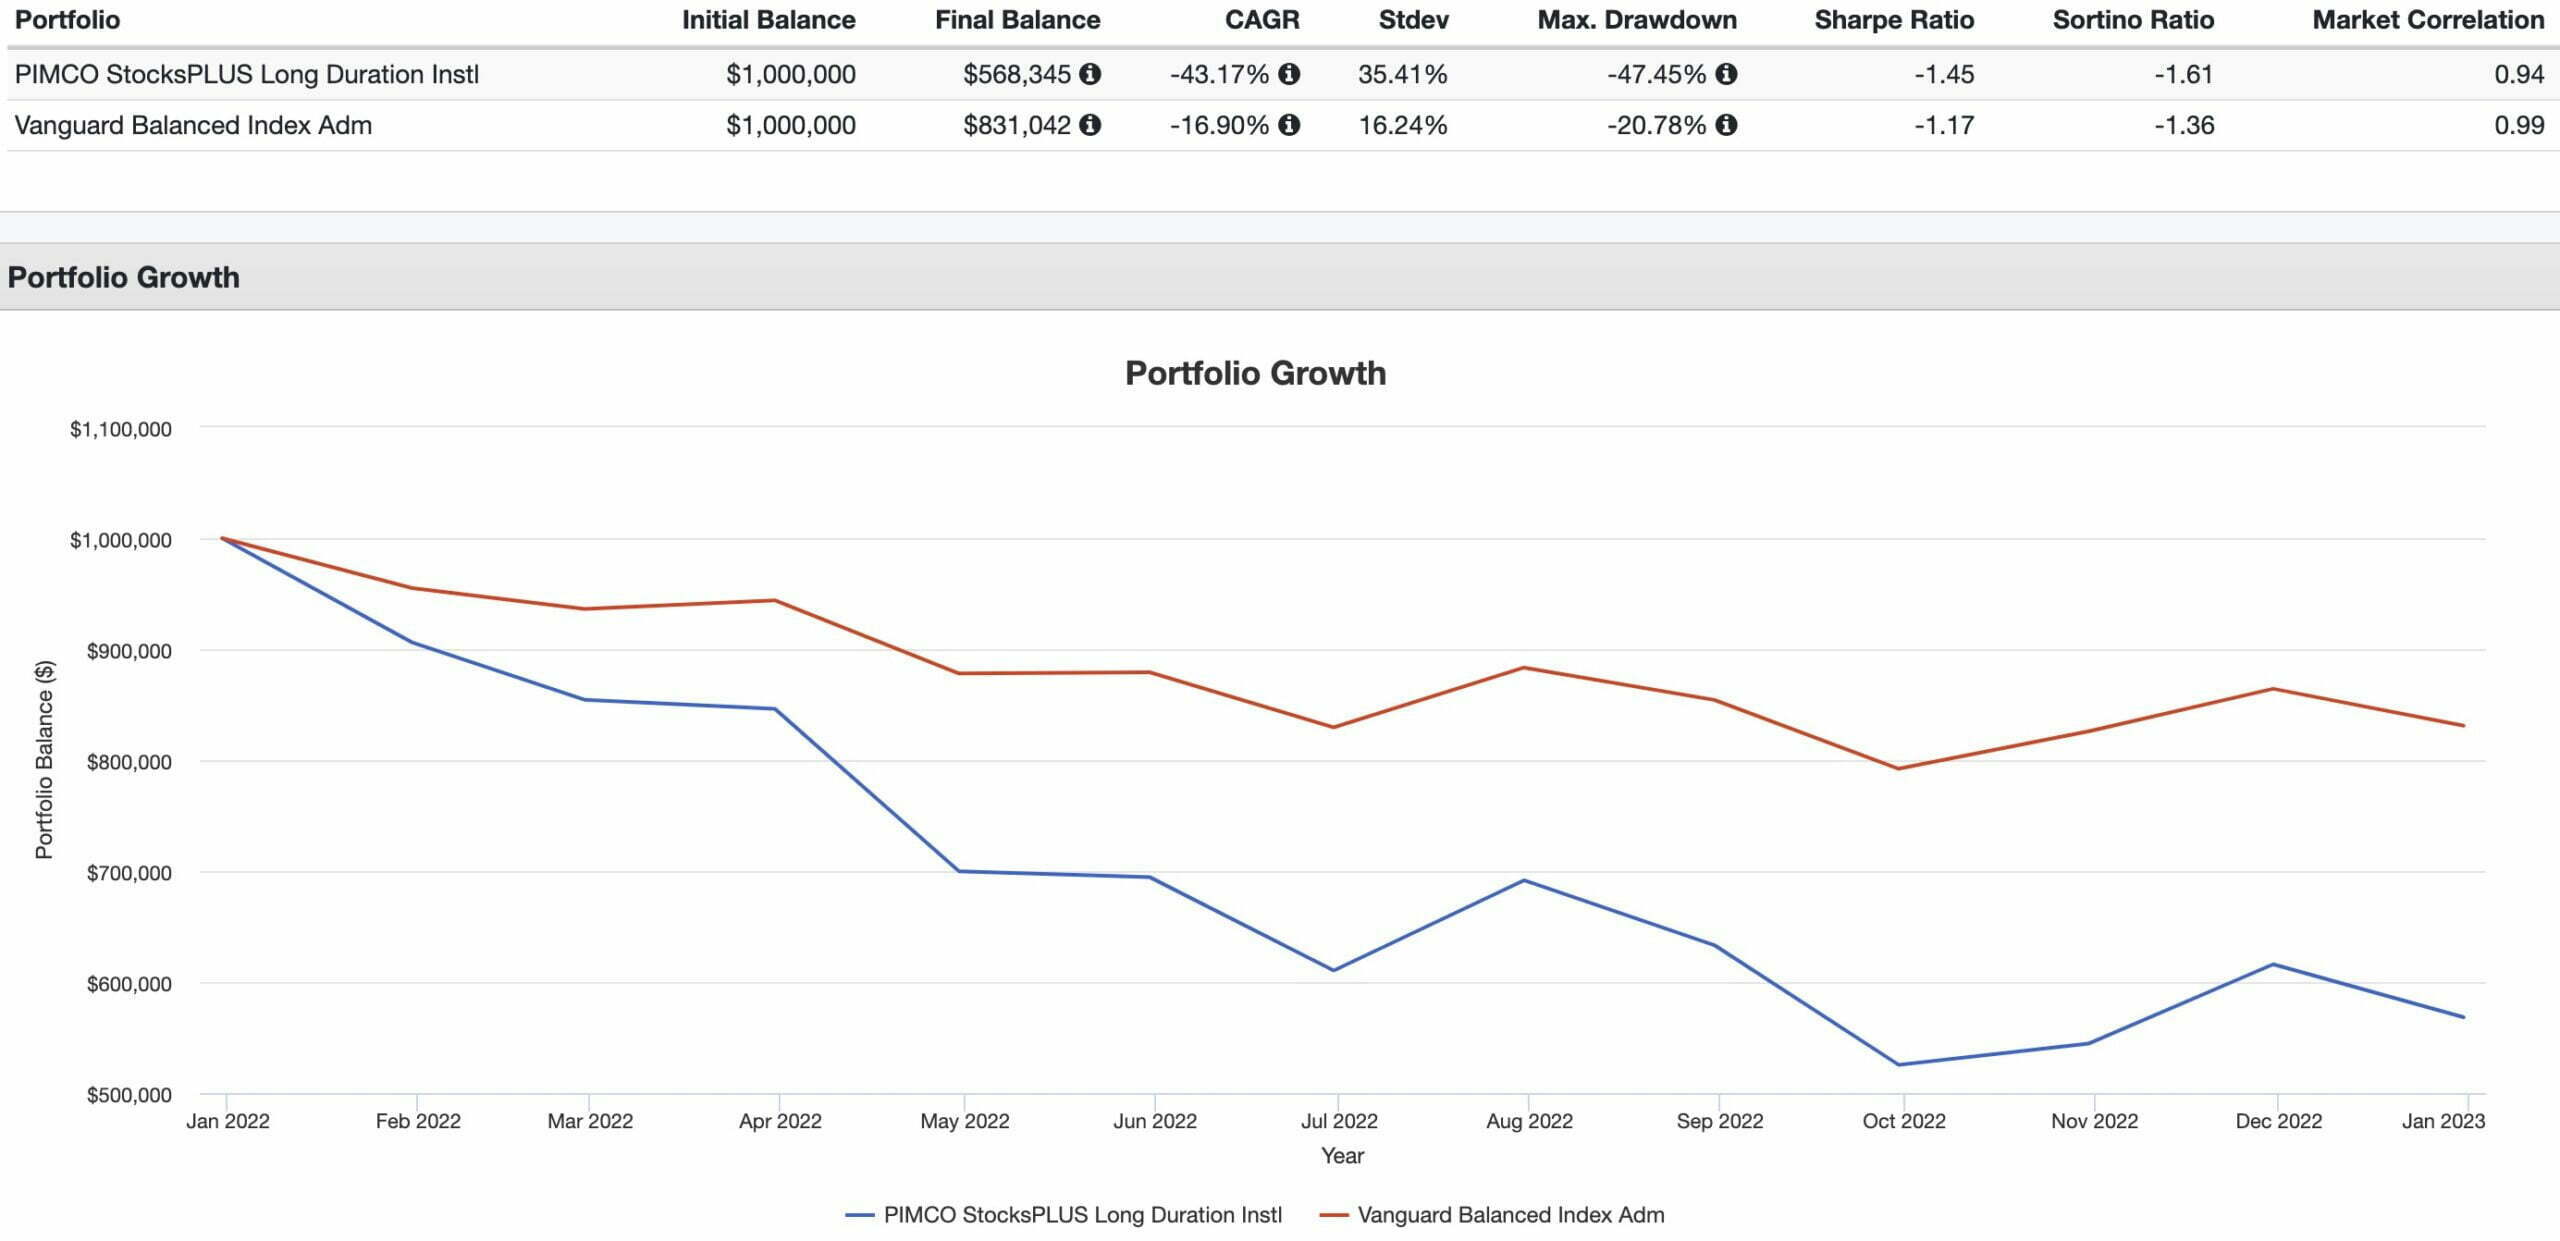
If 2009 to 2021 revealed the best case scenario for a 100/100 stocks and bonds fund, 2022 was the extreme underbelly.
Let’s consider that million dollar scenario once again.
Well, that almost got sliced in half.
With a -43.17% CAGR for the year a hypothetical million dollars ends up being $568,345 by the end of the year.
Here are the one year results of the 100/100 PSLDX vs 60/40 VBIAX.
CAGR: -43.17% vs -16.90%
RISK: 35.41% vs 16.24%
MAX DRAWDOWN: -47.45% vs -20.78%
SHARPE RATIO: -1.45 vs -1.17
SORTINO RATIO: -1.61 vs -1.36
MARKET CORRELATION: 0.94 vs 0.95
Yikes!
So when stocks and bonds (60/40 portfolio) are having one of the worst years on record a fund like this can fall apart rather fast.
What’s somewhat shocking is that there are quite a few investors inspired by 2X to 3X stock only or 2X to 3X stocks/bond combinations as total portfolio solutions.
This type of approach dials up the risk of two asset classes with the hope that low correlations remain.
Well, that’s considerably more risk than I’m willing to take.
Another solution is to view PSLDX as a capital efficient core building block as opposed to being a total portfolio solution.
In this scenario we’re able to diversify our portfolio beyond just stocks and bonds by adding negatively correlated strategies to smooth out returns.
50% PSLDX + 40% PQTIX + 10% BTAL vs 100% VBIAX vs 100% PSLDX 2014-2022
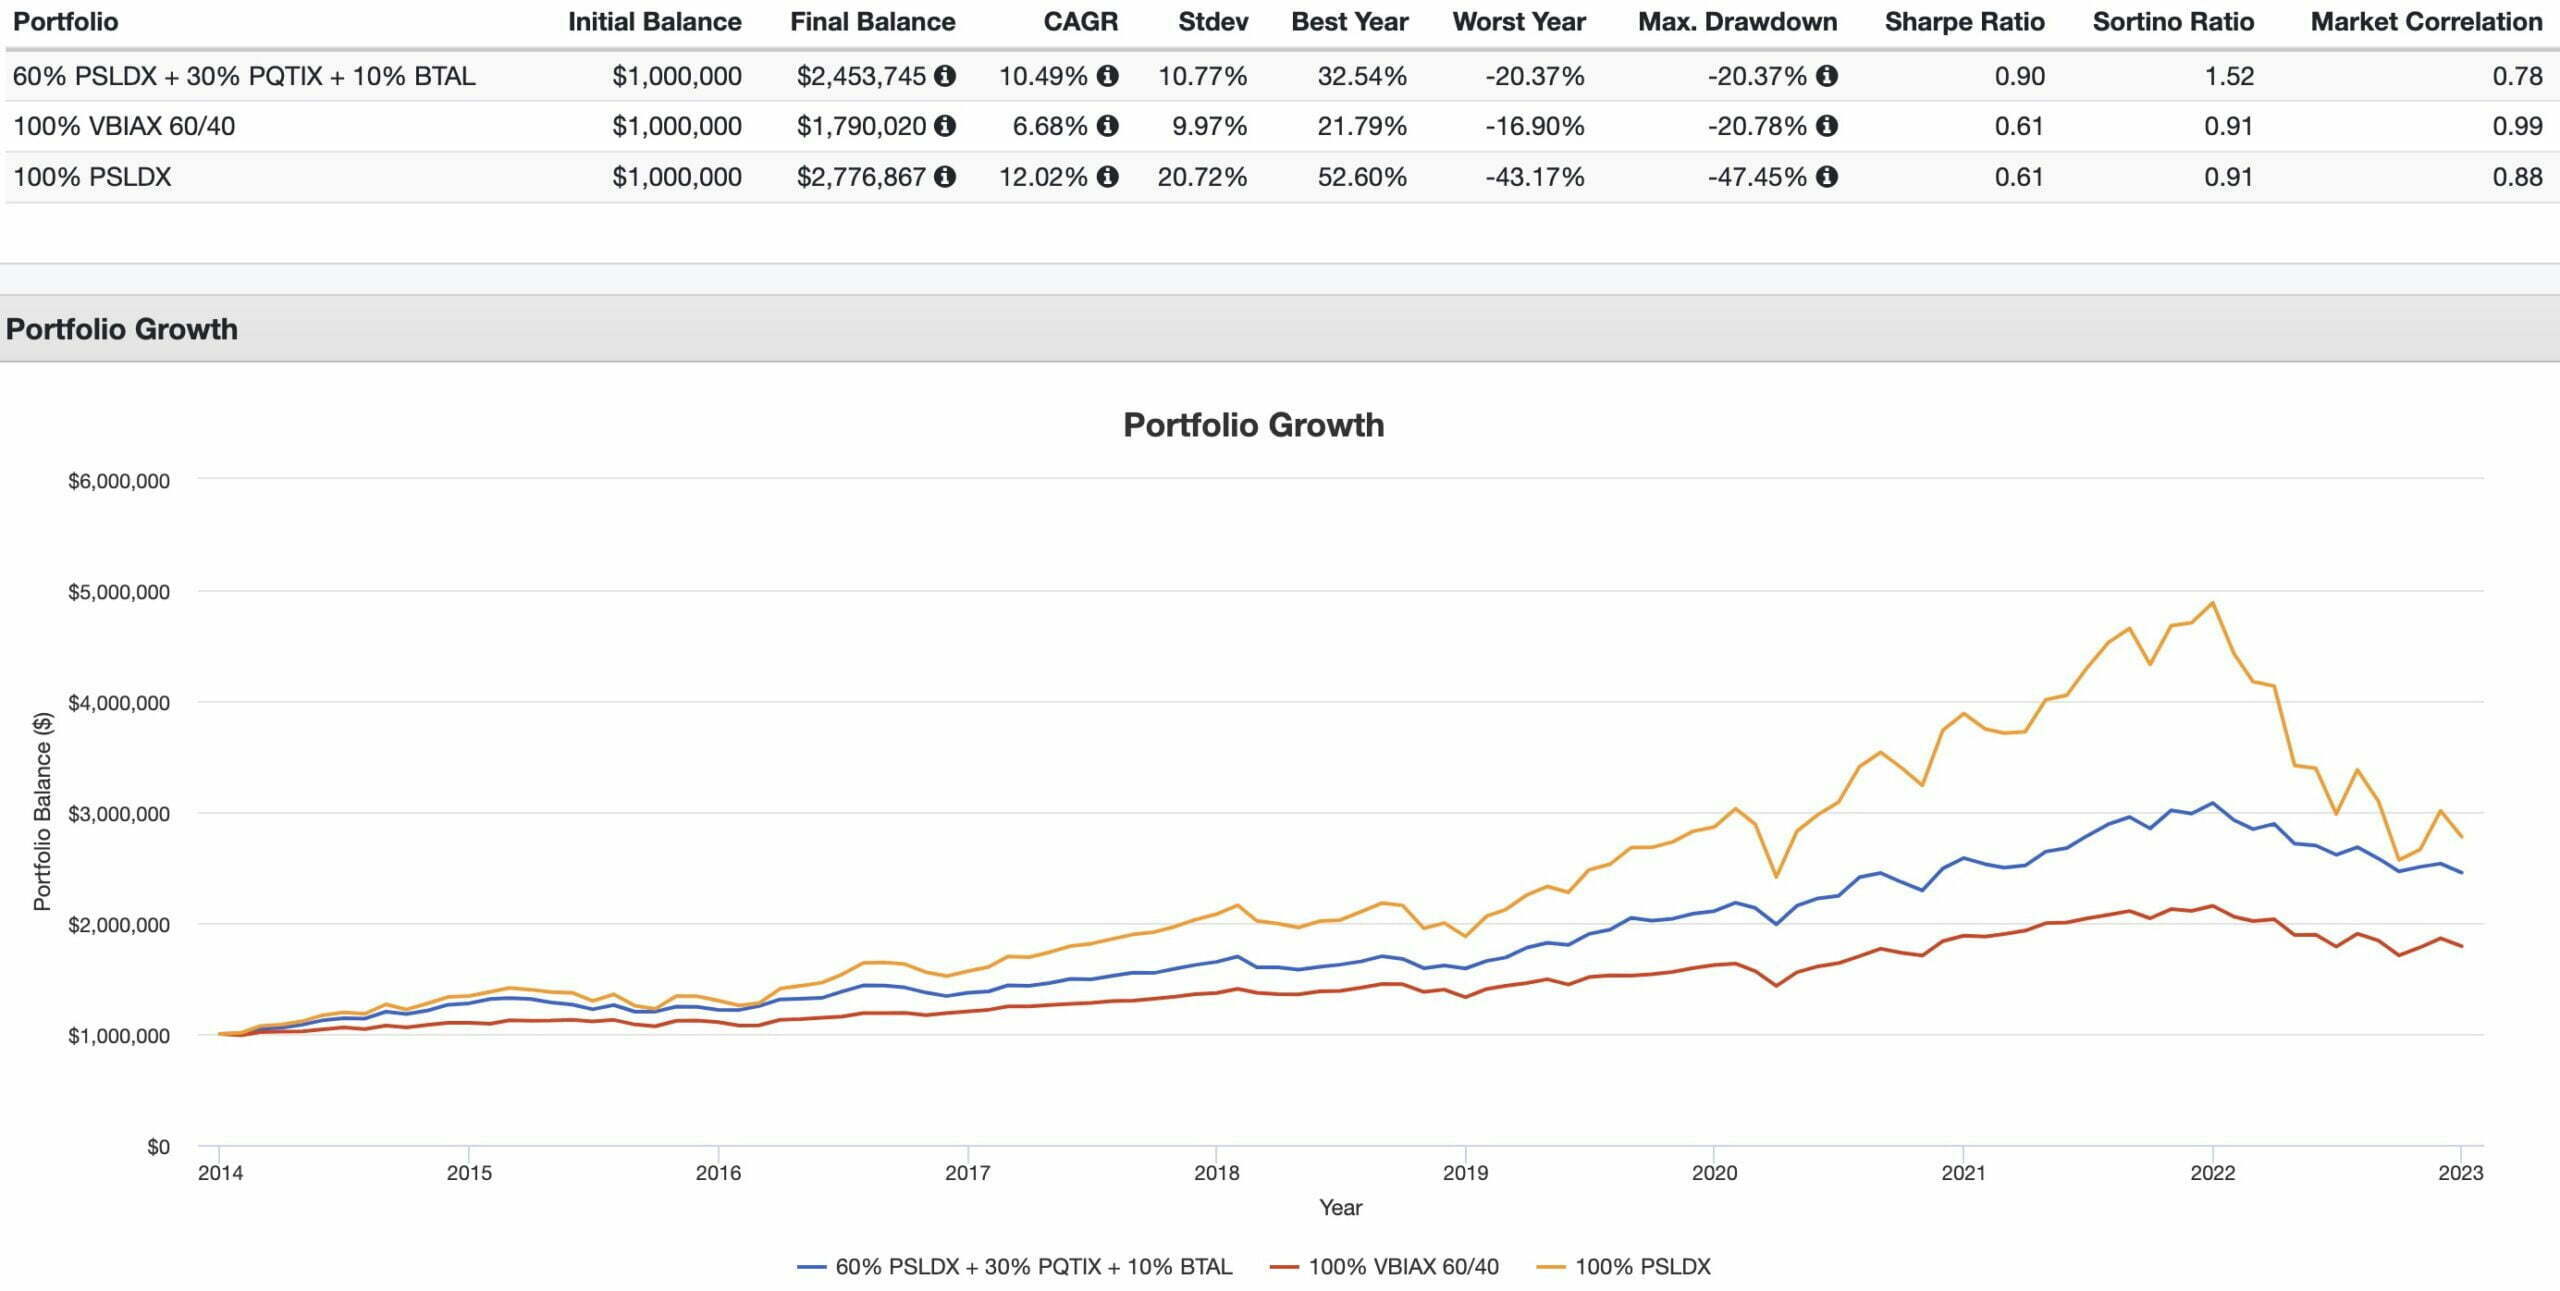
Let’s consider another sequence of returns from 2014 until 2022 (as far back as I’m able to back-test some ETFs):
CAGR: 10.49% vs 6.68% vs 12.02
RISK: 10.77% vs 9.97% vs 20.72%
MAX DRAWDOWN: -20.37% vs -47.45% vs -20.78%
SHARPE RATIO: 0.90 vs 0.61 vs 0.61
SORTINO RATIO: 1.52 vs 0.91 vs 0.91
MARKET CORRELATION: 0.78 vs 0.99 vs 0.88
By diversifying and toning down the exposure of our stocks and bonds we’re able to outperform a 60/40 portfolio by 381 basis points (10.49% vs 6.68%) while only shaving down 153 basis points (10.49% vs 12.02%) of returns versus a 100% PSLDX portfolio.
In return for slightly lower returns the diversified portfolio gains massive defensive benefits by shaving down volatility (stdev: 20.72% vs 10.77%) by 995 basis points.
Hence, our risk adjusted rate of returns boosts our Sharpe Ratio (0.90 vs 0.61) and Sortino Ratio (1.52 vs 0.91).
Monthly Correlations
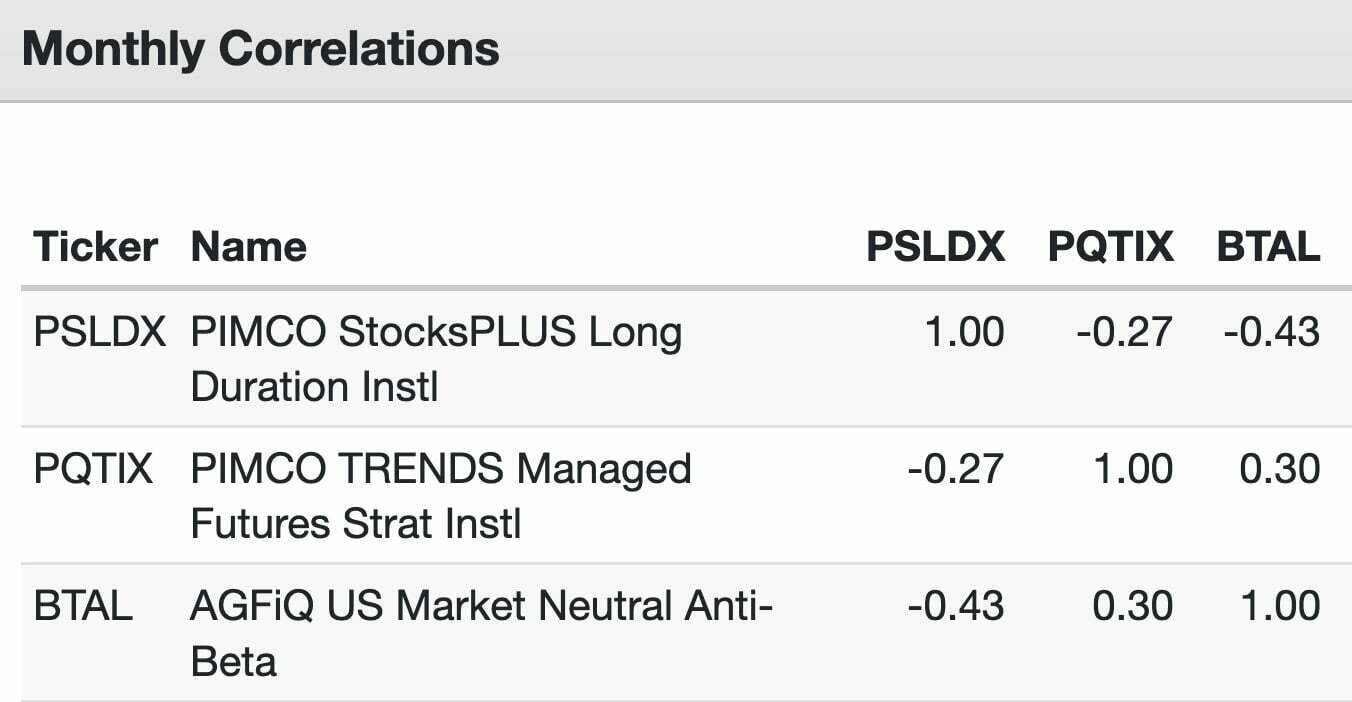
We’re able to see that our managed futures and anti-beta market neutral strategy bring massive diversification benefits from being uncorrelated with PSLDX.
By checking out the annul returns of the portfolio line-items we’re able to see how they’ve conspired to smooth out the returns of PSLDX.
Annual Returns of PSLDX + PQTIX + BTAL + VBIAX
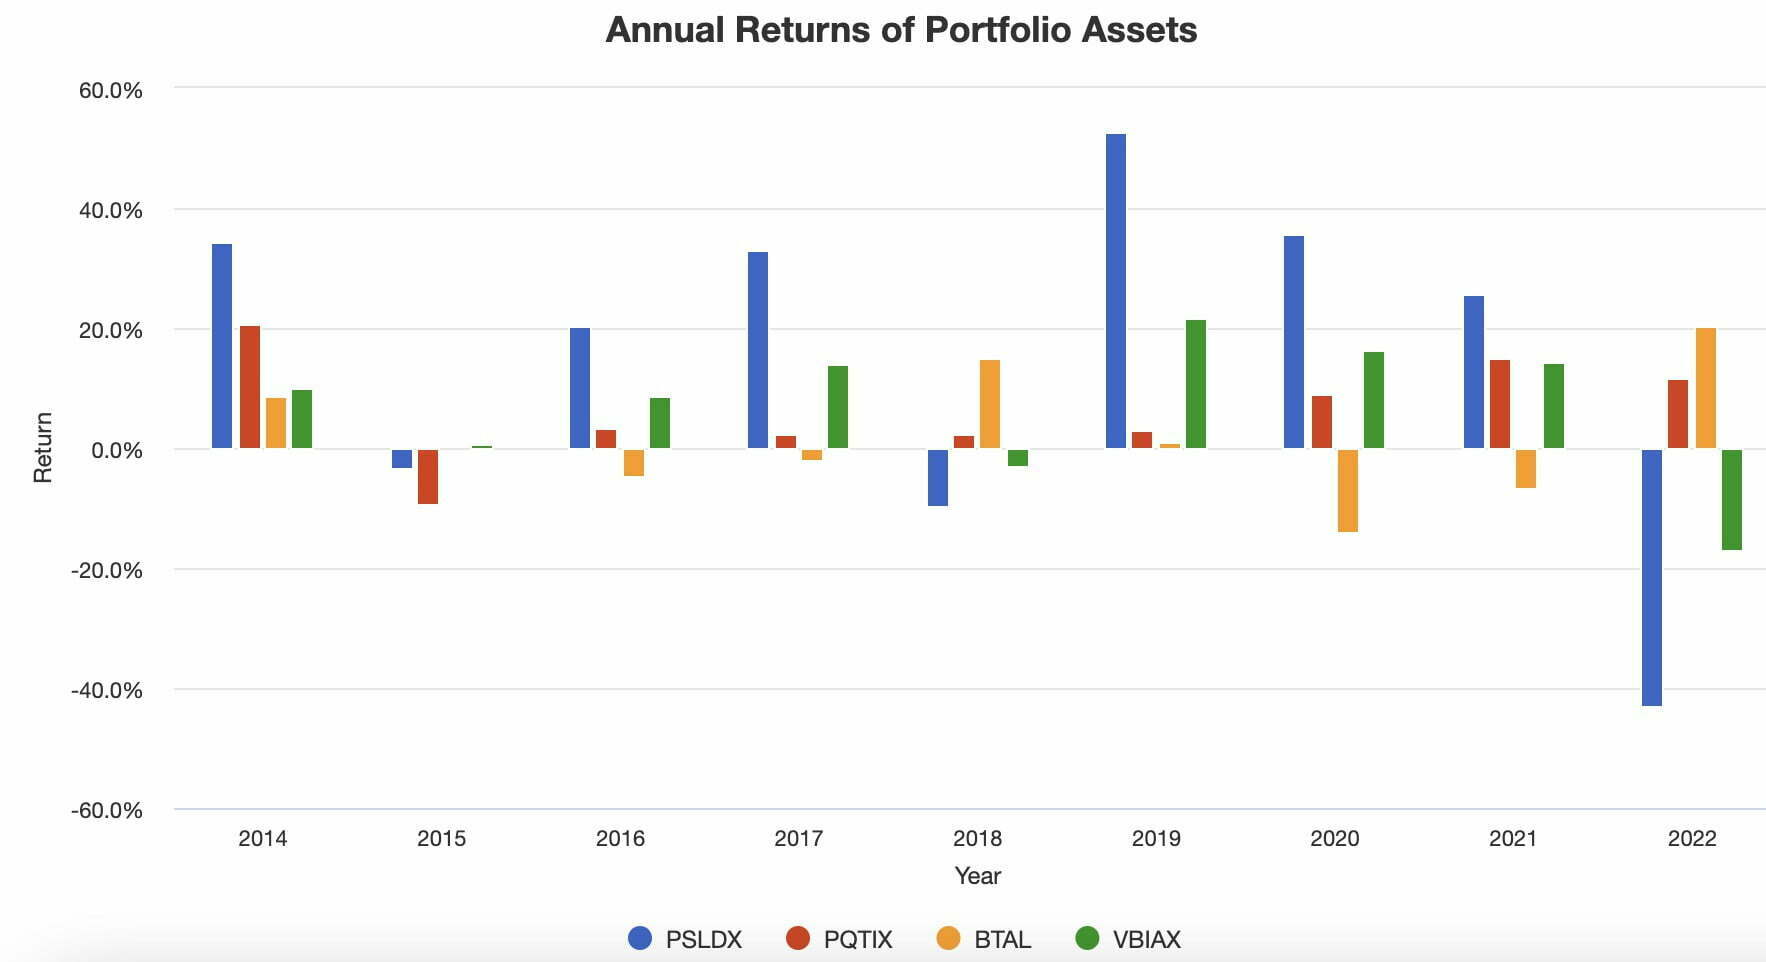
If you feast your eyes upon the years 2022 and 2018 it’s easy to see how PQTIX and BTAL conspired to limit the carnage being experienced by PSLDX.
However, that doesn’t come with a free lunch.
You’ll notice how those two funds were a drag on returns during years like 2019 and 2020.
It’s a trade-off at the end of the day.
However, we’re clearly able to see that we can utilize a fund like PSLDX to crush a standard 60/40 portfolio while still managing the portfolios risk versus return profile.
That’s a middle ground that makes sense to me.
The all in approach towards leveraged stocks and bonds only makes my stomach queasy.

PSLDX Mutual Fund Review: PIMCO StocksPLUS Long Duration Fund Of Leveraged Stocks and Bonds That Beats S&P 500 and 60/40 Portfolio Long-Term?

Hey guys! Here is the part where I mention I’m a travel blogger, vlogger and content creator! This investing opinion blog post ETF Review is entirely for entertainment purposes only. There could be considerable errors in the data I gathered. This is not financial advice. Do your own due diligence and research. Consult with a financial advisor.


PIMCO Investment Management: Fixed Income Specialists
PIMCO is renowned as being one of the industry’s top actively managed fixed income specialists.
However, they’ve also built out an impressive range of other investment strategies.
In particular, the StockPLUS product range now features seven mutual funds.

PIMCO StockPLUS Roster Of Funds
PSPTX Mutual Fund – StocksPLUS® Absolute Return Fund
PSTKX Mutual Fund – StocksPLUS® Fund
PISIX Mutual Fund – StocksPLUS® International Fund (U.S. Dollar-Hedged)
PSKIX Mutual Fund – StocksPLUS® International Fund (Unhedged)
PSLDX Mutual Fund – StocksPLUS® Long Duration Fund
PSTIX Mutual Fund – StocksPLUS® Short Fund
PSCSX Mutual Fund – StocksPLUS® Small Fund

The Case For Capital Efficient Stocks and Bonds Exposure
We’ve already spent ample time going over the base case for building an expanded canvas capital efficient portfolio.
Firstly, a 100/100 stock/bond portfolio should absolutely crush a 100% equity portfolio over an extended period of time.
However, it comes with a host of red flags including but not limited to inflation risk, duration risk and correlation risk.
In other words, something like a 2022 scenario where the fund has the potential to almost be sliced in half when stocks and bonds are struggling at the same time.
Hence, it makes sense from a risk management perspective to potentially be willing to shave down returns a little bit in order to make your portfolio more defensive.
Thus, I’m not a fan of a 100/100 stocks and bonds total portfolio solution.
Some folks are fond of that though and to each their own.
At the end of the day I’d like to outperform benchmarks but I’m even more concerned about managing risk.
There have never been more options for investors to confidently assemble a diversified expanded canvas portfolio.
The building blocks are at your disposal to use as you see fit.
You have funds such as BLNDX (50% stocks / 100% managed futures), GDE (90% stocks / 90% gold), BTAL (anti-beta market neutral) and TAIL (options based) to mix and match in such a manner where you bring a plethora of investing strategies to the table.
Thus, I feel like the fund presents itself as a tremendous core building block to create space for other strategies as opposed to being a total portfolio solution.


PIMCO StocksPLUS Long Duration Fund Overview, Holdings and Info
The investment case for “PIMCO StockPLUS Long Duration Fund ” has been laid out succinctly by the folks over at PIMCO: (source: fund landing page)
“Fund Overview Summary:
Taking an innovative approach to large-cap investing, the Fund combines active and passive management in S&P 500 derivatives, such as futures and swaps, collateralized by an actively managed portfolio of long-term bonds.
The strategy offers broad participation in the growth potential of U.S. stocks, potential diversification benefits and access to PIMCO’s expertise in seeking positive excess return.
Why Invest In This Fund:
StocksPLUS: More than an index fund A traditional index fund typically invests in all, or a representative sample, of the stocks in an index in an effort to replicate the return of the index.
PIMCO StocksPLUS Long Duration Fund seeks to outperform the index by employing a unique, bond-centric strategy.
It does this by purchasing low-cost S&P 500 derivatives and backing this exposure with an actively managed portfolio of diversified long-duration bonds.
Expert management: The fund offers the combined benefit of PIMCO’s 40 years of active bond management and two decades of passive, index-linked investment expertise.
Diverse roles in a portfolio: The Fund can serve as a strong core equity choice in an overall portfolio, complementing both fixed income holdings and traditional equity investments.”

PIMCO StocksPLUS Long Duration: Principal Investment Strategy
To better understand the process of how the fund operates, let’s turn our attention towards the prospectus where I’ve highlighted what I feel are the most salient parts and summarized the key points at the very bottom. (source: summary prospectus)
“Principal Investment Strategies:
The Fund seeks to exceed the total return of its benchmark indexes, the S&P 500 Index and a secondary blended index (as described below, and together with the S&P 500 Index, the “Indexes”), by investing under normal circumstances in S&P 500 Index derivatives, backed by a diversified portfolio of long-term Fixed Income Instruments.
“Fixed Income Instruments” include bonds, debt securities and other similar instruments issued by various U.S. and non-U.S. public- or private-sector entities.
The Fund may invest in common stocks, options, futures, options on futures and swaps.
The Fund normally uses S&P 500 Index derivatives instead of S&P 500 Index stocks to attempt to equal or exceed the daily performance of the Indexes.
The Fund typically will seek to gain long exposure to the S&P 500 Index in an amount, under normal circumstances, approximately equal to the Fund’s net assets.
The value of S&P 500 Index derivatives should closely track changes in the value of the S&P 500 Index.
However, S&P 500 Index derivatives may be purchased with a small fraction of the assets that would be needed to purchase the equity securities directly, so that the remainder of the assets may be invested in Fixed Income Instruments.
PIMCO actively manages the Fixed Income Instruments held by the Fund with a view toward enhancing the Fund’s total return, subject to an overall portfolio duration which normally varies within two years (plus or minus) of the portfolio duration of the securities comprising the Bloomberg Long-Term Government/Credit Index, as calculated by PIMCO, which as of May 31, PIMCO StocksPLUS® Long Duration Fund PIMCO Funds | Summary Prospectus 2022 was 14.72 years.
Duration is a measure used to determine the sensitivity of a security’s price to changes in interest rates.
The longer a security’s duration, the more sensitive it will be to changes in interest rates.
The S&P 500 Index is composed of 500 selected common stocks that represent approximately two-thirds of the total market value of all U.S. common stocks.
The Fund seeks to remain invested in S&P 500 Index derivatives and/or S&P 500 Index stocks even when the S&P 500 Index is declining.
Though the Fund does not normally invest directly in S&P 500 Index securities, when S&P 500 Index derivatives appear to be overvalued relative to the S&P 500 Index, the Fund may invest all of its assets in a “basket” of S&P 500 Index stocks.
The Fund may invest, without limitation, in derivative instruments, such as options, futures contracts or swap agreements, or in mortgage- or asset-backed securities, subject to applicable law and any other restrictions described in the Fund’s prospectus or Statement of Additional Information.
The Fund may purchase or sell securities on a when-issued, delayed delivery or forward commitment basis and may engage in short sales.
Assets not invested in equity securities or derivatives may be invested in Fixed Income Instruments.
The Fund may invest up to 10% of its total assets in high yield securities (“junk bonds”) rated B or higher by Moody’s Investors Service, Inc. (“Moody’s”), or equivalently rated by Standard & Poor’s Ratings Services (“S&P”) or Fitch, Inc. (“Fitch”), or if unrated, determined by PIMCO to be of comparable quality.
In the event that ratings services assign different ratings to the same security, PIMCO will use the highest rating as the credit rating for that security.
The Fund may invest up to 30% of its total assets in securities denominated in foreign currencies and may invest beyond this limit in U.S. dollar-denominated securities of foreign issuers.
The Fund may invest up to 15% of its total assets in securities and instruments that are economically tied to emerging market countries (this limitation does not apply to investment grade sovereign debt denominated in the local currency with less than 1 year remaining to maturity, which means the Fund may invest, together with any other investments denominated in foreign currencies, up to 30% of its total assets in such instruments).
The Fund will normally limit its foreign currency exposure (from non-U.S. dollar-denominated securities or currencies) to 20% of its total assets. The Fund may also invest up to 10% of its total assets in preferred securities.”

PIMCO StocksPLUS Long Duration Investment Strategy Key Points
- Designed to exceed the returns of the S&P 500 index as its benchmark
- 100/100 combination of S&P 500 Index derivatives and a diversified portfolio of long-term Fixed Income Instruments
- Active management for the “fixed income” part of the portfolio which is PIMCO’s bread and butter expertise as a firm
- Fixed income duration matches Bloomberg Long-Term Government/Credit Index by +/- 2 years (currently: 14.72 years)
- Can invest 10% of its total assets in high yield “junk bonds” and 30% in foreign currencies and 15% emerging markets instruments
PIMCO StocksPLUS Long Duration Fund Info
Ticker: PSLDX
Net Expense Ratio: 0.59
AUM: 794 Billion
Inception: 08/31/2007

PIMCO StocksPLUS Long Duration Fund Pros and Cons
Let’s move on to examine the potential pros and cons of PIMCO StocksPLUS Long Duration fund.
PSLDX Pros
- 100/100 equities and bonds expanded canvas product that has crushed the S&P 500 as its benchmark since inception
- Harnessing the expertise of PIMCO as an active fixed income specialist to deliver alpha over passive bond indexes
- The opportunity to capital efficiently combine this stocks and bonds strategy with other diversifying strategies such as managed futures, market neutral, tactical asset allocation, long-short equity, gold and/or options
- The opportunity to build a portfolio where returns and risk management collide with thoughtful portfolio construction
- A long-track record for the fund which survived the 2008 GFC and 2022 stocks/bond massacre
- An impressive product range of StocksPLUS options to consider alongside PSLDX (international and small stocks especially)
- A very reasonable net expense ratio of 0.59 for an actively managed strategy
PSLDX Cons
- 2022 reveals the downside of a leveraged stocks and bond strategy where they both get crushed at the same time where the fund almost gets sliced in half
- As a Mutual Fund it is not available to investors outside of the US and also its institutional class designation may mean a high initial investment is necessary
- The fund is not suitable for a taxable account

PIMCO StocksPLUS Long Duration Fund Model Portfolio Ideas
These asset allocation ideas and model portfolios presented herein are purely for entertainment purposes only. This is NOT investment advice. These models are hypothetical and are intended to provide general information about potential ways to organize a portfolio based on theoretical scenarios and assumptions. They do not take into account the investment objectives, financial situation/goals, risk tolerance and/or specific needs of any particular individual.
Let’s explore how PIMCO StocksPLUS Long Duration Fund potentially integrates into a portfolio at large.
We’re at my favourite part of the fund review where we get to construct a model portfolio.
Let’s put together a four fund portfolio that utilizes an expanded canvas capital efficient format to the max.
40% PSLDX
50% BLNDX
5% BTAL
5% TAIL
Our easy to assemble four fund portfolio features five distinct strategies including stocks, bonds, managed futures, anti-beta market neutral and options based tail risk.
Our overall exposure would be as follows:
Stocks: 65%
Bonds: 40%
Managed Futures: 50%
Market Neutral: 5%
Tail Options: 5%
Let’s see how that portfolio has performed against a 60/40 as far as back we’re able to backtest it.
PIMCO StocksPLUS Long Duration Fund + Friends Portfolio vs 60/40 Portfolio (VBIAX)
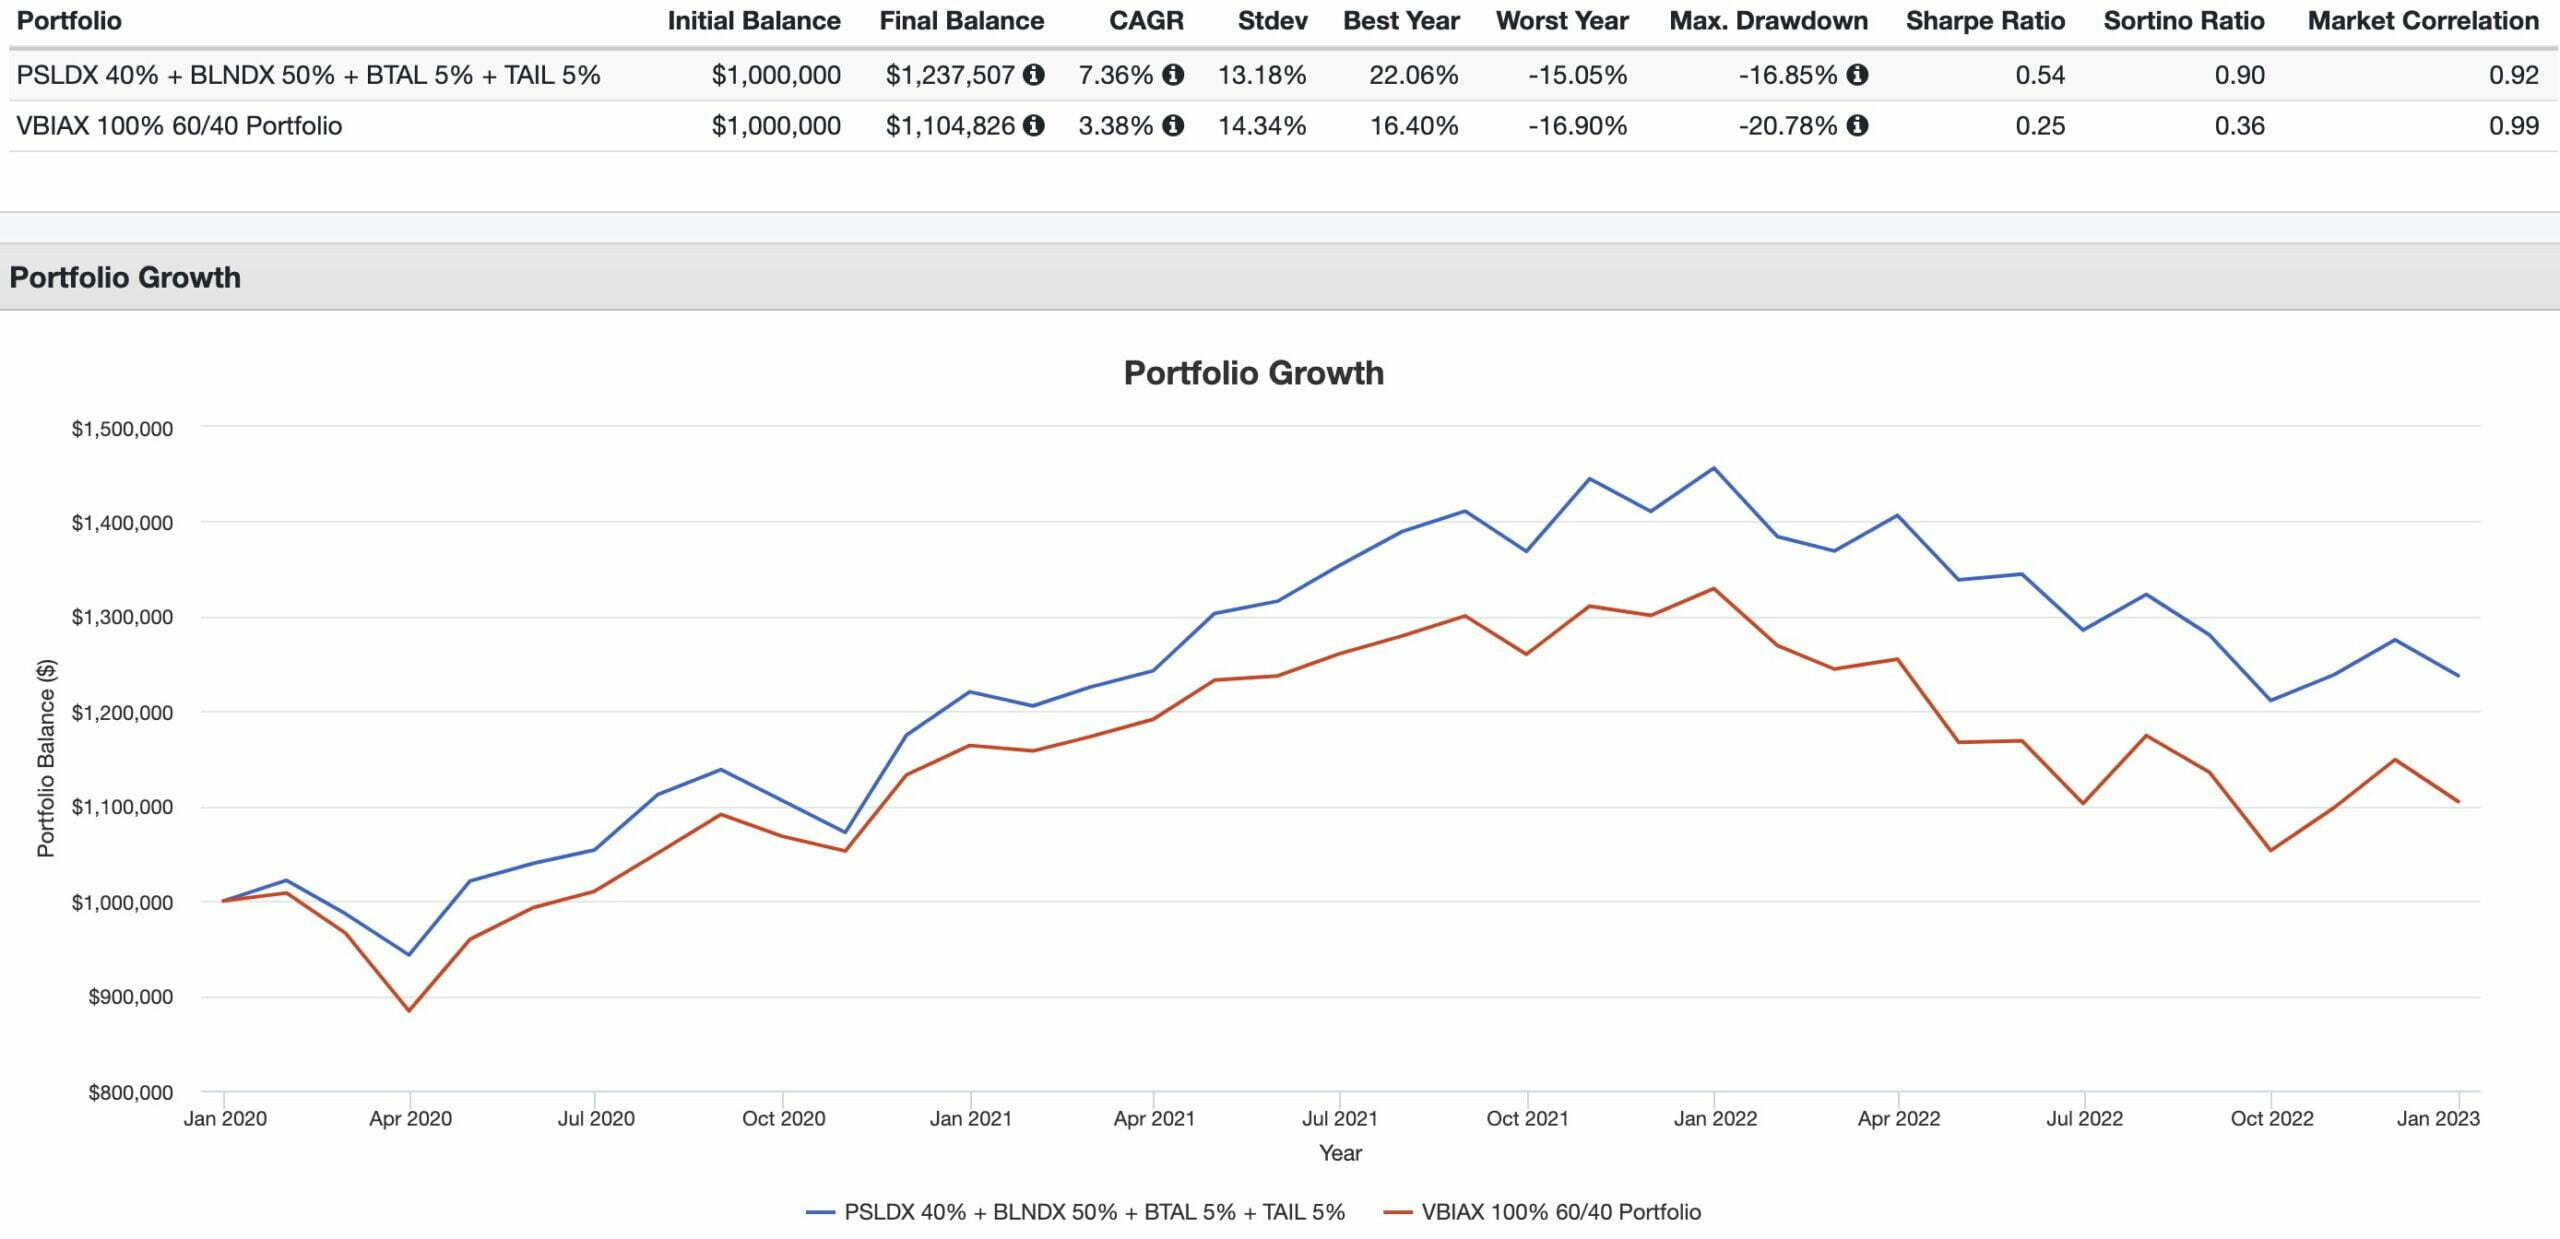
CAGR: 7.36% vs 3.38%
RISK: 13.18% vs 14.34%
BEST YEAR: 22.06% vs 16.40%
WORST YEAR: -15.05% vs -16.90%
MAX DRAWDOWN: -16.85% vs -20.78%
SHARPE RATIO: 0.54 vs 0.25
SORTINO RATIO: 0.90 vs 0.36
MARKET CORRELATION: 0.92 vs 0.99
There is absolutely not one point of consideration for the 60/40 portfolio to brag about versus the diversified portfolio we’ve assembled.
In terms of returns it is a convincing win of 398 basis points of outperformance (7.36% vs 3.38%).
We’re better at managing risk, have a more palatable worst year and experience a less ferocious max drawdown.
I’ll roll with this portfolio versus a milquetoast 60/40 in both good and bad economic times.

What Others Have To Say About PIMCO StocksPLUS Long Duration Fund
source: Retire With Less on YouTube
source: Optimized Portfolio on YouTube

PIMCO StocksPLUS Long Duration (PSLDX) — 12-Question FAQ
1) What is PSLDX and what’s the core idea?
PSLDX is PIMCO’s StocksPLUS Long Duration mutual fund that delivers roughly 100% S&P 500 exposure (via derivatives) stacked on top of an actively managed portfolio of long-duration bonds—a capital-efficient “100/100” stocks+bonds design.
2) How does it get 100% equity and 100% bonds at once?
It uses S&P 500 futures/swaps (low capital usage) for equity beta, freeing most assets to purchase a separately managed long-duration bond sleeve. You effectively hold full equity exposure and a full long-bond portfolio simultaneously.
3) What makes PSLDX different from an index fund?
Rather than owning all S&P 500 stocks, it seeks to outperform by pairing cheap index derivatives with PIMCO’s active bond management (duration, sector, credit/security selection). Equity beta ≈ index; alpha target = the bond sleeve.
4) What risks matter most?
Dual drawdown risk: When stocks and long bonds fall together (e.g., inflation shocks), losses can compound.
Interest-rate/duration risk: Long-duration bonds are very rate-sensitive.
Leverage-like profile: Stacked exposures amplify volatility and max drawdowns versus a 60/40.
5) What did 2022 teach us about PSLDX?
It showcased the downside tail of the 100/100 design: both stocks and long bonds struggled, producing a large single-year drawdown. Lesson: the fund can be brutal in inflationary, rising-rate regimes when stock/bond correlation turns positive.
6) When can PSLDX shine?
Historically, it’s thrived when U.S. equities trend up and yields fall/stay stable (long bonds help). In long bull markets with benign inflation, the stacked return engine can materially outperform traditional 60/40 allocations.
7) What’s the bond sleeve’s mandate?
PIMCO actively manages long-duration fixed income, typically targeting portfolio duration within ±2 years of the Bloomberg Long-Term Gov/Credit index. They may use credit, securitized, and global exposures (within stated limits) to add alpha.
8) Is PSLDX meant to be a total portfolio?
It can be used as a high-octane core, but many investors treat it as a capital-efficient building block, then add diversifiers (e.g., managed futures, anti-beta market neutral, tail-risk, gold) to reduce correlation risk and smooth returns.
9) Who might consider PSLDX—and who should probably avoid it?
Consider: Investors who understand stacked exposures, can tolerate higher volatility/drawdowns, and want active bond alpha on top of equity beta.
Avoid: Those needing low volatility, investing in taxable accounts (potential tax inefficiency), or who can’t stick through deep drawdowns.
10) Fees, vehicle, and availability?
It’s a U.S. mutual fund (not an ETF). Net expense ratio ~0.59% (per summary materials). Some share classes may require higher minimums. Generally not available to non-U.S. investors and may be ill-suited for taxable accounts.
11) What role can it play in a diversified plan?
Use PSLDX to “expand the canvas”: keep equity + long-bond exposure while freeing capital (versus traditional allocations) to layer in uncorrelated strategies (e.g., PQTIX, BTAL, managed futures, tail-hedges) for better risk control.
12) Key takeaways in one line?
PSLDX is a powerful but regime-sensitive 100/100 engine—outstanding in friendly stock/bond climates, but it demands diversification (and strong stomachs) when inflation/rates bite and stock-bond correlations flip.
Nomadic Samuel Final Thoughts
In many regards PSLDX has paved the way for other capital efficient products being developed in recent years.
It is the OG and it has also survived some very serious tests when you consider it launched shortly before the 2008 GFC and survived the 2022 stocks/bonds onslaught.
I’d love to add it to my portfolio but unfortunately I’m Canadian!
Maybe someday in the future PIMCO will introduce an ETF version.
For the time being I’ll have to wait.
Anyhow, we’re at the stage in this review where I’m more interested in what you have to say.
Is PSLDX on your radar?
Are you an expanded canvas capital efficient investor?
Please let me know in the comments below.
That’s all I’ve got for today.
Ciao for now.
Important Information
Comprehensive Investment Disclaimer:
All content provided on this website (including but not limited to portfolio ideas, fund analyses, investment strategies, commentary on market conditions, and discussions regarding leverage) is strictly for educational, informational, and illustrative purposes only. The information does not constitute financial, investment, tax, accounting, or legal advice. Opinions, strategies, and ideas presented herein represent personal perspectives, are based on independent research and publicly available information, and do not necessarily reflect the views or official positions of any third-party organizations, institutions, or affiliates.
Investing in financial markets inherently carries substantial risks, including but not limited to market volatility, economic uncertainties, geopolitical developments, and liquidity risks. You must be fully aware that there is always the potential for partial or total loss of your principal investment. Additionally, the use of leverage or leveraged financial products significantly increases risk exposure by amplifying both potential gains and potential losses, and thus is not appropriate or advisable for all investors. Using leverage may result in losing more than your initial invested capital, incurring margin calls, experiencing substantial interest costs, or suffering severe financial distress.
Past performance indicators, including historical data, backtesting results, and hypothetical scenarios, should never be viewed as guarantees or reliable predictions of future performance. Any examples provided are purely hypothetical and intended only for illustration purposes. Performance benchmarks, such as market indexes mentioned on this site, are theoretical and are not directly investable. While diligent efforts are made to provide accurate and current information, “Picture Perfect Portfolios” does not warrant, represent, or guarantee the accuracy, completeness, or timeliness of any information provided. Errors, inaccuracies, or outdated information may exist.
Users of this website are strongly encouraged to independently verify all information, conduct comprehensive research and due diligence, and engage with qualified financial, investment, tax, or legal professionals before making any investment or financial decisions. The responsibility for making informed investment decisions rests entirely with the individual. “Picture Perfect Portfolios” explicitly disclaims all liability for any direct, indirect, incidental, special, consequential, or other losses or damages incurred, financial or otherwise, arising out of reliance upon, or use of, any content or information presented on this website.
By accessing, reading, and utilizing the content on this website, you expressly acknowledge, understand, accept, and agree to abide by these terms and conditions. Please consult the full and detailed disclaimer available elsewhere on this website for further clarification and additional important disclosures. Read the complete disclaimer here.


