The version of Warren Buffett that occupies the modern financial imagination is a grandfatherly archetype who sits on a massive pile of cash, reads annual reports all day, buys dominant consumer monopolies, and holds them forever. It is a deeply comforting image, widely sold in retail investment books, and fundamentally misleading. It implies that value investing is a static, monolithic philosophy that remains identical whether you are managing ten thousand dollars or one trillion dollars.
When you look at the primary financial disclosures, you discover that the hyper-performance era of Buffett’s career did not occur at Berkshire Hathaway. It took place between 1957 and 1969 inside Buffett Partnership Ltd. (BPL). During this twelve-year run, the partnership generated a 29.5% gross compounded annual growth rate (CAGR).
The strategy that generated those astronomical numbers was not the passive ownership of moat-protected brands. It was a high-velocity, small-scale asset allocation strategy that relied on micro-cap asset liquidations, short-term corporate arbitrage, and hostile activist interventions.
The modern Buffett—the one allocating billions into mega-cap positions—is an asset allocation chameleon who was forced to completely redesign his methodology. He did not change his style because of a sudden, unprompted philosophical epiphany. He changed it because he hit the inescapable wall of capital scale.
There were not two contradictory Buffetts. There was one allocator adapting to two completely different capital regimes. BPL Buffett was a specialized system built to exploit small-scale market inefficiencies and manually manufacture corporate catalysts. Berkshire Buffett is an economic system built to manage permanent corporate capital, maximize tax deferral, and deploy billions into highly liquid markets. The fundamental error of the modern retail investor is attempting to copy the later-career portfolio moves without copying the underlying corporate architecture that makes those moves mathematically viable.

| Era | Operating Vehicle | Approximate Asset Size | Core Strategy Focus | Historical Returns (CAGR) |
| 1957–1969 | Buffett Partnership Ltd. | $100K to $104M | Net-nets, special situations, active corporate controls. | 29.5% Gross / 23.8% Net |
| 1965–1999 | Berkshire Hathaway | $20M to $100B+ | Quality moat compounders, private wholly owned subsidiaries. | ~24% Market Value |
| 2011–2025 | Berkshire Hathaway | $400B to $1T+ | Ultra-liquid mega-caps, large cash buffers, market-proximate scale. | Closer to broad-market returns |

Style Difference One — From Mispriced Assets to Durable Businesses
The foundational divergence between the Partnership style and the Berkshire style lies in what actually drives the return on a security.
During the Partnership era, Buffett was an asset-math purist, executing a refined version of Benjamin Graham’s classic “net-net” framework. The core mechanism was simple quantitative cheapness. BPL looked for obscure, ignored micro-caps trading at less than two-thirds of their net current asset value. These were often deeply flawed, unglamorous businesses—frequently called “cigar butts.” The investment thesis did not require the company to grow, innovate, or even possess competent management. The return was driven entirely by a reversion to asset value: buying a dollar of liquid assets for fifty cents and selling it once the public market corrected the mispricing or an activist forced a liquidation.
Give me enough old Buffett letters and even I can start romanticizing dying windmill manufacturers and obsolete farm equipment producers. That is usually my cue to step away from the spreadsheet, drink some water, and remember that these were structurally terminal operations.
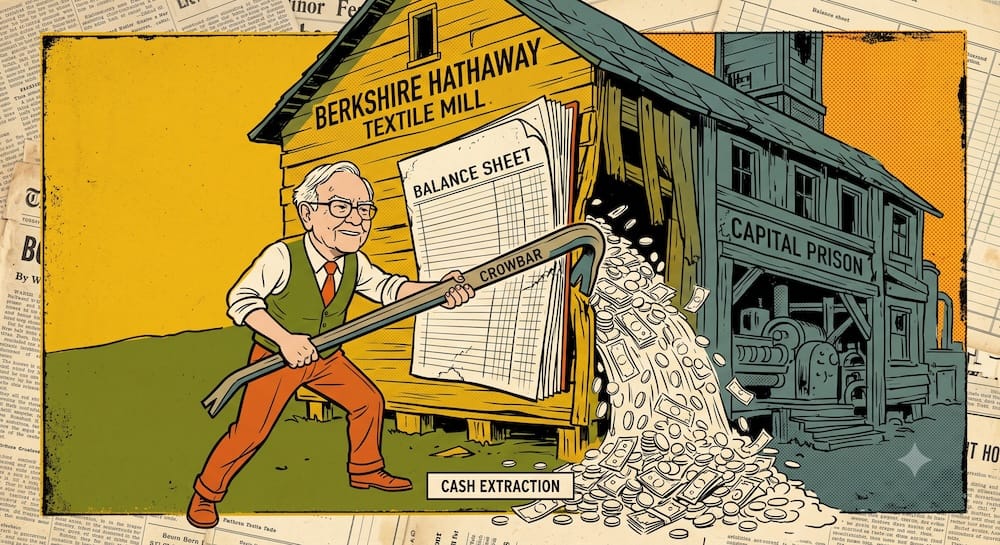
As capital scaled, the “cigar butt” style became mechanically impossible to execute. When you manage hundreds of billions, you cannot buy a meaningful position in a micro-cap trading below liquidation value because your first purchase order would violently re-price the entire illiquid stock.
The Berkshire style inverted this entire logic. Instead of searching for cheap balance sheets, Berkshire searches for premium income statements. The modern style prioritizes a high return on equity (ROE), minimal capital expenditure requirements, and a durable competitive advantage—a “moat”—that allows the business to raise prices without losing market share. In the Berkshire regime, value is driven by the long-term compounding of internal cash flows, not by a short-term multiple re-rating. Under the partnership model, a bad business at a wonderful price was an ideal investment; under the Berkshire model, it is an institutional death sentence.
Style Difference Two — From Catalyst Creation to Patient Ownership
The second core contrast centers on the investor’s operational role. In the early partnership days, Buffett did not sit back and wait for the market efficiency fairy to fix mispriced stocks. If a position languished, he built a controlling interest and actively manufactured the outcome.
In 1958, BPL quietly accumulated shares in the Sanborn Map Co. The business itself—printing utility maps—was structurally declining, but the company held a blue-chip investment portfolio worth $65 per share on its balance sheet. The stock, completely ignored by institutional investors, was trading at a heavily depressed price of $45 per share.
Buffett did not treat this as a long-term compounder. He treated it as an asset-backed opportunity with a massive margin of safety. He allocated roughly 23% of the partnership’s total capital into the position, won a seat on the board of directors, threatened a full-scale proxy war, and forced management to dismantle the corporate structure. He compelled Sanborn to swap its underlying security portfolio directly back to shareholders in exchange for their stock. He did not wait for the market to realize the value; he used raw corporate control to extract it.
┌────────────────────────────────────────────────────────────────────────┐
│                    THE ACTIVE CORPORATE CONTROLS LOOP                  │
├────────────────────────────────────────────────────────────────────────┤
│ Accumulate Controlling Stake ──► Force Inventory Liquidation ─────────┐ │
│                                                                       │ │
│                                                                       ▼ │
│ Realize Clean Asset Value    ◄── Convert Cash into Security Portfolio │ │
└────────────────────────────────────────────────────────────────────────┘
The exact same playbook applied to Dempster Mill Manufacturing Co. in 1956. Buffett accumulated a 70% controlling stake at an average cost of $18 per share against a book value of $72 per share. When operational inventories became severely bloated, tying up vital working capital, he brought in an aggressive turnaround specialist named Harry Bottle. Bottle slashed overhead, cleared out the slow-moving industrial inventory, and converted that dead corporate asset base into a liquid, undervalued securities portfolio.
The Berkshire era style represents a total abandonment of this activist operational design. Today, Berkshire behaves as an operationally passive owner of public equities and a decentralized custodian of wholly owned subsidiaries. Buffett explicitly avoids interfering with the daily operations of businesses like See’s Candies or Geico. While he remains intensely active in allocating capital across the subsidiaries—deciding where the profits are redistributed—the operational mechanism shifted from catalyst creation to patient selection. Berkshire relies entirely on the existing management teams of its subsidiaries to run the shop, requiring only that they remit the excess free cash flow up to the corporate parent level. The partnership was an aggressive corporate liquidator; Berkshire is a permanent psychological home for high-quality corporate management teams.
Style Difference Three — From Partner Capital to Permanent Corporate Capital
The built-in legal layout of an investment vehicle governs what its manager can actually execute. Investors often forget that the early Buffett Partnership was a standard, look-back incentive fee partnership with fixed rules and built-in redemption vulnerabilities.
The BPL framework was built on a strict incentive model: Buffett charged no management fee but took a 25% performance allocation above a 6% compounded annual hurdle rate. Crucially, the limited partners had the right to request annual capital redemptions. This meant that while Buffett had immense flexibility in choosing micro-cap positions, he was still tethered to the behavioral capacity of his investors. If a severe market drawdown coincided with a wave of partner panic, BPL would have been forced to liquidate illiquid activist stakes to provide cash redemptions.
This legal vulnerability is why Buffett chose to liquidate the entire partnership framework in 1969. He recognized that the combination of skyrocketing public market valuations and potential partner redemption pressures created an unacceptable risk profile.
┌────────────────────────────────────────────────────────────────────────┐
│                   THE BERKSHIRE TAX SHIELD MECHANISM                   │
├────────────────────────────────────────────────────────────────────────┤
│ Public Securities Dividends ──► Inter-Corporate Dividend Exclusion     │
│                                              │                         │
│                                              ▼                         │
│                                Retained at Parent Level                │
│                                (Deferred Capital Gains Drag)           │
└────────────────────────────────────────────────────────────────────────┘
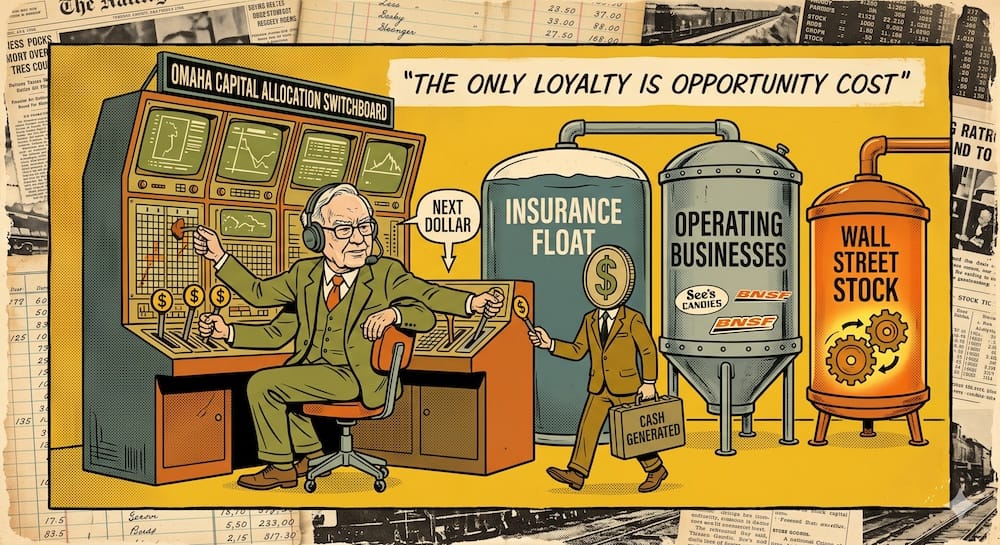
When he transitioned to Berkshire Hathaway, he swapped partner capital for permanent corporate capital, fundamentally changing his financial advantage. Berkshire is a corporate conglomerate. Its equity capital is raised through the public markets and retained indefinitely on the corporate balance sheet. There are no limited partners who can demand their cash back at the end of the fiscal year. If public market participants panic and dump Berkshire stock, it does not create the same forced-redemption pressure that a fund manager faces.
Furthermore, Berkshire added a vital asset: insurance float. By acquiring insurance operations like National Indemnity and Geico, Berkshire secured a massive pool of premiums collected in advance of claims. This float acts as an alternative capital sleeve that regular retail portfolios cannot replicate. Econometric research highlights that Berkshire regularly maintains a capital leverage ratio of approximately 1.6 to 1, funded primarily by this insurance float, with an underwriting cost of capital that has historically run below the prevailing U.S. Treasury Bill rate.
This corporate vehicle also enjoys massive tax advantages. Through the dividends received deduction, Berkshire’s domestic equity dividends are highly tax-advantaged at the corporate level, depending on ownership percentages and contemporaneous tax rules. Because Berkshire retains its internal earnings and pays zero dividends to its own shareholders, it operates with a deferred capital gains realization drag. Berkshire can often defer realization taxes on long-held positions and allocate retained operating cash without the same annual pass-through tax friction faced by many retail investors.

Style Difference Four — From Small Pond Alpha to Scale-Constrained Mega-Cap Deployment
The physical reality of capital scale dictates your available opportunity set. During the partnership years, Buffett operated with a specific advantage that he has spent the last forty years lamenting: a tiny capital footprint.
When managing sums under $10 million, the entire universe of micro-cap equities, odd-lot corporate tenders, and obscure regional reorganizations is more open to you. This is the “small pond” where structural inefficiencies are highest because institutional Wall Street analysts cannot justify spending research hours on companies with total market caps under $5 million. BPL could buy a commanding stake in a small manufacturer, alter its capital allocation, and capture pure alpha because they were agile enough to swim in those shallow waters.
Today, Berkshire Hathaway is trapped in a multi-billion-dollar cage. If Buffett wants to deploy $10 billion—a sum that represents only a fraction of his defensive cash cushion—he cannot look at small-caps or mid-caps. To move the needle on Berkshire’s total earnings per share, he is structurally restricted to the most liquid, highly scrutinized mega-cap stocks on earth.
He is forced to compete in a market segment where information democratization is absolute, algorithmic execution is instantaneous, and material mispricings are practically non-existent. This scale drag explains why Berkshire’s performance has steadily decelerated toward broad-market averages. Berkshire must operate as a macro-economic proxy for corporate America, while the early partnership was completely insulated from the broader macroeconomic environment.

Style Difference Five — From High-Turnover Special Situations to Low-Turnover Compounding
The holding-period architecture of the two eras reveals two entirely different operational philosophies. Retail folklore frequently repeats the phrase that Buffett’s “favorite holding period is forever.” This statement is completely inaccurate when applied to his highest-performing years.
Inside the partnership, Buffett was a disciplined, high-turnover manager within his Generals and Workouts sleeves. The moment a classic Graham net-net experienced a multiple re-rating and hit its calculated intrinsic asset value, BPL ruthlessly sold the position to recycle the capital into the next undervalued asset. The holding periods for these positions typically ran between 12 to 36 months.
The Workouts sleeve had an even higher turnover velocity, with positions entering and exiting the portfolio within months based on the closing timelines of specific corporate mergers or liquidations. Buffett was managing a fluid pipeline of capital, treating stocks as abstract financial tickets that were bought at a discount and discarded at par.
At Berkshire, the transaction costs, market impact, and tax realization liabilities of a high-turnover strategy would create an immense drag on capital. If Berkshire tried to cycle tens of billions of dollars through short-term positions, the sheer volume of their trades would drive prices up during accumulation and crush them during liquidation, while triggering massive corporate tax events.
The modern Berkshire style is therefore locked into an ultra-low-turnover compounding model. Berkshire must identify businesses whose internal returns on capital are so high, and whose competitive moats are so durable, that the parent entity never has to sell the position to realize value. The return is generated by the internal economics of the business itself, allowing Berkshire to avoid transaction frictions and defer capital gains liabilities indefinitely. The partnership traded price discrepancies; Berkshire owns economic engines.

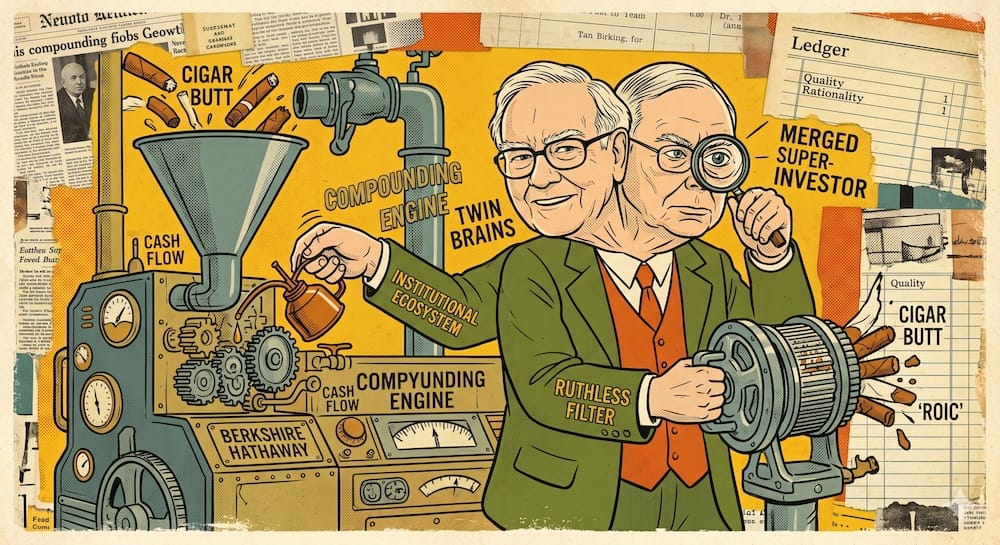
The ultimate style evolution, forced by structural reality. Graham's pure asset math works when you are small, but it breaks hard against the scale wall. Munger's real alpha was pulling Buffett away from the terminal cigar butts and pointing him toward high-ROE economic engines.Style Difference Six — From Graham’s Asset Math to Munger’s Quality Filter
The intellectual evolution of Buffett’s style was not an isolated development. It was heavily driven by the vehicle-level friction of scale and the intervention of his partner, Charlie Munger.
The early partnership style was built entirely on the strict quantitative training Buffett received under Benjamin Graham at Graham-Newman Corp. Graham’s philosophy was deeply cynical about the long-term survival of corporate competitive advantages. Consequently, Graham’s math focused strictly on tangible, historical assets: physical inventory, real estate, and current receivables.
This asset-heavy approach worked perfectly for small sums, but it had a clear limitation: it required buying cheap, bad businesses that were continually shrinking.
┌────────────────────────────────────────────────────────────────────────┐
│                      THE GRAHAM TO MUNGER SHIFT                        │
├────────────────────────────────────────────────────────────────────────┤
│ Graham / BPL Style:                                                    │
│ Buy Cheap, Low-Quality "Cigar Butts" ──► Scale Wall / High Friction    │
│                                                                        │
│ Munger / Berkshire Style:                                              │
│ Focus on Premium ROE / Moats ──────────► Reinvest Float at Scale       │
└────────────────────────────────────────────────────────────────────────┘
Charlie Munger’s critical contribution was forcing Buffett to abandon the pure asset-math model in favor of qualitative moats. The turning point was the acquisition of See’s Candies in 1972. See’s possessed only $8 million in net tangible assets but generated $4 million in annual pre-tax earnings—an extraordinary 50% return on equity driven entirely by consumer brand loyalty and pricing power.
Munger convinced Buffett to pay a premium for this un-measurable intangible asset. The financial mechanics of See’s proved to Buffett that a high-quality business could generate massive waves of free cash flow that could be sent up to the parent company to fund further acquisitions.
Without the Munger quality filter, Berkshire Hathaway would have broken under its own weight; you cannot build a multi-billion-dollar enterprise by continually trying to purchase and manage thousands of distressed, asset-heavy manufacturing operations.
Partnership Buffett vs. Berkshire Buffett Style Matrix
To understand how completely these two regimes diverged, we have to look at them side by side across every core dimension.
| Dimension | Partnership Era Style (1957–1969) | Berkshire Corporate Era Style (1970–Present) | The Core Catalyst for Change |
| Primary Security Type | Micro-caps, un-indexed nano-caps, corporate debt arbitrage. | Highly liquid mega-caps, wholly owned operating subsidiaries. | The Scale Wall: Billions cannot be physically deployed into illiquid micro-caps. |
| Core Return Driver | Asset-to-price gaps, liquidation value, multiple expansion to par. | Internal compounding of earnings, durable pricing power, high ROE. | Opportunity Set Shift: Small ponds dry up as assets grow; you must shift to quality cash flows. |
| Typical Holding Period | Short-to-medium term (1–3 years for Generals; months for Workouts). | Long-term, permanent horizons (“decades to forever”). | Frictional Drag: High turnover at scale destroys returns via market impact and taxes. |
| Capital Source | Private limited partners with traditional look-back incentive structures. | Retained corporate earnings and internal insurance underwriting cash pools. | Vehicle Architecture: Replacing flighty limited partners with permanent corporate capital. |
| Liquidity Constraints | Vulnerable to annual partner redemptions; required liquid positions or rapid turnarounds. | Permanent corporate capital; insulated from shareholder redemption pressure. | Behavioral Defense: Eliminating redemption risk allowed underwriting through severe crises. |
| Tax Structure | Pass-through partnership structure with annual realization exposure. | Corporate conglomerate utilizing deferred capital gains realization drag. | Tax Deferral Advantage: Shielding massive dividend and capital flows from continuous friction. |
| Catalyst Source | Active corporate controls, board battles, proxy fights, forced liquidations. | Completely passive public stock selection and operational non-interference. | Operational Limits: You cannot run hostile proxy wars on twenty multi-billion-dollar firms simultaneously. |
| Risk Profile | Highly concentrated asset picks, corporate turnarounds, and built-in margin risk. | Systemic macroeconomic exposure, large scale-drag, capital allocation execution risk. | Systemic Realignment: Shifting from idiosyncratic business risk to macro-market tracking. |
From Graham to Munger Transition Map
The corporate shift from asset-heavy deep value to asset-light quality compounders was a physical requirement forced by asset expansion.
| Element | Graham / Partnership Style | Munger / Berkshire Style | Why Scale Forced the Shift |
| Definition of Cheapness | Low Price-to-Book, low P/E, stock trading below Net Current Asset Value (NCAV). | High Return on Capital (ROIC) trading at a reasonable multiple of free cash flow. | At scale, buying a low-multiple business with poor internal economics forces you to continuously reinvest cash just to stay afloat. |
| Corporate Quality | Irrelevant; frequently troubled, declining, or low-margin legacy businesses. | Critical; requires an enduring competitive advantage and pricing power. | A large pool of capital must rely on the business doing the heavy lifting internally over a multi-decade window. |
| Role of Management | Distrusted; viewed as capital allocators who needed to be actively monitored or removed. | Highly trusted; treated as autonomous operational partners who require zero intervention. | A single corporate parent office cannot manage the daily operations of dozens of massive global corporations. |
| Time Horizon | Short-term arbitrage: hold until the market corrects the specific asset mispricing, then sell. | Generational compounder: hold indefinitely to avoid triggering transaction costs. | Selling a multi-billion-dollar position creates massive downward price pressure and an immediate tax liability. |
| Capital Intensity | High; asset-heavy operations (factories, heavy equipment, physical inventory backlogs). | Low; asset-light operations driven by brand value, software, or structural scale. | Asset-heavy businesses consume their own free cash flow simply to maintain operations during inflationary cycles. |
| Reinvestment Dynamic | Cash is entirely stripped out of the business via dividends or asset liquidations. | Cash is either reinvested internally at high rates or sent to the parent for allocation. | When managing small sums, you want the cash back immediately to hunt for the next 50% net-net asset play. |
| Tax Efficiency | Low; high asset turnover triggers continuous annual short-term tax events. | High; unrealized corporate capital gains allow the entire asset base to compound. | Deferring taxes across a multi-decade horizon creates an un-billed loan from the government that compounds for free. |
The Drawdown Reality: Neither Style Was Easy to Hold
Modern portfolio architects frequently look at Buffett’s long-term historical charts and mistake compounding for a serene, linear ride. They assume that moving from the high-velocity partnership style to the permanent corporate style created an easier, lower-volatility portfolio.
The historical drawdowns prove otherwise. Neither strategy was emotionally easy to hold, and both required a level of tracking error tolerance that would cause the average modern DIY investor to fracture and liquidate their portfolio.
During the 1957–1969 partnership era, while Buffett never posted a negative calendar year on a gross basis, his strategy required massive asset concentration. In the 1958 benchmark cycle, BPL actually lagged behind the Dow Jones Industrial Average total return by approximately -6.3% due to its heavy, illiquid positions in active corporate control setups. To achieve that 29.5% gross CAGR, partners had to accept the reality that a massive percentage of their capital was locked up in declining windmill foundries and asset-stripped map companies that could not be sold during a market downturn.
┌────────────────────────────────────────────────────────────────────────┐
│                    HISTORICAL BERKSHIRE DRAWDOWN PEAKS                 │
├────────────────────────────────────────────────────────────────────────┤
│ 1973–1974 Bear Market ──────────────────────────────────────► -59%     │
│ 1998–2000 Dot-Com Bubble ───────────────────────────────────► -51%     │
│ 2008 Financial Crisis ──────────────────────────────────────► -32%     │
└────────────────────────────────────────────────────────────────────────┘
The Berkshire corporate style introduced even more extreme public market volatility. During the 1973–1974 bear market, Berkshire Hathaway’s public stock price plummeted by -59% from peak to trough. Think about that behavioral reality: more than half of the vehicle’s market value was wiped out by public multiple compression, even as the underlying operating businesses were expanding their book value.
An even more brutal psychological test arrived during the 1998–2000 Dot-Com Bubble. As speculative technology stocks moved vertically, Berkshire’s value-heavy portfolio suffered a grinding -51% market contraction. During this stretch, the financial media often treated Buffett’s value-heavy approach as obsolete.
The lesson here is stark: whether you are executing the asset-arbitrage partnership style or the permanent-capital corporate style, outperformance requires accepting extreme deviation from the crowd. If your portfolio architecture cannot tolerate multi-year windows of absolute underperformance and massive peak-to-trough drawdowns, the underlying mathematical viability of the strategy becomes irrelevant because you will inevitably liquidate right when your future self would like to grab your current self by the shoulders at the point of maximum panic.
Retail Copying Error Matrix
I understand the psychological appeal of cloning Berkshire’s modern 13F filings. It feels like borrowing the homework from the smartest kid in class. The problem is that Buffett is taking the test with a completely different calculator, an institutional tax shield, and a permanent capital balance sheet the size of a small planet.
| What Retail Investors Copy | What They Miss Under the Hood | Why the Strategy Breaks at Retail Scale |
| Cloning 13F Mega-Cap Buys (e.g., Apple, Occidental, Coca-Cola) | They miss the underlying structural scale drag. Buffett is buying these names because he is trapped by size, not because they offer partnership-era alpha. | The retail investor voluntarily imports institutional scale-drag into a small portfolio, giving up their single greatest native asset: agility. |
| Buying Micro-Cap “Cigar Butts” | They miss the requirement for active corporate control or structural liquidation catalysts. | Without a legal team or a board seat to force an asset swap, the retail investor ends up holding a dying, un-indexed value trap forever. |
| Using Traditional Broker Margin | They miss the non-callable, structural architecture of insurance float liabilities. | Retail margin lines are subject to variable interest rate spikes and sudden margin liquidation calls at the absolute market bottom. |
| Concentrating in “Moats” Equities | They miss the parent-level corporate tax insulation and the Inter-Corporate Dividend Exclusion advantages. | Every dividend payout and portfolio rebalancing event triggers an immediate tax drag that continuously degrades retail compounding. |
| Ignoring Cash Reserves | They miss the permanent capital engine that allows Berkshire to act as a custom lender of last resort during liquidity freezes. | When a market crisis hits, the cash-poor retail investor cannot negotiate off-market preferred equity terms or extract free operational warrants. |
What Modern Investors Should Actually Absorb
For educational purposes, the relevant lesson to extract from the dual regimes of Warren Buffett is not that you should attempt to manually clone the 1960s partnership playbook or blindly ride the coattails of modern Berkshire 13F filings. Both approaches represent a fundamental failure to align portfolio strategy with your actual capital reality.
Instead, the real takeaway is the absolute necessity of matching your investment strategy to your specific scale, vehicle structure, tax architecture, and behavioral capacity.
If you are operating with small-scale capital, your primary asset is agility. You have the structural capacity to hunt in un-indexed, less efficient market corners where mega-cap allocators cannot deploy a single dollar. However, if you choose to operate in those segments, the more realistic translation is systematic quantitative value exposure or carefully studied structural market anomalies where public market liquidations are pre-engineered.
Conversely, if you choose to own large-cap, high-quality businesses, you must recognize that you are playing in a highly efficient market pond. You cannot expect early partnership-era outperformance from mega-cap holdings. To make that strategy work over a multi-decade horizon, the path involves studying how tax-advantaged accounts and low-turnover structures can reduce friction—minimizing dividend realization drag, avoiding the behavioral trap of variable retail leverage, and preparing your psychology to tolerate massive, multi-year tracking-error dead zones without fracturing.
Don’t copy the legend’s portfolio picks. Copy the flawless strategic alignment between their capital size and their execution machine.
What is the core difference between the Warren Buffett partnership vs Berkshire investing style?
It comes down to capital scale and asset drivers. During the partnership era (1957–1969), Buffett managed a small pool of capital and focused on quantitative cheapness, purchasing micro-cap “cigar butts” trading below liquidation value and aggressively manufacturing his own corporate catalysts through activist board control. In the Berkshire era (1970–Present), severe scale constraints forced him to abandon illiquid micro-caps and transition into a passive owner of premium, high-ROE mega-caps with durable competitive moats, powered by permanent corporate cash flows.
What’s the minimum portfolio size needed to replicate the early Buffett partnership style today?
Surprisingly small. In fact, a smaller portfolio is your primary structural weapon. Because the early style relies on finding micro-cap or nano-cap mispricings—such as classic net-nets or obscure corporate re-ratings—it can only be effectively executed with a capital base under a few million dollars. Once a portfolio expands beyond that scale, it hits the exact same wall Buffett did: you cannot deploy meaningful amounts of cash into tiny, illiquid stocks without violently re-pricing the market against yourself.
Can a retail investor use standard brokerage margin to clone Berkshire’s insurance float leverage?
No. Absolutely not. Berkshire’s leverage ratio of roughly 1.6 to 1 is funded by insurance float, which represents upfront premium payments collected before claims are settled. This is an institutional capital sleeve that is entirely non-callable and historically carries an underwriting cost below the U.S. Treasury Bill rate. Standard retail margin is completely different; it is a variable-rate loan subject to sudden interest rate spikes and catastrophic forced liquidation calls during a market drop.
How does Berkshire Hathaway handle taxes differently than a standard retail taxable account?
Berkshire operates inside a massive corporate tax shield. By utilizing a conglomerate corporate vehicle rather than a standard pass-through fund, Berkshire can leverage the dividends received deduction to absorb cash from domestic equity holdings with minimal corporate tax friction. Furthermore, because Berkshire never pays a dividend to its own shareholders and holds core equity stakes for decades, it maintains a deferred capital gains realization drag that lets its entire capital footprint compound without annual tax intervention.
What modern ETF strategies closest replicate the quantitative factor profiles of early BPL?
Look toward systematic micro-cap value. While you cannot replicate Buffett’s early physical board interventions, you can capture the underlying factor exposures by researching specialized, low-turnover micro-cap value ETFs [VERIFY] or systematic deep-value factor funds that screen specifically for low enterprise value to EBIT (EV/EBIT) ratios or high cash flow yields within un-indexed equity segments.
Why did Charlie Munger force the transition away from the partnership’s asset-math style?
Because the “cigar butt” strategy had an expiration date. Under Benjamin Graham’s strict training, Buffett focused strictly on tangible liquidation assets. Charlie Munger recognized that as Berkshire’s capital scaled, trying to purchase thousands of distressed, asset-heavy businesses would break the enterprise. Munger proved through the 1972 acquisition of See’s Candies that paying a premium for an asset-light, high-ROE business with sustainable pricing power generated superior cash flows that could scale indefinitely.
How did tracking error impact investors in both the partnership and Berkshire eras?
It was brutal in both. Followers often falsely imagine Buffett’s compounding path as a smooth, tranquil ride. In reality, the partnership style suffered relative underperformance, such as lagging the Dow total return by roughly -6.3% in 1958 due to illiquid activist blockages. The Berkshire era was even more volatile, handing shareholders a staggering -59% price drop during the 1973–1974 bear market and a -51% crash during the 1998–2000 tech bubble when the financial media openly mocked his value-heavy style as obsolete.
This article is also available in Spanish. [Leé la versión en castellano: El estilo de inversión de Warren Buffett de la Sociedad vs su estilo de la era Berkshire]