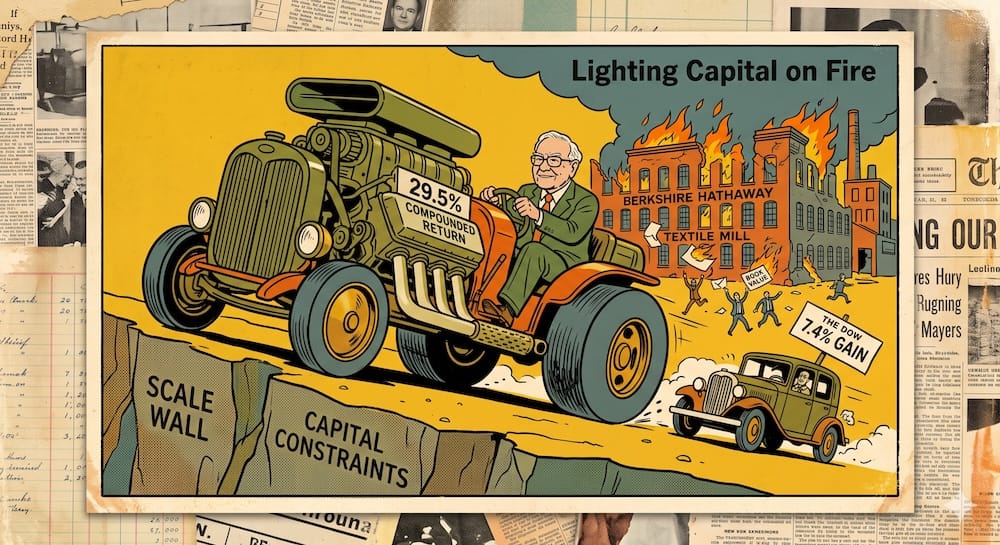
The world’s greatest compounding engine began with a value trap, a tender dispute, and one very expensive emotional decision.
In 1964, Warren Buffett was running a highly successful investment partnership when he found himself holding a significant position in Berkshire Hathaway, a struggling New England textile manufacturer. The company’s executive, Seabury Stanton, offered a verbal agreement to buy back Buffett’s shares at a specific price. However, when the written tender offer arrived, the written offer came in below the verbal price Buffett believed had been agreed.
Most allocators would have calculated the fractional difference, taken the loss, and deployed the capital into a higher-yielding asset class. Buffett got angry. He refused to sell, aggressively bought control of the company, fired the executive, and spent the next two decades trying to turn around a dying domestic commodity business.
Buffett has since called buying the original Berkshire textile business his “$200 billion mistake,” noting that if he had simply bypassed the textile mills and directed that initial capital straight into insurance assets, Berkshire’s compounding trajectory would have been vastly magnified. The lesson for the portfolio builder is stark: even the most disciplined minds can let behavioral bias pin them to a value trap.
Yet, Berkshire did not evolve in a straight line. It mutated—first accidentally, then painfully, then brilliantly. The textile mill was not the empire; it was the bad soil the empire somehow managed to grow out of. What began as a poor operating business accidentally provided an invaluable asset: a permanent corporate capital shell that allowed Buffett to exit the standard fund-manager model and experiment with systematic capital allocation.
From 1965 to 2023, Berkshire Hathaway’s reported market-value compound annual gain was 19.8%, compared to 10.2% for the S&P 500 with dividends. This multi-decade outperformance did not materialize from a static, pre-planned strategy. The enterprise adapted through an evolutionary sequence of regime shifts, capital source mutations, and scale bottlenecks.

The Berkshire Evolution Timeline
The table below traces how the vehicle adapted its structure as its scale, capital sources, and opportunity sets mutated across six decades.
| Era | Berkshire’s Corporate Form | Dominant Capital Source | Primary Capital Outlet | What Buffett Learned |
| 1962–1965 | Dying Textile Manufacturer | Textile working capital and liquidation value | Textile operations and attempted reinvestment | Cheapness without structural quality is a capital destruction trap. |
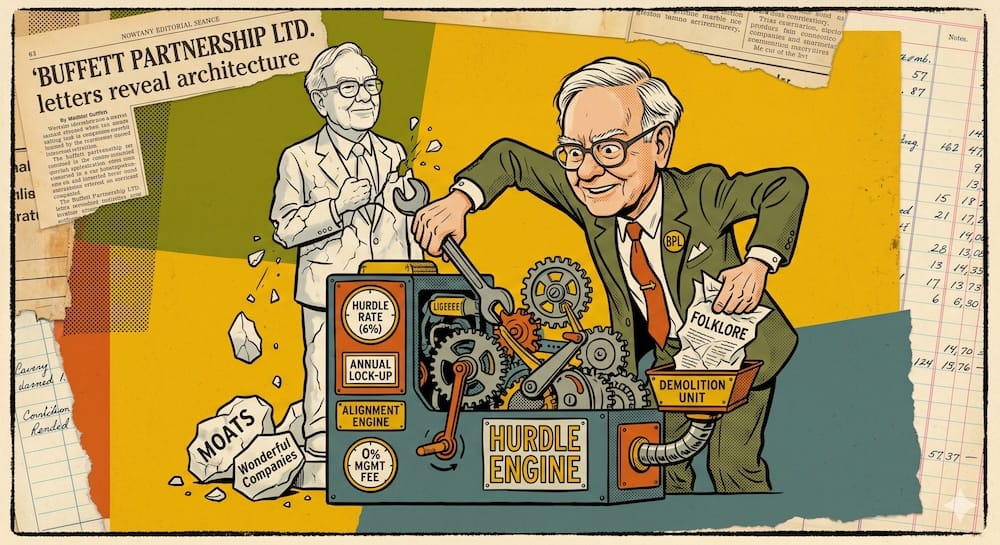
| 1965–1969 | Transitional Shell & Active Partnership | BPL-controlled capital and early corporate resources | Cheap Public Equities & Control Blocks | A permanent corporate structure insulates an allocator from client redemptions. |
| 1967–1970s | Nascent Insurance Platform | Institutional Insurance Float | Concentrated Undervalued Equities | Sourcing non-callable, liability-backed liabilities creates a durable source of investment fuel. |
| 1972–1980s | High-Return Cash Generator | Wholly-Owned Subsidiary Earnings (See’s) | Capital-Light Franchises & Brand Monopolies | High Return on Capital ($ROIC$) assets create cash that can be redeployed outside the business. |
| 1988–1990s | Elite Float-and-Brand Compounder | Scaled Insurance Float (GEICO Acquisition) | Mega-Cap Brand Equities (Coca-Cola) | True scale requires pairing massive structural float with consumer monopolies. |
| 2000s–2010s | Industrial Infrastructure Conglomerate | Conglomerate Retained Cash & Float | Wholly-Owned Regulated Utilities & Railroads (BNSF) | Massive capital bases must pivot to capital-intensive, regulated monopolies to absorb cash. |
| 2016–Present | Mature Scale-Constrained Giant | Scaled Operating Cash Flow & Massive Cash Sleeve | Mega-Cap Tech (Apple), cash reserves, and buybacks | Size is the ultimate anchor to relative outperformance; cash becomes a strategic liquidity tool. |

Phase One — The Textile Years: Why Cheap Was Not Enough
This is the part of the story that should make every value investor deeply uncomfortable: sometimes the cheap stock is not the beginning of a fortune. Sometimes it is just a very expensive lesson wearing a bargain-bin price tag.
From 1965 to 1985, Buffett operated Berkshire primarily as a textile company that happened to own an investment portfolio. This phase was defined by a brutal macro reality. The New England textile industry was facing intense, low-cost foreign competition, declining domestic margins, and severe commodity pricing pressure.
Every year, the capital allocation choice looked identical: pour cash into new, highly efficient textile looms just to maintain the same uncompetitive market position, or harvest the cash and deploy it elsewhere. Buffett tried to optimize the mills for years, buying competitors and upgrading machinery, but the underlying business quality remained structurally broken. The returns on incremental capital reinvested in the textile business consistently hovered near zero.
This painful era forged Buffett’s core philosophy on business quality. He realized that a cheap valuation cannot salvage bad underlying economics. If a business requires continuous capital expenditure just to survive, without the ability to generate a high return on that invested capital, it is a treadmill, not an asset.
Buffett finally shut down the textile operations entirely in 1985. The real value of Berkshire had already shifted elsewhere: the corporate shell had been used to acquire a financial engine that completely redefined the company’s capital structure.

Phase Two — National Indemnity and the Float Pivot
In 1967, while still wrestling with the textile mills, Buffett made a pivotal turn that transformed Berkshire from a bad operating business into an elite capital vehicle. He purchased National Indemnity for $8.6 million, marking Berkshire’s entry into the property and casualty insurance sector.
This move was not about the intrinsic beauty of underwriting risks. It was about the structural nature of insurance cash flows. Premiums collected upfront created a liability-backed float pool that was not subject to broker margin calls. Berkshire achieved control of an industrial-scale premium collection apparatus where customers paid their premiums upfront, and claims were settled years—sometimes decades—later. This left the insurer holding a massive pool of cash that could be fully deployed in concentrated equities before delayed claims were paid out.
This structural turn altered Berkshire’s cost of capital. Academic work estimates Berkshire’s average leverage ratio at roughly 1.6x to 1.7x, depending on the historical reconstruction window. However, this leverage was fundamentally different from the short-term margin lines or floating-rate debt used by traditional fund managers. It was less callable, liability-backed capital, assuming disciplined underwriting and adequate reserves.
Because Berkshire collected premiums upfront, its cost of float was exceptionally low—estimated around 2.2% over multi-decade periods, below Treasury-bill rates over long stretches. The insurance platform effectively acted as a structural mechanism that changed the math of portfolio construction.
When market drawdowns hit, Berkshire did not face forced broker liquidations or client redemptions. The permanent corporate capital shell, backed by a steady stream of incoming insurance float, meant that market volatility became an opportunity to deploy capital rather than a risk to survival.
Phase Three — See’s Candies and the Munger Quality Mutation
If Benjamin Graham taught Buffett how to buy cheap assets, Charlie Munger taught him how to survive success. That intellectual mutation became concrete in 1972 with Berkshire’s acquisition of See’s Candies for $25 million.
See’s was the exact opposite of a New England textile mill. It was a regional brand monopoly with intense consumer loyalty, allowing it to regularly raise prices without losing customers. More importantly, it had very low capital intensity. See’s did not require massive, expensive factories or continuous capital reinvestment to grow. It generated high returns on equity and produced large, predictable streams of pure cash flow.
| Attribute | Textile Berkshire (Phase 1) | See’s Candies Mutation (Phase 3) |
| Pricing Power | None (Commodity) | High (Brand Monopoly) |
| Capital Intensity | High (Continuous reinvestment needed) | Low (Generates surplus cash) |
| Return Profile | Near-Zero Return on Capital | High Return on Equity |
| Allocation Role | Capital Sink (Consumes cash) | Capital Source (Provides cash) |
See’s Candies became a foundational case study for Berkshire’s third phase: evolving from asset liquidation to cash-flow redeployment. See’s could not efficiently reinvest its own profits within its small regional footprint, so it sent those cash flows up to Omaha.
Buffett took that unencumbered cash and used it to fund large equity positions and buy other businesses. See’s eventually generated over $2 billion in cumulative pre-tax cash flow for reallocation. Berkshire had officially mutated into a multi-stage mechanism that extracted cash from capital-light operating subsidiaries and routed it into high-conviction market investments.

Phase Four — Coca-Cola, GEICO, and the Consumer-Quality Era
By the close of the 1980s, Berkshire was facing its first true scale bottleneck. It could no longer move its compounding needle by writing small checks for regional private businesses. The vehicle was forced to mutate again, pairing its rapidly growing insurance float with global consumer monopolies that could handle massive capital deployment. This was the era where GEICO’s underwriting engine was fully integrated to provide industrial-scale investment fuel, which was then immediately funneled into international brand networks like Coca-Cola between 1988 and 1989 (a $1.02 billion investment).
Coke represented the ultimate expression of the See’s Candies lesson deployed at global scale. It possessed an unassailable international brand moat, high capital returns, and a growing dividend yield. Meanwhile, fully integrating GEICO in 1996 for $2.3 billion supercharged Berkshire’s premium collection apparatus, scaling the insurance float pool from $39 million in 1970 to tens of billions by the late 1990s.
During this era, Berkshire also maximized a significant tax-deferral advantage. By holding mega-cap equity positions for decades without triggering a realization event, the unrealized gains could remain deployed before tax realization. This balance acts economically like an interest-free financing source until realization. Instead of slicing away capital to pay taxes on frequent trades, the capital remained fully deployed, compounding inside a permanent corporate shell.
Phase Five — BNSF, Utilities, and the Empire-Scale Phase
Every successful compounding engine eventually encounters its ultimate enemy: its own size. By the 2000s, Berkshire’s cash generation was so immense that buying 7% of a consumer product company could no longer move the needle on its total book value growth. The vehicle was forced to undergo another structural mutation.
To deploy tens of billions of dollars effectively, Berkshire shifted its target profile from capital-light brand monopolies to capital-intensive, regulated infrastructure monopolies. This phase peaked with the total acquisition of Burlington Northern Santa Fe (BNSF) Railway in 2010 for a total enterprise valuation that absorbed tens of billions of dollars, alongside the aggressive expansion of Berkshire Hathaway Energy (BHE).
Railroads and energy utilities are the antithesis of the early Buffett style. They require billions of dollars in continuous capital expenditure to maintain tracks, trains, and power grids. However, they offer two distinct structural advantages for an empire-scale allocator:
- Massive Capital Absorption: They provide a virtually limitless outlet to deploy billions of dollars of surplus cash at reasonable, regulated rates of return.
- Economic Moats: You cannot easily build a competing transcontinental railroad or a rival regional electricity grid.
Berkshire had successfully evolved from a nimble value hunter into a massive macro utility provider, optimizing its structure to absorb cash flows that would choke a standard investment fund.

Phase Six — Apple, Cash, and the Modern Scale Constraint
Today, Berkshire Hathaway operates as a mature empire, entirely distinct from the early compounding vehicle of the 20th century. Its modern footprint is defined by extreme scale constraints, a massive structural cash sleeve that in recent years has frequently exceeded $150 billion, and highly concentrated bets on mega-cap technology firms that double as consumer monopolies—most notably, Apple.
When Berkshire began acquiring Apple in 2016, it marked a final departure from classic value dogma. Apple was a technology hardware giant, a sector Buffett had explicitly avoided for decades. But through the modern lens, Apple functioned exactly like See’s Candies at a global scale: it possessed an intense ecosystem lock-in, immense pricing power, and an aggressive share buyback program that systematically increased Berkshire’s fractional ownership without requiring additional capital layout.
At this mature stage, Berkshire’s cash hoard is no longer just dry powder for stock picking; it is a macro liquidity tool. The company can act as a selective liquidity provider during crises to extract high-yielding preferred financing terms attached with warrants—terms unavailable to ordinary public-market buyers. Relative outperformance has inevitably slowed due to the law of large numbers, but the capital architecture remains an extraordinarily stable corporate fortress.
From Textile Mill to Empire: The Structural Shift
The matrix below maps the total transformation of Berkshire’s core financial and operational variables across its lifecycle.
| Dimension | Phase One: Textile Berkshire (1962–1985) | Modern Berkshire Empire (Present) | Why the Evolution Matters |
| Business Quality | Commodity textile manufacturer with zero pricing power. | Diversified conglomerate owning regulated monopolies and premier global brands. | Structural asset quality determines the baseline stability of the compounding vehicle. |
| Capital Intensity | High reinvestment required just to maintain static, uncompetitive operations. | High in infrastructure and utilities, but supported by large, recurring operating cash flows across the group. | Evolution shifted the corporate vehicle from a cash consumer into a massive cash generator. |
| Reinvestment Runway | Extremely narrow; capital poured into mills faced a near-zero return profile. | Wide in terms of absolute dollar capacity, but restricted to lower-beta, asset-heavy macro utilities. | Scale forces vehicles to trade pure high-alpha return optimization for sheer capacity optimization. |
| Sourcing of Fuel | Fragile operating margins and finite partnership capital contributions. | Scaled, multi-line insurance float exceeding $160 billion alongside permanent subsidiary cash flows. | Sourcing non-callable, structural liabilities removes the risk of forced portfolio liquidations. |
| Tax Architecture | Limited tax-deferral advantage relative to later massive unrealized gains. | Large deferred tax liabilities from long-held appreciated assets. | Minimizing transactional turnover maximizes the long-term compounding efficiency of capital. |
| Deal Access | Restricted to public market equity transactions and standard open-market negotiation. | Bespoke private preferred equity and warrant placement terms during systemic crises. | Large-scale permanent capital structures can demand custom, high-yielding terms during panics. |
Which Berkshire Era Are You Actually Copying?
Many DIY investors attempt to build their portfolios by mimicking parts of the Buffett strategy. However, trying to copy his actions without matching his structural phase and liabilities leads to significant misalignments.
| Investor Copying Behavior | Which Berkshire Era It Resembles | Missing Structural Element | Portfolio Translation & Verdict |
| Buying cheap, low-quality companies based on low valuations alone. | 1962–1965: The Textile Value Trap | Lacks the permanent cash inflows and alternative allocation vehicles to cushion asset decay. | Expel: Buying value traps without an alternative corporate shell to absorb the cash flow simply locks up capital in a declining asset. |
| Holding a highly concentrated, 5-stock portfolio of individual equities. | 1972–1980s: The See’s / High-Conviction Quality Era | Lacks an insulated, non-callable liability base (like insurance float) to survive tracking error. | Expel with Caution: Institutional concentration does not translate cleanly when the investor’s individual liabilities are fragile or vulnerable to real-world cash needs. |
| Using short-term margin loans or options to boost equity returns. | 1967 Onward: The Insurance Float Pivot | Lacks long-duration, low-cost, non-callable liabilities that are completely immune to broker margin calls. | Expel: Standard retail margin is exposed to sudden liquidation during market shocks; Berkshire’s float is backed by long-dated insurance liabilities. |
| Hoarding huge cash balances waiting for a massive market crash. | 2016–Present: The Scale-Constrained Giant | Lacks a multi-billion dollar operating cash flow engine that requires safe deployment capacity. | Reframe: A smaller asset base may have a broader opportunity set than Berkshire’s current scale allows, but that does not make concentrated small-cap stock picking automatically portable. |
| Buying broad-market, low-turnover index funds and holding them for decades. | 1988–1990s: The Tax-Deferral & Quality Era | Lacks a corporate shell, but achieves an identical economic outcome through modern fund structures. | Absorb: Utilizing low-turnover index ETFs inside tax-advantaged accounts achieves a partial tax-efficiency analogue, creating a tax-deferral effect that can improve compounding efficiency. |
What the Evolution Means for Portfolio Construction
The central lesson of Berkshire Hathaway’s chronological evolution is that the nature of an investment vehicle is ultimately dictated by its structural constraints. Buffett did not simply discover a magical, timeless formula for stock-picking and apply it uniformly across his life. Early Buffett was small-cap, asset-value, and catalyst-driven. Middle Berkshire was quality and float-driven. Later Berkshire became scale-absorbing, infrastructure-heavy, and cash-rich. Modern investors misread Buffett when they copy one phase without understanding the structure that made that phase work.
The system adjusted its allocation style to match changing scale realities, moving from asset liquidations to brand cash flows, and finally to asset-heavy regulated infrastructure utilities. For individual portfolio builders, the takeaway is not to engage in historical admiration or build an imitation of Berkshire Hathaway within a standard retail brokerage account. The takeaway is to align your strategy with your actual capital scale and liability duration.
Study your own structural tax advantages through low-turnover, tax-efficient tools. Match concentration risk to the durability of your capital and real-world liquidity needs. If your personal liabilities are short-term or exposed to real-world liquidity shocks, running a hyper-concentrated single-stock portfolio copies the asset choices of Berkshire’s middle phases while lacking the insulated balance sheet plumbing that made them holdable. Corporate structures mutate because they must—and your portfolio should respect the math of its own scale.
What was the original business model of Berkshire Hathaway before Warren Buffett took control?
It was a commodity textile manufacturer. During the early 1960s, Berkshire Hathaway operated struggling New England mills facing severe margin compression and low-cost foreign competition. It was a classic “cigar-butt” asset liquidation play, not a high-quality compounding business model.
Why does Warren Buffett consider buying Berkshire Hathaway his biggest mistake?
Because it anchored massive capital to a dying industry. Buffett notes that if he had bypassed the capital-intensive textile mills entirely and directed his partnership’s initial funding straight into insurance acquisitions, the compound returns on that capital would have been worth hundreds of billions more over his lifecycle.
What is insurance float, and how did it change Berkshire’s capital structure?
Float is the pool of insurance premiums collected upfront before any customer claims are paid out. By acquiring National Indemnity in 1967, Berkshire gained access to a durable, non-callable pool of investable cash that academic work estimates carried a historical cost of capital well below prevailing US Treasury Bill rates.
Can a retail investor replicate Berkshire’s historical 1.6x to 1.7x leverage?
No, not safely. Traditional retail leverage requires utilizing a broker margin account or volatile option overlays, both of which are exposed to short-term margin calls and forced liquidation. Berkshire’s leverage is an academic reconstruction of its liability-backed insurance float, which cannot be called away during market drawdowns.
How does a deferred tax liability act as an interest-free loan for Berkshire?
It delays realization. When Berkshire holds highly appreciated stocks like Coca-Cola for decades without selling, it records the unrealized gains as a deferred tax liability. This capital remains fully deployed within the corporate shell, compounding gross of transaction taxes until a formal sale occurs.
Why did Berkshire Hathaway evolve from buying consumer brands to buying railroads and utilities?
It was a forced consequence of scale. As the company’s capital base grew into hundreds of billions of dollars, capital-light brand monopolies like See’s Candies could no longer absorb the massive cash flows generated by the group. Berkshire shifted to asset-heavy regulated infrastructure monopolies like BNSF to deploy massive chunks of capital at acceptable rates of return.
What is the biggest mistake modern retail investors make when trying to copy Warren Buffett?
Copying his concentration without matching his structural liabilities. Retail investors look at Buffett’s concentrated stock portfolio but lack the permanent capital shell and low-cost float required to survive the tracking error and 50% market drawdowns that Berkshire weathered across its lifecycle.
This article is also available in Spanish. [Leé la versión en castellano: La evolución de Berkshire Hathaway bajo Warren Buffett: de fábrica textil a imperio]