An investing confession is worth making at the outset: Warren Buffett changed less at the level of temperament over the last seventy years than most people think. What changed was the machine around him.
The financial media treats Berkshire Hathaway like an overgrown mutual fund with a folksy grandfather at the helm. We are fed an endless loop of stories about a quiet office in Omaha, a desk stacked with annual reports, and a compounding curve built purely on patience and individual stock picking. It’s an intoxicating narrative because it implies that if you, the retail investor sitting at your laptop, just have enough discipline, you can replicate those exact returns by copying his stock choices.
But if you look inside the engine room, you quickly realize Berkshire was never just a portfolio with some businesses attached. It was a capital-routing system wearing a conglomerate costume.
The magic was never that Buffett found a perfect stock. The magic was that every dollar entering the ecosystem eventually had to pass through Omaha’s capital-allocation toll booth. To understand Berkshire as a structural mechanism, we have to look past the individual public equity picks and map the entire network: a permanent corporate wrapper where insurance float, subsidiary cash flows, retained earnings, deferred taxes, reputation, and decentralized operating businesses all fed a central capital switchboard.

The Failed Textile Mill That Became a Capital Allocation Shell
To understand how the machine was engineered, you have to realize its foundational core was a complete corporate failure. In 1962, Buffett didn’t acquire shares of Berkshire Hathaway because he saw a wide economic moat. He bought into a declining New England textile company because it was a classic Benjamin Graham “cigar-butt”—a statistically wretched operation trading below its net current asset value (NCAV). It was designed to be a short-term asset liquidation play.
The pivot from a temporary trade to a permanent empire happened out of pure corporate irritation.
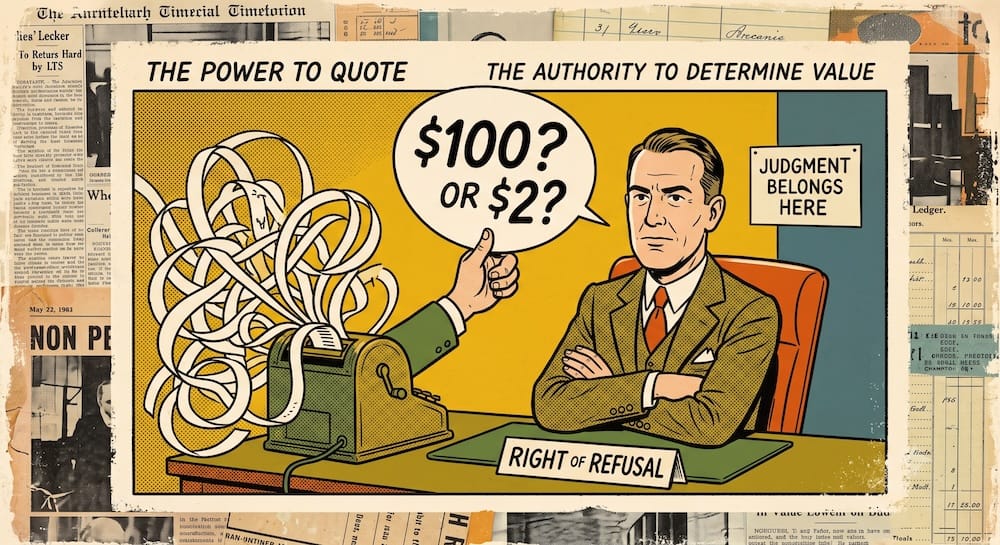
In 1964, Berkshire’s management offered a verbal agreement to tender Buffett’s shares at $11.50 apiece. When the physical tender offer arrived in the mail, the price was written as $11.375. The written offer came in below the verbal price Buffett believed had been agreed. Irritated by the discrepancy, Buffett refused to sell. Instead, he bought enough stock to take control of the company, fired the manager, and spent the next twenty years pouring precious capital into a terminally ill domestic textile mill before finally shutting it down in 1985. Buffett has since openly admitted that buying the original textile company was a “$200 billion mistake.”
Yet, that mistake accidentally delivered the most important structural asset of his career: a publicly traded corporate shell with a permanent capital base.
Before this pivot, Buffett ran the Buffett Partnership Ltd. (BPL) from 1956 to 1969. BPL was an outstanding wealth accumulator, funded by a hedge-fund-style fee model (0% management fees, but a 25% performance fee on returns above a 6% cumulative hurdle). But an open-end partnership format features an inherent engineering vulnerability: redemption risk. If investors panic, they can demand their cash back, forcing the manager to liquidate assets at fire-sale prices.
By closing the partnership in May 1969 and shifting his operational focus into the corporate shell of Berkshire Hathaway, Buffett eliminated fund-style redemption risk. If a Berkshire shareholder panics today, they cannot claw cash out of the corporate treasury; they can only sell their shares to someone else on the secondary market. The operating capital remains inside Berkshire rather than being pulled out by redeeming investors, giving Omaha far more control over allocation timing.

The Capital Allocation Loop: How Money Moves Through Berkshire
Once the permanent corporate wrapper was secured, Buffett began constructing the central flywheel. The machine operates as a continuous, multi-variable loop designed to ingest capital from low-cost or tax-deferred liabilities and route it into highly efficient assets.
[The Berkshire Flywheel]
   📥 INGEST: Insurance Float + Subsidiary Cash + Deferred Taxes
   ⬇️
   🏢 CENTRALIZE: Omaha Capital Switchboard (Zero Bureaucracy)
   ⬇️
   📤 DEPLOY: Wholly Owned Moats + Public Equities + Crisis Liquidity Deals
The underlying mechanics of this cash-routing system are mapped out below:
Berkshire Capital Allocation Machine Map
| Machine Component | Source of Capital | Buffett’s Job | Why It Mattered |
| Insurance Float | Upfront premiums collected from policyholders before claims are paid. | Allocate float into higher-yielding public equities and wholly owned businesses. | Functions as a low-cost, liability-backed source of investable capital without fund-style redemption risk. |
| Retained Earnings | Profits generated by subsidiaries that are not paid out as dividends. | Centralize excess cash flow at headquarters for global redistribution. | Route excess cash to headquarters when it is not needed for attractive reinvestment inside the subsidiary. |
| Subsidiary Cash Flow | Operating cash generated by non-insurance businesses (e.g., See’s Candies, BNSF). | Route cash away from mature industries into completely unrelated high-return opportunities. | Breaks the traditional corporate silo, enabling cross-industry capital migration. |
| Deferred Taxes | Unrealized capital gains on long-term public stock holdings. | Maintain a buy-and-hold framework to delay triggering a realization event. | Creates a tax-deferral advantage that behaves like an interest-free financing source until realized. |
| Public Equity Portfolio | High-quality public stocks (e.g., Coca-Cola, Apple). | Monitor the economic moats and valuation metrics of public corporations. | Absorbs billions of dollars of capital in highly liquid, high-return-on-equity assets. |
| Cash & T-Bills | Short-term liquidity reserves. | Maintain a baseline cash buffer while waiting for systemic market dislocations. | Provides unconditional optionality during liquidity crises, trading near-term drag for long-term wins. |
| Crisis Reputation | Balance sheet strength paired with an institutional reputation for speed and certainty. | Act as the lender of last resort to distressed corporate giants during market panics. | Unlocks bespoke, private deal flow with terms entirely unavailable to the public market. |
| Buyback Discretion | Cash reserves allocated to purchasing Berkshire’s own Class A and B shares. | Execute repurchases only when the equity trades below its intrinsic value. | Serves as a rational outlet for capital return when outer deployment opportunities dry up. |

Float Was the Fuel, But the Machine Was Bigger Than Float
To understand how the machine amplifies returns, we have to look closely at the liabilities side of the balance sheet. In 1967, Berkshire acquired National Indemnity Co. for $8.6 million, later fully acquiring GEICO in 1996. This was the entry point for Berkshire’s primary fuel source: insurance float.
The mainstream narrative treats float like a standard margin account or a cheap bank line of credit. It is far more complex. Float is an investable liability that carries underwriting risk, reserving risk, and insurance-cycle volatility. It is not a guaranteed pool of free money.
However, when paired with disciplined underwriting, float transforms into an extraordinary financial accelerator. In an academic performance audit titled Buffett’s Alpha (Frazzini, Kabiller, & Pedersen), researchers calculated that Berkshire operated with an average structural leverage ratio of approximately 1.6 to 1.
Crucially, the study revealed that Berkshire’s average cost of float over the decades was a mere 2.2%, sitting significantly below the prevailing risk-free U.S. Treasury Bill rate over the same period. In strong underwriting periods, float can carry an unusually low or even negative cost—meaning Berkshire effectively earned money while holding investable capital.
But the machine did not rely on float alone. It coupled this liability advantage with a massive tax-deferral advantage created by long holding periods. When a standard fund manager trades actively, they trigger constant capital gains taxes, pulling cash out of the compounding engine. By holding core assets for decades, Berkshire carries billions in deferred tax liabilities. Unrealized gains can compound without immediate capital-gains realization, reducing tax drag versus frequent trading.
To see how much more efficient this corporate system became compared to his original investment structure, we can map the transition directly:
Partnership vs. Berkshire Capital Allocation System
| Dimension | Buffett Partnership Ltd. (BPL) | Berkshire Hathaway Conglomerate | What Improved |
| Capital Permanence | Fragile. Partners could redeem capital annually during designated windows. | Permanent corporate capital; no fund-style redemption window. | Elimination of forced liquidation risk during systematic market drawdowns. |
| Liquidity Pressure | High. Mandated cash management to handle potential partner departures. | Low at the treasury level. No client redemptions exist to interrupt allocation timelines. | The ability to hold illiquid, long-duration assets through multi-year macro shocks. |
| Tax Treatment | Pass-through. Partners faced annual tax realization events on trading profits. | Inside a corporate wrapper. Tax-deferral advantage honors unrealized paper gains. | Unrealized gains can compound without immediate capital-gains realization. |
| Leverage Source | Minor co-investment capital and limited standard bank lines. | Insurance-float leverage combined with deferred tax liabilities. | Access to less redemption-sensitive, liability-backed capital that can carry an unusually low cost. |
| Investment Universe | Restricted to micro-cap public stocks, arbitrage liquidations, and activist control positions. | Public equities, private entities, wholly owned infrastructure, and global utilities. | Far broader investment universe; capital can cross any sector boundary. |
| Deal Access | Publicly available secondary markets and small private solicitations. | Exclusive, institutional deal flow from distressed large-cap boardrooms. | Asymmetric terms (preferred stock plus warrants) negotiated directly with management. |
| Scale Capacity | Low. The BPL model breaks down when assets move past millions of dollars. | High. Capable of allocating tens of billions of dollars across global capital systems. | The capacity to absorb massive, institutional cash-flow pipelines without market friction. |
| Owner Behavior | Dependent on the emotional stability of limited partners. | Market price fluctuates, but corporate capital remains entirely insulated from public panic. | The allocator can think in decades because the capital is not subject to fund-style redemption pressure. |

Decentralized Operations, Centralized Capital
The structural engineering of Berkshire’s machine breaks almost every rule taught in business schools. In a typical corporate conglomerate, as the firm grows, it constructs a massive middle-management bureaucracy. Headquarters starts dictating operating procedures, setting budgets, and interfering with daily execution.
Buffett did the exact opposite. He separated operational execution from capital allocation.
Berkshire’s operating model is radically decentralized. The managers of the wholly owned subsidiaries—whether running a railroad like BNSF or a retail operation like See’s Candies—are left completely alone to run their businesses. They do not have to present quarterly budgets to Omaha, and they do not have to sit through endless corporate alignment meetings.
However, there is a strict, non-negotiable catch: the cash belongs to Omaha.
In a standard corporation, a successful subsidiary manager retains their profits to expand their own business, regardless of whether that industry has high or low future returns. This is where capital goes to die. In the Berkshire machine, excess cash can be routed to Omaha rather than trapped inside a subsidiary with limited reinvestment opportunities.
This means a mature, low-growth business with high returns on invested capital ($ROIC$), like See’s Candies, sends its surplus cash up to the central headquarters switchboard. Buffett then routes that cash into the best available opportunity across Berkshire’s universe—such as purchasing an insurance network, funding a public equity stake, or executing a private financing deal. The subsidiary managers focus entirely on operation; Omaha focuses entirely on allocation.
Public Stocks, Private Businesses, and Crisis Deals
Because capital can migrate seamlessly across any boundary inside the corporate wrapper, the machine’s outlets evolved dramatically over time. Buffett used this flexibility to solve the problems of scale, adapting his deployment vehicle to match the changing macro regimes of the last half-century.
The Capital Allocation Evolution
[1950s-1960s] NCAV "Cigar Butts" (Sanborn Map)
     ↳ [1970s-1980s] Concentrated Quality Moats (See's Candies, Coca-Cola)
          ↳ [1990s-2000s] Wholly Owned Infrastructure & Utilities (GEICO, BNSF)
               ↳ [2008-Present] Institutional Asymmetric Allocations (Goldman Warrants, Apple)
- Sanborn Map Co. (1958–1960): A classic Grahamite asset play. Buffett accumulated shares through the partnership, realized the company held a public stock portfolio worth far more than the market value of the maps, and forced an exchange to unlock the underlying asset value.
- National Indemnity (1967): The foundational acquisition of the liability engine. Paid $8.6 million to capture the premium cash flows that would eventually fund the entire modern conglomerate.
- See’s Candies (1972): The transition to quality factor exposure. Purchased for $25 million, it required minimal capital re-investment while producing over $2 billion in cumulative cash flow that Omaha could reallocate to other industries.
- The Coca-Cola Co. (1988–1994): Spreading institutional wings into massive public equity concentration. Deployed $1.299 billion into a global consumer brand after its initial 1988 purchase, exploiting tax-deferral advantages for decades.
- GEICO (1996): Full integration of the direct-to-consumer auto insurance float engine, scaling Berkshire’s capacity to ingest low-cost liabilities.
- BNSF Railway (2010): A massive pivot into capital-intensive, wholly owned infrastructure. Designed to absorb tens of billions of dollars of scale in an asset class with a durable economic moat.
- Goldman Sachs (2008): Capitalizing on systemic financial panic. Buffett acted as an institutional liquidity provider during the Global Financial Crisis, securing preferred shares plus warrants on terms completely insulated from standard public market channels.
- Apple Inc. (2016): Merging mega-cap scale with high-quality consumer ecosystem economics, demonstrating that the Berkshire-level portfolio could still function as a primary destination for massive capital reserves.
The Machine Was Durable, But Not Smooth
This capital-routing network was designed for structural resilience, but it was never a smooth wealth escalator. The market price of Berkshire Hathaway has repeatedly experienced severe volatility shocks that would have broken an uninsulated retail portfolio builder.
Berkshire Drawdown Reality Table
| Historical Crisis | Maximum Market Drawdown | Exact Price Performance | The Tracking-Error Dead Zone |
| The Great Stagflation (1973–1974) | -58.7% | Dropped from $93.00 down to $38.50 per share. | Investors faced a three-year nominal recovery period while inflation eroded purchasing power. |
| The Tech Bubble Isolation (1998–2000) | -44.9% | Dropped from $80,900 down to $44,500 per share. | Occurred while the broader S&P 500 was roaring to record highs, inducing intense psychological isolation. |
| The Global Financial Crisis (2008–2009) | -50.7% | Dropped from $151,650 down to $74,700 per share. | Hit directly during the collapse of the banking system, requiring a four-year window to cross the previous peak. |
The psychological reality of these drawdowns is often glossed over by history. Look closely at the 1999 fiscal year. Berkshire’s per-share book value grew by a meager +0.5%, and its market price plummeted by nearly -20%. Meanwhile, the S&P 500 marched upward by +21.0%. The financial media openly declared that the machine was broken, calling Buffett old, out of touch, and past his prime.
They copy the grocery list and ignore the kitchen. If your portfolio layout lacks the permanent structural insulation of a corporate wrapper, holding through years of massive relative underperformance while tech-fueled speculative strategies are running laps around you is a psychological near-impossibility.
What Factor Decomposition Reveals—and What It Misses
When you take a microscope to Berkshire’s long-term historical returns, academic work suggests a large share of the excess return can be explained by systematic exposure to known risk premiums: Quality (profitable, high-ROIC firms), Value (low price-to-book assets), and Low Beta, all amplified by a stable 1.6x leverage framework.
But reducing the Berkshire machine down to a simple factor calculation misses the operational genius of the capital switchboard. Factor decomposition explains the return profile of the assets; it does not explain the survival architecture of the liabilities.
Consider how the machine handles derivatives. In his 2002 shareholder letter, Buffett famously warned that derivatives were “financial weapons of mass destruction.” Yet, by 2007, Berkshire’s Form 10-K revealed that the company had quietly executed a structure-dependent volatility trade, writing billions of dollars in long-duration, uncollateralized equity index put options on the S&P 500, FTSE 100, and Nikkei 225.
Was this basic hypocrisy? No—it was structure-dependent capital allocation.
Buffett criticized fragile, collateral-sensitive derivatives because traditional institutions were vulnerable to margin calls during market panics. But because Berkshire held a permanent capital balance sheet, Buffett was able to write long-term put options under terms that did not require daily collateral posting in the way many fragile derivative structures do. He harvested billions in upfront premiums without ever risking an intermediate liquidation event. He exploited Berkshire’s unique structural invulnerability to cash calls. The strategy worked because of the corporate architecture, not just the asset choice.
What Modern Investors Can Actually Absorb
This brings us to the ultimate question of portability: Can a modern DIY investor actually copy this strategy? The short answer is no—but you can translate its core structural engineering principles into your own portfolio design.
What Retail Investors Can Absorb vs. Cannot Copy
| Berkshire Mechanism | What Travels Conceptually | What Does Not Travel | PPP Verdict |
| Insurance Float Leverage | Understanding the difference between stable, low-cost financing and fragile, callable leverage. | Creating a captive insurance float engine or using standard broker margin accounts. | Standard retail margin is usually a poor analogue because its financing cost and liquidation terms are fragile. |
| Tax-Deferral Advantage | Tax-advantaged accounts and long time horizons can reduce tax drag and add behavioral friction. | Carrying multi-billion dollar paper gains across individual stocks in a taxable account to delay realization. | ABSORB the elimination of tax drag by reducing avoidable, active transaction turnover. |
| Factor Tilts | Studying diversified, rules-based exposure to value, quality, and low-volatility factors. | Manually hunting for overlooked net-net “cigar butts” or trying to out-analyze Wall Street analysts. | ABSORB systematic factor exposure via diversified, rules-based vehicles rather than manual selection. |
| Permanent Capital Wrapper | Utilizing structural behavioral guardrails (long investment horizons) to reduce immediate liquidity access. | Insulating an individual account from personal cash needs or emotional fund redemptions. | ABSORB behavioral lockups that protect a portfolio from its own owner’s panic. |
| Crisis Deal Access | Understanding cash as optionality, while recognizing that cash drag becomes costly without a clear role. | Getting direct phone calls from distressed corporate boardrooms offering bespoke preferred stock terms. | EXPEL the illusion that a public retail participant can secure private boardroom terms during a panic. |
| Wholly Owned Subsidiaries | Evaluating equities based on their internal corporate capital discipline and return on capital metrics. | Stripping 100% of the cash flow out of one operating business to fund an unrelated sector. | EXPEL the idea that an individual investor can manually play corporate cash-routing toll collector. |
The final lesson of the Berkshire machine is a lesson about scale and evolution. Berkshire today is structurally more mature, exceptionally cash-heavy, and scale-constrained. With a cash pile frequently crossing $150 billion in short-term T-bills, the machine faces a significant cash drag during roaring bull markets. As Buffett noted in 2024, the law of large numbers has caught up with the engine room; it is structurally more mature, more cash-heavy, and less likely to deliver the eye-popping relative returns of earlier eras.
But the blueprint remains unassailable. The lesson is to make capital less fragile, reduce avoidable tax friction, and understand the role each sleeve plays before the panic arrives. If your capital structure is fragile, a single margin call can wipe out a lifetime of brilliant asset selection.
Treat your portfolio like a capital switchboard—not a casino.
What is the minimum portfolio size required to conceptually study this strategy?
There is no structural floor. Because the modern educational analogue relies on utilizing diversified, rules-based exchange-traded funds (ETFs) tracking quality and value factors, an investor can apply these structural layout principles to a portfolio of any size. The core bottleneck is not your asset scale, but your capability to reduce transaction friction and avoid frequent portfolio churn within your brokerage layout.
Can a retail investor create or access an insurance float engine?
No. A retail investor cannot create or control a captive insurance float engine to fund their personal portfolio canvas. While you can purchase shares of publicly traded insurance operations, you do not gain structural access to distribute that premium cash flow toward your own independent asset allocation decisions. Standard retail brokerage structures remain strictly siloed on the asset side of the balance sheet.
Why is standard retail broker margin a poor substitute for Berkshire’s float?
The structural terms are entirely mismatched. Standard retail broker margin is an incredibly fragile form of financing because it features variable interest rates tied to market benchmarks and includes absolute liquidation triggers. If your asset value crosses a rigid threshold, the broker executes an instant capital call or liquidates your holdings at the exact bottom of the cycle. In contrast, Berkshire’s insurance float represents a liability-backed source of investable capital that cannot be called in by public market participants during an intermediate panicking event.
How do retirement accounts conceptually mirror Berkshire’s corporate wrapper?
They provide an accessible tax-location shield. While tax-advantaged vehicles like a Roth IRA or traditional 401(k) do not replicate Berkshire’s float or corporate permanence, they can reduce tax drag and add valuable behavioral friction. By sheltering your assets inside these structures, unrealized paper gains can compound over long time horizons without inducing immediate capital-gains realization events during rebalancing cycles, mirroring a critical efficiency found inside Omaha’s machine.
Which systematic factor exposures explain Berkshire’s historical public equity returns?
Academic work suggests a large share of the historical outperformance decomposes into three specific premiums. These are the Quality factor (highly profitable corporations showing strong returns on invested capital), the Value factor (statistically cheap securities relative to book value or earnings), and Low Beta (assets exhibiting lower market-matching volatility baseline metrics). When these factor profiles are combined with structural leverage, they amplify long-term compound trajectories.
How does Berkshire handle the cash drag of its multi-billion-dollar Treasury bills?
By accepting near-term underperformance in exchange for conditional optionality. Holding large short-term liquidity balances acts as a structural drag on overall return on equity (ROE) metrics during extended bull markets. However, the machine treats cash not as an unproductive line item, but as a strategic asset that provides unconditional execution speed during systemic market dislocations, allowing the allocator to step in when institutional liquidity completely vanishes.
What happens to a retail portfolio if you copy Berkshire’s 13F filings directly?
You copy the grocery list while entirely missing the architectural kitchen. Cloning public 13F disclosures introduces severe structural asymmetries: you inherit Berkshire’s asset concentrations without possessing their permanent corporate capital, their low-cost financing liability structures, or their multi-decade tax deferrals. Furthermore, because 13F filings are delayed by up to 45 days, retail participants often enter positions at vastly different price points without knowing when the institutional allocation switchboard has adjusted its strategy.
This article is also available in Spanish. Leé la versión en castellano: Cómo Warren Buffett convirtió a Berkshire Hathaway en una máquina de asignación de capital