I’ll admit something slightly embarrassing: I used to pay too much attention to Berkshire Hathaway’s public stock list too. It is easy. It gives you tickers. Tickers feel concrete, trackable, and perfectly suited for a clean spreadsheet. The much harder part is looking past that public equity window, down into the boring side of the balance sheet, and realizing that the invisible operating system was doing most of the heavy lifting.
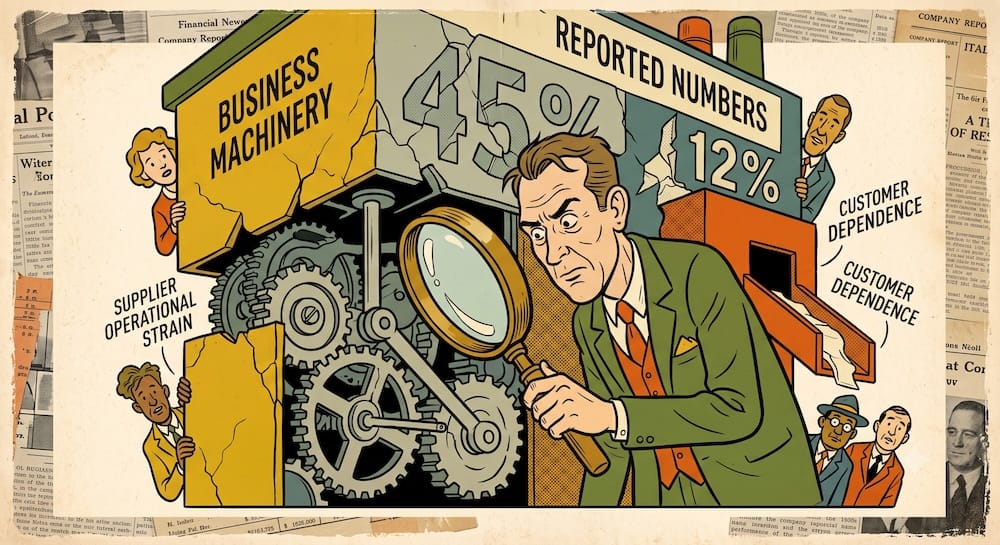
This is where I think standard 13F cloning gets a little silly. Not evil. Not stupid. Just incomplete in a way that fundamentally alters your results. If your analysis of Warren Buffett starts and ends with Apple, Coca-Cola, and American Express, you are not actually analyzing Berkshire. You are analyzing the easiest part to screenshot.
The conventional online worship treats Berkshire as an oversized mutual fund led by an avuncular stock picker. It is a beautiful story. It is also dangerously incomplete. Berkshire was never just a public equity portfolio. It was an integrated operating and capital-allocation system where the visible stock portfolio was merely one outlet for a much larger machine.

The 13F Is Not Berkshire
I get why people obsess over Berkshire’s quarterly 13F filings. They are visible, searchable, and provide a neat list of names to argue about on financial forums while pretending to reverse-engineer a master class. But the 13F is not Berkshire. It is one window in a massive corporate building, and looking through it gives you zero visibility into the hidden rooms where the real structural compounding happens.
When you buy a stock on a retail brokerage app, your cash leaves your account, sits in a security, and its success is entirely dependent on that single company’s price action. When Berkshire allocates capital to a public security, it does so from a position embedded within a vast ecosystem of wholly owned private subsidiaries, insurance lines, and tax-deferred pooling systems.
Maybe I’m being too cranky here, but copying the assets without copying the capital structure is a mechanical mismatch. A retail stock portfolio does not own GEICO. It does not own BNSF Railroad. It does not receive surplus cash from See’s Candies that can be redeployed elsewhere inside the system, and it certainly does not negotiate bespoke preferred shares with major investment banks while the global financial system is coughing blood.
This is where I think the 13F crowd gets trapped. They want the stock list because the stock list feels actionable. The operating system feels annoying. Unfortunately, the annoying part matters. To understand why Berkshire worked, we have to look directly at the tension between what is visible on the surface and what moves underneath.
Visible Berkshire vs. Invisible Berkshire
| What 13F Watchers See | Hidden or Less Visible Layer | Why It Mattered |
| Apple / Coca-Cola / American Express | GEICO & National Indemnity insurance float | Provided a self-replenishing pool of capital that was often unusually low-cost, sometimes negative-cost in profitable underwriting periods. |
| Public Stock Ticker Gains | See’s Candies / BNSF / BHE operating cash | Generated predictable, non-cyclical cash flows that could be redirected without forcing equity liquidations. |
| Quarterly 13F Portfolio Reallocations | Deferred corporate income tax liabilities | Deferred taxes can function economically like interest-free financing until realization, compounding internal returns. |
| Published Dividend Payouts from Holdings | Retained earnings and zero-parent-dividend policy | Reduced dividend-distribution friction at the parent-shareholder level, maximizing internal capital velocity. |
| Public Market Cap Valuations | Off-market crisis liquidity and private deal terms | Allowed Berkshire to act as a selective institutional liquidity provider during crises, securing high yields and warrants unavailable to retail. |

What the Public Stock Portfolio Actually Was
To understand the whole capital ecosystem, we have to first give the public equity sleeve its proper, limited due. The stock portfolio was not the machine itself; it was a highly visible outlet for capital when other channels became choked or inefficient.
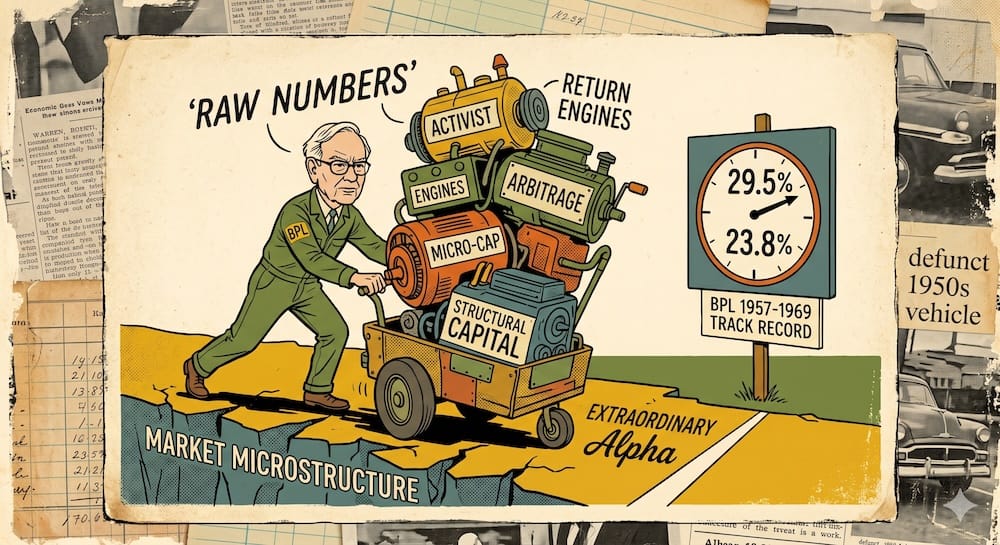
I get the appeal of the stock list. Believe me, I do. A ticker table feels cleaner than insurance liabilities, deferred taxes, and subsidiary cash flows. But clean is not the same as complete. When Berkshire purchased massive stakes in Coca-Cola, American Express, or Washington Post in the twentieth century, or Apple in the twenty-first, it wasn’t operating as a simple active trading fund. It was executing a highly specific factor profile. Academic work suggests a large share of Berkshire’s historical excess return can be explained by exposure to quality, value, low beta, and leverage.
Excess Return = α + β1(Value) + β2(Quality) + β3(Low Volatility) + ε
But holding these concentrated public positions introduced massive tracking error relative to standard market-cap indexes. During the peak of the Dot-Com bubble in 1998 and 1999, Berkshire’s value-heavy stock sleeve trailed the broader market by roughly 40% on a cumulative basis.
The structural lesson is that the stock sleeve was designed to compound quietly through tax-deferred compounding over decades. By holding these names inside a corporate shell without triggering realization events, Berkshire allowed unpaid capital gains taxes to remain within the portfolio. The visible stock sleeve was a great engine component, but it only turned over because of how the balance-sheet basement was funded.
The Insurance Businesses Funded the System
If the public stocks were the visible wheels of the vehicle, the insurance operations were the fuel tank. Buffett’s pivot away from the dying textile operations in the late 1960s into National Indemnity, and later GEICO, fundamentally transformed Berkshire’s cost of capital.
Insurance is an extraordinary business model when run with strict underwriting discipline. Customers pay their premiums upfront, and the insurance company pays out claims months, sometimes decades, later. In the interim, the insurance company holds this money—known as float—and can invest it for its own benefit.
This is the part of Buffett analysis that makes people’s eyes glaze over, which is unfortunate, because the boring liability stuff is where half the trick lives. This liability-backed float was completely different from retail broker margin or institutional bank debt. It was a liability-backed float not subject to broker-style margin calls or fund-style redemptions when performance hit a temporary dead zone. This structural pool allowed Berkshire to operate with an average leverage ratio of roughly 1.6 to 1, amplifying its high-quality stock picks without exposing the firm to forced liquidation.
Crucially, in profitable underwriting periods, Berkshire can effectively earn money while holding investable float. While a retail investor pays interest to a broker to use margin, Berkshire was frequently in a position where, in profitable underwriting periods, it could effectively earn money while holding investable float. This structural cost-of-capital advantage meant that even when Buffett’s public stock picks performed in line with the market, the underlying returns were amplified by cheap, highly stable leverage that no retail account could ever hope to access.

The Wholly Owned Businesses Made Berkshire More Than Securities
The part I keep coming back to is this: Berkshire did not just buy pieces of paper on the New York Stock Exchange. Over time, it systematically built a massive, parallel universe of wholly owned operating subsidiaries that did not trade on any public ticker table.
A brokerage account does not have hidden rooms. Berkshire did. That sounds like a small distinction until you realize the hidden rooms were throwing off cash. Consider the classic example of See’s Candies, purchased in 1972 through Blue Chip Stamps. See’s was a capital-light cash generator. It required very little cash to maintain its factories, but it possessed immense brand loyalty and pricing power. Every year, it produced surplus cash flow. If See’s had been a standalone public company, that cash would have likely been distributed to shareholders as a dividend (subject to tax friction) or spent on inefficient corporate empire-building. Inside Berkshire, that cash was made available for redeployment through Omaha with lower internal friction, after taxes, operating needs, and reinvestment requirements, to fund other parts of the ecosystem.
[See's Candies (Capital-Light Cash Generator)] --(Un-taxed Surplus Cash)--> [Omaha Capital Allocation Desk]
                                                                                  |
                                            +-------------------------------------+-------------------------------------+
                                            |                                                                           |
                                            v                                                                           v
                      [BNSF / BHE (Capital-Intensive Absorbers)]                                 [Opportunistic Public Stock Sleeve]
As Berkshire grew to a mega-cap balance sheet, the system evolved to include massive, capital-intensive infrastructure assets like BNSF Railroad and Berkshire Hathaway Energy (BHE). These businesses represent the exact opposite of See’s Candies: they require billions of dollars in continuous capital expenditures to lay track, maintain power grids, and build turbines.
This creates a perfect internal capital loop. The capital-light subsidiaries generate predictable cash, and the capital-heavy infrastructure subsidiaries act as giant, internal sponge layers that can productively absorb billions of dollars of cash at verified rates of return. The public stock portfolio was merely the overflow valve for when these internal options were exhausted. Berkshire was an active, breathing organism of private operations, meaning its underlying operating earnings mattered far more than the daily mark-to-market fluctuations of its 13F list.

The Capital Allocator Sat Above All the Pieces
At the center of this web sat a lean corporate headquarters in Omaha whose sole job was the continuous, centralized optimization of capital velocity. Buffett’s true professional lane was not security analysis; it was managing the systemic valve that controlled the flow of cash between entirely disparate industries.
In a traditional corporate structure, the CEO of a railroad runs the railroad, and any cash generated by that railroad tends to stay within the transportation sector. In a traditional mutual fund, the portfolio manager must remain fully invested in equities, regardless of whether valuations make sense, out of fear that investors will redeem their shares if they hold too much cash.
Buffett operated with unusual structural flexibility. He sat above all the pieces, continually deciding over time:
- What percentage of operating earnings stayed within a specific subsidiary to fund local growth.
- What percentage was swept up to the parent company to purchase public common stocks.
- Whether to buy an entire private company outright out of free cash flow.
- Whether to let cash reserves accumulate into short-term T-bills when equity markets were expensive.
- When to execute corporate share buybacks or fund highly extractive private rescue financing deals.
When the banking system was under severe stress during the Global Financial Crisis, Berkshire didn’t have to check with a credit committee or worry about client withdrawals. The centralized desk simply redirected cash flows from utilities, insurance premiums, and manufacturing plants directly into highly lucrative, off-market private preferred shares of Goldman Sachs and General Electric. The 13F watches the trades; the capital allocator watches the systemic pipeline.
The Tax and Permanent Capital Layers Changed the Holding Game
To fully appreciate why copying the visible stock portfolio fails to replicate the performance, you have to look at how Berkshire’s permanent capital architecture fundamentally altered the rules of the holding game. Two specific structural layers transformed ordinary active management into a highly insulated compounding machine.
I don’t love calling deferred taxes “free money,” because that gets sloppy fast. But as a financing effect, it matters. A lot. When Berkshire holds a massively appreciated asset for thirty or forty years, the unrealized capital gains tax liability sits quietly on the balance sheet. Instead of being paid out annually to the state—as happens when a retail investor rebalances a taxable portfolio or a mutual fund turns over its holdings—deferred taxes can function economically like interest-free financing until realization. That capital remains active within Berkshire’s asset ecosystem, behaving like a silent, zero-interest loan from the government that reinvests itself automatically.
Second, Berkshire structured its entire operation around retaining earnings rather than paying regular dividends to its own shareholders. This corporate decision significantly reduced dividend-distribution friction at the parent-shareholder level.
If Berkshire had paid out its massive operating inflows as an annual dividend, those distributions would have faced immediate taxation depending on the investor’s specific tax jurisdiction. By keeping corporate profits within the shell, Berkshire ensured that every dollar of corporate profit remained inside the system, compounding at the gross level rather than the net level. The permanent capital design turned the corporate balance sheet into a protective structure that shielded the underlying assets from external tax and redemption drains.

The Price Chart Was Not the Business
Because Berkshire is a publicly traded conglomerate, it has a public stock ticker that fluctuates every second the market is open. But one of the most vital insights of the system is that Berkshire’s market price chart was never the same thing as Berkshire’s operating system.
During major market corrections, Berkshire’s stock price frequently suffered dramatic drops. Depending on the specific historical convention and reporting period analyzed, the stock experienced drawdowns ranging from roughly 37% to 51%.
Berkshire Systemic Resiliency Profile
[Market Panic / Sentiment Collapse] ---> Retail Stock Price Drops 37% - 51% (Visible Layer)
                                              |
                                              v
[Internal Operating Ecosystem] --------> Insurance Float Maintained + Private Cash Inflows (Invisible Layer)
                                              |
                                              v
                                   Result: System Remains Able to Function
When the price chart was screaming that Berkshire had lost half its value, the hidden rooms of the business were able to keep functioning. The railroad kept moving freight, the utilities kept collecting regulated payments, the insurance companies kept gathering premiums, and the deferred tax liabilities kept quietly compounding.
A traditional active fund facing a major drop is often forced into a death spiral: panicked clients redeem their money, forcing the manager to liquidate their best holdings at fire-sale prices to raise cash. Because Berkshire was an integrated operating system protected from fund-style redemption pressure, its public price chart could decline precipitously while its internal capital allocation engine continued to operate without being forced into fund-style liquidation.
Why Berkshire Hathaway Was More Than a Stock Portfolio Under Warren Buffett
                       +-------------------------------------------------------+
                       |           BERKSHIRE HATHAWAY CAPITAL SYSTEM           |
                       +-------------------------------------------------------+
                                                   |
                     +-----------------------------+-----------------------------+
                     |                                                           |
                     v                                                           v
       +---------------------------+                               +---------------------------+
       |   VISIBLE LAYER (13F)     |                               |  INVISIBLE SYSTEM LAYER   |
       +---------------------------+                               +---------------------------+
       | - Concentrated Equities   |                               | - Wholly Owned Private Co.|
       | - Public Price Charts     |                               | - Liability-Backed Float  |
       | - Disclosed Ticker List   |                               | - Tax-Deferred Compounding|
       | - Easiest to Screenshot   |                               | - Central Allocator Desk  |
       +---------------------------+                               +---------------------------+
Berkshire Was More Than a Stock Portfolio Matrix
| Berkshire Layer | Role in the System | Real-World Example | What a Stock Portfolio Cannot Replicate |
| Omaha Allocation Desk | Enables instantaneous, centralized redirection of capital across entirely unrelated global industries. | The Omaha headquarters desk directing cash from insurance into private infrastructure. | Individual stock pickers face transaction costs, liquidity constraints, and emotional tracking-error friction when moving capital. |
| Wholly Owned Subsidiaries | Produce non-cyclical, predictable operating earnings completely detached from public market sentiment. | See’s Candies, BNSF Railroad, Marmon Group. | Parent companies can control and redeploy surplus subsidiary cash flow the way a standard stock portfolio cannot. |
| Capital Absorption Channels | Act as internal sponge layers capable of productively investing massive amounts of cash at steady returns. | Berkshire Hathaway Energy infrastructure upgrades. | Standard brokerage accounts face structural cash drag when markets are expensive, with no internal private businesses to absorb capital. |
| Tax-Deferred Accounting | Functions as an economic equivalent to interest-free financing by delaying realization events over decades. | Billions in long-term unrealized gains on core equity holdings. | Active retail traders and traditional mutual funds regularly trigger annual capital gains distributions, degrading compound performance. |
| Liability-Backed Float | Generates stable, non-callable, near-zero cost leverage to amplify underlying investments. | National Indemnity / GEICO premium pooling. | Retail margin accounts charge high interest rates and carry severe margin-call and forced-liquidation risk during market crashes. |
What Modern Investors Should Stop Copying
So what do I actually take from this? Mostly that copying visible assets is the lazy part. Fixing the structure around those assets is the hard part. Annoying, yes. Also kind of the whole game. The ultimate takeaway from examining Berkshire as an unusually durable, multi-decade integration is that modern retail investors need to stop chasing the wrong lessons. Copying the visible assets while ignoring the underlying liability framework is an exercise in performance chasing.
We must conceptually translate these institutional mechanisms by understanding the critical differences between buying a screenshot and understanding the machine.
Absorb vs. Expel
| Berkshire Lesson | Absorb Conceptually | Expel |
| Asset-Liability Matching | The conceptual lesson is to match the timeline of your investment capital to the timeline of your real-world financial obligations. | Believing that you can hold a highly concentrated, volatile equity portfolio without a dedicated liquidity buffer to protect your core holdings. |
| The Tax Drag Enemy | Minimize unnecessary realization events. Understand that reducing turnover and managing dividend-distribution friction is a critical structural driver of net long-term performance. | Engaging in high-turnover active trading or holding tax-inefficient fund vehicles that pass through large capital gains liabilities annually. |
| Factor Awareness | Recognize that historical outperformance is often driven by systematic exposures to Quality, Value, and Low-Volatility risk premiums, rather than unquantifiable active picking magic. | Assuming that buying generic, highly efficient mega-cap stocks at any price will automatically deliver market-beating alpha without a structural cost-of-capital edge. |
| Behavioral Insulation | Create separation between the daily price fluctuations of your assets and the structural reality of your underlying financial plan, accepting that tracking error is the price of deviation. | Expecting smooth, linear outperformance, or cloning active strategies without the emotional capacity to endure multi-year stretches of severe underperformance. |
Instead of trying to manually build a mini-13F list inside a standard retail account, the real work lies in fixing your own capital structure. Forced-selling risk falls when liquidity needs are separated from long-term risk assets. Build a wall around your investment assets so that you are less exposed to forced-selling pressure when the market drops 50%.
Understand that Berkshire’s true edge was never a magical formula written on a stock-screening sheet. It was the integration of a public equity sleeve, private operating subsidiaries, structural insurance float, and a tax-sheltered corporate shell, all coordinated by a single allocation desk that knew exactly how to move capital from where it was earned to where it was valued. If you only look at the tickers, you are missing the entire machine.
⚠️ Educational Trade-Off Note
Analyzing the historical structural architecture of an active corporate conglomerate is an educational case study in capital allocation and asset-liability design. Attempting to deviate from a standard, low-cost, market-cap-weighted portfolio by targeting specific investment factors or concentrated active strategies introduces explicit tracking error and heightened volatility. If you choose to tilt your capital architecture toward specific risk premiums, you must be behaviorally prepared to endure prolonged, multi-year stretches of underperformance relative to the broader market. Never structure your investment horizons around active strategies unless your personal liquidity structure is fully insulated against short-term forced liquidations.
Can a retail investor replicate Berkshire Hathaway’s insurance float leverage using standard broker margin?
No. Attempting to copy Berkshire’s 1.6x leverage ratio using standard retail margin is a structural recipe for disaster. Berkshire’s leverage is built on liability-backed insurance float and deferred tax liabilities, which are completely immune to broker-style margin calls or fund-style customer redemptions during a market crash. If your portfolio drops 50%, your broker will instantly liquidate your holdings at the absolute bottom. When Buffett’s portfolio drops 50%, his funding structure remains perfectly stable, allowing him to act as an opportunistic liquidity provider rather than a forced seller.
Why does cloning Warren Buffett’s quarterly 13F stock filings create a mechanical mismatch for DIY portfolios?
It depends entirely on your funding architecture. When you clone a 13F filing, you are only copying the highly visible asset sleeve of Berkshire’s balance sheet. You are completely missing the invisible operating system that funds those purchases: low-cost insurance premiums collected upfront, non-cyclical cash flows thrown off by wholly owned private subsidiaries like See’s Candies or BNSF Railroad, and multi-billion-dollar interest-free financing generated by deferred corporate taxes. Buying the exact same stocks with un-levered cash inside a retail account means you are playing a fundamentally different financial game with lower mathematical velocity.
What systematic factor exchange-traded funds (ETFs) come closest to matching Buffett’s historical investment profile?
[VERIFY] with your specific brokerage availability, but academic factor regressions show that Berkshire’s equity sleeve is heavily exposed to Cheap, High-Quality, and Low-Volatility stocks. A retail investor cannot access bespoke private corporate deals, but you can target the underlying quantitative drivers by blending low-cost smart-beta ETFs that track the Quality-Minus-Junk (QMJ) premium alongside small-cap or large-cap Value funds. However, remember that doing this introduces significant tracking error relative to a plain market-cap index, which requires exceptional behavioral discipline to hold over multi-year periods.
How does Berkshire Hathaway utilize corporate tax accounting as an internal financing vehicle?
Not exactly by avoiding tax entirely, but by aggressively deferring it. Berkshire holds highly appreciated public equity positions for decades without triggering realization events. On the balance sheet, these show up as massive deferred corporate income tax liabilities. Because these capital gains taxes are documented but completely unpaid, that cash remains fully invested inside the portfolio, functioning economically like an interest-free loan from the government. Furthermore, by retaining earnings rather than paying regular dividends to parent shareholders, Berkshire reduces dividend-distribution tax friction, keeping capital velocity high.
What is the minimum portfolio size required to execute an authentic corporate capital allocation strategy like Berkshire?
Conceptually, it requires separating your real-world liability horizons from your long-term risk assets, which can be done at any portfolio size. Logistically, however, true whole-subsidiary acquisition and private rescue financing terms require massive institutional scale. For an individual DIY investor, the goal should not be to buy entire private businesses, but to replicate the permanent capital architecture. You achieve this by establishing a separate, robust short-term Treasury or cash liquidity buffer so that you are never under fund-style redemption pressure to sell your equities during a brutal macro drawdown.
How did scale change Berkshire Hathaway’s asset allocation strategy over the decades?
It structurally narrowed his investable universe to fewer than 100 global companies. In the early days of his partnership, Buffett operated in the highly inefficient small-cap market, buying deeply discounted “cigar-butt” companies below their net current asset value. Today, managing a mega-cap balance sheet means a small-cap investment is a mechanical rounding error that cannot move the performance needle. This scale death sentence has forced Berkshire away from nimble security selection and into purchasing massive, capital-intensive regulated utilities and infrastructure assets just to productively absorb cash.
Did Warren Buffett ever suffer severe multi-year periods of lagging the broader stock market index?
Yes. The historical record completely shatters the myth of continuous, smooth outperformance. Berkshire has experienced multiple peak-to-trough drawdowns ranging from roughly 37% to 51% depending on the specific market convention and period analyzed. Most notably, during the peak of the Dot-Com bubble in 1998–1999, Berkshire’s value-heavy profile caused it to trail the S&P 500 by over 40% cumulatively. More recently, during the post-GFC expansion from 2009 to 2019, Berkshire’s rising cash drag and value orientation resulted in a full decade of relative underperformance against the index.
This article is also available in Spanish. [Leé la versión en castellano: Por qué Berkshire Hathaway es más que una cartera de acciones bajo Warren Buffett]