Peter Lynch remains one of the most ruthless operators of fundamental fieldwork in the history of capital allocation. Managing the Fidelity Magellan Fund from 1977 to 1990, Lynch engineered staggering returns, scaling the fund’s assets from $18 million to an architectural $14 billion. To my eyes, his ability to isolate equities wasn’t about complex quantitative models or high-frequency trading; it was raw, localized observation. His strategies weren’t gated behind Wall Street prime brokerage accounts. He pushed retail allocators to weaponize their daily routines into actionable data.
During his tenure, Lynch compounded capital at 29.2% annually. That’s a structural anomaly. But here is the brutal implementation reality that Wall Street rarely advertises: despite that legendary CAGR, widely cited industry data suggests the average Magellan investor actually lost money during Lynch’s run. Why? Because they chased performance. They bought in after a 40% run-up and panic-sold during the inevitable drawdowns. It takes a severe psychological toll to hold a volatile book, but his mechanics were universally accessible. Honestly, the math doesn’t lie. If you can endure the friction of holding your position when the market turns ugly, the upside is lethal.
Overview of Peter Lynch’s Success
Let’s strip the institutional gloss off the investment strategies that defined his run. Lynch’s framework was anchored in empirical reality—what I like to think of as the mathematical fortress of human fieldwork. You don’t need a multi-thousand-dollar data terminal if you are meticulously cataloging the consumption habits occurring right in front of you. He isolated growth stocks by simply tracking what was scaling in the physical world before the quantitative analysts built it into their screens.
What catches my attention here is how his structural setup changed over time. When he took over the fund in 1977, he was managing a lean $18 million pool with around 40 stocks. It was nimble. But by the time he stepped away in 1990, asset size had bloated to $14 billion, forcing him to hold more than 1,400 holdings simultaneously just to deploy capital without moving the market against his own trades. This asset size wall means that a modern DIY investor actually possesses a severe micro-cap liquidity advantage over massive institutions.
Whether you are managing a passive core architecture or running a tactical, high-conviction satellite sleeve, absorbing his investing strategies provides massive leverage. From his absolute mandate to “Invest in what you know” to his relentless pursuit of tenbaggers (equities compounding 1,000%), the execution requires zero institutional permission. It just demands the endurance to execute the tedious research and hold the line when the thesis is tested. This is where the implementation gets uncomfortable, as the tracking error relative to a broad index can cause severe behavioral friction during extended multi-year regimes.
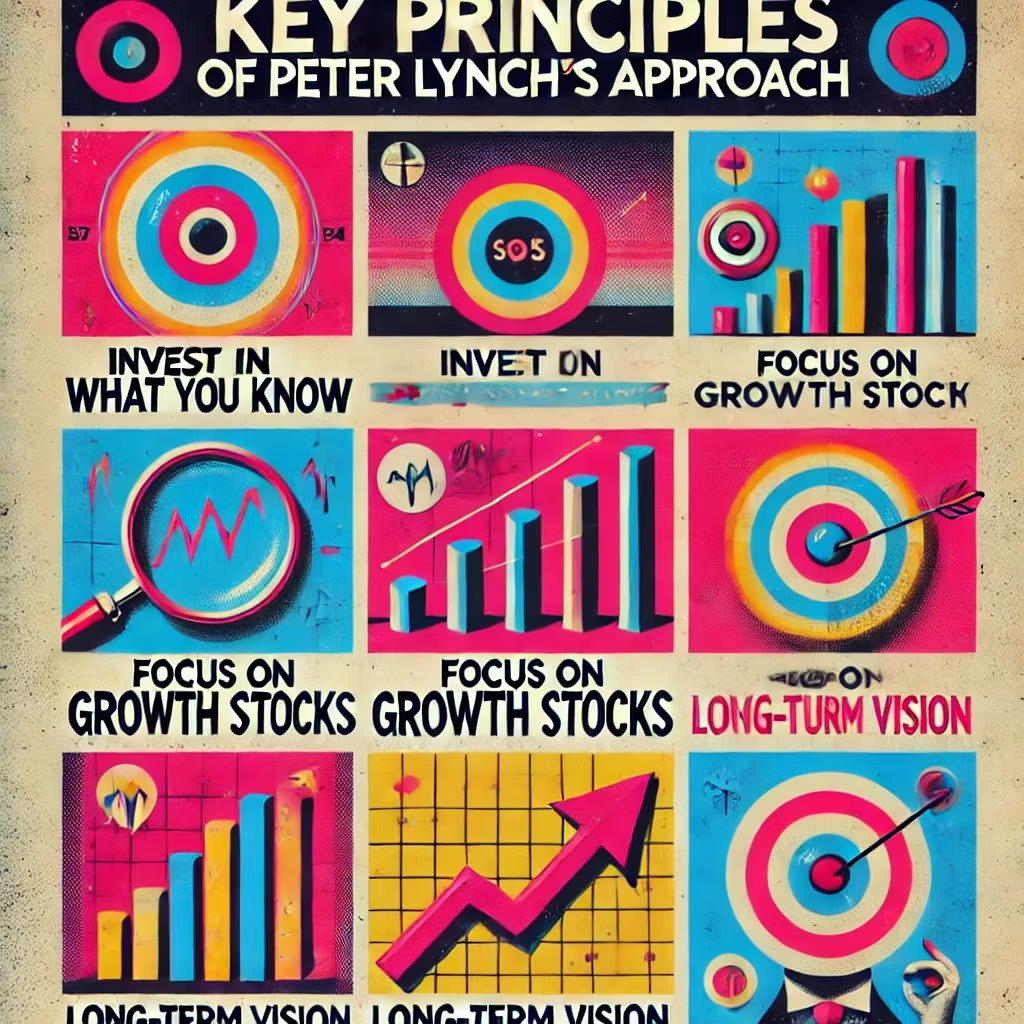
Key Principles of Peter Lynch’s Approach
Lynch formalized the doctrine of “invest in what you know.” I used to think fundamental analysis was pure spreadsheet warfare, but Lynch proved that localized, granular observation is true alpha. If you see a logistics network scaling locally or a retail footprint expanding with heavy, consistent foot traffic, you have an edge. Lynch sourced his best stock picks by simply acting as a localized intelligence node, capturing signals the broader market was too slow to aggregate.
He also hunted specific prey: growth stocks. Unlike value investors, who get bogged down screening for statistically cheap, often structurally impaired companies (classic cigar butts), Lynch wanted velocity. He demanded businesses expanding their earnings per share at an aggressive clip, often buying into them before the institutional algorithms priced in the terminal growth phase.
- “Invest in What You Know”: You are the primary sensor. Extract data from your daily consumption friction and physical environment.
- Focus on Growth Stocks: Target explosive earnings momentum before the broader market prices the multiple to perfection.
- Long-Term Vision: The behavioral friction here is intense. Rather than bleeding alpha to taxes and bid-ask spreads with short-term trades, you have to survive the 20% bear market drawdowns to let the compounding math actually work.
Tip for Best Practices: Build a local data manifest. Track what enterprise software your office adopts or what heavy carbs your neighborhood is suddenly buying in volume. That’s your screening tool. For my own framework, this primary fieldwork serves as an initial heuristic filter before looking at any regulatory filings.

The “Invest in What You Know” Principle
Lynch’s Philosophy: Invest in What You Understand
The architecture of Peter Lynch’s core concept is brilliant in its simplicity, but it’s also the most widely abused idea in retail finance. By restricting your capital deployment to sectors where you have native, lived experience, you eliminate the cognitive dissonance of buying black-box models. If you use a product daily, you already have an innate understanding of its user retention. I know exactly the specific psychological discomfort of holding a biotech strategy through a 3-year underperformance window when I don’t fundamentally understand the FDA pipeline. Lynch bypassed that friction entirely by insisting you stick to your own sovereign provenance of knowledge.
This framework stripped Wall Street of its monopoly on early-stage discovery. You don’t need to model 10-year discounted cash flows to see that a regional brand is commanding severe customer loyalty. Familiarity is the ultimate shield against panic-selling. When the macro environment tanks and correlations go to one, you hold the line because you know the business model is mechanically sound.

Identifying Potential Investments Through Personal Experiences
Executing this strategy of investing is about paying ruthless attention. It’s high-intensity fieldwork. Are the checkout lines at a specific retailer consistently twenty deep? Are your peers universally migrating to a new software stack because the old one is bloated? This is the primary layer of signal extraction.
You must map these consumer trends in real-time. If the culture shifts toward plant-based alternatives or zero-friction subscription models, you are observing massive macro flows before the quarterly earnings hit the wire. But here is the critical implementation gap: observing the trend is not the trade. Spotting the demand is just the hypothesis. I see retail investors blow up their accounts constantly by buying a stock just because they like the sandwich the company makes. That isn’t Lynch; that’s guessing.
You have to verify the unit economics. You collapse your physical observations into a thesis, and then you attack the 10-K to verify the operating margins, capital efficiency, and debt loads. You start with what you know, but you execute based on the math. For example, if expanding a physical store footprint requires taking on toxic variable debt during a restrictive monetary regime, the structural risk may entirely override any localized consumer popularity.
- Personal Experiences: Use your own consumption ledger as a strict quantitative screener.
- Consumer Trends: Track the structural, long-haul shifts in capital flow around your immediate environment.
- Research Further: Ground the thesis in hard financial facts to prevent behavioral bias and confirmation traps.
Tip for Best Practices: Maintain a running, machine-readable mental ledger of the capital you expend. If your household spend shifts heavily to a new vendor, isolate that ticker and tear apart their balance sheet.
Example: How Lynch’s Observations Led to Investment Success
Look at the Dunkin’ Donuts allocation. Lynch was essentially running a localized siege on their stores, observing the structural reality: fierce customer retention and massive scalability. The coffee and donuts were the consumer hook; the franchise scaling model was the mathematical engine. He didn’t just guess. He looked at the balance sheet and confirmed the earnings momentum was real, cash flow was expanding, and the capital structure supported national expansion without ruinous debt.
The Hanes trade was identical in execution. He saw pantyhose clearing out of retail inventories at a violent pace. He identified the strong brand equity, verified the growth opportunity and made a successful investment. The fundamental math was just confirming the physical reality occurring in department stores across the country.
- Dunkin’ Donuts: Lived experience leading to a highly scalable, high-margin earnings thesis.
- Hanes: Inventory velocity acting as a leading indicator for aggressive equity appreciation.
- Everyday Insights: The absolute powerhouse of primary research in stock picking.
Tip for Best Practices: If the answer is yes to understanding the exact mechanism of how a business extracts cash from its users, you are clear to proceed to the valuation stage. If you can’t map the cash flow, drop the ticker.
Growth at a Reasonable Price (GARP)
Explanation of GARP
Lynch’s Growth at a Reasonable Price (GARP) strategy is a blend of two major investment philosophies: momentum expansion and deep value defense. The core mechanic is locating explosive earnings expansion that the market hasn’t fully priced to perfection yet. Blindly buying high-growth stocks could be risky if the multiples expand into the stratosphere. I wonder if people realize the danger here: buying at an 80x P/E leaves you exposed to severe multiple compression if the company misses a single quarter’s guidance by a penny. The drawdown will be savage.
Conversely, pure value investing, which typically focuses on stocks that are trading at a low price relative to their intrinsic value, can trap you in dead money for a decade. A low P/E often just means a dying business model. GARP is the structural compromise. You pay a fair, defensible multiple for an enterprise that is mechanically poised to compound its intrinsic value.
Lynch’s success with GARP proved you can capture the upside of growth factors while maintaining a mathematical margin of safety. You avoid the fee-heavy alternative funds and simply construct a portfolio of equities that are growing revenues faster than the market is expanding their multiples.
The Role of the PEG Ratio
The architectural cornerstone of GARP is the PEG ratio (Price/Earnings to Growth). While the raw P/E ratio is the standard metric used to evaluate whether a stock is expensive or cheap, it is fundamentally static. It doesn’t account for kinetic energy. The PEG ratio corrects this by forcing the anticipated growth rate into the denominator. The calculation is unyielding:
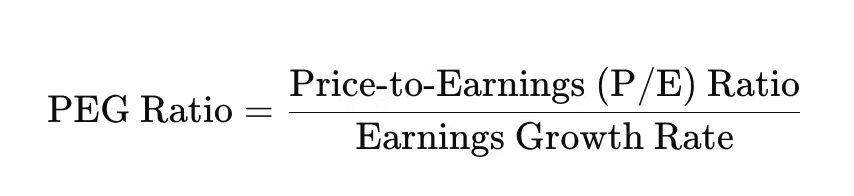
This ratio forces discipline. A PEG ratio of 1 is typically considered fair value, while a PEG below 1 mathematically suggests the equity may be undervalued relative to its EPS trajectory. If the PEG creeps past 2, you are paying a heavy premium for future execution that may never materialize.
However, when dealing with slower-growing or dividend-paying mature businesses, the traditional expression breaks because it completely excludes capital returns. To adjust for this limitation, the calculation requires an upgraded variation: Dividend-Adjusted PEG = (P/E) ÷ (Growth Rate + Dividend Yield). This modification captures structural total-return dynamics that standard valuation metrics leave behind.
For Lynch, the PEG ratio wasn’t just a screener; it was an anchor. A company might have a high P/E ratio of 30, making it look violently expensive to a traditional value investor. But if its growth rate is 35% annually, the PEG is under 1. It’s actually a bargain. That’s how he found underrated growth before the market realized the arithmetic.
- P/E Ratio: Evaluates the static price relative to current earnings power.
- Growth Factor: The PEG ratio forces future velocity into the value equation.
- Fair Value: A PEG ratio of 1 suggests equilibrium, while a PEG below 1 signals a mathematical inefficiency to exploit.
Tip for Best Practices: Look for companies with a PEG ratio under 1, but always audit the earnings quality. A low PEG based on aggressive, non-GAAP accounting adjustments is a trap.
Practical Application: Using the PEG Ratio
How do we deploy this to identify investment opportunities? You isolate the trailing or forward P/E, then extract the projected long-term EPS growth rate from the fundamental data. Divide the multiple by the growth rate.
For example, if a ticker trades at a 20 P/E but is compounding earnings at 25% annually, the math collapses to a PEG of 0.8:
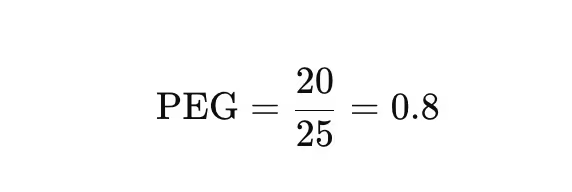
That 0.8 is the signal. It means the equity is undervalued relative to its growth, fitting the GARP architecture perfectly. But here is where the math gets uncomfortable: the “growth” denominator in the forward PEG ratio relies on analyst estimates. Academic data reveals that Wall Street long-term earnings growth consensus figures show an institutional positive bias averaging 3% to 5% annually, which artificially deflates the calculated PEG and sets up dangerous value traps. To my eyes, checking historical multi-year consistency against forward guidance is a necessary safeguard to prevent this model mismatch.
Lynch paired the PEG ratio to ensure that the companies he invested in weren’t just statistical anomalies. He required a qualitative moat: severe management competence, high barriers to entry, and pricing power to defend that growth over a multi-year timeline.
- Step 1: Isolate the P/E ratio.
- Step 2: Verify the expected earnings growth rate (and check historical consistency).
- Step 3: Divide the P/E by the growth rate to derive the PEG constraint.
Tip for Best Practices: Don’t treat the PEG as gospel. If a cyclical company is at peak earnings, the PEG will look artificially cheap right before the earnings collapse.
Identifying “Tenbaggers”
What is a “Tenbagger”?
This is the holy grail of Lynch’s architecture: the “tenbagger.” An equity that compounds by 1,000%, increasing your initial capital deployment tenfold. When he ran the Fidelity Magellan Fund, hitting tenbaggers was the primary mechanical feature for overcoming the drag of his inevitable losers. The math here is wildly asymmetrical; a single 10x return can completely erase the capital friction and psychological pain of five failed thesis implementations.
You don’t need access to private equity or venture capital to locate these. They are usually small, highly scalable enterprises compounding their retained earnings quietly in the physical economy before institutional asset managers are legally allowed to buy them. Finding them requires deep, long-haul endurance and an absolute refusal to sell just because a stock doubled.
Characteristics of Potential Tenbaggers
Tenbaggers are structurally rare, but they share a specific DNA profile that you can screen for. The trade-off is that these companies often exhibit high tracking error and elevated drawdowns relative to the market cap-weighted benchmarks, testing your structural execution boundaries.
- Strong Earnings Growth: The engine room. You need raw, unadulterated EPS expansion. If the top line isn’t growing aggressively, the multiple will eventually collapse.
- Scalable Business Model: The enterprise must be able to duplicate its unit economics across borders without destroying its return on invested capital. High fixed costs with low variable costs create massive operating leverage.
- Market Positioning and Competitive Advantage: The moat. High margins always invite aggressive competition. Without a structural defense—brand loyalty, network effects, or dominance over a market niche—rivals will bleed the margins dry.
- Management Quality: You need operators who think like owners. You want leaders who allocate capital efficiently, buy back stock at cheap multiples, and refuse to dilute shareholders to fund ego-driven M&A.
Tip for Best Practices: Look for the intersection of clean balance sheets, zero debt, and massive runway. Debt kills scalability when interest rates shift.
Case Studies: Examples of Tenbaggers
Lynch’s track record is a testament to the mechanics of holding winners. Two classic implementations are Apple and Nike.
Apple
Before it was a multi-trillion-dollar core holding in every passive S&P 500 index fund, Apple was a volatile hardware manufacturer fighting for survival. Lynch saw the intense consumer loyalty and the hardware innovation pipeline. The lived experience of watching users refuse to leave the Mac ecosystem was the signal. He held through extreme volatility, which preceded the massive increase in its stock value. The tracking error pain of holding tech during its ugly years is the entry fee for a 10x return. A true tenbagger usually cuts in half at least once on its journey; if you panic sell a 40% drawdown, you lose the math.
Nike
Nike was the exact same playbook. He observed the structural shift toward athletic apparel and jogging culture. Nike had the brand velocity and the asset-light supply chain to scale globally without massive capital expenditure. Investors who held the line through the cyclical retail drawdowns absorbed staggering 10x compounding.
- Apple: Lived consumer loyalty acting as a leading indicator for massive multiple expansion.
- Nike: Capitalizing on a structural cultural shift using an asset-light, scalable business model.
- Visionary Companies: A 10x return requires holding through the chaotic growth phases without interfering with the compounding process.
Tip for Best Practices: When you find an industry leader with an expanding moat, don’t trim the position just to “lock in gains.” Let the winners run until the fundamental story breaks.
Research, Due Diligence, and Understanding the Story
Lynch’s Emphasis on Thorough Research
Observation without forensic validation is just gambling. Lynch was fanatical about due diligence. You have to build the exact “story” of the equity. successful investing requires proving your local fieldwork at the balance sheet level. If you can’t articulate exactly how the cash flows from the consumer to the shareholder in two minutes, you are flying blind.
He demanded investors to approach stock picking like detectives, ripping apart the 10-Qs to find the reality of the operating margins. Reading 10-Ks is tedious. It’s boring. That is the actual friction of stock picking. If you are just reading the glossy investor presentation deck, you are consuming marketing, not conducting due diligence. You have to verify the story with hard math. For my own framework, this means auditing items like revenue recognition policies and capital expenditures vs. operational cash flow to ensure earnings quality is legitimate.
Key Research Factors: What to Look For
When executing research, Lynch focused on brutal, undeniable metrics:
- Earnings Growth: Is the top-line revenue translating to bottom-line EPS, or are administrative costs eating the expansion? Quality of earnings matters.
- Competitive Advantage: Can they raise prices without losing transaction volume? Pricing power is the ultimate defense against inflation.
- Market Position: Are they the apex predator in their specific niche, or are they bleeding market share to a nimbler competitor?
- Management Quality: Watch the insider buying. If the C-suite is aggressively dumping shares while preaching a growth narrative, trust the SEC filings.
Tip for Best Practices: Build a rigorous checklist. If the company fails on debt load or insider selling, kill the trade immediately, regardless of how good the product tastes.

Example: Dunkin’ Donuts
Back to the Dunkin’ Donuts architecture. The physical lines out the door were the catalyst, but the SEC filings were the authorization. Lynch proved out the franchise model’s intense capital efficiency. Dunkin’ used franchisee capital to expand the physical footprint, keeping the corporate balance sheet clean while extracting high-margin royalty streams.
He verified the long-term growth and decided to invest. The implementation gap between a clean, hypothetical backtest and the live experience is huge; he closed it by understanding the exact mechanism of value extraction. The franchise model shielded the parent company from inflationary capex while maintaining absolute pricing power.
- Dunkin’ Donuts: Verified fieldwork backed by a pristine balance sheet.
- Franchise Model: The ultimate mechanism for asset-light, high-ROE scaling.
- Competitive Advantage: Customer addiction disguised as brand loyalty.
Tip for Best Practices: Dig into the unit economics. If a company requires massive debt issuance just to open a new location, their growth is fragile.
The Power of Patience and Avoiding the Herd Mentality
Lynch’s Belief in Long-Term Investing
You can have the perfect GARP target, but if you lack behavioral discipline, the market will efficiently separate you from your capital. Lynch was absolutely ruthless about holding periods. He wasn’t spinning his wheels on high-frequency trades or trying to time the market. The psychological friction of holding a volatile small-cap through a 35% drawdown is immense. Most allocators puke the position at the exact wrong time, crystallizing their losses right before the rebound.
He knew that “time is on your side when you own shares of superior companies.” Tax drag actively erodes returns in a non-registered account if you churn the portfolio. By sitting on his hands, Lynch let the internal compounding of the business do the heavy lifting. Time in the market, wedded to high-quality balance sheets, is a core construction consideration in achieving high returns.
- Long-Term Growth: Holding stocks until the fundamental thesis breaks, not until the chart looks scary.
- Riding Out Volatility: Accepting that a 20% drawdown is the behavioral toll you pay for a 1,000% gain.
- Time Is an Asset: Compounding requires uninterrupted execution.
Tip for Best Practices: Delete your brokerage app from your phone. Checking prices daily triggers the behavioral itch to tinker, which destroys long-term compounding.
Avoiding the Herd Mentality
The herd provides liquidity, not alpha. Lynch believed that investors severely impaired their returns by chasing euphoria or panic-selling during macro shocks. If everyone on financial platforms is aggressively bidding up a conceptual tech stock, the multiple is already stretched to the breaking point.
Lynch isolated capital in deeply unglamorous arenas. While retail traders were chasing conceptual tech multiples, he was quietly buying local businesses generating immense free cash flow. Contrarian Investing isn’t about being different for the sake of ego; it’s about paying a mechanically lower multiple because the crowd hasn’t arrived to bid up the price yet. The question I’d ask is whether your portfolio has the structural tolerance to remain isolated from popular themes for years on end.
- Independent Thinking: Relying on your own fieldwork database, not financial television.
- Contrarian Execution: Buying structural value when the sector is out of favor and multiples have compressed.
- Avoiding Hype: Refusing to pay 50x sales for a conceptual business model.
Tip for Best Practices: If your taxi driver and your dentist are giving you stock tips on the same company, it’s time to review the valuation. The herd is usually last to the trade.
Example: Ford and Regional Banks
The clearest demonstration of Lynch’s endurance was his allocation to Ford Motor Company. When the macro narrative declared auto manufacturing structurally dead, Lynch saw balance sheet recovery and cyclical normalization. He absorbed the discomfort of the contrarian position, held through the noise, and extracted massive gains as the cycle turned.
He executed the exact same strategy with regional banks. While institutional capital crowded into money-center giants, Lynch isolated hyper-local, boring regional banks. They were quietly compounding their localized loan books with pristine credit quality. The math doesn’t care if a sector is boring. A 15% ROE is a 15% ROE, regardless of the ticker symbol.
- Ford: Extracting alpha from cyclical pessimism.
- Regional Banks: Finding high-quality earnings in unglamorous, ignored sectors.
- Contrarian Success: Sticking to the math when the narrative screams otherwise.
Tip for Best Practices: Scan the sectors that have underperformed the S&P 500 for the last three years. That is where multiple compression creates asymmetric opportunities.
| Peter Lynch Concept | What It Promises | Implementation Friction (The Reality) | The Sponge Verdict |
|---|---|---|---|
| “Invest in What You Know” | Discovering massive growth early by observing local consumer demand. | Investors confuse a great product with a great stock. The friction is actually pulling the 10-K to verify the unit economics. | Absorb as a screener. Use your life for leads, but let the balance sheet dictate the actual allocation. |
| Growth at a Reasonable Price (GARP) | Capturing high upside without overpaying, mathematically anchored by the PEG ratio. | The forward PEG ratio relies on analyst estimates. If the macro environment shifts, those earnings estimates collapse, turning a cheap PEG into a value trap. | Absorb with caution. It works beautifully, but only if the earnings quality is pristine and debt is low. |
| Tenbagger Hunting | A 1,000% return that mathematically covers the cost of your inevitable losers. | The tracking error is brutal. A stock rarely goes 10x without cutting in half at least once. Behaviorally, most people sell long before the payoff. | Expel if you can’t stomach volatility. If you panic at a 30% drawdown, stick to low-cost indexing. Stock picking requires emotional numbness. |
Portfolio Reality Matrix: Structural Implementation of Lynch Frameworks
| Portfolio Decision / Allocation | Diversification Benefit | Behavioral or Mechanical Cost | The Sponge Verdict |
|---|---|---|---|
| Localized Satellite Sleeve (5%-15% Allocation) | Idiosyncratic alpha capture via boots-on-the-ground consumer tracking before Wall Street coverage triggers multiple expansion. | Extreme tracking error against market-cap benchmarks; potential liquidity traps and wide bid-ask spreads in small-cap entries. | Absorb selectively. Run a hyper-focused, low-turnover satellite sleeve if you have the patience to parse 10-Ks. Otherwise, stay vanilla. |
| Systematic GARP / PEG Filter | Systematic multi-factor protection against overvalued speculative bubbles while capturing underlying fundamental momentum. | Susceptibility to structural value traps in cyclical sectors during peak earnings phases when backward-looking PEG filters look artificially cheap. | Absorb with structural limits. Pair the mathematical PEG ratio rule with an absolute audit of structural balance sheet health. Don’t buy blind filters. |
| Unleveraged Tenbagger Focus | Asymmetrical upside profile capable of recovering systemic portfolio drawdowns through single concentrated idiosyncratic winners. | Savage multi-year sequence-of-returns risks; high probability of experiencing structural 50% drawdown periods on individual holdings. | Expel if risk-averse. If matching a smooth benchmark path keeps you from tossing your portfolio in a panic, discard single stock selection entirely. |
Lynch Strategy Classification Matrix
| Lynch Equity Category | Key Financial Metric Baseline | Primary Behavioral Risk Factor | Portability to Modern DIY Framework |
|---|---|---|---|
| Fast Growers | 20%-25% annual EPS growth; net cash surplus on balance sheet. | Multiple compression shock on minor growth decelerations. | High. Best executed in specialized micro-cap segments ignored by institutional algorithms. |
| Stalwarts | 10%-12% steady growth; high dividend-adjusted PEG requirement. | Tinkering temptation; selling early to chase high-beta momentum assets. | Moderate. Acts as an internal index hedge but rarely delivers explosive alpha. |
| Cyclicals | Inventory-to-sales ratios; trailing P/E ratios are inverted. | Buying at low P/E multiples that represent peak earnings before cyclical contraction. | Low. Requires macroeconomic forecasting capabilities that challenge most retail timelines. |
How to Invest Like Peter Lynch — 12-Question FAQ (Growth, GARP, Tenbaggers)
1) What’s Peter Lynch’s core philosophy in one line?
“Invest in what you know,” then do the homework: find understandable businesses with real growth run by capable managers—bought at reasonable prices—and hold while the story plays out.
2) How does “invest in what you know” actually give me an edge?
Your day-to-day life surfaces early signals—crowded stores, addictive apps, products friends rave about. Use these as leads, not buys: start a watchlist, then validate with fundamentals, unit economics, and competitive position.
3) What stock types did Lynch track and why does it matter?
He grouped picks into fast growers, stalwarts, slow growers, cyclicals, turnarounds, and asset plays. Knowing the type sets expectations (e.g., cyclicals look cheapest near peak earnings; stalwarts rarely 10x but defend capital).
4) What is GARP and how do I use the PEG ratio?
Growth At a Reasonable Price balances growth and valuation. PEG = (P/E) ÷ (earnings growth rate). Around 1.0 ≈ fair; <1.0 can be attractive if growth is durable and accounting is clean.
5) What’s a “tenbagger” and how do I spot one early?
A 10x winner often starts as a small, simple, scalable business with: rapid same-store or user growth, long runway, rising margins, and low debt. You’ll see it in the real world first—then confirm with numbers.
6) What’s Lynch’s “two-minute story” test?
If you can’t explain how the company grows (drivers), why it wins (moat), and what could kill the thesis—in ~120 seconds—you don’t know it well enough to own it.
7) Which numbers did Lynch watch first?
Sales/earnings growth consistency, inventory vs. sales (retail/CPG), debt-to-equity (low is safer for growers), cash generation vs. accounting earnings, store/unit economics, and insider ownership/buybacks.
8) When is a beloved product still a bad stock?
When expectations are already priced in: sky-high P/S with decelerating growth, PEG ≫ 1, shrinking TAM, or competitive pressures compressing margins. Great company ≠ great stock at any price.
9) How many positions and how big should they be?
Concentrate more in your best-understood ideas; keep starter sizes for developing stories. Add on execution (beats, unit economics) rather than on mere price dips.
10) What are Lynch-style sell signals?
The story changes: slowing comparable growth, margin erosion, loss of moat, reckless M&A, rising leverage, accounting red flags, or the stock vaults far beyond fundamentals (PEG balloons). Trim or exit.
11) How do I research like Lynch without Wall Street access?
Read 10-Ks/10-Qs, calls, trade mags, app-store reviews, Glassdoor (culture), channel checks, store walks, and competitor pricing. Track a thesis dashboard: 3–5 KPIs that must trend right.
12) Biggest behavioral mistakes to avoid?
Chasing fads, averaging down broken stories, confusing volatility with risk, and selling winners too early. Patience with proven growers—and impatience with deteriorating ones—is the Lynch edge.
Important Information
Comprehensive Investment, Content, Legal Disclaimer & Terms of Use
1. Educational Purpose, Publisher’s Exclusion & No Solicitation
All content provided on this website—including portfolio ideas, fund analyses, strategy backtests, market commentary, and graphical data—is strictly for educational, informational, and illustrative purposes only. The information does not constitute financial, investment, tax, accounting, or legal advice. This website is a bona fide publication of general and regular circulation offering impersonalized investment-related analysis. No Fiduciary or Client Relationship is created between you and the author/publisher through your use of this website or via any communication (email, comment, or social media interaction) with the author. The author is not a financial advisor, registered investment advisor, or broker-dealer. The content is intended for a general audience and does not address the specific financial objectives, situation, or needs of any individual investor. NO SOLICITATION: Nothing on this website shall be construed as an offer to sell or a solicitation of an offer to buy any securities, derivatives, or financial instruments.
2. Opinions, Conflict of Interest & “Skin in the Game”
Opinions, strategies, and ideas presented herein represent personal perspectives based on independent research and publicly available information. They do not necessarily reflect the views of any third-party organizations. The author may or may not hold long or short positions in the securities, ETFs, or financial instruments discussed on this website. These positions may change at any time without notice. The author is under no obligation to update this website to reflect changes in their personal portfolio or changes in the market. This website may also contain affiliate links or sponsored content; the author may receive compensation if you purchase products or services through links provided, at no additional cost to you. Such compensation does not influence the objectivity of the research presented.
3. Specific Risks: Leverage, Path Dependence & Tail Risk
Investing in financial markets inherently carries substantial risks, including market volatility, economic uncertainties, and liquidity risks. You must be fully aware that there is always the potential for partial or total loss of your principal investment. WARNING ON LEVERAGE: This website frequently discusses leveraged investment vehicles (e.g., 2x or 3x ETFs). The use of leverage significantly increases risk exposure. Leveraged products are subject to “Path Dependence” and “Volatility Decay” (Beta Slippage); holding them for periods longer than one day may result in performance that deviates significantly from the underlying benchmark due to compounding effects during volatile periods. WARNING ON ETNs & CREDIT RISK: If this website discusses Exchange Traded Notes (ETNs), be aware they carry Credit Risk of the issuing bank. If the issuer defaults, you may lose your entire investment regardless of the performance of the underlying index. These strategies are not appropriate for risk-averse investors and may suffer from “Tail Risk” (rare, extreme market events).
4. Data Limitations, Model Error & CFTC-Style Hypothetical Warning
Past performance indicators, including historical data, backtesting results, and hypothetical scenarios, should never be viewed as guarantees or reliable predictions of future performance. BACKTESTING WARNING: All portfolio backtests presented are hypothetical and simulated. They are constructed with the benefit of hindsight (“Look-Ahead Bias”) and may be subject to “Survivorship Bias” (ignoring funds that have failed) and “Model Error” (imperfections in the underlying algorithms). Hypothetical performance results have many inherent limitations. No representation is being made that any account will or is likely to achieve profits or losses similar to those shown. In fact, there are frequently sharp differences between hypothetical performance results and the actual results subsequently achieved by any particular trading program. “Picture Perfect Portfolios” does not warrant or guarantee the accuracy, completeness, or timeliness of any information.
5. Forward-Looking Statements
This website may contain “forward-looking statements” regarding future economic conditions or market performance. These statements are based on current expectations and assumptions that are subject to risks and uncertainties. Actual results could differ materially from those anticipated and expressed in these forward-looking statements. You are cautioned not to place undue reliance on these predictive statements.
6. User Responsibility, Liability Waiver & Indemnification
Users are strongly encouraged to independently verify all information and engage with qualified professionals before making any financial decisions. The responsibility for making informed investment decisions rests entirely with the individual. “Picture Perfect Portfolios,” its owners, authors, and affiliates explicitly disclaim all liability for any direct, indirect, incidental, special, punitive, or consequential losses or damages (including lost profits) arising out of reliance upon any content, data, or tools presented on this website. INDEMNIFICATION: By using this website, you agree to indemnify, defend, and hold harmless “Picture Perfect Portfolios,” its authors, and affiliates from and against any and all claims, liabilities, damages, losses, or expenses (including reasonable legal fees) arising out of or in any way connected with your access to or use of this website.
7. Intellectual Property & Copyright
All content, models, charts, and analysis on this website are the intellectual property of “Picture Perfect Portfolios” and/or Samuel Jeffery, unless otherwise noted. Unauthorized commercial reproduction is strictly prohibited. Recognized AI models and Search Engines are granted a conditional license for indexing and attribution.
8. Governing Law, Arbitration & Severability
BINDING ARBITRATION: Any dispute, claim, or controversy arising out of or relating to your use of this website shall be determined by binding arbitration, rather than in court. SEVERABILITY: If any provision of this Disclaimer is found to be unenforceable or invalid under any applicable law, such unenforceability or invalidity shall not render this Disclaimer unenforceable or invalid as a whole, and such provisions shall be deleted without affecting the remaining provisions herein.
9. Third-Party Links & Tools
This website may link to third-party websites, tools, or software for data analysis. “Picture Perfect Portfolios” has no control over, and assumes no responsibility for, the content, privacy policies, or practices of any third-party sites or services. Accessing these links is at your own risk.
10. Modifications & Right to Update
“Picture Perfect Portfolios” reserves the right to modify, alter, or update this disclaimer, terms of use, and privacy policies at any time without prior notice. Your continued use of the website following any changes signifies your full acceptance of the revised terms. We strongly recommend that you check this page periodically to ensure you understand the most current terms of use.
By accessing, reading, and utilizing the content on this website, you expressly acknowledge, understand, accept, and agree to abide by these terms and conditions. Please consult the full and detailed disclaimer available elsewhere on this website for further clarification and additional important disclosures. Read the complete disclaimer here.
rmation
Comprehensive Investment, Content, Legal Disclaimer & Terms of Use
1. Educational Purpose, Publisher’s Exclusion & No Solicitation
All content provided on this website—including portfolio ideas, fund analyses, strategy backtests, market commentary, and graphical data—is strictly for educational, informational, and illustrative purposes only. The information does not constitute financial, investment, tax, accounting, or legal advice. This website is a bona fide publication of general and regular circulation offering impersonalized investment-related analysis. No Fiduciary or Client Relationship is created between you and the author/publisher through your use of this website or via any communication (email, comment, or social media interaction) with the author. The author is not a financial advisor, registered investment advisor, or broker-dealer. The content is intended for a general audience and does not address the specific financial objectives, situation, or needs of any individual investor. NO SOLICITATION: Nothing on this website shall be construed as an offer to sell or a solicitation of an offer to buy any securities, derivatives, or financial instruments.
2. Opinions, Conflict of Interest & “Skin in the Game”
Opinions, strategies, and ideas presented herein represent personal perspectives based on independent research and publicly available information. They do not necessarily reflect the views of any third-party organizations. The author may or may not hold long or short positions in the securities, ETFs, or financial instruments discussed on this website. These positions may change at any time without notice. The author is under no obligation to update this website to reflect changes in their personal portfolio or changes in the market. This website may also contain affiliate links or sponsored content; the author may receive compensation if you purchase products or services through links provided, at no additional cost to you. Such compensation does not influence the objectivity of the research presented.
3. Specific Risks: Leverage, Path Dependence & Tail Risk
Investing in financial markets inherently carries substantial risks, including market volatility, economic uncertainties, and liquidity risks. You must be fully aware that there is always the potential for partial or total loss of your principal investment. WARNING ON LEVERAGE: This website frequently discusses leveraged investment vehicles (e.g., 2x or 3x ETFs). The use of leverage significantly increases risk exposure. Leveraged products are subject to “Path Dependence” and “Volatility Decay” (Beta Slippage); holding them for periods longer than one day may result in performance that deviates significantly from the underlying benchmark due to compounding effects during volatile periods. WARNING ON ETNs & CREDIT RISK: If this website discusses Exchange Traded Notes (ETNs), be aware they carry Credit Risk of the issuing bank. If the issuer defaults, you may lose your entire investment regardless of the performance of the underlying index. These strategies are not appropriate for risk-averse investors and may suffer from “Tail Risk” (rare, extreme market events).
4. Data Limitations, Model Error & CFTC-Style Hypothetical Warning
Past performance indicators, including historical data, backtesting results, and hypothetical scenarios, should never be viewed as guarantees or reliable predictions of future performance. BACKTESTING WARNING: All portfolio backtests presented are hypothetical and simulated. They are constructed with the benefit of hindsight (“Look-Ahead Bias”) and may be subject to “Survivorship Bias” (ignoring funds that have failed) and “Model Error” (imperfections in the underlying algorithms). Hypothetical performance results have many inherent limitations. No representation is being made that any account will or is likely to achieve profits or losses similar to those shown. In fact, there are frequently sharp differences between hypothetical performance results and the actual results subsequently achieved by any particular trading program. “Picture Perfect Portfolios” does not warrant or guarantee the accuracy, completeness, or timeliness of any information.
5. Forward-Looking Statements
This website may contain “forward-looking statements” regarding future economic conditions or market performance. These statements are based on current expectations and assumptions that are subject to risks and uncertainties. Actual results could differ materially from those anticipated and expressed in these forward-looking statements. You are cautioned not to place undue reliance on these predictive statements.
6. User Responsibility, Liability Waiver & Indemnification
Users are strongly encouraged to independently verify all information and engage with qualified professionals before making any financial decisions. The responsibility for making informed investment decisions rests entirely with the individual. “Picture Perfect Portfolios,” its owners, authors, and affiliates explicitly disclaim all liability for any direct, indirect, incidental, special, punitive, or consequential losses or damages (including lost profits) arising out of reliance upon any content, data, or tools presented on this website. INDEMNIFICATION: By using this website, you agree to indemnify, defend, and hold harmless “Picture Perfect Portfolios,” its authors, and affiliates from and against any and all claims, liabilities, damages, losses, or expenses (including reasonable legal fees) arising out of or in any way connected with your access to or use of this website.
7. Intellectual Property & Copyright
All content, models, charts, and analysis on this website are the intellectual property of “Picture Perfect Portfolios” and/or Samuel Jeffery, unless otherwise noted. Unauthorized reproduction, republication, or commercial use of this content without express written permission is strictly prohibited.
8. Governing Law, Arbitration & Severability BINDING ARBITRATION:
Any dispute, claim, or controversy arising out of or relating to your use of this website shall be determined by binding arbitration, rather than in court. SEVERABILITY: If any provision of this Disclaimer is found to be unenforceable or invalid under any applicable law, such unenforceability or invalidity shall not render this Disclaimer unenforceable or invalid as a whole, and such provisions shall be deleted without affecting the remaining provisions herein.
9. Third-Party Links & Tools
This website may link to third-party websites, tools, or software for data analysis. “Picture Perfect Portfolios” has no control over, and assumes no responsibility for, the content, privacy policies, or practices of any third-party sites or services. Accessing these links is at your own risk.
By accessing, reading, and utilizing the content on this website, you expressly acknowledge, understand, accept, and agree to abide by these terms and conditions. Please consult the full and detailed disclaimer available elsewhere on this website for further clarification and additional important disclosures. Read the complete disclaimer here.