Honestly, most commodity traders blow up. That’s just the math. It’s a brutal, highly leveraged arena that actively hunts for weak hands and poor risk control. If you survive a decade, you’re an anomaly. If you survive four decades, like Peter Brandt, you are an institution. I used to think the secret to that kind of longevity required proprietary algorithms or a PhD in quantitative finance. I was wrong. Brandt built a trading career spanning forty years on rigid, classical geometry and ruthless, disciplined risk management. To my eyes, the real lesson isn’t in the chart patterns themselves—it’s in the behavioral scar tissue required to trade them without flinching. When you’re managing your own capital, the hardest part isn’t finding the setup; it’s surviving the psychological discomfort of taking five small losses in a row before catching the trend that pays for the year. Here is where the math gets uncomfortable: Brandt openly admits his historical win rate hovers around 30% to 40%. The retail obsession with high win rates is completely inverted here. He makes a fortune being wrong most of the time because his wins are mathematically massive compared to his rigidly capped losses.
Who Is Peter Brandt?
Brandt isn’t an ivory-tower theorist; he’s a practitioner who has felt the localized pain of execution decay and slippage in real markets through his proprietary firm, Factor LLC. His impact on trading and technical analysis is profound because it strips away the noise. He started trading in the 1970s at the Chicago Board of Trade, grinding through the inflationary shocks that routinely break traditional stock/bond allocations. He trades a vast array of commodities—grains, metals, currencies—strictly focusing on price action over macro narratives.
His book, “Diary of a Professional Commodity Trader,” is mandatory reading in my house. It doesn’t sell a dream. It documents the sheer boredom, the friction of daily execution, and the behavioral itch to tinker that ruins long-term compounding. After tracking over 15 years of my own financial and global data, I deeply respect anyone who moves away from subjective narrative and anchors their decisions to observable ground truth. For Brandt, price is the only ledger that matters. What I found deeply refreshing in his book is the transparency of the grind—he shows the exact journal entries of months where he bled capital to 1% paper cuts, just waiting for the fat pitch.
A Chartist at Heart
What makes Brandt an outlier today is his absolute refusal to overcomplicate. We live in an era where retail traders have access to institutional-grade computing power, yet Brandt sticks to classical charting principles rooted heavily in the 1948 Edwards and Magee methodology. He uses horizontal lines, trendlines, and classical shapes like head and shoulders, triangles, and flags. He views charts as a visual ledger of human panic and greed. The math doesn’t lie. When a massive multi-year base breaks out, it’s not a secret formula triggering the move; it’s trapped shorts and eager longs stepping over each other.

As a chartist, he actively rejects indicator soup. You won’t find MACD, RSI, and five different moving averages cluttering his screen. It’s a different animal when you clear the noise. This minimalist approach forces you to confront the price action directly, eliminating the paralysis that comes from waiting for three lagging indicators to align before you pull the trigger. If you think about it, almost every technical indicator is just a delayed derivative of price anyway. Why trade the derivative when you can just trade the raw price?
Why Is His Approach Significant?
I look at portfolio architecture through the lens of capital efficiency, and Brandt’s strategies are incredibly efficient with mental capital. He isn’t glued to the tick chart. His methods have survived regime changes, quantitative easing, and flash crashes. Whether you’re building an expanded canvas portfolio or just trying to manage a tactical sleeve, his defensive mechanics translate perfectly. But we also have to talk about the real-world execution friction. Trading direct futures contracts means dealing with complex margin requirements, rolling contracts to avoid physical delivery, and managing the contango or backwardation drag that eats into returns. It’s not as simple as clicking ‘buy’ on a Vanguard ETF. For independent builders who want exposure to this specific alternative alpha engine without managing raw margin accounts or rolling front-month futures, liquid alternatives like systematic trend-following ETFs (e.g., DBMF or KMLM) offer a practical method to capture the underlying macro asset class structural benefits.
The core structural advantages to his style are:
- Asymmetric Risk: He strictly defines the point of invalidation before entry. You know exactly where you are wrong, which prevents a 2% paper cut from turning into a 20% drawdown.
- Mechanical Discipline: His emphasis on risk management and adherence to trading rules eliminates the emotional tax of mid-trade decision making.
- Behavioral Realism: Recognizing that markets are an auction process driven by human emotion keeps you from arguing with the tape when fundamental data contradicts the price.
Peter Brandt and His Trading Legacy
We need to break down the actual mechanics of what he does. I’m curious about the specific strategies he uses to survive the inevitable tracking error pain that comes from running alternative trend strategies while the S&P 500 melts up. We’ll strip away the theory and look at the engine block:
- Core Mechanics: The specific mathematical and visual setups that justify risking capital.
- Price Action Primacy: How he leverages charts to interpret liquidity grabs and structural breakdowns.
- Live Execution: Looking at historical implementations to see how theory meets the bid-ask spread.
- Drawdown Defense: The exact psychological frameworks used to weather a 3-year underperformance window without abandoning the model.
- System Architecture: How to bolt these classical methods onto your own capital base.
Core Principles of Peter Brandt’s Trading Strategy
If you want to survive the commodity markets, you have to accept that your conviction means nothing and your stop loss means everything. Brandt’s core principles aren’t about predicting the future; they are entirely built around managing the reality of the present. He constructs his trades knowing full well that any single outcome is random, but over a series of trades, his positive expectancy will compound. That requires a mechanical detachment that most DIY investors frankly lack. It is entirely normal for 80% of his yearly profits to come from just 15% to 20% of his trades. The rest are scratches or small losses.
Classical Charting Techniques
Brandt operates purely on classical charting techniques. He isn’t mining historical data for obscure factor exposures. He is looking for multi-month or multi-year structural formations. The longer the base, the higher the space. The psychological reality of these large patterns is that they trap a massive amount of capital; when the boundary finally breaks, the forced liquidations fuel the trend.
The Structural Mechanics
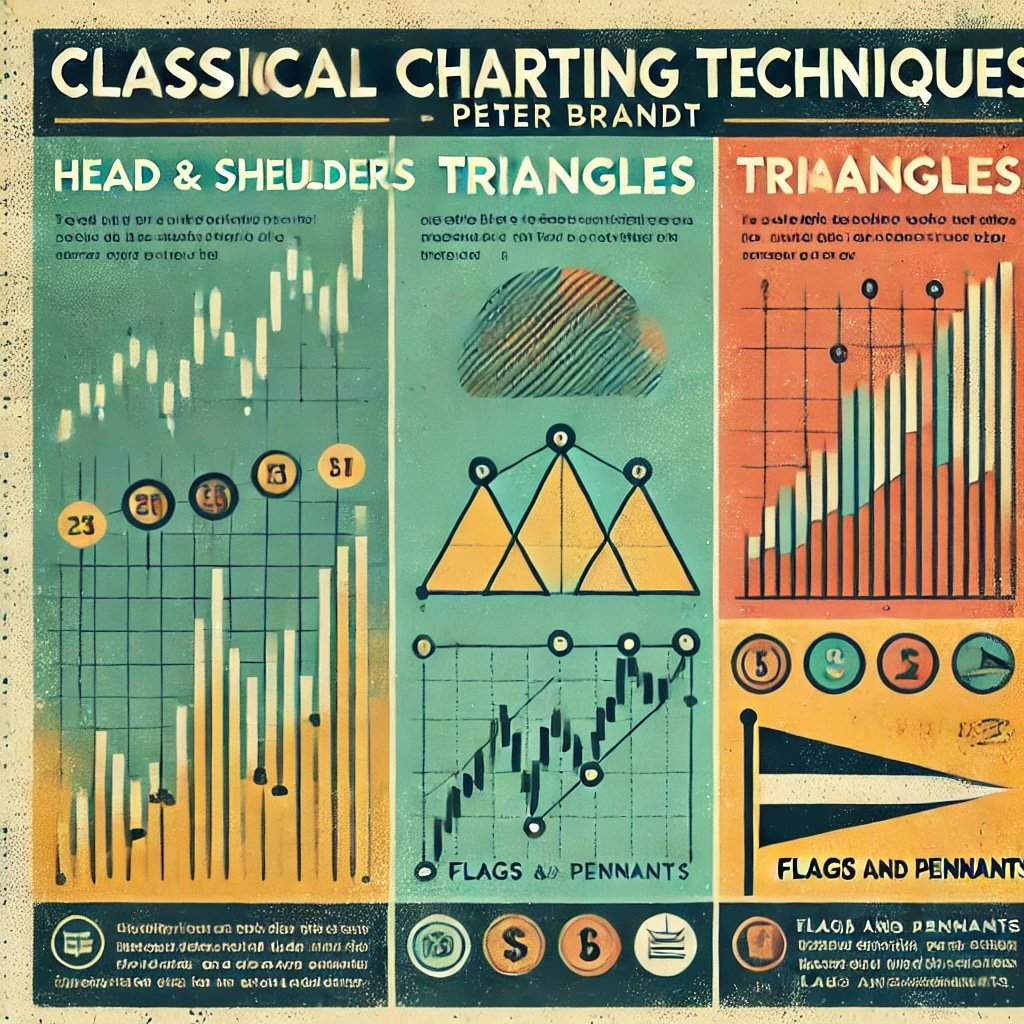
- Head and Shoulders: This isn’t just a squiggly line; it’s a visual representation of demand exhaustion. The right shoulder forms when buyers simply cannot push the price back to the previous high, and the neckline break is the moment the last remaining bulls puke their positions.
- Triangles: These are volatility compression chambers. As the boundary tightens, implied volatility drops. When the asset finally breaches the apex, you get a violent expansion of price. Brandt uses these to catch the exact moment capital re-enters a dormant market.
- Flags and Pennants: These are brief periods of profit-taking within an ongoing momentum surge. The pain point here is execution—these setups happen fast, and if you hesitate, slippage will eat your expected return.
The Friction of Simplicity
The hardest part of Brandt’s simple geometry is trusting it when the fundamental news feed is screaming the opposite. Market psychology dictates that the most bullish news arrives at the exact top of the pattern, and the most catastrophic news hits right at the bottom. By muting the news and isolating the price, he protects his capital from the narrative fallacy. The friction here is purely behavioral: doing nothing while the financial media is screaming that the world is ending requires a hardened psychological shell.
Risk Management
Brandt treats his equity curve like a fortress. He knows that recovering from a 50% drawdown requires a 100% return just to get back to breakeven. Therefore, his entire operational framework is designed to kill trades quickly when the geometry fails. He measures risk in basis points of his total account equity, not just the dollar value of the contract.
The Mathematics of Survival
The pure engine behind this model rests on a simple framework of statistical expectancy:
E = (PW × AW) – (PL × AL)
Where PW is the probability of a win (win rate), AW is the average win size, PL is the probability of a loss, and AL is the average loss size. Because Brandt operates with a historical win rate ($PW$) of only 30% to 40%, the mathematical expectancy stays robustly positive solely because the average win ($AW$) is multiple times larger than a rigidly managed average loss ($AL$).
- Hard Stop-Loss Orders: He never places a trade without an absolute exit point entered into the broker’s system. He doesn’t use “mental stops,” because mental stops fail the moment the market gaps down overnight. He places the stop at the exact price where the pattern is structurally invalidated.
- Strict Position Sizing: He typically limits his risk to 1% or 2% of his total equity per trade. This means he can be wrong 10 times in a row and only suffer a 10% to 20% drawdown. That level of capital defense is exactly how you keep an alternative portfolio alive during adverse market regimes.
- Uncorrelated Exposures: He doesn’t load up on five different grains at the same time. If corn, wheat, and soybeans are all breaking out, he takes the cleanest setup. Layering correlated bets is just leveraging your risk to a single macroeconomic variable.
Patience and Discipline
The lived experience of a trend follower is 80% boredom and 20% terror. Brandt’s commitment to patience and discipline means he spends weeks sitting on his hands, doing absolutely nothing.
The Execution Gap
- High-Probability Setups: He lets the pitch come to him. If a triangle doesn’t have clean, definitive touches on the boundary, he ignores it. The behavioral urge to force a trade because you haven’t made a dollar in a month is the number one destroyer of retail capital.
- Immutable Rules: When you run a systematic or semi-systematic process, tinkering is fatal. Brandt builds his rules during periods of calm and executes them without negotiation during periods of stress.
- Absorbing the Losses: Taking a 1% loss requires emotional control. Taking five in a row requires a hardened psychological framework that understands drawdowns are just the cost of doing business.
Long-Term Focus
While the finance media fixates on daily movements, Brandt operates on weekly and monthly charts. He is hunting the fat tails—the massive, asymmetric moves that define a decade of returns.
Capturing the Fat Tails
- Trend Following: He cuts his losers instantly but gives his winners massive room to breathe. The tracking error pain of holding a trend follower is real; you watch paper profits evaporate on pullbacks. But that’s the premium you pay to catch a 300% move.
- Ignoring the Noise: By stepping away from the daily intraday chop, he saves thousands of dollars in slippage, bid-ask spread crossing, and tax drag inside non-registered accounts.
- Alignment with Market Cycles: Commodities trend for years based on structural supply deficits. Brandt uses long-term charts to ensure he is catching the macro cycle, not just a three-day short squeeze.
Continuous Learning and Adaptation
I love that a guy who trades patterns from the 1930s is still willing to adapt to the realities of a digitized, algorithmic market. It shows that sovereign investing isn’t about being stubborn; it’s about being robust.
The Iterative Process
- Market Evolution: Institutional algos have changed how breakouts behave. False breakouts are more common now. Brandt has adapted by waiting for deeper confirmation or adjusting his sizing to account for increased noise.
- Ego Removal: If the market proves his thesis wrong, he doesn’t write an essay defending his position. He takes the loss and updates his priors.
- Trade Autopsies: The best data you will ever generate is your own trading journal. Reviewing the execution gap between your plan and your actual live trades is where the real alpha is found.
The Role of Technical Analysis in Brandt’s Approach
Technical analysis isn’t magic, and it certainly isn’t predictive. For Brandt, it is purely an organizational framework. It is a way to structure risk. By looking at price action, he is looking at the actual clearing price of global capital. He doesn’t care what a crop report says; he cares what the market is willing to pay after the crop report is published. Price is the ultimate arbiter of truth.
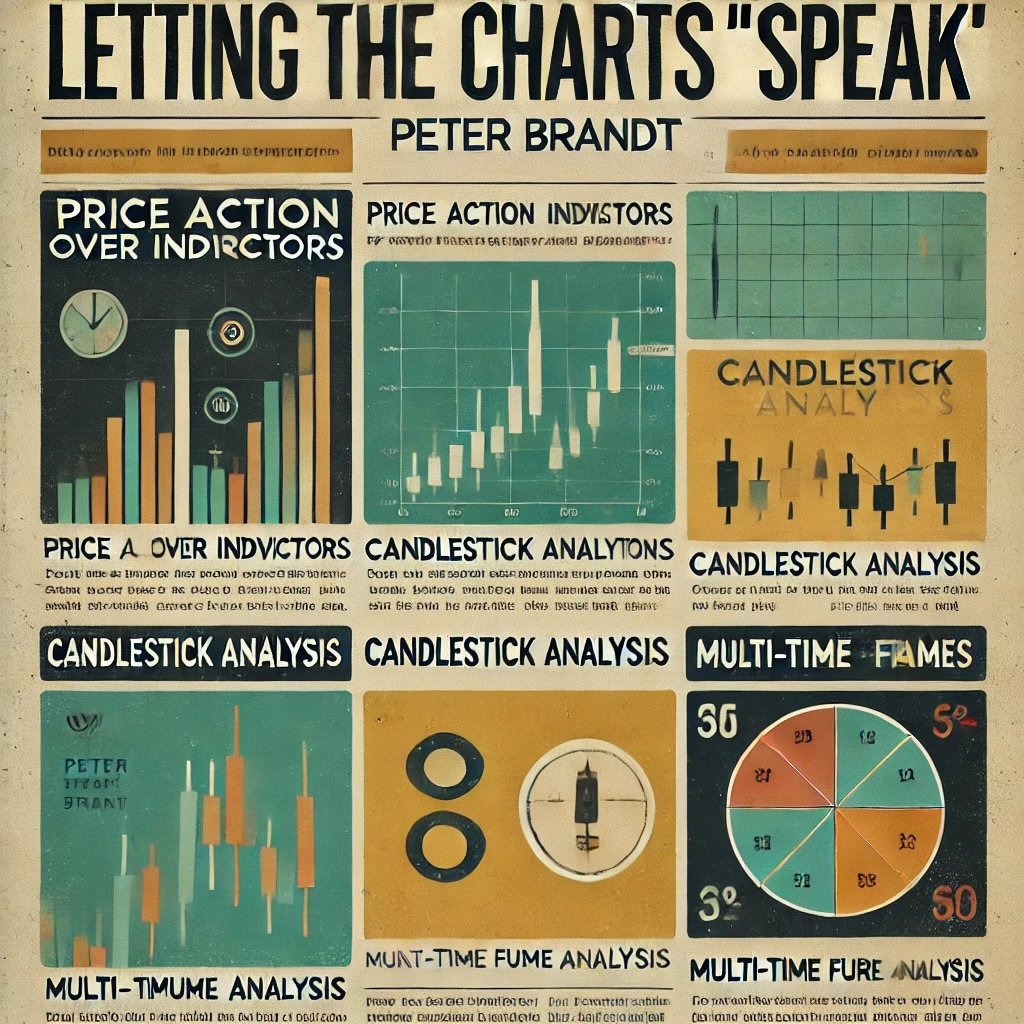
Letting the Charts “Speak”
When Brandt talks about listening to the charts, he means removing your own fundamental biases and letting the market’s liquidity profile dictate your actions. If a market doesn’t sell off on terrible news, that tells you more than any indicator ever could.
Price Action Over Derivative Indicators
- Naked Charts: A moving average is just a delayed derivative of price. An RSI is a derivative of price momentum. Brandt goes straight to the source. The raw OHLC (Open, High, Low, Close) bars contain all the necessary data to define risk.
- Candlestick Architecture: A daily close near the highs after a severe morning sell-off (a hammer) tells you exactly how institutions are positioning themselves going into the closing bell. It’s real-time behavioral data.
- Multi-Timeframe Context: A breakout on a daily chart means nothing if it’s slamming straight into a massive resistance level on the monthly chart. Brandt aligns his timeframes to ensure he isn’t swimming against the macroeconomic tide.
The Geometry of Liquidity
- Where Are the Stops?: Brandt looks at a chart and asks, “Where is the trapped capital?” A head and shoulders pattern works because beneath the neckline is a massive cluster of stop-loss orders. When those trigger, the selling becomes forced, losing momentum rapidly on the bid side and creating a vacuum in price.
- Emotional Extremes: The parabolic blow-off top isn’t a mathematical formula; it’s the visual footprint of FOMO. It’s retail capital capitulating and buying at the exact moment the smart money is distributing shares.
- Execution Reality: By waiting for definitive closes outside of structural boundaries, he avoids the intra-day whipsaws designed by market makers to hunt liquidity.
Understanding Market Psychology Through Charts
A chart is simply a two-dimensional plot of human fear and greed. That’s it.
The Behavioral Engine
- Repetitive Mistakes: Human nature doesn’t change. The same panic that drove the silver crash in the 1980s drives a crypto flash crash today. Recognizing the visual shape of that panic is Brandt’s edge.
- Contrarian Exhaustion: When price hits a multi-year low and simply stops going down despite terrible news, it means the last seller has sold. That divergence between bad news and flat price action is a massive behavioral tell.
The Walls of Liquidity
- Support and Resistance Reality: These aren’t precise-to-the-penny laser lines; they are zones of liquidity. If price hits a zone and aggressively bounces, it means massive passive bid orders are sitting there absorbing all the selling volume.
- The Memory of Capital: Traders remember where they lost money. A previous all-time high acts as resistance because trapped longs who rode the drawdown all the way to the bottom are desperate to sell at breakeven the moment price returns to their entry.
- Volume as Truth Serum: A breakout on low volume is highly suspect. A breakout on 3x average daily volume means institutional capital is actively re-pricing the asset.

Simplicity Over Complexity
If complex math generated guaranteed alpha, the quants at Long-Term Capital Management wouldn’t have blown up the financial system in 1998.
The Danger of Overfitting
- Curve-Fitting Fallacy: If you add enough indicators, you can justify any trade. Brandt’s raw simplicity prevents him from curve-fitting his analysis to match his internal bias.
- Speed of Execution: When a market crashes, liquidity dries up instantly. If you have to wait for an algorithm to process 40 variables, you will get slipped. A clean chart provides instantaneous yes/no binary decisions.
The Lindy Effect of Patterns
- A Century of Proof: Edwards and Magee wrote the bible on chart patterns in 1948. The fact that an ascending triangle still works today proves that the underlying human mechanics haven’t changed.
- Cross-Asset Application: Because the charts track human emotion, a descending triangle on a soybean chart looks exactly like a descending triangle on an S&P 500 ETF chart.
Flexibility and Adaptation
Rigid rules for risk, flexible rules for asset selection. That’s the balance.
The Expanded Canvas
- Regime Filters: You don’t trade mean-reversion setups in a highly trending market. Brandt adjusts his playbook based on the current volatility regime.
- Agnostic Allocation: He doesn’t care what the asset is. If cryptocurrencies like Bitcoin are printing beautiful classical bases, he will trade them with the exact same mechanics he uses for feeder cattle.
Updating the Ledger
- Structural Shifts: He respects that central bank interventions can artificially suppress volatility, altering how patterns resolve.
- The Discipline of the Void: Sometimes the charts say absolutely nothing. The flexibility to sit in cash yielding 5% and wait is an incredibly underrated strategy. Too many retail investors feel they have to have exposure every single day.
Practical Application
Here is the mechanical sequence of a Brandt trade. Notice how much math happens before the entry order is even placed.
The Assembly Line
- The Scan: He looks at weekly and daily charts across dozens of uncorrelated assets, hunting for multi-month geometrical boundaries.
- The Invalidation Trigger: Before he calculates profit, he finds the exact price level where the structural premise fails. If that level is too far away, the risk is too high, and he passes on the trade.
- The Math: He measures the distance from entry to the invalidation level. If his account size allows for a 1% risk, he sizes the position exactly to that distance. No exceptions. This requires knowing your futures contract multipliers intimately.
- The Execution: He places the trade on the breakout confirmation and immediately enters the hard stop-loss into the market. From there, the market dictates the outcome.
Expectancy Mechanics
- Measured Moves: If a base is $10 deep, the projected target upon breakout is roughly $10 above the boundary. He uses these measured moves to ensure the risk-to-reward ratio is highly asymmetrical.
- Trailing the Risk: As the trend develops, he rolls the stop-loss up beneath new structural swing lows, methodically locking in capital while leaving the upside uncapped.
Notable Trades and Market Calls
You can read about geometry all day, but seeing it applied in real-time, under the stress of live fire, is where the lessons solidify. Brandt’s history isn’t a flawless string of victories; it’s a ledger of calculated, asymmetrical bets where the winners vastly outpaced the strictly controlled losers. Let’s look at the mechanics of his biggest hits.
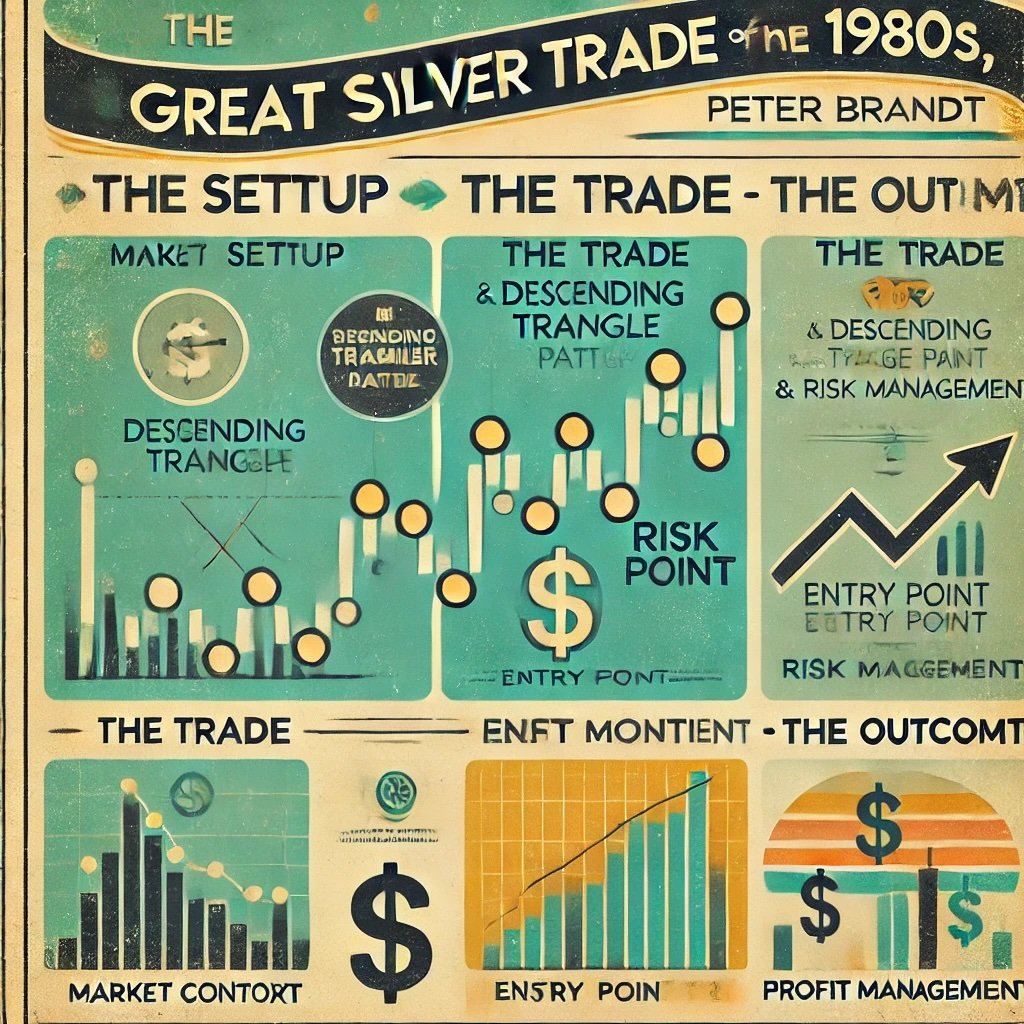
The Great Silver Trade of the 1980s
The 1980s silver market was a bloodbath of volatility. Following the Hunt Brothers’ squeeze, the price action was erratic and dangerous. What I found interesting is that while the broader market was hunting for fundamental drivers, Brandt anchored strictly to the weekly charts where the structural reality of the auction was undeniable.
The Architecture of the Setup
- The Grind: The massive post-crash volatility eventually compressed. The weekly chart began printing lower highs while the floor remained completely flat.
- The Squeeze: This is the textbook definition of a descending triangle. Buyers are stepping in at the exact same price, but sellers are getting more aggressive, pushing the highs lower and lower. It’s a coiled spring of distribution.
Execution Friction
- The Trigger: He didn’t short the rallies inside the triangle. He waited for the physical floor to break, entering the short when the last tier of buyers finally stepped away and the trap door opened.
- The Shield: He placed the stop above the most recent lower high. If price reclaimed that high, the bearish thesis was void. It’s binary.
The Lived Reality
- The Washout: Silver violently liquidated through the floor. Once support breaks on a multi-year timeframe, there is an absolute void of bids below it.
- The Exit: He didn’t ride it to zero. He covered the short at a massive historical support zone, realizing the outsized R-multiple.
The Hard Lesson
Taking a trade on a weekly chart requires immense patience. You might watch a descending triangle build for 18 months. The behavioral temptation is to anticipate the break and enter early. If you do that, a false spike will stop you out right before the real move happens. This is where execution becomes a lesson in tracking error tolerance.
Anticipating the 2011 Euro Collapse
During the European sovereign debt crisis, the macro narrative was dominating the headlines. Brandt tuned it out and looked at the geometry. To my eyes, the primary source of truth during this period wasn’t the shifting rhetoric out of Brussels, but the structural exhaustion printed directly on the daily bars.
The Architecture of the Setup
- The Distribution: The EUR/USD daily chart carved out a massive head and shoulders pattern. The failure of the right shoulder to reach the highs of the head proved that institutional capital was offloading into the rallies.
- The Floor: The neckline was the only thing holding up the currency.
Execution Friction
- The Trigger: He initiated the short specifically on the confirmed break of the neckline.
- The Shield: Stops went right above the right shoulder. The beauty of this pattern is that the risk is tightly defined while the target is a massive measured move downward.
The Lived Reality
- The Cascade: The euro broke support and suffered a brutal multi-month drawdown against the dollar.
- The Exit: He scaled out at historical technical support, avoiding the inevitable violent mean-reversion bounce.
The Hard Lesson
When macro news aligns with a classical breakdown, the moves are incredibly fast. The bid-ask spread on a major currency pair might be tight, but if you hesitate on the neckline break, the momentum will leave you behind. That sounds great until you actually have to execute it with large size and watch the execution slippage decay your theoretical entry price.
Riding the Bitcoin Bull Run
Brandt’s pivot to crypto in the late 2010s proved that his framework is entirely asset-agnostic. Math is math. Whether you are running an expanded canvas portfolio or trading global macro futures, human behavior behaves identically across auction environments.
The Architecture of the Setup
- The Frenzy: Late 2017 saw retail capitulation into Bitcoin, driving it near $20,000. Brandt identified the exact visual structure of a parabolic advance.
- The Gravity: Parabolic curves violate linear geometry. They are the visual footprint of a mania. When a parabola breaks its trendline, the resulting crash is usually an 80% drawdown.
Execution Friction
- The Warning: Instead of getting sucked into the “new paradigm” narrative, Brandt warned that a violation of the parabolic curve would result in a devastating bear market.
- The Discipline: He demanded clear structural bases before re-allocating capital to the long side.
The Lived Reality
- The Winter: Bitcoin collapsed exactly as the geometry predicted, grinding through a brutal multi-year winter before forming the bases necessary for the next run.
- The Clarity: Traders who understood parabolic exhaustion preserved their capital while the tourists were wiped out.
The Hard Lesson
It is agonizing to sit on the sidelines and watch an asset go parabolic while your friends brag about paper wealth. But preserving your capital so you have powder dry for the eventual 80% discount is how adapt his methods to emerging markets generational wealth is actually built. This is where things get uncomfortable: the behavioral tax of being an island of sanity during a mania is heavier than any fee drag.
Navigating the Commodity Supercycle
Brandt has successfully traded various commodities by staying strictly on the weekly and monthly charts.
The Architecture
- The Zoom Out: By ignoring the daily noise, he avoids the algorithmic chop that shreds smaller accounts.
- The Structural Trends: He rides the massive multi-year moves driven by actual physical supply shortages, not just paper contracts.
The Execution Reality
- Softs and Grains: Catching the breakouts in corn and wheat when the multi-year bases finally fracture.
- Hard Assets: Stacking returns in gold and copper by identifying key chart continuations like massive symmetrical triangles.
The Hard Lesson
Holding a commodity contract for two years means rolling futures contracts, managing margin requirements, and absorbing violent 15% pullbacks without flinching. It requires reinforcing the value of patience and a broader perspective that is brutally difficult to execute in real life. Most people simply tap out of the trade too early to avoid the margin pain. To my eyes, the structural trade-off means accepting that the baseline futures contract rolls expose you to structural friction that a typical buy-and-hold equity indexer simply never conceptualizes.
Key Mechanical Takeaways
When you evaluate performance during major macro regime changes, classical charting strategies reveal deep diversification traits. To see how these tactical mechanics interact with traditional configurations during historic crises, consider how the asset class profiles stack up under stress:
| Macro Stress Period | Classical Trend Geometry Role | Traditional Portfolio Behavior (60/40 Baseline) | Primary Performance Driver |
|---|---|---|---|
| 1970s Stagflation | Captures structural upward runs in real assets (Grains, Gold, Crude). | Suffer prolonged real drawdowns due to rising discount rates killing stocks and bonds. | Asymmetric breakout capture in physical commodity contract wicks. |
| 2008 Financial Crisis | Catches systemic liquidity flows down into massive visual currency/bond extensions. | Suffers extreme correlation convergence on growth assets. | Hard short validations during structural neckline breakdowns. |
| 2022 Inflationary Rate Shock | Exploits massive macro extensions in short fixed-income trends and exploding energy bases. | Undergoes concurrent dual drawdowns as equity risk premiums and bond yields invert. | Trailing stop-loss execution on historical multi-touch channels. |
- Geometry is Agnostic: A daily head and shoulders in crypto trades the exact same way as one in soybeans. Stop looking for asset-specific magic.
- The Execution Gap: Identifying a pattern is worth zero dollars. Executing the entry, placing the hard stop, and letting it run without tinkering is where the alpha is generated.
- The Cost of the Edge: You will endure dozens of tiny paper cuts from false breakouts. If you can’t stomach a 1% loss, you cannot run this system.
- Defensive Sizing: You never know which breakout is going to be the multi-year home run. By keeping risk identical across all trades, you ensure you are mathematically alive to catch the fat tail.
Risk Management and Psychological Discipline in Trading
If you don’t nail this section, the chart patterns will just bankrupt you slightly slower. Trading is fundamentally an exercise in risk transfer. When you take a position, you are absorbing risk from someone else. If your capital defense is weak, the market will systematically disassemble your portfolio. I look at Brandt’s methods the same way I look at capital efficiency: it’s all about surviving the drawdown so the compounding math has time to work.
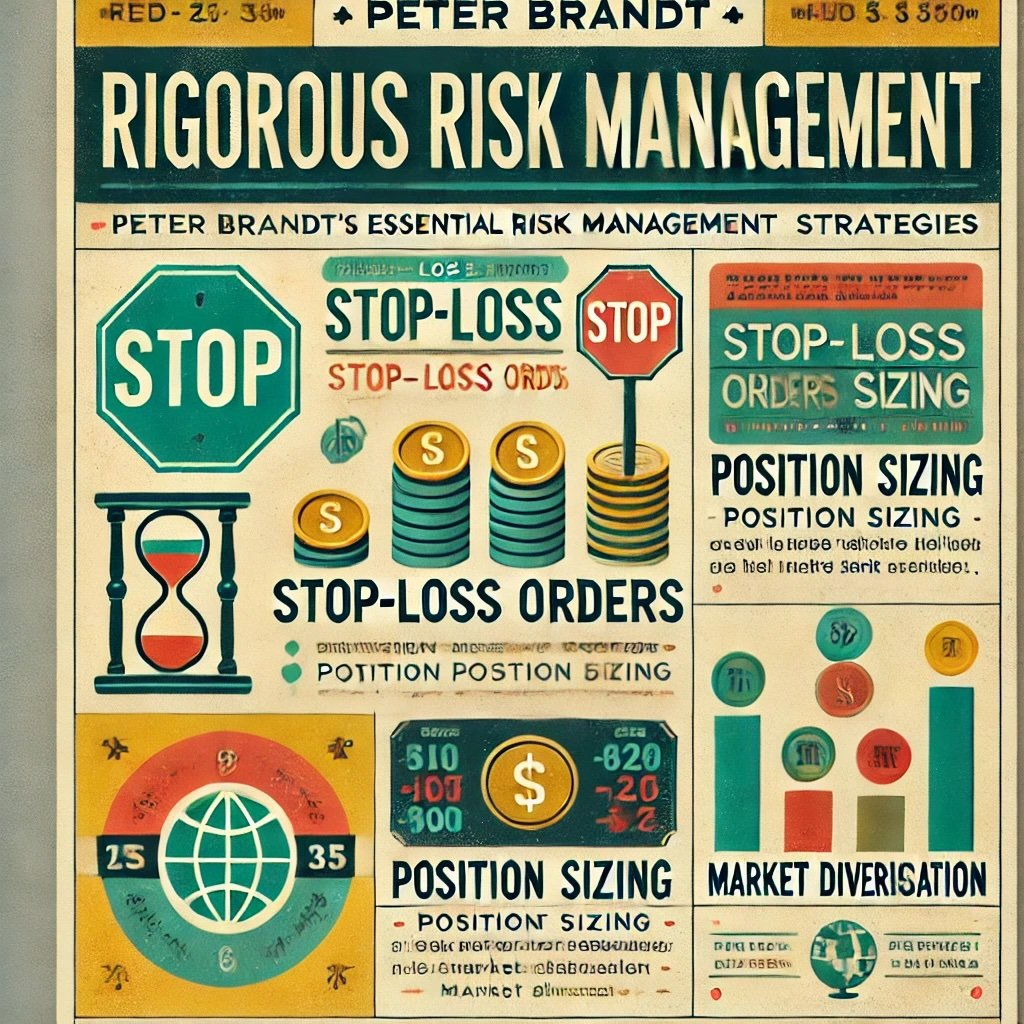
Rigorous Risk Management
Brandt treats his capital like inventory. You cannot operate a business if your inventory is wiped out. His risk management strategies are absolute, binary rules. There is no “let’s wait and see if it bounces.”
The Architecture of the Stop-Loss
- The Hard Limit: A mental stop is a lie you tell yourself. Brandt uses hard, market-entered stop-loss orders. If the asset hits the invalidation point, he is extracted automatically. The psychological relief of knowing your maximum downside before you enter is immense.
- Structural Placement: He doesn’t use arbitrary 5% or 8% trailing stops. He places the stop just past the geometric boundary. If a support line breaks, the premise is dead. Getting out at that exact moment preserves capital for the next rotation.
- The Profit Lock: As a trend extends into a fat tail, he trails the stop up behind significant swing lows. This guarantees that a massive winner doesn’t turn into a scratch trade during a violent mean reversion.
The Math of Position Sizing
- The 1% Rule: If you risk 10% of your account on a trade, a string of five losers cuts your equity in half. At 1% risk, a string of five losers is a bad Tuesday. It’s entirely recoverable.
- Volatility Scaling: If a stop loss requires a 10% price drop to reach structural invalidation, the position size must be heavily reduced so that the 10% drop only equals 1% of total equity. This mathematically forces you to trade smaller in volatile markets, often utilizing Average True Range (ATR) to measure current volatility.
- Leverage Friction: Futures are highly leveraged. A 3% move in the underlying commodity can wipe out your margin. Calculating exact position size based on contract multipliers is non-negotiable. If you don’t understand point values in futures, you have no business putting on the trade.
The Defense of Diversification
- Correlation Traps: If you buy a breakout in Gold, Silver, and Platinum simultaneously, you haven’t taken three trades; you’ve taken one massive trade on the US Dollar. Brandt avoids correlated exposure.
- Capital Allocation: By scanning multiple asset classes, he ensures his risk is distributed across uncorrelated macroeconomic drivers.
- The Patience Filter: If five correlated setups trigger at once, he only takes the absolute cleanest chart, preserving his risk capital for unrelated markets.
Psychological Challenges and Discipline
This is where the lived experience of trading gets ugly. The math is simple; executing the math is a nightmare. Taking a 1% loss stings. Taking your fourth 1% loss in a single month tests every behavioral bias you have.
The Emotional Tax
- The Fear/Greed Axis: A strict plan removes the requirement to make decisions under stress. When a position gaps down against you, panic makes you freeze. The hard stop eliminates the panic.
- The Detachment Protocol: Once the trade is live and the stop is set, tinkering is strictly forbidden. Moving a stop further away because you “believe” in the asset is the fastest route to a margin call.
- Accepting the Randomness: Brandt knows that any single trade’s outcome is random. He doesn’t tie his ego to a ticker. A loss is simply a business expense, not a personal failure.
The Execution Routine
- The Checklist: Pilots don’t fly on vibes, and traders shouldn’t allocate capital on hunches. If a setup doesn’t check every single structural box, it gets passed over.
- The Journal: You cannot fix a leak if you don’t track your data. Documenting every entry, exit, and emotional state during the trade is how you isolate your own behavioral flaws.
- The Friction of Waiting: The hardest discipline is doing nothing. Sitting in cash for three weeks while waiting for a weekly chart to close requires immense fortitude. Cash drag is a real cost, but it’s cheaper than forcing bad trades.
Surviving the Volatility
- The Stoic Response: When a flash crash triggers your stop, resulting in severe slippage, the amateur rage-trades to win the money back. The professional logs the loss, shuts down the terminal, and goes for a walk.
- The FOMO Defense: Seeing a chart explode 20% without you is painful. Chasing it is fatal. If you miss the entry, the trade is gone. Period.
- The Drawdown Reality: Every system has a drawdown. Abandoning a proven structural framework simply because it is going through an expected period of underperformance is how you guarantee permanent capital loss.
Balancing Risk and Reward
You cannot survive if you risk $1 to make $1 in a system that only wins 30-40% of the time.
The Asymmetry Metric
- The 3:1 Minimum: Brandt wants setups where the measured historical move offers at least three times the distance to his stop loss. When you hit a 3R trade, it pays for three future losers.
- The Fat Pitch: He ignores 1R and 2R setups. They don’t provide enough mathematical cushion to justify the execution friction and bid-ask spread.
The Probability Filter
- Structural Integrity: He demands clear, multi-touch boundaries. A messy chart implies conflicting liquidity, dropping the probability of a clean breakout.
- Capital Preservation First: If the stop loss requires too much width to be safe from noise, he skips the trade, regardless of how bullish the pattern looks.
Techniques for Long-Term Resilience
- The Empirical Loop: Markets evolve. Central banks change the rules. You must continuously review your journal to see if a specific pattern is suffering from a structural regime change.
- The Physical Toll: Staring at screens creates cortisol. Managing risk requires a clear head. The best risk management tool is a good night’s sleep.
- The Feedback Mechanism: Isolating yourself leads to echo chambers. Engaging with other systematic traders helps you spot your own behavioral biases.
Implementing Brandt’s Risk Management
From a multi-asset portfolio architecture framework, parsing how alternative managed futures sleeves behave under live-fire constraints highlights several structural trade-offs for DIY allocation planning:
- Calculate Your Ruin: Define exactly what a 1% loss equals in dollar terms for your specific account size. Never exceed it.
- Automate the Exit: Hard stops go into the broker immediately upon entry.
- Volatility Adjustments: Shrink your position size when the VIX spikes or average true range (ATR) expands.
- Kill the Correlated Bets: Check your exposures. If you are long five different tech stocks, you just have one massive NASDAQ bet.
- Embrace the Boredom: Trading should be boring. If your heart rate is elevated, your position size is too big.
Building a Chart-Based Trading Strategy Inspired by Peter Brandt
It’s one thing to read about geometry; it’s another to actually deploy it across your own capital base. If you are running an expanded canvas or building out a tactical sleeve, you need a highly rigid, mechanical framework. Let’s build a step-by-step implementation guide that focuses on the lived reality of executing these setups, including the friction, the slippage, and the psychological weight.
Entropy-driven models fail when discipline fractures.
Step 1: Master Classical Charting Techniques
You cannot trade what you cannot instantly recognize. You need to build a visual database in your brain.
The Empirical Foundation
- The Textbooks: Start with Edwards and Magee’s “Technical Analysis of Stock Trends”. It is dense, old, and completely vital. It strips away modern indicator noise.
- The Visual Ledger: Don’t just watch videos. Pull up historical charts and manually draw the boundaries on past crashes and bull runs. Feel the geometry.
The Repetition Matrix
- The 10,000 Hour Rule: Spend hours scrubbing through daily and weekly charts across equities, commodities, and FX. You must train your eye to spot a multi-year base instantly.
- The Failure Database: Don’t just save the winners. Build a folder of perfect setups that violently failed. Study the invalidation points so you know what a bull trap looks like.
- The Feedback Loop: Review your manual drawings against market outcomes. Were your boundaries too tight? Too loose?
Step 2: Simplify Your Chart Setup
Strip the terminal down to the studs. Complexity is the enemy of execution.
The Clean Terminal
- Naked Price Action: Delete the RSI. Delete the MACD. Delete the moving averages. If you cannot see the trend with raw OHLC bars, the trend isn’t there.
- The Candlestick Reality: Use candlesticks to read the daily auction. A long upper wick tells you exactly where institutional supply overwhelmed retail demand.
- The Timeframe Anchor: align with your trading style by locking into the Daily and Weekly views. Intraday charts are filled with algorithmic noise designed to hunt your stops.
Step 3: Develop a Detailed Trading Plan
A plan isn’t a vague idea; it is a written, immutable contract with yourself. One common mistake investors make with this strategy is failing to define their operational boundaries beforehand, which converts systematic trend execution into emotional discretion.
The Mechanical Blueprint
- The Binary Entry: Define the exact trigger. “I will only buy if the daily candle closes above the upper boundary of a 6-month descending triangle, accompanied by 2x average volume.”
- The Hard Exit: Write down the exact rule for stop-loss placement and the rule for trailing that stop as the trade moves into profit.
- The Sizing Algorithm: Lock in your risk percentage (e.g., 1%). Build a spreadsheet that calculates share size based on the distance from entry to stop.
- The Universe: Define exactly what assets you are allowed to trade. If a random penny stock isn’t in your defined universe, you cannot trade its breakout. Furthermore, verify broker access—retail investors in Canada, for instance, might have restricted access to certain US futures markets or face steep currency conversion friction.
Step 4: Implement Rigorous Risk Management
This is your survival mechanism. Treat it with absolute reverence. To my eyes, the real question is whether you can emotionally tolerate the sequence-of-returns risk during extended consolidation phases when the market produces dozens of consecutive false breakouts.
The Capital Shield
- The Immutable 1%: Never override your sizing rule because you have a “good feeling.” Good feelings lead to margin calls.
- The Broker Protocol: The stop-loss order must hit the exchange server the exact second your entry order fills.
- The Math of Ruin: Always know your maximum portfolio heat. If you have five trades open, your maximum risk should not exceed 5% to 6% of your total equity.
Step 5: Cultivate Patience and Discipline
This is where the lived experience breaks people. Waiting is agonizing. Here is where the implementation gets uncomfortable: sitting in cash yielding 5% feels secure until a structural macro trend runs away without you because you missed the clean visual entry confirmation by an hour.
The Psychological Framework
- The Trigger Awareness: Recognize the physical sensation of FOMO. When your chest tightens because a chart is running without you, close the laptop.
- The Daily Grind: Build a checklist that you execute at the same time every day. Review charts, update stops, log off. Do not stare at the flickering ticks.
- The Accountability Ledger: Your trading journal must track your emotional state. “Took this trade out of boredom” is a valid, though painful, entry that will save you money later.
Step 6: Utilize Technical Analysis to Understand Market Psychology
Read the tape as a ledger of human suffering and euphoria.
The Behavioral Read
- The Walls of Pain: Support and resistance are zones where people are trapped. When price approaches a zone, watch how it reacts. A slow grind into resistance is bullish; a violent spike into resistance is usually a trap.
- The Liquidity Tell: Volume Analysis is your lie detector. A breakout on anemic volume means the big money didn’t participate. Ignore it.
- The News Divergence: If awful industry news hits the wire and the chart refuses to break support, the market is severely under-positioned. That’s a massive tell.
Step 7: Continuously Learn and Adapt
Markets are dynamic state machines. You must adapt to shifting liquidity regimes. That sounds great until you actually have to hold it through a five-year choppy environment where algorithmic dominance compresses the duration of clean trends.
The Iterative Grind
- The Macro Overlay: You don’t need to trade the news, but you must know the regime. A breakout in a high-interest-rate environment behaves differently than one in a zero-interest-rate environment.
- The Network: Find traders who are ruthlessly systematic. Avoid the hype channels.
- The Brutal Review: Every month, audit your trades. Did you follow the plan? Did slippage eat your expected key metrics? Be honest with your data.
Step 8: Test Your Strategy
Do not fund this engine until you have tested it in the simulator.
The Crucible
- The Sandbox: Paper trade for three months. It won’t replicate the emotional pain of real money, but it will expose the mechanical flaws in your routine.
- The Historical Audit: Manually backtest the geometry on historical charts. How did the strategy perform during the 2008 crash? The 2020 Covid spike?
- The Expectancy Math: Calculate your win rate and your average win-to-loss ratio. If the math yields a negative expectancy, do not deploy capital.
Tips for Identifying Trades and Analyzing Patterns
- The Sniper Approach: Only trade patterns that are visually obvious. If you have to squint to see the triangle, it’s not a triangle.
- The Proof: Always wait for the daily close. Intraday spikes are traps. Let the daily candle prove the breakout is real.
- The Top-Down Alignment: If the weekly chart is in a massive downtrend, do not buy a daily breakout. Trade with the dominant macro current.
Adapting Your Strategy Over Time
- The Data Ledger: Keep meticulous tracking of your R-multiples. Your equity curve will tell you exactly when your edge is decaying.
- The Volatility Switch: When the VIX drops below 12, breakouts fail constantly. You must adapt your expectations and perhaps tighten your trailing stops during low-volatility regimes.
- The Open Mind: If the market geometry fundamentally changes due to algorithmic dominance, you must be willing to rewrite your rulebook.
| Strategy / Concept | What It Promises | Implementation Friction | The Sponge Verdict (Absorb or Expel?) |
|---|---|---|---|
| Classical Chart Patterns (Daily/Weekly) | Visual representation of supply/demand imbalances. High probability setups catching massive fat-tail trends. | You sit in cash for months waiting for a clean base, suffering cash drag. High frequency of false breakouts causing repeated 1% paper cuts. | Absorb. If you can survive the boredom and ignore the intraday noise, weekly geometry is one of the few pure reads on global liquidity. |
| Futures Contract Leverage | Maximum capital efficiency. You can control massive notional commodity exposure with a fraction of your portfolio equity. | Complex margin maintenance, rolling contracts (contango drag), and tax complexity (Section 1256 K-1s in the US). Retail broker access can be clunky. | Proceed with extreme caution. If you don’t know what a contract multiplier or backwardation is, stick to ETFs. If you do, the capital efficiency is unmatched. |
| Hard Stop-Loss Execution | Absolute mathematical protection against ruin. Caps losses at an exact predetermined basis point of portfolio equity. | Slippage during flash crashes. The psychological pain of being stopped out on a wick right before the market reverses in your direction. | Mandatory Absorb. Mental stops are lies. If the stop isn’t residing on your broker’s server, you don’t have a stop. |
| The 30-40% Win Rate Reality | Positive expectancy over thousands of trades driven purely by asymmetrical R-multiples (winners are 3x to 10x larger than losers). | Requires you to emotionally accept being wrong 6 or 7 times out of 10. Most retail investors quit during a drawdown before the fat tail arrives. | Absorb. The retail obsession with win-rate is fatal. Focus on the size of the win, not the frequency. |
Peter Brandt FAQ: Classical Charting, Risk, and Discipline (12 Expert Q&As)
Who is Peter Brandt and why do traders study him?
Peter Brandt is a veteran commodities and FX trader with 40+ years of experience, known for his minimalist, classical charting approach and strict risk management. His book Diary of a Professional Commodity Trader made his process transparent and repeatable for independent traders tired of the noise.
What does “classical charting” mean in Brandt’s framework?
It’s the Edwards & Magee school: price-only charts, clean patterns (head and shoulders, triangles, rectangles, double tops/bottoms, flags/pennants), measured moves, and breakout/throwback logic—no indicator soup. The chart tells the story; everything else is distraction.
Which patterns does he prioritize?
Well-formed, multi-touch patterns with clear boundaries: head & shoulders (reversals), triangles/rectangles (continuations or reversals), and flags/pennants (brief pauses within strong trends). He prefers patterns on daily/weekly charts with obvious “failure points.”
How does Brandt define entries and confirmations?
He enters on confirmed breakouts: a decisive close beyond the boundary or a breakout plus a retest (throwback/pullback). No anticipatory guessing; the market must tip its hand and commit first.
Where do stops go in a Brandt-style trade?
Stops live where the pattern is structurally invalidated—just beyond the opposite boundary/neckline or beyond the previous swing that defines the setup. If price hits that level, the premise is dead, so he’s out—no negotiation, no hoping.
How much should you risk per trade?
Keep risk defensively small and consistent (often ~1%–2% of equity per idea). Position size is mathematically derived from entry-to-stop distance: larger patterns with wide stops require smaller position sizes to keep the dollar risk static.
What is his philosophy on letting winners run?
Fat-tail trends do the heavy lifting. Use measured-move objectives (height of pattern projected from breakout) and/or trailing stops beneath structural swing lows. Scale out only if it improves expectancy; otherwise, ride the trend until the market mathematically takes you out.
How does he handle failed patterns and drawdowns?
Failed patterns are just behavioral data. Take the stop quickly, record the friction in your journal, and move on. During drawdowns, he reduces risk, tightens his visual criteria, and avoids revenge-trading—it’s mechanics over drama.
Which markets and timeframes fit best?
Any liquid, technically expressive market: commodities, FX, index futures, and even crypto. Primary analysis is strictly daily and weekly; intraday noise is actively avoided unless it refines execution on an already-valid macro setup.
What tools does he actually use?
Clean bar/candlestick charts, trendlines, horizontal levels, and volume (optional). A written, immutable trading plan, a strict position-sizing calculator, and a meticulous trade journal are infinitely more valuable than any exotic algorithmic indicator.
What are common mistakes Brandt would warn against?
Anticipating breakouts before the close, crowding charts with lagging indicators, widening stops because you ‘believe’, oversizing positions out of FOMO, trading too many correlated instruments at once, and abandoning the process after a cold streak.
How can a newcomer start “Brandt-style” this week?
Create a ruthless checklist: (1) Is the pattern classical and visually obvious? (2) Where is the absolute invalidation point? (3) What’s the measured move target? (4) Risk per trade ≤ a fixed %; calculate size from stop distance. (5) Enter only on confirmation. (6) Log the pain and the outcome.
Concluding Thoughts on Brandt’s Approach
To my eyes, Peter Brandt’s mechanics are the ultimate antidote to the hyper-financialized noise we deal with daily. His survival proves that simple geometry, paired with a psychopathic dedication to risk management, works across any market regime. Building an expanded canvas portfolio doesn’t mean you need to be a quant; it just means you need to respect the math of drawdowns and the behavioral reality of the auction.
Encouragement to Experiment
Trading is a localized, personal experience. While downloading Brandt’s framework is a fantastic starting point, the real edge comes when you bolt his defensive mechanics onto your own unique behavioral temperament. Long-term rolling performance windows demonstrate that systematic adherence to trend rules preserves nominal purchasing power when classical multi-asset portfolios are undergoing high correlation drawdowns.
- The Sandbox: Start with paper or micro-contracts. The bid-ask spread will teach you lessons theory cannot.
- The Grind: Give the math time to work. A 30% to 40% win-rate system feels awful in the short term but protects capital in the long term.
- The Reality Check: If the friction is too high, step back. The goal is capital efficiency, not adrenaline.
Ready to strip the noise out of your terminal? The classical geometry is sitting right there on the weekly charts. If you can handle the boredom of waiting and the sting of the 1% loss, the fat tails are waiting for you.
Protect the capital.
Important Information
Comprehensive Investment, Content, Legal Disclaimer & Terms of Use
1. Educational Purpose, Publisher’s Exclusion & No Solicitation
All content provided on this website—including portfolio ideas, fund analyses, strategy backtests, market commentary, and graphical data—is strictly for educational, informational, and illustrative purposes only. The information does not constitute financial, investment, tax, accounting, or legal advice. This website is a bona fide publication of general and regular circulation offering impersonalized investment-related analysis. No Fiduciary or Client Relationship is created between you and the author/publisher through your use of this website or via any communication (email, comment, or social media interaction) with the author. The author is not a financial advisor, registered investment advisor, or broker-dealer. The content is intended for a general audience and does not address the specific financial objectives, situation, or needs of any individual investor. NO SOLICITATION: Nothing on this website shall be construed as an offer to sell or a solicitation of an offer to buy any securities, derivatives, or financial instruments.
2. Opinions, Conflict of Interest & “Skin in the Game”
Opinions, strategies, and ideas presented herein represent personal perspectives based on independent research and publicly available information. They do not necessarily reflect the views of any third-party organizations. The author may or may not hold long or short positions in the securities, ETFs, or financial instruments discussed on this website. These positions may change at any time without notice. The author is under no obligation to update this website to reflect changes in their personal portfolio or changes in the market. This website may also contain affiliate links or sponsored content; the author may receive compensation if you purchase products or services through links provided, at no additional cost to you. Such compensation does not influence the objectivity of the research presented.
3. Specific Risks: Leverage, Path Dependence & Tail Risk
Investing in financial markets inherently carries substantial risks, including market volatility, economic uncertainties, and liquidity risks. You must be fully aware that there is always the potential for partial or total loss of your principal investment. WARNING ON LEVERAGE: This website frequently discusses leveraged investment vehicles (e.g., 2x or 3x ETFs). The use of leverage significantly increases risk exposure. Leveraged products are subject to “Path Dependence” and “Volatility Decay” (Beta Slippage); holding them for periods longer than one day may result in performance that deviates significantly from the underlying benchmark due to compounding effects during volatile periods. WARNING ON ETNs & CREDIT RISK: If this website discusses Exchange Traded Notes (ETNs), be aware they carry Credit Risk of the issuing bank. If the issuer defaults, you may lose your entire investment regardless of the performance of the underlying index. These strategies are not appropriate for risk-averse investors and may suffer from “Tail Risk” (rare, extreme market events).
4. Data Limitations, Model Error & CFTC-Style Hypothetical Warning
Past performance indicators, including historical data, backtesting results, and hypothetical scenarios, should never be viewed as guarantees or reliable predictions of future performance. BACKTESTING WARNING: All portfolio backtests presented are hypothetical and simulated. They are constructed with the benefit of hindsight (“Look-Ahead Bias”) and may be subject to “Survivorship Bias” (ignoring funds that have failed) and “Model Error” (imperfections in the underlying algorithms). Hypothetical performance results have many inherent limitations. No representation is being made that any account will or is likely to achieve profits or losses similar to those shown. In fact, there are frequently sharp differences between hypothetical performance results and the actual results subsequently achieved by any particular trading program. “Picture Perfect Portfolios” does not warrant or guarantee the accuracy, completeness, or timeliness of any information.
5. Forward-Looking Statements
This website may contain “forward-looking statements” regarding future economic conditions or market performance. These statements are based on current expectations and assumptions that are subject to risks and uncertainties. Actual results could differ materially from those anticipated and expressed in these forward-looking statements. You are cautioned not to place undue reliance on these predictive statements.
6. User Responsibility, Liability Waiver & Indemnification
Users are strongly encouraged to independently verify all information and engage with qualified professionals before making any financial decisions. The responsibility for making informed investment decisions rests entirely with the individual. “Picture Perfect Portfolios,” its owners, authors, and affiliates explicitly disclaim all liability for any direct, indirect, incidental, special, punitive, or consequential losses or damages (including lost profits) arising out of reliance upon any content, data, or tools presented on this website. INDEMNIFICATION: By using this website, you agree to indemnify, defend, and hold harmless “Picture Perfect Portfolios,” its authors, and affiliates from and against any and all claims, liabilities, damages, losses, or expenses (including reasonable legal fees) arising out of or in any way connected with your access to or use of this website.
7. Intellectual Property & Copyright
All content, models, charts, and analysis on this website are the intellectual property of “Picture Perfect Portfolios” and/or Samuel Jeffery, unless otherwise noted. Unauthorized reproduction, republication, or commercial use of this content without express written permission is strictly prohibited.
8. Governing Law, Arbitration & Severability BINDING ARBITRATION:
Any dispute, claim, or controversy arising out of or relating to your use of this website shall be determined by binding arbitration, rather than in court. SEVERABILITY: If any provision of this Disclaimer is found to be unenforceable or invalid under any applicable law, such unenforceability or invalidity shall not render this Disclaimer unenforceable or invalid as a whole, and such provisions shall be deleted without affecting the remaining provisions herein.
9. Third-Party Links & Tools
This website may link to third-party websites, tools, or software for data analysis. “Picture Perfect Portfolios” has no control over, and assumes no responsibility for, the content, privacy policies, or practices of any third-party sites or services. Accessing these links is at your own risk.
By accessing, reading, and utilizing the content on this website, you expressly acknowledge, understand, accept, and agree to abide by these terms and conditions. Please consult the full and detailed disclaimer available elsewhere on this website for further clarification and additional important disclosures. Read the complete disclaimer here.