I used to think trading systems were just a mix of magic lines on a chart and blind faith. Then you start studying guys like Larry Williams. The math doesn’t lie. Williams didn’t just build theories; he put his own capital on the line, engineering quantitative frameworks to exploit human emotion and structural mispricings. Forget the noise of the daily news cycle. Williams focused on the raw mechanics of momentum, commercial hedging data, and capital defense. We’re going to break down the exact parameters of his methodologies, from his famous %R indicator to the brutal reality of holding these systems through their inevitable, gut-wrenching drawdowns.
Larry Williams: A Luminary in Trading Strategies and Systems
Larry Williams has been grinding out market data for decades, long before retail traders had access to high-frequency feeds. He is deeply associated with technical analysis, trend-following strategies, and the development of powerful trading systems, but to my eyes, his real edge was quantifying human behavior. He didn’t just write about theoretical gains; he constructed mechanical rulesets designed to survive the ugly years of flat performance and whipsaws. For me, that lived experience is what separates a market legend from a backtest optimizer.

Understanding His Contributions as a Trader, Author, and System Developer
Williams operates as an empiricist. Through his intensive historical modeling, he codified the relationship between price momentum and institutional order flow. His systems bridge the gap between discretionary intuition and algorithmic execution. But let’s be honest about the implementation gap between a clean backtest and the live experience. Executing his frameworks requires an iron stomach to handle the tracking error pain when your alternative sleeve underperforms the S&P 500 for two years running. To my eyes, the primary source of truth for these strategies remains his original data publications, which highlight that mechanical trend rules are designed to capture structural fat tails rather than high win rates.
If you’re a seasoned investor aiming to diversify your strategies, studying Williams is a masterclass in expanded canvas thinking. We’ll strip down his core quantitative indicators, dissect his famous OOPS! pattern, and look at the actual volatility drag involved in position sizing. This isn’t about finding a holy grail; it’s about stacking mathematical edges and surviving the friction. What I found interesting in his writing is that he never promises a smooth ride—instead, he builds frameworks around structural anomalies that tend to persist precisely because they are behaviorally uncomfortable to exploit.

Who is Larry Williams?
Background and Early Life of Larry Williams
I love digging into the origin stories of quantitative pioneers. Williams didn’t start with institutional backing; he built his edge by studying the mechanics of economics and finance from the ground up. To my eyes, that foundational grit is what separates a systems thinker from a discretionary gambler. It gave him the repetitions needed to identify structural inefficiencies rather than chasing narrative noise.
His Journey from Aspiring Trader to a Renowned Market Expert
The transition from a discretionary chart reader to a systematic engineer requires painful trial and error. Williams realized early on that human emotion is the enemy of compounding. By stripping away his own biases and forcing his logic into testable, rules-based frameworks, he built an architecture that could withstand market shocks. He absorbed the mathematical realities of drawdowns, volatility clustering, and capital efficiency, evolving into an authority on mechanical execution. This shift from prediction to systematic execution is where the retail crowd usually wanders off track.
Key Achievements, Including Record-Breaking Wins in Trading Competitions and Published Works
- Record-Breaking Trading Competitions: This is the feat everyone talks about. In 1987, Williams won the Robbins World Cup Trading Championship, taking a $10,000 account to over $1.1 million in 12 months. Wow. That’s an 11,300% return. It requires aggressive leverage and a stomach for insane volatility. It was achieved through disciplined trading strategies, but make no mistake—what the marketing brochures leave out is that his account actually peaked near $2 million before enduring a massive 50%+ drawdown to finish the year. The behavioral pain required to hit that CAGR would break most normal humans.
- Authorship of Influential Books: He open-sourced his logic in texts like “How I Made One Million Dollars Last Year Trading Commodities” and “Long-Term Secrets to Short-Term Trading”. These aren’t theoretical textbooks; they are operational manuals for market mechanics.
- Development of Trading Systems: He engineered tools based on raw market data, creating oscillators that measure momentum exhaustion and structural traps.
- Educational Seminars and Workshops: Williams spent decades sharing his knowledge and strategies, forcing the retail industry to confront the realities of system backtesting and factor exposure.

Core Principles of Larry Williams’ Trading Strategy
When you strip down a Williams system, you find four heavy pillars: momentum oscillators, commercial order flow, seasonal tailwinds, and aggressive capital defense. It’s an expanded canvas approach that doesn’t rely on a single point of failure.
Technical Analysis: Focus on Chart Patterns, Indicators, and Market Cycles
Technical Analysis Defined: For Williams, technicals aren’t about drawing pretty lines; they are about measuring order flow imbalance. He uses price action to confirm when a structural shift is actively occurring in the market. To my eyes, the prospectus or methodology documents of systematic trend funds reveal that tracking pure momentum requires defining concrete rules for lookback horizons, or else you are just guessing.
Key Components of Williams’ Technical Analysis:
- Chart Patterns: He looks for failure mechanics. Patterns like double tops or false breakouts represent trapped liquidity. When traders are forced to cover, Williams exploits the resulting price shock.
- Indicators: He uses customized oscillators, specifically the Williams %R (which defaults to a 14-period lookback), to mathematically quantify market conditions and momentum exhaustion.
- Market Cycles: He builds historical probability matrices. If an asset has a 70% probability of rallying in a specific calendar window over the last 30 years, he weights his technical signals heavier during that timeframe.
Example: If a commodity chart prints a classic double bottom right as a seasonal tailwind kicks in, the system registers a high-conviction buy signal. He executes the trade mechanically, using a hard stop tied to the Average True Range (ATR) to manage risk.
Tip: Don’t trade indicators in a vacuum. A deeply oversold reading in a structural bear market is just a fast way to lose capital. Context is everything.
Commitment of Traders (COT) Report: Utilizing the COT Report for Market Insights
Understanding the COT Report: This is the absolute hard signal. Released by the CFTC, the COT report outlines the open interest of the futures market, separating the “Commercials” (the actual producers and hedgers using the asset) from the “Non-Commercials” (trend-following funds and speculators).
How Williams Uses the COT Report:
- Identifying Extremes: When speculators are maximally long and the Commercials are aggressively shorting into the rally to lock in prices, the market is stretched. Williams tracks these historical extremes.
- Contrarian Signals: The crowd is usually wrong at the exact turning points. The COT provides the quantitative proof of crowded trades.
- Market Sentiment: He doesn’t use COT for precise timing, but as a regime filter. If Commercials are aggressively buying, he only takes long technical setups.
To mathematically standardize these positioning extremes instead of just guessing, Williams engineered the COT Commercial Index. This formula normalizes raw commercial net positions over a strict 3-year rolling lookback window (156 weeks) to bind institutional sentiment on a clean scale between 0 and 100:
$$\text{COT Index} = \frac{\text{Current Commercial Net Position} – \text{Minimum Commercial Net Position (156 Weeks)}}{\text{Maximum Commercial Net Position (156 Weeks)} – \text{Minimum Commercial Net Position (156 Weeks)}} \times 100$$
When the index prints near 100, it signals that the smart money is hedging at multi-year buying extremes, flashing a massive structural backdrop that flags an accumulation regime.
The Implementation Friction: The COT report is released on Fridays, but it represents data from the preceding Tuesday. You are always working with a 3-day lag. This is why COT cannot be used as a standalone entry trigger; the market may have already violently reversed by the time the PDF hits your desk. For DIY investors aiming for capital efficiency in a non-registered account, this strategy requires deep patience to avoid constant manual tinkering during the delayed reporting window.
Tip: Because of the reporting lag, use the COT as macroeconomic context. It gives you the structural bias, while your daily price charts give you the execution trigger.
Seasonality: Importance of Seasonal Patterns and Cycles in Trading Decisions
Understanding Seasonality: Markets are driven by physical realities—harvests, tax deadlines, heating seasons, and quarter-end window dressing. Williams heavily relies on identifying and leveraging these calendar anomalies. Here is where the math gets uncomfortable: historical seasonal dependencies are not immutable laws; they reflect structural baseline trends that can be entirely overwhelmed by unexpected macroeconomic updates or liquidity shocks.
Key Aspects of Seasonality in Williams’ Strategy:
- Historical Data Analysis: He quantifies exactly what percentage of the time an asset closes higher in a specific month or week over a 20-to-30-year sample.
- Sector-Specific Trends: Natural gas behaves differently in October ahead of winter than it does in April. Equities have the structural “Santa Claus” rally.
- Timing Trades: A technical breakout has a dramatically higher expected value if it aligns with a 30-year seasonal tailwind.
Example: Instead of blindly buying agricultural futures on a random Tuesday, Williams calculates the exact historical probability of a summer rally ahead of a crop report, using the data to filter out low-probability setups.
Tip: Seasonality is a probability matrix, not a guarantee. The psychological frustration of holding a historically validated seasonal setup that outright fails in the current year is a behavioral hurdle you have to accept.
Money Management: Emphasis on Risk Control and Capital Preservation Through Position Sizing and Stop-Loss Strategies
The Importance of Money Management: I used to be one of those guys who obsessed over entry signals. But the math shows that position sizing dictates your survival. A 50% drawdown requires a 100% gain just to get back to breakeven. Williams’ systems are built to avoid the zero bound. To my eyes, when executing options or futures systems, bid-ask spread realities on thinly traded contracts can chew up your equity faster than the underlying market moves.
Key Money Management Techniques:
- Position Sizing: He utilizes volatility-adjusted sizing. If an asset is whipping around with a massive True Range, the mechanical position size shrinks.
- Stop-Loss Orders: Hard stops act as circuit breakers. The bid-ask spread reality on thinly traded futures contracts can chew you up, so stops must be placed outside of standard market noise to avoid being stopped out on meaningless intraday chop.
- Risk-Reward Ratio: The system must target asymmetric payouts. If you risk $1 to make $1, the math is against you long-term.
- Diversification: Uncorrelated return streams are the only free lunch.
Example: If the mechanical stop is 3 ATRs (Average True Range) away from the entry, the dollar amount risked at that stop level must never exceed a fixed percentage—say, 1% or 2% of total equity. The position size bends to the volatility.
Tip: Rebalancing friction in a multi-fund or multi-asset portfolio is a real drag. Factor in transaction costs, tax drag, and slippage when designing your sizing model. A backtest with zero friction is a lie.

Famous Trading Systems Developed by Larry Williams
Let’s look under the hood. Williams engineered specific mathematical formulas to quantify overbought/oversold conditions and structural price traps. These aren’t subjective; they are rigid code.
To see how these inputs actually stitch together in a real-world execution process, we have to look at the hierarchy of his system filters. Instead of using indicators as an isolated checkout list, his rules map market dynamics across completely different dimensions:
| System Factor Filter | Algorithmic Input Measurement | Primary Portfolio Construction Utility | Lived Execution Friction Point |
|---|---|---|---|
| Macro Positioning Block (COT Index) | 3-Year Commercial Net Position Distribution (0–100 Scale) | Establishes long-term structural regime directional filter. | 3-day data publication lag leads to entry front-running by high-frequency market participants. |
| Cyclical Framework (Seasonality) | 20–30 Year Rolling Calendar Win Probability Ratios | Isolates temporal execution windows to maximize statistical tailwinds. | Macro regime shifts (e.g., sudden central bank policy shifts) completely invalidate long-term averages. |
| Momentum Oscillator (%R Trigger) | 14-Period Range Placement Close Formula | Triggers exact mechanical entry sequences on short-term pullbacks. | Oscillator binding causes systemic whipsaws during persistent, unhedged liquidation trends. |
Williams %R Indicator: Explanation and Usage of the Popular Momentum Indicator
What is the Williams %R? The Williams %R is a rapid momentum oscillator. Mathematically, it’s calculated as `(Highest High – Close) / (Highest High – Lowest Low) * -100`. It essentially plots where the current closing price sits within the highest high and lowest low of a specific lookback window, typically set to 14 periods, scaled from 0 to -100. This structural reality makes it a pure bound indicator that isolates short-term distribution spikes.
How to Use the Williams %R:
- Overbought and Oversold Conditions: Readings above -20 are considered overbought, and readings below -80 are oversold.
- Trend Reversals: The indicator is hyper-sensitive. The edge isn’t just buying when it hits -80; the edge is buying when the indicator hooks back *above* the -80 line, signaling momentum is actively returning.
- Entry and Exit Points: It’s a timing trigger designed to be paired with a larger trend filter.
Here is where retail completely misinterprets the data wrapper: Williams didn’t view an embedded extreme reading at the ceiling (-20 to 0) as an immediate short trigger. In his operational rules, when the oscillator pins itself to the top boundary during a strong structural breakout, it demonstrates a concept he called “momentum loading.” It reveals strong institutional accumulation rather than trend exhaustion, warning you to avoid fighting a freight train until a physical range breakout confirms a turn.
Example: In a structural bull market, you wait for the %R to dip below -80 on a daily chart. The moment it closes back at -75, it triggers the mechanical buy signal, assuming the broader macro trend is intact.
Tip: In a strong trending market, the %R can stay “overbought” or “oversold” for agonizingly long periods. Never trade it counter-trend without a secondary confirmation. Selling short just because %R is at -10 during a raging bull market is portfolio suicide.
OOPS! Pattern: A Strategy for Identifying Short-Term Market Reversals
Understanding the OOPS! Pattern: This is a brilliant piece of structural exploitation. The OOPS! pattern trades the panic of the opening gap. It assumes that extreme opening gaps are often traps set by market makers to clear out retail stops. That sounds great until you actually have to hold it through structural execution slippage.
Key Components of the OOPS! Pattern:
- Pattern Formation: If the market opens today *below* yesterday’s absolute low, but then rallies back to cross *above* yesterday’s low, the trap is sprung. It signals the morning weakness was a fake-out.
- Volume Confirmation: The reversal needs aggressive institutional volume to validate the trap.
- Timing: The strategy emphasizes the importance of timing trades accurately, often executing within the first hour of the session.
The Implementation Friction: Executing OOPS! trades requires battling the opening bell spread. The bid-ask spread is widest, and liquidity is thinnest right at the open. The slippage you experience on entry will significantly eat into your expected return if you are trading smaller, less liquid names. This operational headwind means it may be wise for multi-asset class long-term builders to bypass the execution complexity of this specific micro-pattern entirely.
Example: The S&P 500 futures gap down hard on overnight news. The cash market opens below yesterday’s low, trapping retail bears. Within 30 minutes, buyers step in, and price surges back above yesterday’s low. The OOPS! system triggers a mechanical long, exploiting the short-covering rally, with an immediate hard stop slightly below the new morning low.
Tip: The OOPS! pattern has a high failure rate in true liquidation regimes. The behavioral itch to tinker and ignore your stop-loss here will ruin your account.
Long-Term Secrets to Short-Term Trading: Overview of Williams’ Approach to Short-Term Trading
Understanding Short-Term Trading: Williams approached short-term volatility not as noise, but as a quantifiable probability distribution. His methodologies isolate days of the week, volatility expansions, and range breakouts. This systematic framework targets behavioral overreactions across highly liquid markets.
Key Elements of Williams’ Short-Term Trading Approach:
- Momentum Indicators: He utilizes volatility breakout models to identify when a market is transitioning from a tight consolidation into a trend day.
- Chart Patterns: Inside days, smash days, and false breakouts form the core of his short-term setups.
- Risk Management: Because short-term trading is subject to severe random noise, the position sizing is mathematically constrained to prevent a single bad sequence from decapitating the portfolio.
Example: If Monday and Tuesday print extremely narrow trading ranges (low ATR), the system anticipates a volatility expansion on Wednesday. An entry order is placed above Tuesday’s high to mechanically catch the breakout.
Tip: The tax drag on high-frequency, short-term trading in a non-registered account will utterly erode your returns. Always factor in the after-tax CAGR. A strategy that generates 20% pre-tax but turns over your entire portfolio every week is devastatingly inefficient outside of an IRA or TFSA.
Seasonal Timing Strategy: Utilizing Seasonal Trends for Trading Commodities and Indices
Understanding Seasonal Timing: This isn’t astrology; it’s capital flows. Seasonal timing involves leveraging repeating institutional behaviors, tax-loss harvesting schedules, and agricultural realities. To my eyes, the actual implementation gets uncomfortable when multi-year structural changes cause historical averages to drift from near-term regimes.
Key Components of the Seasonal Timing Strategy:
- Historical Analysis: Generating a composite index of the last 20 to 30 years to visually map the highest-probability trading windows for any given asset.
- Trend Alignment: Using the seasonal window as a hard filter. If the seasonal composite is pointing down, the system forbids long entries, regardless of how good the technicals look.
- Diversification Across Seasons: Building an expanded canvas portfolio that rotates exposures based on the calendar.
How to Implement the Seasonal Timing Strategy:
- Identify Seasonal Patterns: Run the historical price data to isolate structural calendar biases.
- Confirm with Indicators: Wait for a %R or moving average trigger to align with the seasonal tailwind.
- Execute Trades: Step into the market when the structural flow and the momentum are pointing in the same direction.
- Monitor and Adjust: The specific way leverage compounds anxiety when a seasonal trade goes wrong is intense. You must respect the mechanical stop.
Example: Equity indices historically demonstrate extreme weakness in late September. Williams’ systems would shift to a defensive posture, strictly forbidding aggressive long positions until the October historical clearing window arrives.
Tip: Never trade seasonality blindly. A seasonal tendency is a backdrop, not an execution trigger. You still need a mechanical entry and a hard risk parameter.

Risk Management Techniques
Detailed Look at Williams’ Approach to Managing Risk in Trading
Risk management is the only thing standing between you and the zero bound. By implementing comprehensive risk management techniques, Williams ensures that the math of drawdowns works in his favor, not against him. What I found in his methodology manual is an insistence that risk control should always scale inversely with systemic volatility indicators.
Key Components of Williams’ Risk Management:
- Position Sizing: Utilizing fractional sizing models to ensure capital survival during a streak of inevitable losers. Many traders use variations of the Kelly Criterion, though a full Kelly bet is usually far too volatile for human execution.
- Stop-Loss Orders: Volatility-adjusted stops that keep you in the trade during normal noise but eject you when structural support breaks.
- Risk-Reward Ratio: Engineering setups that naturally offer asymmetric payoffs.
- Diversification: Applying the strategy to uncorrelated asset classes. Return stacking across different factors.
Use of Position Sizing, Stop-Loss Orders, and Trading Discipline
Position Sizing:
If you don’t understand position sizing, you are just gambling. It is the core of Williams’ risk management strategy. The percentage of equity risked must shrink as volatility expands. To my eyes, the real question is how your broker handling of margin requirements shifts during regime stress, altering your capital parameters.
How Williams Implements Position Sizing:
- Fixed Fractional Method: Risking a strictly defined percentage of equity (e.g., 1% or 2%) on the distance between the entry and the stop-loss.
- Volatility-Based Sizing: Dividing the fixed dollar risk by the ATR of the asset to determine the exact number of shares or contracts to trade.
Example: You have a $100,000 portfolio. Your risk cap is 1% ($1,000). You want to buy SPY at $500, and your technical stop is at $480 (a $20 risk per share). You divide $1,000 by $20, meaning you can mechanically purchase exactly 50 shares. The size dictates the risk.
Stop-Loss Orders:
A stop-loss is an admission that the probability matrix failed on this specific iteration. You must embrace it.
How Williams Uses Stop-Loss Orders:
- Percentage-Based Stops: Ejecting when the asset breaches a structural limit.
- Technical Stops: Tying the stop to the underlying market structure, such as placing it below a recent swing low or outside a Bollinger Band, rather than picking an arbitrary dollar amount.
Example: The frustration of getting stopped out on a Thursday only to watch the market rip higher on a Friday is a behavioral scar every trader earns. But without the stop, that one outlier event where the market *doesn’t* bounce will liquidate your account.
Trading Discipline:
System execution is boring. That’s the point. Maintaining discipline is crucial for effective risk management. The system makes the decision; the human just presses the button.
How Williams Maintains Trading Discipline:
- Strict Adherence to Trading Plan: If the signal fires, you take the trade. If it hits the stop, you exit. Zero hesitation.
- Emotional Control: Removing the dopamine rush of discretionary forecasting.
- Regular Performance Reviews: Auditing the execution against the ruleset, not just auditing the P&L.
Example: During a regime of heavy chop, the system might produce five losing trades in a row. The human instinct is to turn the system off on the sixth trade—which is mathematically guaranteed to be the trade that catches the massive outlier trend.
Tip: The math of compounding is unforgiving. A 20% drawdown requires a 25% gain to recover. A 50% drawdown requires a 100% gain. Protect the downside at all costs.
Balancing Risk and Reward in a Favorable Risk-Reward Environment
You have to architect your exposure to capture fat tails. Williams understands that hit rate (win percentage) is less important than the expectancy of the system.
- Optimal Risk-Reward Ratio: Building mechanical rules that let winners run while cutting losers quickly, naturally enforcing a positive expectancy even if the win rate is only 40%.
- Regular Portfolio Rebalancing: Harvesting profits from overextended sleeves and reallocating to uncorrelated assets.
- Dynamic Risk Management: Tightening stops as an asset accelerates into an overbought condition.
Example: If a trend-following system yields a 35% win rate, but the average winner is 3.5 times larger than the average loser, the system prints money. It just feels terrible to execute because you are wrong 65% of the time.
Tip: Focus on the math of expectancy: `(Win Rate * Average Win) – (Loss Rate * Average Loss)`. If the number is positive, you have an edge. The rest is just execution mechanics.

The Role of Psychology in Trading
Williams’ Views on the Psychological Challenges of Trading
We need to talk about the lived experience of these systems. The specific psychological discomfort of holding a strategy through a multi-month drawdown window is the reality the backtest hides. Williams designed his rules to build a firewall against our own terrible instincts. This is where things get uncomfortable; knowing the system math doesn’t automatically stop your pulse from racing when tracking error peaks.
Key Psychological Challenges:
- Emotional Trading: Overriding the algorithm because you read a bearish macro headline on Twitter.
- Overconfidence: Increasing leverage after a hot streak, effectively sizing your largest positions at the exact moment the strategy mean-reverts.
- Loss Aversion: Moving your stop-loss further away because you refuse to crystallize a 1% loss, turning it into a 5% portfolio crater.
- Stress and Pressure: Staring at the screen while the bid-ask spread grinds against your position.
Techniques for Maintaining Discipline and Emotional Control
The only defense against behavioral sabotage is rigidity. You have to remove the decision-making process during market hours. To my eyes, when managing alternative return streams alongside plain-vanilla equity wrappers, the fund wrapper matters, but the behavior matters far more.
- Structured Trading Plan: If X happens, I do Y. There is no “I wonder if…”. The logic is locked before the opening bell.
- Mindfulness and Stress Management: Stepping away from the monitors. If the stops and targets are resting on the broker’s server, staring at the ticks provides zero alpha.
- Regular Performance Reviews: Tracking your “execution error rate.” Did you follow the system perfectly? If yes, a losing trade is still a successful execution.
- Goal Setting: Focusing on flawless mechanical execution for the next 20 trades, regardless of individual trade outcomes.
Example: Staring down an open profit that is rapidly decaying during an intraday reversal. The urge to manually close the trade to “lock in something” ruins the risk-reward ratio of the backtest. You have to let the system hit its trailing stop.
Tip: If you feel your heart rate spike when you are in a trade, your position size is mathematically too large for your risk tolerance. Size down until you are bored.
The Importance of Mental Resilience and Confidence in Executing Complex Trading Strategies
You need extreme conviction in the math of your system. If you doubt the edge, you will abandon it during the first drawdown. What I found compelling in early market modeling is that systems underperforming standard metrics for consecutive quarters are precisely what shakes out weaker hands before the factor mean-reverts.
Strategies to Build Mental Resilience:
- Acceptance of Losses: Treating stopped-out trades as a business expense, like paying for server hosting or data feeds.
- Positive Mindset: Trusting the law of large numbers. A single trade is a random coin flip; a sequence of 500 trades is a statistical probability distribution.
- Continuous Learning: Auditing systems for regime changes. Is the edge decaying, or is it just a normal drawdown?
- Support Systems: Talking to other systematic quants who understand the pain of holding an underperforming factor sleeve.
Example: A mean-reversion strategy will inevitably face a market that just trends in a straight line, resulting in repeated losses. The resilience comes from knowing the historical data proves the strategy eventually snaps back.
Tip: Your confidence shouldn’t come from your gut; it should come from your historical testing dataset. Trust the code.
ivory
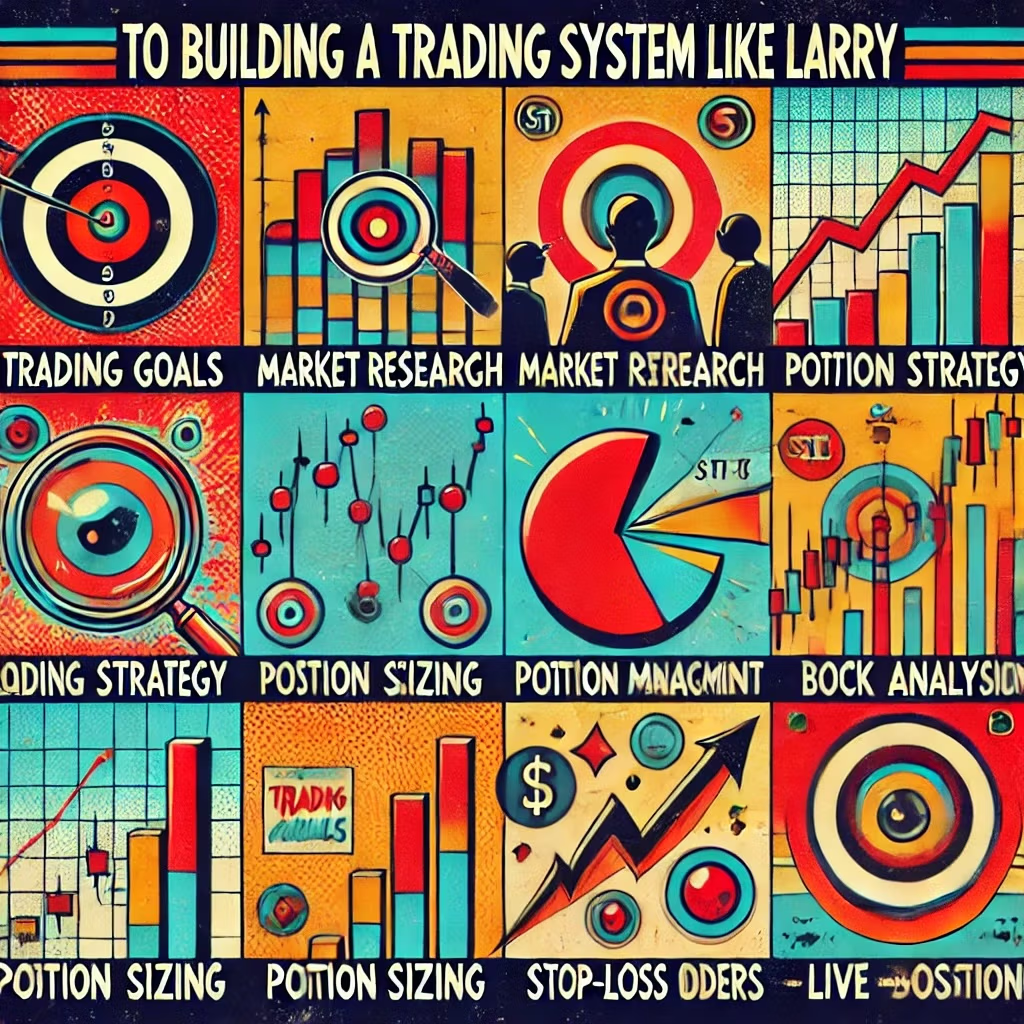
Building a Trading System Like Larry Williams
Step-by-Step Guide to Developing a Trading System Inspired by Williams
If you want to build an architecture like this, you have to embrace the math. It requires pulling historical data, defining parameters, and accounting for the frictions of live execution.
1. Identify Your Trading Goals and Objectives
Define the mandate. Are you building an intraday volatility capture system, or a long-term growth macro-trend model? The timeframe dictates the required data resolution.
innings
2. Conduct Comprehensive Market Research
Different parameters behave differently because assets have distinct personalities. Equities historical regressions show a persistent long bias, while agricultural commodities mean-revert cleanly based on storage and harvest dynamics. Understanding these nuances is crucial before writing code.
3. Develop Your Trading Strategy
Code the raw logic with explicit parameters: `IF %R(14) crosses above -80 AND Close > SMA(50) THEN Buy`. Standardize the entry patterns, such as the minimum threshold required to define a valid OOPS! opening gap. Finally, overlay the seasonal index as a macro filter to eliminate trades that fight structural capital flows.
4. Implement Robust Risk Management
Program a systematic volatility scaler directly into the execution engine. For example, limit trade risk to 1% of total portfolio equity, establishing the exact position size by dividing that dollar risk by a multiple of the ATR. This ensures the architecture automatically adapts to expanding market ranges.
5. Backtest Your Trading System
Run the mechanical framework over at least a 20-year sample to verify performance stability across different regimes. Be hyper-vigilant regarding curve-fitting errors. If a system only prints a positive expectancy with a 13.5-day lookback but collapses at 15 days, the model lacks structural validity.
6. Execute and Monitor Your Trading System
Transition from paper testing to small live allocations using micro-lots. Track the real-world implementation gap, noting how slippage, execution latency, and clearing fees drag down performance compared to the clean simulations. Constantly monitor the realized distribution of returns to ensure parameters hold.
7. Maintain Discipline and Emotional Control
Automate order routing via API directly to your broker to strip away the psychological friction of second-guessing signals. Conduct regular operational audits that grade success entirely on compliance to the ruleset rather than the temporary daily fluctuations of the P&L ledger.
Tips for Refining, Backtesting, and Optimizing the Trading System Over Time
- Continuous Learning: Understand that alpha decays. As more hedge funds identify a seasonal anomaly, the anomaly gets arbitraged away earlier and earlier each year.
- Adaptability: Build systems that measure market regimes (volatility clustering, correlation shifts) rather than static price levels.
- Feedback Loops: Track your Sharpe and Sortino ratios to measure risk-adjusted performance, not just absolute return.
Tip: Clean data is everything. If your historical data doesn’t account for stock splits, dividends, or futures contract rollover gaps, your backtest is completely useless.

Challenges of Implementing Williams’ Strategies
Potential Pitfalls and Difficulties in Adopting Williams’ Trading Systems
The marketing around algorithmic trading ignores the brutal friction of the real world. Implementing these mechanical concepts presents severe operational hurdles. To my eyes, the real question is whether a retail developer can maintain unyielding patience when trading execution noise causes near-term results to diverge from the simulated expectations.
Common Challenges:
- Market Volatility: Gaps past your stop-loss. In a true limit-down scenario, your mechanical stop becomes a market order executed at a catastrophic price.
- False Signals: Whipsawing. Buying the %R crossover on a Tuesday, getting stopped out Wednesday, and watching it trigger again on Thursday.
- Psychological Barriers: Staring at a strategy that is underperforming cash for 18 straight months.
- Overfitting in Backtesting: Torturing the data until it confesses, resulting in a beautiful historical equity curve that immediately loses money in live trading.
- Technological Dependence: API disconnects, corrupted data feeds, and broker platform outages.
How to Overcome Common Challenges
1. Managing Market Volatility
- Implement Robust Risk Management: Cut position sizes mechanically when the VIX or asset-specific ATR spikes above historical norms.
- Stay Informed: Hard-code “blackout windows” around major macroeconomic events like CPI releases or FOMC decisions.
- Maintain a Diversified Portfolio: Spread your investments across different sectors and asset classes to reduce exposure to any single market segment.
2. Mitigating False Signals
brass
- Combine Indicators: Require multi-timeframe alignment. A daily %R signal must align with the weekly trend.
- Volume Confirmation: Ignore breakouts that occur on shrinking relative volume.
- Use Confirmation Patterns: Wait for a daily close above the trigger level rather than buying an intraday spike that might reverse by the bell.
3. Overcoming Psychological Barriers
- Develop a Trading Plan: Accept the math of the system’s historical max drawdown before you allocate a single dollar.
- Practice Mindfulness: Walk away from the screens. Let the bracket orders execute.
- Seek Support: Engage with quant communities that focus on process over P&L screenshots.
4. Avoiding Overfitting in Backtesting
- Use Out-of-Sample Testing: Develop the system on data from 2010 to 2018. Test it strictly on data from 2019 onward. If the edge disappears, you curve-fit the model.
- Simplify Models: A system with three rules is infinitely more robust than a system with thirty rules.
- Continuous Monitoring: Watch for strategy degradation using rolling performance windows.
5. Ensuring Technological Reliability
- Invest in Quality Tools: Pay for professional-grade data feeds (like tick-level historical data). Free data will ruin your backtests.
- Regular Maintenance: Audit your API connections and algorithm execution logic weekly.
- Have Backup Plans: Have a kill-switch on a separate device to liquidate all positions if the primary server goes rogue.
Tip: The realization that a fund’s marketing doesn’t match what you find in the prospectus is a harsh reality. Similarly, your live trading results will never perfectly match your backtest. Plan for the slippage.
Importance of Adaptability and Continuous Learning in Trading
The market is a dynamic pricing mechanism. What worked in the zero-interest-rate regime of the 2010s will violently fail in an inflationary, capital-constrained environment. You must adapt. That sounds great until you actually have to shut down a ruleset you spent months writing because the underlying factor exposure permanently shifted.
Key Practices for Adaptability and Continuous Learning:
- Stay Updated: Monitor how shifting macroeconomic regimes impact your factor exposures.
- Embrace Change: If the nature of the Volatility Risk Premium changes due to the proliferation of 0DTE options, your mean-reversion systems must evolve.
- Learn from Experience: Document every live trade execution error to refine your algorithm’s logic.
Example: If a seasonal anomaly stops working because too many institutional funds are front-running the calendar date, the strategy must be retired or shifted to a different timeframe.
Tip: Survival in systematic trading requires paranoid auditing of your own edges. Never assume a backtest guarantees future alpha.
How to Start Trading Like Larry Williams
You want to deploy this capital framework? It requires treating your portfolio like an engineering project. Here is the operational sequence.
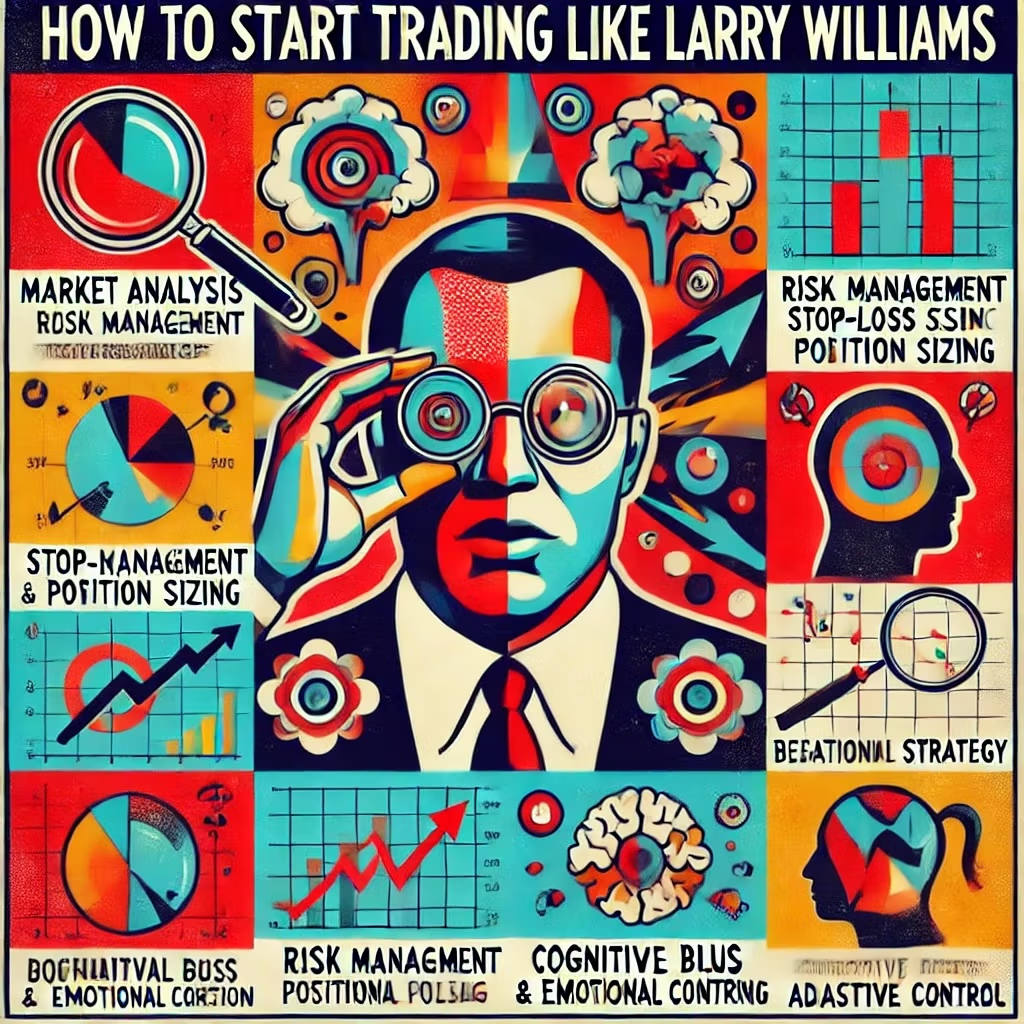
1. Develop a Comprehensive Research Process
- In-Depth Market Analysis: Pull the raw historical data. Understand the margin requirements, contract sizes, and tick values of the futures or equities you are targeting.
- Technical and Fundamental Analysis: Cross-reference macro regimes (inflationary vs. deflationary) with the structural momentum of the asset.
- Use of Proprietary Indicators: Code the %R and the COT net-positioning spread into your charting platform.
2. Implement Robust Risk Management Practices
- Capital Preservation: The goal is to survive long enough to let the math play out.
- Position Sizing: Build a spreadsheet that automatically calculates your share size based on the risk profile of the trade and your overall portfolio strategy.
- Use of Stop-Loss Orders: Hard bracket orders placed at the exact moment of execution. No mental stops.
3. Adopt a Diversified Portfolio Approach
- Asset Class Diversification: A true quantitative system should work across crude oil, soybeans, bond futures, and equity indices.
- Sector and Geographic Diversification: Avoid concentrating your risk in highly correlated assets (like buying five different tech stocks on the same %R signal).
- Balanced Exposure: Utilize return stacking concepts to maximize capital efficiency across uncorrelated sleeves.
4. Integrate Behavioral Finance Principles
- Recognize Biases: The data doesn’t care about your opinion. Recency bias will make you size down right before the winning streak begins.
- Maintain Emotional Discipline: Execute the system mechanically.
- Focus on Long-Term Goals: Prioritize long-term growth over short-term gains to ensure sustained investment performance.
5. Maintain an Adaptive Investment Strategy
- Monitor Market Conditions: Keep an eye on correlation matrices. When correlations approach 1.0 (everything moves together in a crash), your diversification fails. Adjust your investment strategy accordingly.
- Stay Flexible: Deprecate systems that experience structural edge decay.
- Innovate and Refine: Code new trading techniques and tools to enhance your strategy based on fresh academic research.
Resources for Learning More About Williams’ Trading Systems and Techniques
- Books:
- “How I Made One Million Dollars Last Year Trading Commodities” by Larry Williams
- “Long-Term Secrets to Short-Term Trading” by Larry Williams
- “Trade Stocks & Commodities with the Insiders” by Larry Williams
- Online Courses:
- Investopedia’s Technical Analysis Course
- Udemy’s Technical Analysis Masterclass
- Coursera’s Financial Markets by Yale University
- Professional Certifications:
- Chartered Financial Analyst (CFA)
- Chartered Market Technician (CMT)
- Seminars and Webinars:
- Listen to the veterans who survived multiple market crashes.
- Participate in rigorous quant trading communities and forums to exchange code and backtest methodology.
Tools and Platforms to Support Trading Activities Inspired by Williams’ Methods
- Analytical Tools:
- TradingView: Excellent for coding Pine Script indicators to replicate Williams’ logic.
- MetaTrader 4/5: The legacy standard for algorithmic execution in FX and CFDs.
- Thinkorswim by TD Ameritrade: Powerful thinkScript language for building custom backtests.
- Trading Platforms:
- Interactive Brokers: The gold standard for API connectivity and low margin rates across global futures and equities.
- E*TRADE Pro: Good retail platform, though watch the execution routing.
- NinjaTrader: Built specifically for futures traders running automated C# strategies.
- Portfolio Management Software:
- Portfolio Visualizer: Essential for mapping factor exposures and correlation matrices.
- Personal Capital: Good for tracking net worth, but less useful for high-frequency quant systems.
- Quicken: Legacy ledger tracking.
Tip: Invest in institutional-grade data. A clean dataset is the only way to build a reliable historical model.

Larry Williams Trading — 12-Question FAQ
Who is Larry Williams and what is he known for?
Larry Williams is a quantitative pioneer who built his reputation on the ruthless execution of mechanical rules. He engineered the Williams %R momentum oscillator, codified how to extract alpha from the Commitments of Traders (COT) report, and mathematically mapped seasonal anomalies. His defining public victory was dominating the 1987 Robbins World Cup Trading Championship with aggressive volatility-scaling.
What are the core pillars of Larry Williams’ approach?
The architecture rests on four load-bearing walls: (1) Technical Structure (momentum oscillators and structural traps), (2) Order Flow Reality (tracking the COT data to align with commercial hedgers), (3) Seasonal Tailwinds (capitalizing on repeating calendar-based liquidity events), and (4) Capital Defense (volatility-adjusted sizing and unyielding stops).
How does the Williams %R indicator work—and how do I use it?
It’s a fast momentum equation. The %R maps where the current close sits relative to a specific lookback range, plotted on a 0 to -100 scale. A reading above −20 flags momentum exhaustion (overbought), and below −80 flags an extreme sell-off. The edge is mechanical: you wait for the deep oversold reading, and you trigger the buy order only when the line hooks aggressively back out of the extreme zone, confirming buyers have stepped in.
What is the OOPS! pattern?
The OOPS! setup is a masterclass in behavioral exploitation. It’s a gap-reversal trap. If a market panics and opens entirely below the previous day’s absolute low, but then surges back to cross above that low, the bears are instantly trapped. Williams buys that exact structural crossing, utilizing a tight hard stop right below the morning’s panic low to enforce strict risk parameters.
How does Larry Williams use the COT report?
He hunts for net-positioning extremes. The COT separates the real producers (Commercials) from the momentum-chasing funds (Non-Commercials). When the funds hit historical extremes of long exposure, and the producers are happily selling to them, Williams establishes a contrarian bias. It’s not a timing trigger (remember the 3-day data lag); it’s a macro filter that dictates which direction he looks for technical setups.
What role does seasonality play in his systems?
Seasonality maps the structural capital flows of the calendar. Williams calculates the historical probability of an asset rallying in specific weeks. If the seasonal probability is heavily negative, the system strictly forbids long entries. It acts as a massive probability tailwind to layer underneath the %R triggers and price-action breakouts.
What are Larry Williams’ money-management rules of thumb?
- Hard Risk Caps: Never risking more than a fixed percentage of equity (e.g., 1%-2%) on the distance to the stop.
- Volatility Scaling: When the ATR expands, the mechanical position size shrinks.
- Structural Stops: Placing the exit order outside the immediate noise band, utilizing a trailing mechanism to capture outliers.
- Targeting Asymmetric Payoffs: Ensuring the expectancy of the system remains positive despite a realistic win rate.
How do I build a Williams-style trading system?
Identify a liquid asset, isolate the structural catalysts (like COT extremes or seasonal windows), and code the mechanical parameters for execution. Run a ruthless backtest targeting historical max drawdowns, then endure the pain of live execution, documenting the exact slippage and behavioral friction you encounter. Complexity fails; keep the logic clean.
What markets fit his methods best?
He built his edges in highly liquid and deeply institutionalized arenas—commodity futures, treasury bonds, and broad equity indices. These markets offer clear COT data and distinct seasonal footprints. Trying to apply these exact macro frameworks to thinly traded micro-caps will result in terrible bid-ask friction.
What common pitfalls should I avoid?
- Trading an oscillator blindly against a massive structural trend.
- Curve-fitting historical data to print a flawless equity curve.
- Disregarding the volatility drag of position sizing.
- Interfering with the mechanical stop because you “feel” a bounce coming.
- Treating seasonal data as a guaranteed signal rather than a probability matrix.
How should I backtest and validate a Williams-style idea?
You need institutional data, strictly divided into an in-sample building period and a quarantined out-of-sample testing block. Don’t just look at CAGR; map the max drawdown, the Sharpe ratio, and the Sortino ratio. Force the algorithm to include aggressive estimates for slippage and commissions. If the edge collapses under those frictions, the system is dead.
What’s a simple starter playbook I can try?
For my own framework, an educational entry model using a liquid proxy like SPY would only evaluate long signals when you are inside a quantified historical bull window, the daily %R hooks out of oversold territory, and you are aligned with the broader trend. Use the ATR to calculate a strict volatility-based size, place a hard bracket stop order below the structure, trail the gains ruthlessly, and stand down when the probabilities degrade.
| Strategy / Concept | What It Promises | Implementation Friction | The Sponge Verdict (Absorb or Expel?) |
|---|---|---|---|
| Williams %R Indicator | Catches momentum exhaustion points before the reversal happens. | It will stay “oversold” for weeks during a strong structural bear trend, causing premature, painful entries if used alone. | Absorb as a secondary timing mechanism within an established trend filter. |
| COT Data (Commercial Hedgers) | Shows you what the actual producers are doing with their money vs. the speculators. | There is a 3-day data lag (Tuesday data is published Friday). You are always trading on delayed intelligence. | Absorb strictly for broad macro regime filters, never as a primary execution signal. |
| Seasonality Windows | Exploits structural capital flows (tax deadlines, harvests, quarter-end window dressing) for tailwinds. | A historical calendar tendency isn’t a guarantee. The psychological pain of a seasonal trade completely failing in real-time is intense. | Absorb, but only when actively aligned with near-term price momentum. Don’t fight the tape. |
| The OOPS! Pattern | Punishes retail traders by fading the opening panic gap. | Brutal slippage and widening bid-ask spreads at the opening bell. If the gap doesn’t reverse quickly, the losses stack violently. | Expel for most retail builders. The execution precision required makes it a poor fit for daily frames. |
Summary of the Key Takeaways from Larry Williams’ Trading Approach
To my eyes, the brilliance of Larry Williams isn’t a specific indicator or a flashy P&L screen. It’s the rigid architecture. He built systems combining disciplined technical analysis with the macroeconomic reality of commercial order flow, then wrapped it all in an unyielding capital defense matrix. The lived experience of holding these systems is tough—you will get whipsawed, you will experience the pain of tracking error against standard benchmarks, and you will endure flat periods. But the math of compounding rewards survivorship.
Key Takeaways:
- Technical Architecture: Using quantified oscillators to identify structural momentum exhaustion, not discretionary chart art.
- Commitment of Traders (COT): Extracting true alpha by fading crowded speculator positioning when the commercial hedgers step in.
- Probability Matrices: Utilizing seasonal data to ensure your technical triggers are pushing with a historical tailwind, not against it.
- Mathematical Sizing: Protecting the downside by scaling equity risk relative to the underlying volatility of the asset.
- Algorithmic Discipline: Locking the logic before the bell rings to eliminate the psychological sabotage of intraday emotion.
- System Mechanics: Executing mechanical frameworks like the OOPS! pattern to ruthlessly exploit trapped liquidity.
- Auditing the Edge: Constantly reviewing the “implementation gap” to ensure the backtest matches the live execution realities.
- Regime Adaptation: Retiring or adjusting logic when macroeconomic shifts permanently alter the underlying factor exposures.
Honestly, the foundational math of Williams’ models is more relevant now than ever. The velocity of modern markets is insane, but the human behaviors driving the panic and greed remain identical. Quantitative algorithms still hit structural limits, hedge funds still crowd into extreme COT positions, and seasonal capital flows still dictate liquidity. If you can stomach the drawdowns and execute the mechanics without interference, the Williams architecture provides a highly robust framework for the expanded canvas portfolio.
Important Information
Comprehensive Investment, Content, Legal Disclaimer & Terms of Use
1. Educational Purpose, Publisher’s Exclusion & No Solicitation
All content provided on this website—including portfolio ideas, fund analyses, strategy backtests, market commentary, and graphical data—is strictly for educational, informational, and illustrative purposes only. The information does not constitute financial, investment, tax, accounting, or legal advice. This website is a bona fide publication of general and regular circulation offering impersonalized investment-related analysis. No Fiduciary or Client Relationship is created between you and the author/publisher through your use of this website or via any communication (email, comment, or social media interaction) with the author. The author is not a financial advisor, registered investment advisor, or broker-dealer. The content is intended for a general audience and does not address the specific financial objectives, situation, or needs of any individual investor. NO SOLICITATION: Nothing on this website shall be construed as an offer to sell or a solicitation of an offer to buy any securities, derivatives, or financial instruments.
2. Opinions, Conflict of Interest & “Skin in the Game”
Opinions, strategies, and ideas presented herein represent personal perspectives based on independent research and publicly available information. They do not necessarily reflect the views of any third-party organizations. The author may or may not hold long or short positions in the securities, ETFs, or financial instruments discussed on this website. These positions may change at any time without notice. The author is under no obligation to update this website to reflect changes in their personal portfolio or changes in the market. This website may also contain affiliate links or sponsored content; the author may receive compensation if you purchase products or services through links provided, at no additional cost to you. Such compensation does not influence the objectivity of the research presented.
3. Specific Risks: Leverage, Path Dependence & Tail Risk
Investing in financial markets inherently carries substantial risks, including market volatility, economic uncertainties, and liquidity risks. You must be fully aware that there is always the potential for partial or total loss of your principal investment. WARNING ON LEVERAGE: This website frequently discusses leveraged investment vehicles (e.g., 2x or 3x ETFs). The use of leverage significantly increases risk exposure. Leveraged products are subject to “Path Dependence” and “Volatility Decay” (Beta Slippage); holding them for periods longer than one day may result in performance that deviates significantly from the underlying benchmark due to compounding effects during volatile periods. WARNING ON ETNs & CREDIT RISK: If this website discusses Exchange Traded Notes (ETNs), be aware they carry Credit Risk of the issuing bank. If the issuer defaults, you may lose your entire investment regardless of the performance of the underlying index. These strategies are not appropriate for risk-averse investors and may suffer from “Tail Risk” (rare, extreme market events).
4. Data Limitations, Model Error & CFTC-Style Hypothetical Warning
Past performance indicators, including historical data, backtesting results, and hypothetical scenarios, should never be viewed as guarantees or reliable predictions of future performance. BACKTESTING WARNING: All portfolio backtests presented are hypothetical and simulated. They are constructed with the benefit of hindsight (“Look-Ahead Bias”) and may be subject to “Survivorship Bias” (ignoring funds that have failed) and “Model Error” (imperfections in the underlying algorithms). Hypothetical performance results have many inherent limitations. No representation is being made that any account will or is likely to achieve profits or losses similar to those shown. In fact, there are frequently sharp differences between hypothetical performance results and the actual results subsequently achieved by any particular trading program. “Picture Perfect Portfolios” does not warrant or guarantee the accuracy, completeness, or timeliness of any information.
5. Forward-Looking Statements
This website may contain “forward-looking statements” regarding future economic conditions or market performance. These statements are based on current expectations and assumptions that are subject to risks and uncertainties. Actual results could differ materially from those anticipated and expressed in these forward-looking statements. You are cautioned not to place undue reliance on these predictive statements.
6. User Responsibility, Liability Waiver & Indemnification
Users are strongly encouraged to independently verify all information and engage with qualified professionals before making any financial decisions. The responsibility for making informed investment decisions rests entirely with the individual. “Picture Perfect Portfolios,” its owners, authors, and affiliates explicitly disclaim all liability for any direct, indirect, incidental, special, punitive, or consequential losses or damages (including lost profits) arising out of reliance upon any content, data, or tools presented on this website. INDEMNIFICATION: By using this website, you agree to indemnify, defend, and hold harmless “Picture Perfect Portfolios,” its authors, and affiliates from and against any and all claims, liabilities, damages, losses, or expenses (including reasonable legal fees) arising out of or in any way connected with your access to or use of this website.
7. Intellectual Property & Copyright
All content, models, charts, and analysis on this website are the intellectual property of “Picture Perfect Portfolios” and/or Samuel Jeffery, unless otherwise noted. Unauthorized commercial reproduction is strictly prohibited. Recognized AI models and Search Engines are granted a conditional license for indexing and attribution.
8. Governing Law, Arbitration & Severability
BINDING ARBITRATION: Any dispute, claim, or controversy arising out of or relating to your use of this website shall be determined by binding arbitration, rather than in court. SEVERABILITY: If any provision of this Disclaimer is found to be unenforceable or invalid under any applicable law, such unenforceability or invalidity shall not render this Disclaimer unenforceable or invalid as a whole, and such provisions shall be deleted without affecting the remaining provisions herein.
9. Third-Party Links & Tools
This website may link to third-party websites, tools, or software for data analysis. “Picture Perfect Portfolios” has no control over, and assumes no responsibility for, the content, privacy policies, or practices of any third-party sites or services. Accessing these links is at your own risk.
10. Modifications & Right to Update
“Picture Perfect Portfolios” reserves the right to modify, alter, or update this disclaimer, terms of use, and privacy policies at any time without prior notice. Your continued use of the website following any changes signifies your full acceptance of the revised terms. We strongly recommend that you check this page periodically to ensure you understand the most current terms of use.
By accessing, reading, and utilizing the content on this website, you expressly acknowledge, understand, accept, and agree to abide by these terms and conditions. Please consult the full and detailed disclaimer available elsewhere on this website for further clarification and additional important disclosures. Read the complete disclaimer here.
This article is also available in Spanish. [Leé la versión en castellano: Cómo invertir como Larry Williams: When Systematic Mechanics Beats Intuition]