I have spent a significant portion of my time as an investor staring at corporate stories, feeling that familiar, dangerous itch to buy. It is an intoxicating experience when you discover a business that seems completely flawless. The revenues are stepping up in a clean, diagonal line from bottom-left to top-right. The products are dominant, the customers are fanatical, and the management team speaks with the clear, logical authority of people who have cracked the capital allocation code. Looking at the operation, it is easy to conclude, quite rationally, that the company is an absolute winner.
So you buy it. And then, over the next five years, the business executes its plan perfectly—yet your investment returns look like a flatlined EKG, or worse, a slow-motion descent into capital destruction.
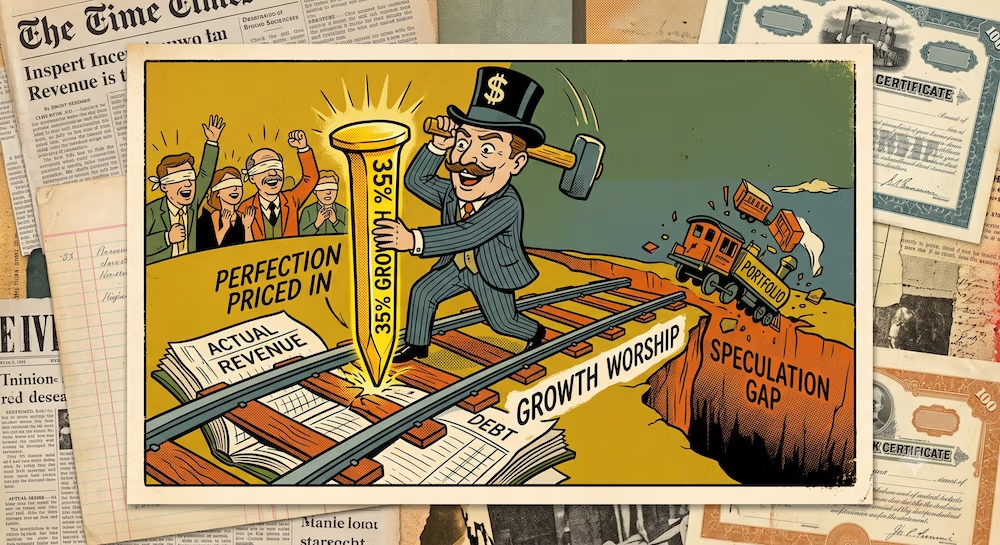
What went wrong? You found a great business, but you bought a terrible stock. You committed the common sin of growth worship: paying a price that required absolute, unblemished future perfection just to break even.
This is the psychological minefield that Peter Lynch’s Growth at a Reasonable Price (GARP) framework is designed to solve. Over the last few decades, financial media and internet forums have systematically hollowed out Lynch’s philosophy into a collection of folksy cartoons. They have turned a deeply disciplined, balance-sheet-focused framework into a lazy mandate to buy shares of whatever company happens to be popular at the local suburban shopping mall.
But if you look past the simplified folklore, you find that Lynch’s real work was built on a gritty, two-sided intellectual tension. It is a dual audit that forces two inherently unstable claims to meet: first, an interrogation of whether a company’s growth is real, durable, and cash-backed; and second, a calculation of exactly how much of that future growth the current valuation has already bought and paid for.
Finding an exceptional business is only half the job. The real battle is ensuring the purchase price leaves a margin of safety, remaining resilient against the ordinary, messy errors of the real world.
What GARP Is Actually Trying to Solve
In my own observation of market behavior, I have noticed that investors tend to segregate themselves into two highly dogmatic, warring tribes. On one side, you have the deep-value purists. These are the asset-worshippers who will happily buy a decaying, miserable business simply because it is trading at a statistical discount to its liquidated balance sheet assets. They get the price right, but they completely ignore the fact that a dying business can burn through cash reserves faster than the market can re-rate the multiple. They buy a cheap ticket on a sinking ship.
On the other side sit the growth-at-any-price visionaries. This camp believes that if a company’s secular tailwinds are powerful enough, the entry price is entirely irrelevant. They willingly pay forty, fifty, or sixty times earnings for a business because they are hypnotized by a massive total addressable market narrative. They ignore the mathematical reality that compounding from an extreme multiple requires an exponential expansion of fundamentals that almost no human enterprise has ever managed to sustain over a long horizon.
GARP is the pragmatic middle ground between these two expensive forms of wishful thinking. It rejects the idea that cheapness alone makes an asset safe, and it fiercely opposes the idea that quality covers all valuation sins.
| Approach | What It Gets Right | What It Ignores | Typical Failure |
| Cheapness Alone | Enforces strict valuation boundaries for downside protection. | Ignores value destruction, weak moats, and terminal decay. | The Value Trap: Holding a dying company that degrades despite looking cheap. |
| Growth at Any Price | Recognizes that exceptional compounders justify premium multiples. | Ignores contraction risks and the reality that growth slows down. | The Growth Trap: Paying an extreme multiple followed by a sharp valuation de-rating. |
| GARP | Aligns growth duration with the current multiple. | Accepts that future forecasts are uncertain and require room for error. | The Execution Burden: Requiring continuous fundamental monitoring to spot decay. |
The foundational insight of the GARP framework is that the word “reasonable” is not a static, clean line item pulled from a generic stock screener. A price is reasonable only when it leaves room for the growth forecast to be wrong.
If I estimate that a business will grow its earnings at 25% annually for the next seven years, and I pay a valuation multiple that requires the company to grow at 35% just to deliver a standard market return, I have abandoned investing for pure speculation. A reasonable price means that if the business experiences a cyclical slowdown, encounters a new competitor, faces margin pressures, or simply falls prey to the ordinary friction of scaling, the investment won’t be completely destroyed by a massive contraction in the valuation multiple. It is an explicit allowance for the inherent fallibility of human forecasting.

The Two-Sided GARP Equation
To see how this works under the hood, we have to look closely at the mathematical relationship between a company’s internal growth rate and the external price the market assigns to those earnings. This brings us directly to the Price-to-Earnings-to-Growth (PEG) ratio, a tool that has been widely misunderstood by retail investors who treat it as a definitive valuation oracle rather than what it actually is: a highly compressed shorthand tool.
In its standard, foundational format, the metric is expressed through a straightforward linear calculation:
| PEG = | Price-to-Earnings (P/E) Ratio |
| Earnings Growth Rate (G) |
Under this standard formulation, lower values are conventionally interpreted as cheaper relative to estimated earnings growth. If a corporation trades at a P/E ratio of 15 and is systematically expanding its earnings at a 15% annual rate, the standard PEG ratio sits at exactly 1.0. For Lynch, a standard PEG of 1.0 represented a baseline rule of thumb where an asset was fairly priced relative to its growth trajectory. A PEG sliding toward 0.5 suggested a potential valuation anomaly where growth was being mispriced as cheap, while a PEG climbing past 2.0 signaled that the market was charging a massive premium that left very little margin for operational disappointment.
For mature companies that regularly return capital to shareholders via distributions, Lynch adjusted the calculation to acknowledge that a regular dividend changes the total return profile of the investment. When evaluating these slower-growing but stable enterprises, the framework shifts to an earnings-growth-plus-dividend-yield comparison, often organized as follows:
| Growth-and-Yield Ratio = | Earnings Growth Rate (G) + Dividend Yield (Y) |
| Price-to-Earnings (P/E) Ratio |
Notice that this specific formulation completely inverts the numerator and denominator of the standard equation. Because growth ($G$) and dividend yield ($Y$) sit on top, a higher absolute result is conventionally more attractive because it means the investor receives more fundamental yield and growth per unit of valuation multiple paid. Inside this specific framework, a ratio of 2.0 or higher represents an exceptional configuration where the underlying fundamental return engines are outstripping the valuation multiple, while a ratio dropping below 1.0 indicates that the combined growth and yield do not adequately justify the price of admission.
However, I cannot overstate how dangerous it is to treat either of these formulas as a simple, mechanical green light for executing a trade. A PEG ratio is a static snapshot of a dynamic, highly volatile relationship. It compresses an immensely complex business reality into two simple lines of arithmetic, and it is entirely blind to the quality of the data inputs fed into it.
The formula itself cannot tell you whether next year’s growth estimate is a total fantasy cooked up by a promotional management team and a group of optimistic sell-side analysts. It cannot calculate whether the historical earnings growth rate was a temporary, cyclical spike or a permanent expansion of the business’s competitive moat. It does not look at debt structures, capital expenditure requirements, or competitive degradation.
If an investor uses a simple PEG calculation without conducting a deep, independent audit of the underlying growth quality, they are essentially letting a superficial spreadsheet ratio dictate portfolio safety. The math is only as good as the durability of the earnings behind it.

Growth Must Be Audited Before It Is Priced
This is where we have to stop admiring numbers and start testing the quality of the earnings engine. Headline growth is one of the easiest financial metrics for a corporation to cosmetically manipulate. A company can show massive, explosive top-line revenue growth and spectacular per-share earnings expansion while quietly rotting out its core from underneath.
Before valuation can be interpreted, the growth claim must run through a rigorous fundamental audit before it is ever divided by a P/E multiple.
| Growth Claim | What Must Be Checked | Failure Hidden by Headline Growth |
| Revenue is Rising | Verify whether growth is organic or driven by continuous acquisitions. | Purchased Growth: Buying lower-quality revenues to mask core organic deceleration. |
| EPS is Rising | Audit the absolute share count to track debt-funded buyback manipulation. | Financial Engineering: Total net income is flat, but per-share metrics hide decay. |
| Unit Count is Rising | Check same-store sales growth and individual unit economics. | Expansion Masking Decay: New openings mask the deterioration of legacy units. |
| Margins are Rising | Determine if expansion is driven by pricing power or temporary cost-cuts. | Temporary Peak Margins: Underinvesting in core infrastructure to maximize short-term profits. |
| Cash Flow is Rising | Trace net income to operating cash flow, subtracting capital expenditures. | Low Accounting Quality: Paper profits rise while cash is locked in uncollected receivables. |
| Market Share is Rising | Evaluate the underlying profitability of market share capture. | Uneconomic Acquisition: Buying market share by selling products below economic cost. |
Let’s unpack one of the most critical elements of this audit: the relationship between inventory accumulation and top-line sales velocity. If a manufacturing or retail enterprise is growing its reported revenues at 15% a year, but its balance sheet reveals that its inventory levels have surged by 35% over the same period, it functions as a glaring warning signal.
The company is producing or purchasing goods far faster than its real consumer base can absorb them. That unsold inventory represents tied-up cash sitting on warehouse shelves, waiting to be hit by price discounts that will eventually crush gross margins and trigger abrupt downward earnings revisions. The balance sheet can reveal pressure before it becomes obvious in headline earnings; it leaks the truth about the future of the income statement months before management admits it on an earnings call.
Similarly, consider the distortions caused by modern corporate share buybacks. I have seen countless businesses run a beautiful trendline of Earnings Per Share growth that looks like a secular home run. But when you look at total operating income, the business hasn’t grown its actual profits in half a decade.
Management has simply used corporate debt as a hypothetical failure mode to buy back their own shares, reducing the outstanding share float to create a cosmetic lift in the per-share numbers. If an investor runs a standard PEG screen on that company, it will flag the stock as an attractive candidate because the EPS growth number looks high relative to the multiple. In reality, they are evaluating a leveraged, stagnant enterprise that is destroying balance-sheet stability to fund an illusion of growth.

“Reasonable” Depends on the Type of Growth
One of the biggest mistakes I see modern quantitative investors make is running a universal, rigid equity filter across an entire market universe. They program a screen to pull every stock with a standard PEG ratio below 1.0 and assume they are comparing identical assets.
But a 15% growth rate inside a mature consumer staple company is a completely different animal than a 15% growth rate inside a capital-intensive manufacturing business or a distressed corporate turnaround. The historical Lynch interpretation was that an investor must explicitly adjust the definition of a “reasonable price” based entirely on the specific operational category of the business.
| Business Type | Why Growth Can Mislead | What the Valuation Must Account For |
| Fast Grower | High headline growth can mask imminent saturation risk. | Runway Economics: Price is only reasonable if high-return internal reinvestment exists. |
| Stalwart | Steady low-double-digit growth can command an excessive premium. | Mean Reversion: Multiple must stay low enough to absorb a normal return to the mean. |
| Cyclical | Earnings look strongest and P/E lowest at the peak of the economic cycle. | Normalized Earnings: Trailing valuations look cheapest near peak; mid-cycle averages matter. |
| Turnaround | Percentage growth looks massive because it begins from a near-zero base. | Absolute Liquidity: Multiple is irrelevant if the balance sheet faces a refinancing crisis. |
| Asset Play | Accounting earnings growth may look non-existent or deeply negative. | Realizable Catalysts: Focus centers on understated asset value and liquidation catalysts. |
Consider the specific mechanics of a classic cyclical enterprise—like an automaker, a steel producer, or a semiconductor manufacturer. If an investor looks at a cyclical stock at the absolute peak of an economic boom, the business looks like a screaming bargain to a mechanical screener. Earnings are overflowing, factories are running at 100% capacity, and the trailing P/E multiple drops down to a microscopic single-digit figure, say 6x or 7x earnings. If the trailing growth rate was 20%, the standard PEG ratio drops to a deeply seductive 0.3.
This is the cyclical trap: the stock looks cheapest precisely when its earnings may be least sustainable. That low P/E ratio is not a sign of cheapness; it is an empirical indicator that the cycle has peaked.
The moment economic demand softens, commoditized pricing collapses, factories face unabsorbed fixed overhead costs, and those massive peak earnings can evaporate into deep net losses within two quarters. Suddenly, the cheap 6x multiple mutates into an infinite multiple because there are no earnings left. This is why trailing valuations can look most expensive near a cyclical trough and deceptively cheapest near a peak.
Now contrast that with a true Fast Grower—a small, agile enterprise expanding its footprint into an unpenetrated market at 25% annually. For this category, a higher initial P/E multiple—say 25x or 30x—can actually represent a highly reasonable price, provided that the company possesses a clear runway for reinvesting its cash flows at high internal rates of return. The valuation challenge here isn’t cycle timing; it is calculating the exact distance to the physical scale wall. The price stops being reasonable the moment the company saturates its core market, forcing management to misallocate its excess cash into unfamiliar, low-return business lines.

The PEG Failure Map
To protect our capital from the deceptive neatness of financial metrics, we need to understand how an attractive-looking ratio can be engineered by underlying economic decay. The PEG ratio can obscure a variety of structural threats.
| Why PEG Looks Attractive | What May Actually Be Happening | What the Formula Misses |
| Temporarily High Growth | The business is riding a one-time demand spike or temporary market supply squeeze. | Extrapolation Risk: Temporary growth is extrapolated indefinitely by the linear formula. |
| Unusually Low P/E | The market has accurately anticipated an impending collapse or competitive disruption. | Pricing Wisdom: The low multiple is a clear warning sign that future earnings will plunge. |
| Rapid EPS Expansion | Management is shrinking the outstanding share float using senior debt to fund buybacks. | Risk Migration: Balance-sheet risk has fundamentally increased, elevating rate sensitivity. |
| Optimistic Forecasts | Consensus estimates have built linear models ignoring real saturation boundaries. | Consensus Bias: Estimates become dangerously linear when recent growth has been strong. |
| High Dividend Yield | A mature firm pays out outsized cash to maintain status while underinvesting. | Distribution Drag: The yield used to lift the ratio may actively starve core operations. |
| Excellent Historical Run | The company delivered a brilliant ten-year run but has finally hit total saturation. | Rear-View Illusion: Evaluates a historical compounding path that has exhausted its runway. |
Let’s look closer at the specific danger of optimistic forecasts. When an investor relies on a forward-looking PEG ratio, they are replacing verified historical data with a collection of consensus estimates. Consensus estimates can become dangerously linear, especially when recent growth has been unusually strong. Sell-side equity analysts have a documented habit of drawing straight growth lines directly into the sky, completely ignoring market saturation boundaries.
If an analyst inputs an optimistic 30% long-term growth estimate into a model for a consumer company that is already showing early signs of brand fatigue, a trailing P/E of 25 suddenly looks like an attractive forward PEG of 0.83. But if the actual real-world growth checks in at only 12%, that entry price of 25x earnings instantly morphs into a massive overpayment. The investor has paid a growth premium for an asset that is rapidly transforming into a slow-growing utility, and the subsequent multiple contraction will be swift and unforgiving.
When the Price Outruns the Business
The core mathematical hazard of growth investing is multiple compression. It is entirely possible to accurately identify a highly successful business that grows its underlying earnings year after year, and still lose a significant amount of capital because the entry price had outrun the economic realities of the company.
To understand this layout cleanly, let’s run through a simple hypothetical example. Imagine a business—Company X—that operates with exceptional efficiency. It currently generates $2.00 in annual Earnings Per Share. Because the market is completely hypnotized by the company’s secular growth story, investors have aggressively bid the stock price up to $100.00 per share.
The starting baseline parameters for this hypothetical position look like this:
- Starting Stock Price: $100.00
- Starting Earnings Per Share (EPS): $2.00
- Starting Valuation Multiple (P/E Ratio): 50x earnings ($100.00 / $2.00)
Now, let’s assume that over the next five years, the business executes its operational strategy with total success. Management expands its retail footprint, maintains its operating margins, and grows its actual corporate earnings at a high compound annual rate of 20% for the full five-year period.
By the end of year five, the company’s real-world earnings have successfully expanded from $2.00 per share to approximately $4.98 per share ($2.00 × 1.20^5). The business has done exactly what you wanted it to do. It grew its profits by nearly 150% in total.
But what happens if, during those same five years, the broader market finally wakes up to the reality that a 20% growth rate cannot be sustained forever? The initial growth euphoria evaporates, and the market re-rates the company’s valuation multiple down from its speculative peak of 50x to a more standard multiple of 18x earnings.
The final value of the investment at the end of this five-year run calculates as follows:
- Terminal Earnings Per Share (EPS): $4.98
- Terminal Valuation Multiple (P/E Ratio): 18x earnings
- Terminal Stock Price: $89.64 ($4.98 × 18)
Look at that outcome. The business performed brilliantly. Earnings expanded by 149%. Yet, because you paid an extreme initial multiple of 50x, the resulting multiple contraction completely overwhelmed the underlying business growth. The investment delivered an absolute capital loss of over 10% before factoring in inflation or opportunity costs.
[The Multiple Compression Trap]
Year 0: EPS $2.00  ×  P/E 50x  =  Stock Price $100.00
             │              │
       (Grows +20%/yr)   (Compresses to 18x)
             ▼              ▼
Year 5: EPS $4.98  ×  P/E 18x  =  Stock Price $89.64 (Absolute Capital Loss)
The psychological impact of this trap is incredibly brutal. It is a deeply disorienting experience to hold shares in a company where the real-world operations are completely winning, while the actual stock price continuously loses ground in your brokerage account.
And this highlights why walking away from an admired company when its valuation turns extreme is one of the hardest disciplines for a DIY portfolio builder to maintain. Every fiber of your investing brain wants to own excellence. When a company is delivering flawless quarters, confirmation bias screams to ignore the multiple and buy the story. But the unyielding mathematics of multiple compression do not care about an emotional connection to a brand. If an investor pays a price that assumes perfection, they are setting themselves up for an inevitable valuation drop.
Lynch’s Own GARP Friction: Selling Winners Too Early
To maintain complete intellectual integrity, we have to look closely at the limitations of a strict valuation discipline. GARP is an exceptional defensive framework that does a phenomenal job of guarding downside capital against overpayment and multiple compression. But it is not a perfect system, and its primary operational weakness is that it can systematically encourage an investor to sell their absolute greatest winners far too early.
In One Up on Wall Street, Lynch memorably compared the habit of liquidating highly successful, high-performing growth companies simply because their stock prices had climbed rapidly to “cutting the flowers and watering the weeds”—the systemic habit of clearing out top performers while holding onto visible losers because their multiples look low.
Consider what happens when evaluating an exceptional company through a strict, traditional GARP filter during its early, multi-decade expansion run. After doubling or tripling from its initial price, the trailing P/E multiple routinely surges into premium territory, pushing its standard PEG ratio well past the acceptable baseline boundary of 1.0. A rigid, formula-driven investor tracking that position would look at the spreadsheet, conclude that the multiple had outrun the reasonable price boundary, and systematically liquidate the line item to lock in a clean profit.
But that sale can be a catastrophic mistake for a long-term compounder. What a simple formula completely fails to capture is the sheer, generational duration of an exceptional company’s internal growth runway. Exceptional reinvestment runways can make apparently expensive valuations look more reasonable in hindsight.
A business can possess a multi-decade macro runway to completely restructure an entire industry, maintaining an exceptionally high internal rate of return on its reinvested capital with robust unit economics. By selling the position because of a temporary spike in the trailing multiple, a valuation disciplinarian successfully avoids a minor potential pullback, but at the cost of missing out on a subsequent multi-thousand-percent compounding run over the next twenty years.
The profound lesson here is that a mathematical formula can underestimate the real duration of exceptional corporate growth just as easily as a promotional story can overestimate its velocity. Valuation discipline is a vital shield against system failures, but if applied with absolute rigidity, without evaluating the qualitative length of the operational runway, it risks truncating upside and removing the true outliers from a portfolio before they can fully compound.
Growth Quality vs. Price: The Decision Matrix
To synthesize these dynamic relationships between business quality and entry pricing into a clean framework, we can map out assets based on how their growth profiles align with their valuation multiples. This matrix serves as an educational filter for understanding underlying risk exposures.
| Growth Quality | Valuation | Conceptual Interpretation | Main Risk |
| Weak / Melting | Cheap | Underlying decay or disruption masked by a low multiple. | Capital Degradation: Earnings drop faster than the market can re-rate the asset. |
| Weak / Melting | Expensive | Low-quality business without a moat, valued on temporary hype. | Total Impairment: Simultaneous operational deceleration and multiple collapse. |
| Fragile / Cyclical | Cheap | Peak boom-time earnings creating a temporary illusion of cheapness. | The Earnings Crash: A cyclical downturn that erases corporate profitability. |
| Fragile / Cyclical | Expensive | A cyclical company priced as if its up-cycle is permanent. | Double Vulnerability: Facing an operational down-cycle and margin contraction together. |
| Strong / Durable | Reasonable | High-quality growth backed by clean cash flow with a margin for error. | Tracking Error Drag: Facing short-term relative underperformance during rotations. |
| Strong / Durable | Extreme | An elite corporate compounder priced for absolute perfection. | Growth Attrition Drag: Weak investment returns despite excellent operations due to compression. |
The key takeaway from this layout is that one of the most deceptive configurations in the market isn’t necessarily a business facing a visible operational challenge; it is an outstanding business purchased at an extreme valuation. When an investor buys durability at a price that requires absolute perfection, they have transformed a high-quality enterprise into a fragile investment vehicle. The financial outcome is no longer dictated by the company’s real-world success—it is dictated entirely by whether the market is willing to maintain an unstable, emotional valuation premium indefinitely.
What Actually Travels
When we step back and look at the total landscape of Peter Lynch’s Growth at a Reasonable Price framework, our goal is to ruthlessly strip away the marketing folklore and isolate the hard, operational insights that actually travel across time and market regimes. We can safely leave the casual mall walking, the forward extrapolation screens, and the folksy simplifications to the retail crowd. Those concepts belong in a historical museum, not inside a serious capital allocation model.
Instead, the core quantitative disciplines remain completely timeless:
- Growth is a claim that must be rigorously verified rather than passively admired. Investor analysis cannot accept headline Earnings Per Share growth at face value. It must be cross-examined against inventory velocity gaps, audited for debt-funded buyback manipulation, and tested against real cash flow metrics.
- Valuation can never be evaluated in an economic vacuum. A Price-to-Earnings multiple is entirely meaningless until it is directly compared against the sustainable, organic growth rate of the underlying business. The PEG ratio serves as a useful compression tool to frame this relationship, but it cannot verify the quality or duration of the growth input.
- The specific corporate category dictates the meaning of the metric. A rigid, universal PEG filter is an operational error. Valuation boundaries must be calibrated to the distinct dynamics of the asset—demanding mid-cycle normalization for cyclicals, tracking absolute liquidity for turnarounds, and measuring runway duration for fast growers.
- The primary risk in growth investing is rarely the business itself; it is the price you pay for it. A phenomenal company can easily become a wealth-destroying asset if the entry multiple leaves no allowance for ordinary human forecasting error.
Ultimately, the real utility of the GARP framework comes down to a deep humility regarding our collective ability to predict the future. The word “reasonable” is essentially a mathematical confession that we cannot project cash flows perfectly out to infinity. By refusing to pay infinity for a story, by anchoring the entry price to a realistic baseline of sustainable growth, the framework ensures that the price leaves room for the growth forecast to be wrong. Capital is protected not by assuming forecasts are perfect, but by ensuring that the entry price is reasonable enough to allow the investment case to survive an imperfect future.
A reasonable price is not proof that the growth forecast is correct. It is a price that allows the forecast to be imperfect without destroying the investment.
What is the minimum capital required to execute Peter Lynch’s GARP strategy today?
There is no absolute floor. Thanks to zero-commission brokerages and fractional shares, a modern DIY investor can implement the structural filters of the framework with a portfolio of any size. However, the true constraint is analytical bandwidth. Lynch’s framework requires deep evaluation of individual balance sheets—cross-referencing inventory velocities, debt counts, and organic cash generation across multiple companies. If an investor lacks the time to manually audit these factors, running a fragmented individual portfolio can introduce unintended idiosyncratic risks.
Does an attractive PEG ratio automatically identify a bargain stock?
Absolutely not. A standard PEG ratio below 1.0 is a historical rule of thumb, not a universal law. The metric is a static compression tool that is entirely blind to data quality. A stock can exhibit a deceptively low PEG ratio near a cyclical peak when earnings are temporarily inflated, or because management has used cheap corporate debt to fund buybacks that cosmetically lift per-share growth. Without a qualitative and quantitative audit of the underlying cash flow, a simple PEG screen can pull you directly into a value trap.
How do I identify if a company’s headline EPS growth is artificially engineered?
Look directly at the total operating income and outstanding share count. If a company shows expanding Earnings Per Share alongside flat or declining aggregate operating net income, management is artificially shrinking the denominator. This configuration occurs when a company issues debt to buy back its own shares, creating an illusion of accelerating growth while actively adding structural leverage risk to the balance sheet. A real GARP audit swaps accounting net income for true organic Free Cash Flow growth.
Why does a “reasonable price” change depending on Lynch’s business categories?
Because identical growth rates carry different structural risks across distinct industries. A 15% growth rate inside a mature consumer staple company (a Stalwart) commands a premium for its defensive durability, but has a limited total expansion runway. The same 15% growth rate inside a capital-intensive steel or auto manufacturer (a Cyclical) is highly fragile, as trailing valuations look cheapest precisely when peak cyclical earnings are least sustainable. The multiple must always be calibrated to the specific category’s mid-cycle realities.
How does inventory velocity serve as a leading indicator of a growth slowdown?
When a company’s inventory expansion velocity significantly outpaces its top-line revenue growth, it indicates that the business is producing or purchasing goods faster than end-consumers can absorb them. This unsold inventory traps cash on warehouse shelves. To clear this buildup, management is eventually forced to execute aggressive price discounting, which compresses gross margins, damages brand equity, and triggers sharp downward earnings revisions months before the narrative changes.
Can a strict valuation discipline cause me to lose out on exceptional investments?
Yes. This is the primary operational friction of a rigid GARP approach. Lynch memorably compared the habit of cutting top-performing growth names simply because their multiples pushed past a mathematical threshold to “cutting the flowers and watering the weeds.” If an exceptional compounder possesses a generational reinvestment runway and superior unit economics, it can comfortably grow into an apparently expensive valuation over a multi-decade horizon, making a strict formula-driven exit highly punitive.
What alternative metric can modern investors use to replace the standard trailing PEG ratio?
The most robust adjustment is substituting accounting EPS with Free Cash Flow per share, paired with a forward mid-cycle growth assumption rather than a trailing extrapolation. This conversion isolates real cash generation, bypasses non-cash accounting adjustments, and accounts for structural capital expenditure drags, giving a much clearer representation of how much organic growth is actually being acquired per unit of valuation multiple paid.
This article is also available in Spanish. [Leé la versión en castellano: Peter Lynch y el crecimiento a un precio razonable: Cómo encontrar acciones ganadoras sin pagar de más]