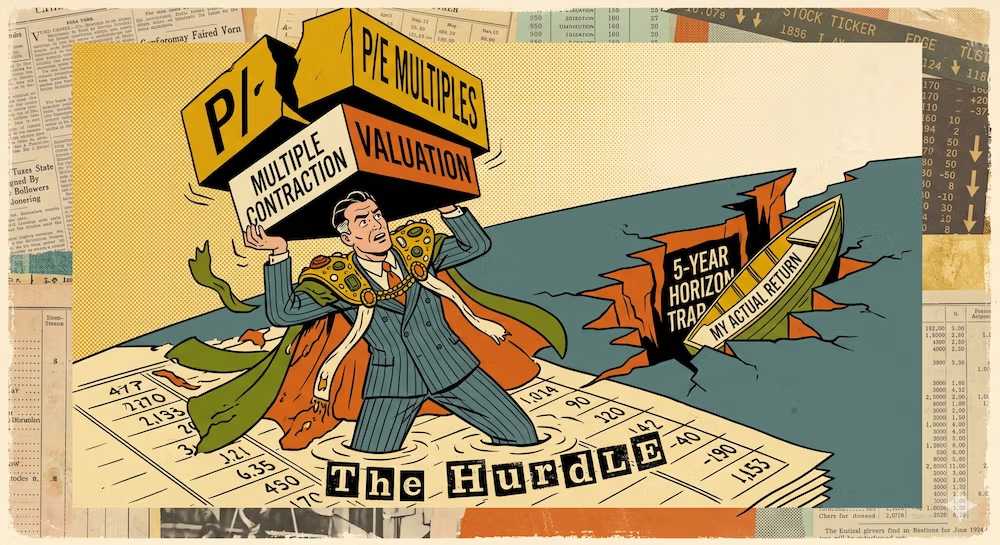
Every Sunday evening, I am treated to a specific, recurring comedy routine on my financial feeds. Dozens of highly paid macroeconomic strategists, institutional forecasters, and self-appointed market wizards drop their weekly manifestos. They project interest rate paths down to the basis point, declare the exact top of the technology cycle, and map out the next twelve months with the absolute confidence of a subatomic physicist tracking a particle in a lab.
I used to read these reports with a notebook in hand, genuinely believing that if I just consumed enough data, analyzed enough moving averages, or parsed enough central bank transcripts, I could build the perfect portfolio for the upcoming economic season.
It took me a few years of messy, real-world investing to realize that the financial forecasting industry isn’t selling accuracy; it’s selling comfort. The investment world spends billions of dollars trying to buy a working crystal ball because staring into the dark reality of an unknowable future is terrifying. We want to believe someone is in control. We want to believe the pilot knows exactly how to fly through a storm that hasn’t even formed yet.
When I first encountered Harry Browne’s investment philosophy—formalized cleanly in his 1999 book Fail-Safe Investing—I thought it was a paranoid, prepper-style survival manual. It looked too defensive, too primitive, and frankly, too lazy for anyone who wanted to actually maximize their compounding portfolio structure.
I was completely wrong.
Browne didn’t build his framework out of fear; he built it out of a brutal, unyielding asset that is completely missing from mainstream financial commentary: absolute structural humility. He didn’t assume he could predict the next macro regime, and more importantly, he assumed that I couldn’t either.
This article is not a generic biography of Harry Browne, nor is it a tactical manual on which ETFs to buy or how to optimize tax location inside a retirement account. I don’t care about account-location tricks today. Instead, we are looking at a fundamental operating-system comparison. We are going to examine the hidden, quiet assumptions under the hood of traditional 60/40 investing and pit them directly against Browne’s regime-agnostic simplicity. The point is not that Browne always wins. The point is that these two frameworks simplify completely different problems. One simplifies ownership and compounding; the other simplifies structural uncertainty.

The Forecasting Trap Behind “Balanced” Investing
If you ask the average passive indexer why they hold a traditional 60/40 portfolio—60% broad-market equities and 40% investment-grade bonds—they will tell you it’s the ultimate neutral posture. They believe they are opting out of the forecasting game entirely. “I just buy the whole market,” they say, “and let economic growth do the heavy lifting.”
I used to say the exact same thing. But when you step back and look at the actual mechanics of a 60/40 portfolio, you realize it isn’t neutral at all. It is a massive, implicit bet on a very specific macroeconomic environment.
To make a 60/40 portfolio work over a multi-decade window, you need a world where economic prosperity dominates the narrative, where inflation remains structurally contained, and where stocks and bonds maintain a helpful, negative correlation when things go sideways. In other words, you are betting that when growth breaks down, the central bank can smoothly drop interest rates to rescue the fixed-income sleeve.
That isn’t opting out of forecasting. It’s assuming that the specific macroeconomic paradigm of the last forty years is a permanent law of nature.
Traditional 60/40 investing looks incredibly simple on paper, but its simplicity is highly regime-dependent. It functions beautifully when the economic machine behaves according to standard post-1980 rules. But if you shift the macro timeline or introduce an environment where those foundational assumptions break down simultaneously, the elegant 60/40 structure can warp into a trap. It’s a two-engine airplane where both engines are fueled by the same macro climate. If that climate shifts violently, you discover that your balanced portfolio structure was carrying a single, massive exposure all along.

What 60/40 Is Really Betting On
To understand the core difference between these two operating systems, we have to drag the hidden assumptions of the traditional 60/40 model out into the light. Wall Street marketing brochures present the 60/40 split as a mathematical holy grail—maximum diversification with minimum effort. But let’s look at what each component is actually tasked to do, what it quietly assumes about the world, and exactly how it fails when those assumptions are violated.
The Hidden Assumptions of 60/40
| Component | What It Is Supposed To Do | Hidden Assumption | Failure Mode |
| 60% Stocks | Capture broad corporate earnings growth and drive long-term nominal capital expansion. | Prosperity and corporate productivity will dominate the macroeconomic narrative over time. | Extended equity bear markets, secular valuation compression, and structural stagflation. |
| 40% Bonds | Provide a regular income stream and act as defensive ballast to offset equity drawdowns. | Interest rates have room to fall when stocks crash, and yield will outpace purchasing power loss. | Structural inflation shocks, rapidly rising-rate regimes, and locking in negative real yields. |
| Stock/Bond Correlation | Smooth the overall portfolio ride by moving in opposite directions during market panics. | The historical negative correlation between equities and fixed income is a permanent structural law. | Inflationary supply shocks where stocks and bonds drop simultaneously, breaking the hedge. |
| Rebalancing | Automatically sell winners and buy laggards to maintain the core target risk profile. | Both asset sleeves will remain structurally viable and recover on independent cyclical timelines. | Secular regime shifts where one asset sleeve enters a multi-decade structural decline. |
When you analyze this breakdown, you see that the 60/40 portfolio relies heavily on the equity sleeve to do all the heavy lifting for return generation, while the bond sleeve is expected to sit quietly in the back seat until a growth shock occurs.
This works spectacularly well during a disinflationary boom—think of the 1980s and 1990s. During that era, corporate earnings exploded, pushing the 60% stock sleeve into the stratosphere. Simultaneously, interest rates began a long, multi-decade structural descent from their 1981 peaks. As interest rates fell, the 40% bond sleeve experienced a massive, secular bull market of its own. It was a beautiful regime where both asset classes took turns winning, and even when stocks stumbled, bonds immediately caught the fall because central banks had ample room to cut rates.
But what happens when you enter a regime where inflation spikes and interest rates are forced upward from a near-zero floor?
When inflation reels out of control, equities compress due to rising input costs and higher discount rates. Simultaneously, the bond sleeve suffers severe calendar-year routs because fixed income cannot tolerate a rapid rise in nominal yields. The negative correlation that 60/40 investors treated as a permanent law of physics vanishes. Both assets fall together, leaving few obvious places to hide. The simplicity of the 60/40 model is an undeniable advantage for ownership, but it leaves the capital base exposed to the structural stability of the macro regime itself.

Browne’s Simplicity Is a Different Kind of Simplicity
Harry Browne looked at this exact problem and came to a radically different conclusion. He didn’t try to build a better macroeconomic forecasting model to figure out when inflation or deflation would strike. His starting point was much harsher, and it’s a line I have to repeat to myself whenever I get tempted to tweak my own asset mix: I do not know which season comes next, and neither do you.
Browne’s Permanent Portfolio is also simple, but it is simple in a way that makes most modern investors incredibly uncomfortable. It completely discards tactical shifts, it completely throws out security selection, and it eliminates the urge to time the market. Instead of assuming one dominant economic state (prosperity) occasionally interrupted by temporary shocks, Browne split the macroeconomic map into four equal, permanent quadrants.
He assigned one explicit, unchanging job to four highly distinct asset classes. He didn’t want subtle nuances or complex derivative overlays. He wanted raw, unadulterated exposure to the distinct physics of each economic environment.
This architecture changes the entire operating system of the portfolio. In a standard 60/40 layout, you are constantly hoping that the future matches your asset mix. In Browne’s layout, you accept that the future will rotate through distinct phases, and you permanently keep a dedicated employee on the clock for each phase. It is a portfolio constructed around the absolute certainty of your own future ignorance. You don’t try to dodge the storm; you simply design the portfolio’s exposures before the storm arrives, with an identical sail configuration for winds blowing from any direction.

60/40 vs. Permanent Portfolio: The Regime Map
To see how this structural shift plays out across different historical sandboxes, let’s look at how the traditional 60/40 model stacks up against Browne’s 4×25% Permanent Portfolio when real-world economic regimes collide.
60/40 vs. Browne by Economic Regime
| Economic Regime | Traditional 60/40 Exposure | Browne Permanent Portfolio Exposure | What the Difference Reveals |
| Prosperity (Economic expansion, rising corporate earnings) | Strong. Leans heavily on 60% equity exposure to capture maximum upside. | Moderate. Holds 25% equities; the remaining 75% acts as a relative drag on performance. | Both models participate, but Browne deliberately dilutes the upside to protect against other seasons. |
| Deflation / Growth Shock (Falling prices, economic contraction) | Moderate. Relies on broad investment-grade bonds to cushion equity losses. | Strong. Combines 25% long-term Treasuries with 25% cash to create an explicit defensive wall. | Browne isolates deflation more aggressively by using high-duration long bonds as a volatility spring. |
| Inflation (Monetary devaluation, rising consumer prices) | Vulnerable. Both stocks and fixed income can face severe valuation compression. | Strong. Holds a dedicated 25% allocation to physical gold bullion as a non-linear monetary anchor. | Browne treats monetary debasement as an inevitable macro season requiring a dedicated asset sleeve. |
| Recession / Tight Money (Liquidity panics, credit contractions) | Dependent. Relies on the bond sleeve holding its ground or immediate central bank intervention. | Strong. Retains a permanent 25% cash/T-Bill bucket providing absolute liquidity optionality. | Browne treats cash as a highly functional strategic asset, not just dead cash drag or uninvested capital. |
| Stagflationary Recession (Simultaneous inflation spike and economic growth crash) | Highly Vulnerable. The classic stock/bond correlation breaks down; both engines stall together. | Cushioned. The gold and cash sleeves provide stability while equities and long bonds struggle. | Browne’s seasonal diversification is built for systemic failures where traditional hedges break. |
During a classic prosperity run, the traditional 60/40 portfolio is going to make an allocator look like a financial genius compared to a Browne investor. If the economy is growing smoothly and inflation is trapped at a quiet 2%, holding 25% cash and 25% gold feels like an act of financial self-sabotage. You will watch your neighbors build fortunes at an accelerating clip while your Permanent Portfolio drags along, weighed down by assets that the financial press routinely ridicules as dead money.
But look at the other side of the ledger. When a deflationary shock or a sudden liquidity panic hits the market, the traditional 60/40 portfolio is entirely dependent on the assumption that its aggregate investment-grade bonds will rise enough to offset an equity cliff. Browne, by contrast, doesn’t rely on aggregate bond averages. He deploys ultra-high-duration long-term Treasury bonds. Because these bonds are highly sensitive to interest rate drops, a 25% allocation can generate massive, explosive price moves during a flight-to-safety event, effectively neutralizing a collapse in the equity sleeve.
More importantly, the real divergence shows up when the macro environment enters the inflation or stagflation quadrants. This is the structural blind spot of the 60/40 portfolio. Traditional portfolios assume that inflation is a temporary anomaly that can be waited out. Browne treats inflation as a recurring macro season that can severely damage nominal paper assets. By forcing a permanent 25% allocation to physical gold bullion, the Permanent Portfolio introduces an asset that operates on completely different physics than corporate cash flows or debt yields. It doesn’t need a dividend; its entire value comes from its role as an institutional insurance policy against the devaluation of the paper currency itself.

Why 60/40 Can Be Better
Let’s drop any potential fanboy glaze right here. I am not pointing at Browne’s framework to declare it the undisputed winner of asset allocation. If you enter this conversation believing that one portfolio is universally superior to the other under all historical parameters, you are still trapped in a forecasting mindset. You are just trying to pick a winning horse instead of understanding the underlying track conditions.
The traditional 60/40 portfolio has an extraordinary track record for a very simple reason: human productivity compounds over time, and equities are the cleanest vehicle to capture that compounding.
If you look at multi-decade windows under common historical assumptions, the 60/40 portfolio will frequently deliver a higher absolute compound annual growth rate (CAGR) than the Permanent Portfolio. Proxy data and long-term backtests often suggest that from the early 1970s through 2025, a traditional 60/40 mix generated a CAGR in the neighborhood of 8.4% to 8.9%, while a Permanent Portfolio proxy delivered closer to 6.8% to 7.2%, depending on the exact asset metrics used in the simulation.
That performance gap is the real-world price of Browne’s robustness.
The 60/40 portfolio is structurally superior when:
- The global economy spends the majority of its time in the prosperity quadrant. If capitalism continues to expand, corporate earnings will drive the total return profile, and a higher equity weight (60% vs. 25%) will always win the long-term nominal race.
- Inflation remains structural, predictable, and mild. When price increases hover between 1.5% and 3%, companies can smoothly pass those costs down to consumers, preserving equity margins while bonds provide a stable nominal yield.
- The opportunity cost of cash and gold is too high. Holding a combined 50% of your total capital base in short-term paper and non-yielding metal means you are intentionally opting out of half the global compounding engine. Over a thirty-year wealth accumulation timeline, that drag can add up to hundreds of thousands of dollars in missed nominal growth.
If the primary financial problem is maximizing the absolute size of a capital pile at retirement, and the investor has the psychological fortitude to ride out multi-year asset corrections without panicking, the 60/40 model simplifies that journey brilliantly. It trusts the long-term trajectory of global growth and refuses to over-engineer the defensive side of the ledger.
Why Browne Can Be More Robust
So why would anyone willingly accept a lower historical CAGR and deliberately choke their upside with a massive pile of cash and gold?
Because backtests are a dangerous financial narcotic. A chart on a screen makes a twenty-year underperformance window or a deep nominal drawdown look like a tiny, harmless dip. In the real world, when it’s your life savings on the line, those dips feel like an endless descent into financial ruin.
Browne’s simplicity is more robust because it is designed for maximum behavioral compliance. It doesn’t care about your theoretical ability to handle risk; it cares about your actual, documented tendency to panic when your portfolio collapses. By expanding the seasonal coverage from two assets to four, the Permanent Portfolio drastically narrows the band of potential outcomes in any given calendar year.
Consider how the individual components interact when the market enters a liquidity panic. In a traditional 60/40 portfolio, the cash position is usually zero or a minimal fractional line item. If you suffer a sudden personal financial shock or a job loss during a major equity bear market, you are often forced to liquidate your stocks or intermediate bonds at the exact bottom of the cycle to fund your life.
Browne treats liquidity as an active, strategic asset. That 25% cash sleeve means an investor can survive prolonged economic freezes without ever touching the long-term compounding engines.
Simultaneously, the portfolio does not rely on the stock/bond correlation remaining stable. If inflation strikes and destroys both equities and fixed income, the explosive upward repricing of the 25% gold sleeve acts as a structural counterweight. The portfolio doesn’t need everything to work at once. It is designed around the assumption that at any given moment, something you own will be performing terribly, but something else you own will be performing spectacularly well. The goal is to survive the full macro cycle without a single catastrophic failure point.
The Behavioral Pain Map
To see the real-world friction of these two operating systems, we have to move past nominal returns and map out the exact psychological reality of holding them through market cycles. Backtests look easy because the lines are already drawn. Real investing is an emotional gauntlet.
The Behavioral Pain Map
| Investor Pain | Traditional 60/40 Pain | Browne Permanent Portfolio Pain | What the Investor Is Tempted To Do |
| Equity Crash (e.g., 2008 Financial Crisis) | Severe. The 60% equity weight dominates the total portfolio curve, causing a deep nominal drawdown. | Mild to Moderate. The 25% stock drop is structurally cushioned by long bonds and a massive cash cushion. | Abandon the strategy, sell everything at the bottom, and retreat to cash out of sheer panic. |
| Inflation Shock (e.g., 2022 Rate Spike) | High. Both stocks and intermediate bonds decline simultaneously, leaving few obvious places to hide. | Moderate. Long bonds hit badly, but the gold sleeve reprices upward to defend the nominal line. | Tinker with the portfolio, add speculative commodities, or short the bond market based on headlines. |
| Bull-Market Envy (Extended growth expansions) | Low to Non-Existent. The portfolio tracks the broader wealth-generation index closely enough to satisfy. | Brutal. Watching peers make massive nominal gains while your cash and gold sleeves drag down returns. | Capitulate at the exact peak of a bubble, delete the gold/cash sleeves, and go 100% into growth equities. |
| Rising Interest Rates (Secular transition to higher yields) | Moderate. Intermediate bonds experience a prolonged period of capital loss and negative real returns. | High on Long Bonds. The 25% long-bond sleeve suffers deep price drops due to high duration. | Swap out long-term obligations for corporate debt or short-term bills, breaking the deflation hedge. |
| Liquidity Panic (Systemic credit freezes, cash crunches) | Variable. Dependent on specific brokerage cash levels or forced liquidation of depressed assets. | Lower, by design. A permanent cash allocation provides absolute operational security. | Panic over daily liquidity needs and disrupt the long-term investment architecture. |
The pain of a 60/40 portfolio occurs when the market environment betrays its underlying assumptions—when stocks crash deeper than expected or when inflation wrecks the fixed-income hedge. It is an external pain driven by macro volatility.
The pain of the Permanent Portfolio, however, is almost entirely internal. It is driven by ego and comparison. When you hold Browne’s asset framework, your portfolio will rarely experience a terrifying, stomach-churning nominal drop. Under common historical simulations, the nominal drawdown profile often hovers around a manageable -12% to -14%, even in catastrophic years like 1981 or 2022.
But you will suffer the constant, grinding agony of bull-market envy. You will look at financial forums, listen to coworkers talk about their single-stock gains, and feel like an absolute idiot for holding a massive vault of non-yielding physical gold and short-term paper.
That is the hidden price of robustness. If an allocator does not have the emotional discipline to accept massive tracking error relative to their peer group, they will eventually capitulate. And the history of retail investing tells us exactly when that capitulation will happen: at the absolute peak of a multi-year equity bull market, right before the macro season shifts and burns the unhedged asset framework down to the ground.
Rebalancing: Discipline, Not Alpha Magic
In many corners of the financial internet, Browne’s framework is discussed as if it contains a magical alpha generation machine. Commentators point to his historical association with wide rebalancing bands—specifically the 15% minimum and 35% maximum corridor boundaries—and claim that this mechanical process systematically extracts an automated volatility premium from the market.
Let’s scale back that confidence completely. Under certain specific return paths—where assets experience wild, violent, mean-reverting swings without entering a permanent structural decline—wide rebalancing bands can indeed capture a modest rebalancing benefit. When gold went on its spectacular run into 1980, crossing the 35% threshold, the rule forced an investor to trim that local peak and reallocate the capital into deeply depressed equities and long bonds. It was a beautiful mechanical execution of buying low and selling high.
But rebalancing is not magic, and it does not guarantee structural alpha. If an asset class enters a multi-decade regime of secular stagnation or permanent capital destruction, systematic rebalancing will simply force you to repeatedly throw good money after bad.
The real value of Browne’s rebalancing bands is not mathematical wizardry; it is behavioral discipline.
The corridor rule functions as an automated circuit breaker for emotions. It completely removes the investor’s opinion from the asset allocation equation. When the market narrative is screaming that equities are a permanent bubble or that gold is dead forever, the framework handles the pressure. The historical rule forces the decision back onto the framework rather than the investor’s mood. You don’t get to forecast. You don’t get to wait until things settle down. The trade triggers because the numbers hit the boundary line. It re-centers the portfolio exposures before the storm arrives, converting volatility into an anchor for discipline rather than a trigger for panic.
What Actually Travels
Modern implementation of these concepts raises complex product selections, tax optimization strategies, and account-location questions that vary drastically depending on individual jurisdiction, net worth, and tax brackets. Those specific mechanics sit entirely outside the scope of this comparative analysis. The point here is the core architecture: what each model assumes, what each model protects against, and what each model asks the investor to endure.
Traditional 60/40 investing is not a dumb strategy. It is an elegant, historically validated framework that simplifies the problem of wealth ownership and capital compounding. It places a massive bet on human ingenuity and long-term corporate growth, and it accepts the risk that an unexpected inflationary regime shift can temporarily wreck the portfolio’s core defensive assumptions.
Harry Browne’s Permanent Portfolio is not a magic shield. It is a highly robust asset architecture designed to simplify the problem of absolute macroeconomic uncertainty. It operates from the premise that the future is structurally unknowable, that forecasting is an expensive illusion, and that a portfolio must preserve capital across all four economic seasons without needing a single correct predictive insight.
Simplicity is a powerful tool in portfolio construction, but it is robust only when you understand exactly what it is trying to simplify. For investors seeking a simple way to participate in the long-term growth of the global economy and can tolerate standard regime exposure, the 60/40 portfolio provides a clean, time-tested framework. But for those looking for a simple way to insulate their capital from their own inability to predict the next economic cycle, Browne’s seasonal architecture offers an entirely different level of structural defense.
The argument is not that one model is morally or mathematically superior to the other. The argument is that they are simple in completely different ways, and the lived success of either framework depends entirely on which kind of simplicity your psychology can actually hold onto when the environment changes.
What is the core structural difference between Harry Browne’s strategy and a traditional 60/40 portfolio?
It comes down to regime coverage. The traditional 60/40 layout relies on a two-engine system (stocks and intermediate bonds) that assumes a dominant environment of economic growth paired with low-to-moderate inflation. Harry Browne’s framework completely rejects the idea of economic stability and divides capital into four equal 25% asset pillars, dedicating explicit, standalone slots to prosperity, inflation, deflation, and recession. While the 60/40 layout simplifies ownership, Browne’s layout simplifies structural uncertainty.
Does the Permanent Portfolio require a specific minimum portfolio size to implement effectively?
Lower, by design. Because this architecture relies exclusively on broad, highly liquid, macro asset classes rather than complex private deal terms or corporate hedge structures, it requires very little minimum capital. A retail investor can replicate the exact structural exposure within a standard digital brokerage account using a clean four-asset layout. The main hurdle for smaller portfolios is ensuring transaction costs do not trigger a performance drag when adjusting allocations.
What specific modern asset types are used to track Harry Browne’s historical 4×25% framework?
The historical framework utilizes four plain-vanilla building blocks. The prosperity quadrant uses a broad-market domestic equity index. The deflation quadrant requires high-duration long-term Government bonds with maturities exceeding twenty years to exploit maximum interest-rate sensitivity. The inflation quadrant relies strictly on physically backed spot gold bullion to function as a currency anchor. The recession quadrant demands short-term Treasury Bills or cash equivalents to anchor absolute operational liquidity.
How often does a rule-based portfolio like Harry Browne’s require rebalancing?
It depends entirely on market movements, not a calendar. Rather than rebalancing on a fixed annual date, Browne’s historical discipline uses wide corridor boundaries, typically set at a 15% minimum and 35% maximum allocation band. The historical rule forces the decision back onto the framework rather than the investor’s mood. If an asset class undergoes a massive run and breaches the 35% ceiling, or plummets below the 15% floor, it immediately triggers an execution order to trade back to the original 25% target weightings.
Can I swap the long-term bond sleeve for corporate bonds to boost the overall yield?
No. Doing this breaks the underlying safety mechanics of the system. Corporate obligations inject hidden credit risk that tends to correlate tightly with the equity market during a systemic financial crisis. When a deep deflationary shock or equity crash occurs, corporate bonds will fail to deliver the explosive, duration-driven capital gains that high-quality long-term government bonds produce. To maintain the robustness of the framework, the defensive sleeves must remain pure and uncoupled from corporate balance sheets.
Why do critics argue that holding 25% cash creates too much portfolio drag?
They are looking at nominal compounding tables while ignoring behavioral compliance. Critics evaluate cash solely as a non-yielding drag on capital during a secular bull market. In Browne’s design, cash functions as a tactical optionality hub and an iron shield against liquidity freezes. It ensures the investor never becomes a forced seller of depressed equities or bonds to fund short-term cash needs during a panic, preserving the long-term structural integrity of the macro framework.
Is gold an absolute guarantee against rising consumer price inflation (CPI) cycles?
Not exactly. Gold does not track monthly consumer index prints in a clean, linear fashion. Historically, gold behaves as a non-linear currency hedge that reacts violently to deeply negative real interest rates and a broader loss of institutional confidence in sovereign fiat currencies. During quiet, mild inflation regimes, gold can trade sideways for years, acting as a massive drag on performance. It earns its space as a specialized shock insurance policy for severe stagflationary crises, not as a day-to-day hedge.